Embed Size (px)
Citation preview

1
Optimizing Efficiency and Operations at a California Safety-Net Endoscopy Center:
A Modeling and Simulation Approach
Lukejohn W. Day MD1,2*
, David Belson PhD3, Maged Dessouky PhD
3, Caitlin Hawkins
3,
Michael Hogan3
1 Division of Gastroenterology, San Francisco General Hospital and Trauma Center, San
Francisco, California, USA. Email: [email protected]. 2 GI Health Outcomes, Policy and Economics (HOPE) Research Program and Center for
Innovation in Access and Quality (CIAQ), Department of Medicine, University of California,
San Francisco, California, USA. 3 Daniel J. Epstein Department of Industrial and Systems Engineering, University of Southern
California, Los Angeles, California, USA
Lukejohn Day (study concept and design; acquisition of data; analysis and interpretation of data;
drafting of the manuscript; critical revision of the manuscript for important intellectual content;
obtained funding; technical, or material support; study supervision)
David Belson (study concept and design; acquisition of data; analysis and interpretation of data;
critical revision of the manuscript for important intellectual content; statistical analysis; study
supervision)
Maged Dessouky (analysis and interpretation of data; critical revision of the manuscript for
important intellectual content; statistical analysis)
Caitlin Hawkins (analysis and interpretation of data; critical revision of the manuscript for
important intellectual content; statistical analysis)
Michael Hogan (analysis and interpretation of data; critical revision of the manuscript for
important intellectual content; statistical analysis)
Correspondence*:
Lukejohn W. Day, MD
San Francisco General Hospital and Trauma Center
1001 Potrero Avenue, 3D-5
San Francisco, California, 94110, USA
Email: [email protected]
Phone: (415) 206-3832; Fax: (415) 206-5199
Funding: San Francisco Hearts Grant Foundation
Conflicts of Interest: None
Keywords: time and motion study; simulation modeling; discrete event simulation; quality;
endoscopy; efficiency
2
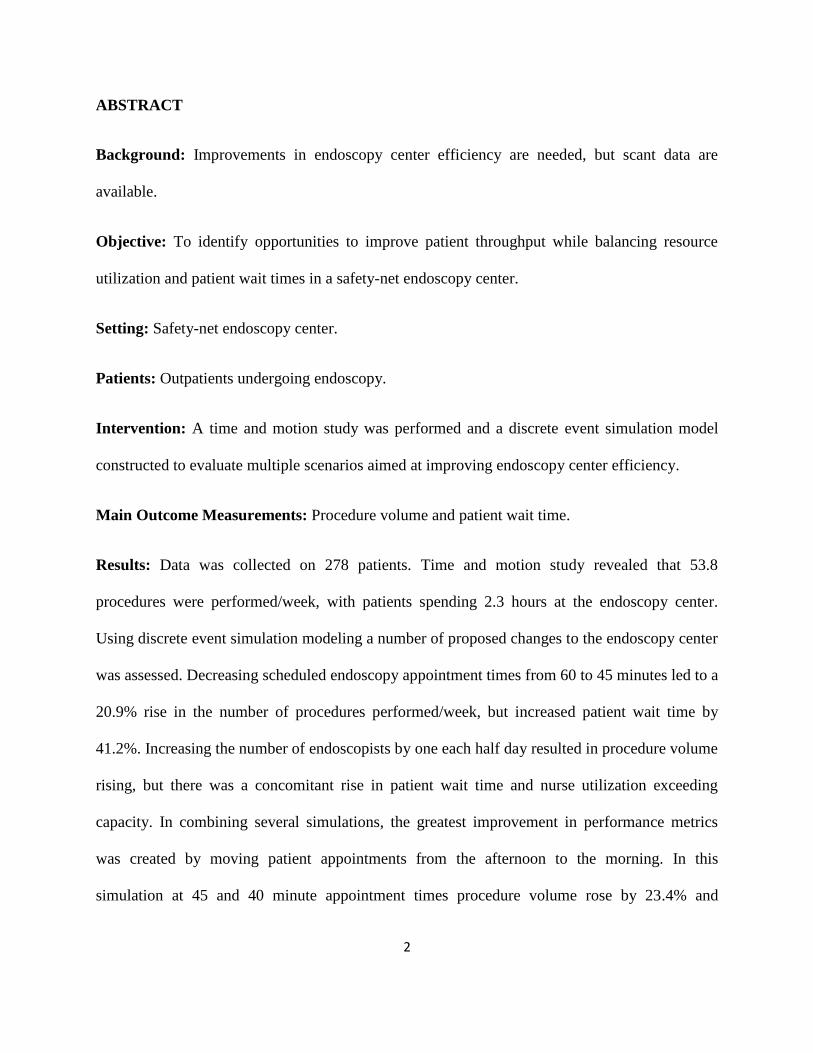
ABSTRACT
Background: Improvements in endoscopy center efficiency are needed, but scant data are
available.
Objective: To identify opportunities to improve patient throughput while balancing resource
utilization and patient wait times in a safety-net endoscopy center.
Setting: Safety-net endoscopy center.
Patients: Outpatients undergoing endoscopy.
Intervention: A time and motion study was performed and a discrete event simulation model
constructed to evaluate multiple scenarios aimed at improving endoscopy center efficiency.
Main Outcome Measurements: Procedure volume and patient wait time.
Results: Data was collected on 278 patients. Time and motion study revealed that 53.8
procedures were performed/week, with patients spending 2.3 hours at the endoscopy center.
Using discrete event simulation modeling a number of proposed changes to the endoscopy center
was assessed. Decreasing scheduled endoscopy appointment times from 60 to 45 minutes led to a
20.9% rise in the number of procedures performed/week, but increased patient wait time by
41.2%. Increasing the number of endoscopists by one each half day resulted in procedure volume
rising, but there was a concomitant rise in patient wait time and nurse utilization exceeding
capacity. In combining several simulations, the greatest improvement in performance metrics
was created by moving patient appointments from the afternoon to the morning. In this
simulation at 45 and 40 minute appointment times procedure volume rose by 23.4% and

3
34.2%and patient time spent in the endoscopy center declined by 17.4% and 13.0% respectively.
The predictions of the simulation model were found to be accurate when compared with actual
changes implemented in the endoscopy center.
Limitations: May not be generalizable to non-safety-net endoscopy centers.
Conclusions: The combination of minor, cost-effective changes such as reducing appointment
times, minimizing and standardizing recovery time, and making small increases in pre-procedure
ancillary staff maximized endoscopy center efficiency across a number of performance metrics.
4
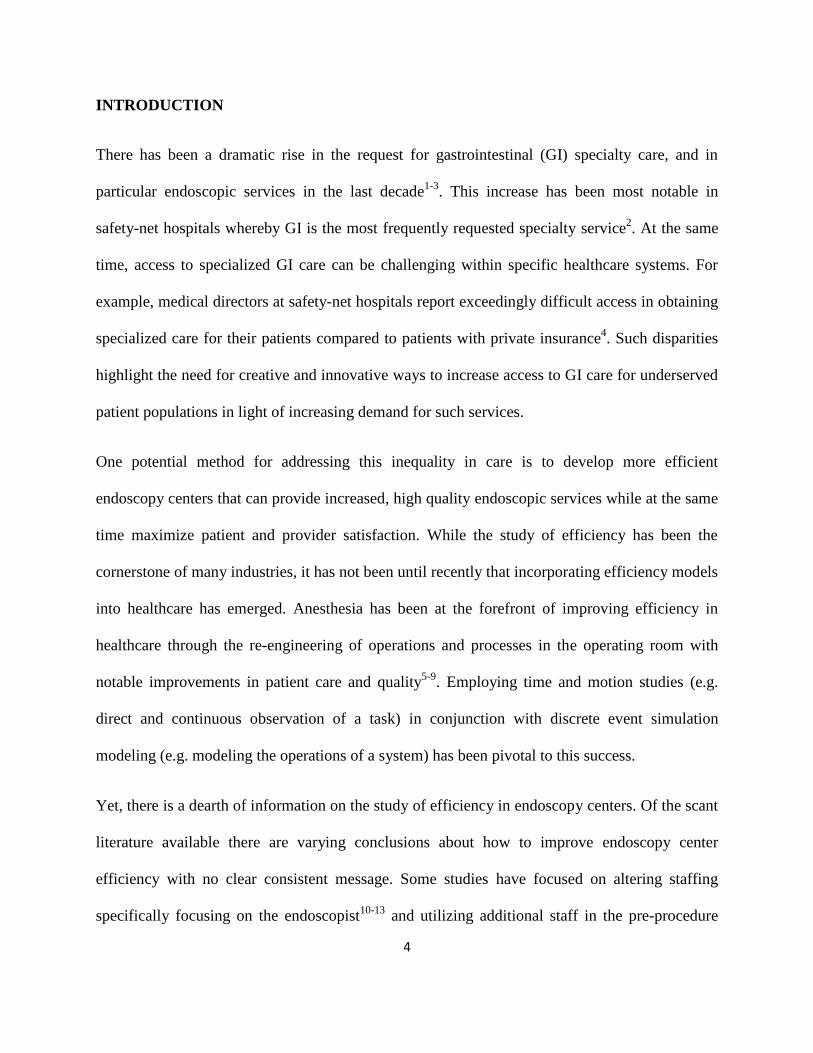
INTRODUCTION
There has been a dramatic rise in the request for gastrointestinal (GI) specialty care, and in
particular endoscopic services in the last decade1-3
. This increase has been most notable in
safety-net hospitals whereby GI is the most frequently requested specialty service2. At the same
time, access to specialized GI care can be challenging within specific healthcare systems. For
example, medical directors at safety-net hospitals report exceedingly difficult access in obtaining
specialized care for their patients compared to patients with private insurance4. Such disparities
highlight the need for creative and innovative ways to increase access to GI care for underserved
patient populations in light of increasing demand for such services.
One potential method for addressing this inequality in care is to develop more efficient
endoscopy centers that can provide increased, high quality endoscopic services while at the same
time maximize patient and provider satisfaction. While the study of efficiency has been the
cornerstone of many industries, it has not been until recently that incorporating efficiency models
into healthcare has emerged. Anesthesia has been at the forefront of improving efficiency in
healthcare through the re-engineering of operations and processes in the operating room with
notable improvements in patient care and quality5-9
. Employing time and motion studies (e.g.
direct and continuous observation of a task) in conjunction with discrete event simulation
modeling (e.g. modeling the operations of a system) has been pivotal to this success.
Yet, there is a dearth of information on the study of efficiency in endoscopy centers. Of the scant
literature available there are varying conclusions about how to improve endoscopy center
efficiency with no clear consistent message. Some studies have focused on altering staffing
specifically focusing on the endoscopist10-13
and utilizing additional staff in the pre-procedure
5
process13
. While such changes improve physician efficiency and utilization, it does so at a cost of
impairing non-physician staff utilization, sub-optimizing facility utilization and increasing
patient length of stay12
. Using simulation modeling others have discovered that identifying
bottlenecks such as patient recovery14,15
, reducing room turnover time10,14
, modifying patient
arrival schedule11,16
or reengineering patient scheduling16,17
can improve efficiency and decrease
patient stay. However, there are a number of limitations to many of these studies; they are small,
examine efficiency solely from a physician perspective with minimal to no input from other staff
members, examine a limited number of time stamps within the endoscopy center, and all are set
in an ambulatory endoscopy center or tertiary referral service. Given these deficiencies and with
changes to the healthcare system occurring in the U.S., with more underserved patients being
served, it is imperative to better understand endoscopy centers in such settings and to learn how
to improve efficiency within them.
Our first objective was to conduct a time and motion study of clinic staff at work and to use this
data in simulation modeling to study changes in scheduling, staffing models, and changes in the
pre- and post-procedure process. Our secondary objective was to build a simulation model to
understand the bottlenecks limiting the endoscopy center’s current operational performance and,
in turn, to identify opportunities to improve patient throughput while balancing resource
utilization and patient wait times.
METHODS
Study Design, Setting and Population
6
There were three phases of the study. Engineers first conducted a time and motion study of the
San Francisco General Hospital and Trauma Center (SFGH) endoscopy center in order to better
understand the operations and processes of a safety-net endoscopy center. Second, using
information from this study, we then created a discrete event simulation model to assess
proposed changes to the endoscopy center in order to improve efficiency within it. The final
phase of the study involved implementing some of the proposed changes at the SFGH endoscopy
center and examining the impact of these changes on a number of performance metrics. The
study was conducted between November 2011 and December 2013.
SFGH is a safety-net institution (i.e. provides a significant level of care to low income,
uninsured, and vulnerable populations) affiliated with the University of California, San
Francisco. Patients are ethnically diverse (20% African American, 20% Asian/Pacific Islander,
25% Caucasian, and 30% Hispanic), and many are immigrants with more than 20 different
languages spoken by patients. Approximately 36% of outpatients at SFGH lack insurance, 34%
have MediCal (California’s Medicaid program), 16% have Medicare, and 14% report
commercial payers or other sources. The SFGH Gastroenterology Division receives 7,200
referrals annually for a wide spectrum of gastrointestinal related conditions.
The SFGH endoscopy center is a hospital based center and performs both outpatient (82.1%) and
inpatient (17.9%) endoscopic procedures. The endoscopy center performs standard endoscopic
procedures (colonoscopy, upper endoscopy, flexible sigmoidoscopy), advanced procedures
(endoscopic retrograde-cholangiopancreatography, endoscopic ultrasound, single balloon
enteroscopy), capsule endoscopy, and esophageal and anal motility and manometry. The

7
majority of the endoscopy center’s time is devoted to performing colonoscopy and upper
endoscopies (EGD) (89.0% of procedure volume) with a no show rate of 17.7%. The annual
volume of endoscopic procedures is 3,700.
Time and Motion Study
During the first phase of the study, multiple days of direct time observations and interviews were
conducted to identify patient flow, key parameters and process attributes of the endoscopy
center. Time was spent shadowing physicians, nurses, and support staff in order to develop an
understanding of the endoscopy center’s workflow.
Endoscopy center workflow
The endoscopy center has four distinct workflow processes: check-in, pre-procedure, procedure
and recovery (Figure 1) with the relative number of patients traveling on each path shown as the
thickness of the connecting arrows. A patient’s visit begins at check-in after which patients move
to a waiting room, where they remain until called to the pre-procedure room. . In situations
where a procedure room is available and no prepared patients are waiting to begin a procedure,
pre-procedure activities are conducted in the procedure room bypassing the pre-procedure room.
From the pre-procedure process, a patient then moves to a procedure room. Here process time
varies with the complexity of the patient’s procedure, for example procedures involving therapy
require additional time. At the conclusion of the procedure, patients either recover in the
recovery room, or if a recovery bed is unavailable then patients are kept in the procedure room.
Once in the recovery room, patients remain for at least 30 minutes as required by state and

8
institutional regulations. Patients are held in the recovery room until a ride home arrives to sign
them out.
Layout and staffing of the endoscopy center
The following is a detailed account of the physical layout and staffing of the SFGH endoscopy
center. There is one patient waiting area with 22 chairs available, one pre-procedure room with 3
beds where patients are prepared for their procedure (i.e. placement of intravenous catheter, pre-
procedure paperwork completed), four procedure rooms, and one recovery room with 3 beds
where sedated patients recover after their procedure is completed. The pre-procedure and
recovery rooms are separate, but adjacent, and only one process is performed in each room (i.e.
recovery process is only performed in the recovery room). The ratio of pre-procedure beds:
procedure rooms and recovery beds: procedure rooms are 1:0.75. Across from the four procedure
rooms are one disinfection room, one endoscope reprocessing room with three automated
endoscope reprocessing machines that can reprocess two endoscopes per 45 minute cycle per
machine, and one endoscope storage room (10 adult colonoscopes, 3 pediatric colonoscopes, 6
adult upper endoscopes, 1 pediatric upper endoscope, 3 duodenoscopes, 1 small intestinal
videoscope, 1 radial electronic scope). With regards to staffing there are 1.5 full time equivalent
(FTE) clerks at the patient check-in area, 5.5 nursing FTEs (1.0 FTE per procedure room, 1.0
FTE for the recovery room, 0.5 FTE for the pre-procedure room), 1.0 FTE licensed vocational
nurse for the pre-procedure room, and 1.0 FTE endoscope reprocessor. There are 4.1 FTEs of
clinical gastroenterologists at the endoscopy center. SFGH is a teaching hospital for the
University of California, San Francisco’s medical school and three GI fellows and one surgical
resident rotate through the GI Division each month. Each procedure requires a staff of three - an

9
attending physician, nurse and a fellow/resident or one attending and two nurses. The hospital
also uses nurse practitioners in lieu of a physician for some GI procedures, but without trainee
involvement; there are 2 nurse practitioners who perform standard endoscopic procedures at
SFGH (one of whom was in training during the initial study period).
For the vast majority of procedures performed in the endoscopy center, moderate sedation is
used with a combination of a benzodiazepine (Midazolam®) and an opioid (Fentanyl® or
Meperdine®) with Benadryl® given in some cases as an adjunctive medication. For
colonoscopies performed during the study time period, the mean amount of Fentanyl
administered was 79.9 mg, Demerol was 67.8 mg, Midazolam was 3.2 mg, and Benadryl was
43.9 mg. For upper endoscopies the mean amount of Fentanyl administered was 80.8 mg,
Demerol was 79.7 mg, Midazolam was 3.3 mg, and Benadryl was 46.1 mg.
Hours of operation and scheduling of procedures in the endoscopy center
The hours of operation for the endoscopy center vary due to limited space and availability of
providers. The hours of operation are as follows: Monday (8AM-12PM), Tuesday (8AM-4PM),
Wednesday (no procedures), Thursday (8AM-12PM) and Friday (8AM-4PM); there are no
weekend procedures performed except in cases of emergencies. The first case of the day is
scheduled at 8AM with the last case being scheduled at 3PM. Upper endoscopy, colonoscopy or
both procedures together are scheduled in 60 minute appointment slots. The front desk staff
works in 8 hour staggered shifts (7AM-4PM and 8AM-5PM) five days a week. Nurses work in
staggered 8 hour shifts (7AM-4PM and 8AM-5PM) five days a week. The endoscopy center is at

10
full workforce strength during these times of operation, but does vary based on the number of
attending physicians/nurse practitioners available per endoscopy session. Given that attending
physicians and nurse practitioners perform other duties, such as GI clinic and consultative
service, their availability for performing endoscopy is limited. For example, staffing for each day
with regards to attending/nurse practitioner availability is as follows: Monday (1 attending),
Tuesday (2 attendings, 1 nurse practitioner), Thursday (2 attendings, 1 nurse practitioner), and
Friday (2 attendings, 1 nurse practitioner).
Data collection
There have been a number of attempts to develop consistent operational measures for endoscopy
centers with regards to efficiency; however there are no reliable and reproducible endoscopy
center efficiency metrics. Recently, a conceptual framework that outlines endoscopy center
efficiency was proposed and is divided into three domains: structure, process, and outcomes18
.
This framework was used to determine what inputs needed to be collected (using time and
motion study) and what to study for efficiency outcome measures (using discrete event
simulation modeling) during the study.
For the time and motion study we determined a priori to examine all of the endoscopy center
structure domains (number of procedure rooms, number of pre-procedure and recovery rooms,
number of procedure nurses, number of endoscopists, number of endoscopes, sedation type and
unit layout) as well as the majority of the process domains (pre-procedure time, recovery time,
procedure time, sedation time, room turnover time, first case start time)18
. Observation and
timing of the processes was done to provide a statistically significant picture of operations.
Direct observation and use of the SFGH endoscopy center’s electronic record keeping system
11
provided 278 patient arrival times, 257 procedure times and 257 recovery times. Arrival times
were collected from the appointment scheduling system. Procedure time (time of endoscope
insertion to removal), sedation time (time of first dose of sedation administered to when the
procedure was started), and room turnover time (time when a patient leaves the procedure room
to the time when the procedure room is ready for the next patient) was collected from
documentation in procedure and nursing notes. The pre-procedure time (time from when a
patient was taken from the waiting room to the time the procedure began) was quantified using a
standardized form that nurses completed on every patient. Recovery time (time when the patient
arrived in the recovery room to the time when the patient was discharged) was collected from
time stamps present on discharge paperwork completed when patients departed.
Discrete Event Simulation Modeling
In the second phase of the study, Microsoft Visio was used to create a descriptive process model
of outpatient procedure visits (Figure 2). The discrete event simulation model was built using
the Process Simulator (Process Simulator is a Microsoft Visio add-on software from ProModel
Corporation, 556 East Technology Ave., Orem, UT) software beginning with the process flow
diagram shown in Figure 2. Process Simulator is used to create a simulation within the process
flow diagram drawn in Microsoft Visio. Simulation properties, such as process time
distributions and volumes, are added to the diagram so that various scenarios can be run. The
objective of model development was to understand bottlenecks in the current operations of the
endoscopy center and in turn to measure the impact of operational changes to improve
throughput while balancing resource utilization and patient wait times. The key performance
objective was to determine the staffing levels and operating policies needed to maximize patient
12
throughput by ensuring high utilization of the procedure rooms such that they were not idle
either due to starvation or blockage.
Validation and verification of the model
Validation was performed in order to ensure the simulation was accurate and included the
following steps:
Baseline simulation results such as patient visit time, room utilization and equipment use
were verified as correct by expert opinion. Such verification occurred over the course of
several meetings with endoscopists, nurses, and front desk staff and unanimous
consensus was reached on the final baseline simulation among this group.
The workflow diagram’s logic used to build the model was verified by the providers and
nursing staff.
An assumptions document was reviewed by the providers during regular meetings to
discuss updates to the model.
The outcome results were verified as logical with those experienced within the actual
system.
A more extensive analysis was conducted to ensure that the system was operating
properly on Tuesdays, the most heavily scheduled day each week.
Simulation animation was observed by providers, nurses and front desk staff to check that
the patients were following the proper flow of events and feasible queuing at various
points.
13
All the parameters and distributions were based on historical data and Minitab was used to
develop statistical distributions that matched historical data with a high degree of confidence.
Scenario development
After validation of the base case model was completed, several scenarios were evaluated using
the discrete event simulation model. Scenarios for the model were developed based on three key
sources: 1) input and observations from staff members of the GI endoscopy center (endoscopists,
nurses, front desk staff, endoscope reprocessors), 2) observations from the USC industrial
engineering team who conducted the time and motion study and built the discrete event
simulation model, and 3) changes to endoscopy center structure/processes that in the literature
have been shown to improve efficiency11-16
. Only modifiable factors (such as scheduling and
staff) were considered given that facility factors (number of rooms) were fixed. The primary
scenarios included altering the endoscopy appointment schedule from 60 minutes to 45-minute,
40-minute, 35-minute and 30-minute appointment slots and assessing outcomes. For the shorter
appointment slot schedules, limited resources were added to avoid extremely high levels of
queuing. Secondary scenarios examined included changes to room availability through the
adding of additional staff (i.e. endoscopists and nurses).
Outcome statistics
Performance outcomes were calculated by running the various scenarios in the discrete event
simulation model and were selected from the outcome domain (i.e. the desired results of the
system) proposed in Gellad’s framework for endoscopy center efficiency18
. These outcomes
included procedure volume (throughput), patient waiting time, patient time spent in the

14
endoscopy center (i.e. flow time), and resource utilization (provider, nurse and procedure room).
Utilization was computed as the hours a resource was in use divided by the available hours for
the resource. We did not include overtime or cost in our model. Overtime is rarely utilized in our
center and given that we are a non-profit institution we opted not to include cost.
Real-Time Validation of the Endoscopy Center Simulation Model
In the final phase of the study, three of the proposed scenarios examined in the model were then
selected and implemented at the SFGH endoscopy center in order to validate the model. Each
scenario was implemented in two month block timeframes. However, due to the scarcity of
resources not all of the potential changes in the three scenarios could be fully implemented and
were slightly modified. The first scenario implemented was the reduction of endoscopy
appointment times to 45 minutes, adding an additional 0.5 nursing to the pre-procedure process
and extending the endoscope reprocessors hours to 4:30PM. In implementing the second
scenario the endoscopy centers weekly schedule was modified by adding endoscopy
appointments to Wednesday morning; however only one endoscopist could perform procedures
on this day and thus a full day’s schedule was not utilized (as proposed in the scenario used in
the model). The last scenario implemented involved adding an additional endoscopist to each
half-day endoscopy session. In this instance the schedule of the second nurse practitioner was
expanded or an additional provider was added to the endoscopy schedule for Monday, Tuesday,
Thursday and Friday; however the provider schedule was still not maximized on Monday or
Wednesday as proposed in the original scenario. Outcomes from the simulation model were then
compared with the outcomes from the actual changes implemented in the endoscopy center. The
15
implementation of these three scenarios occurred at the SFGH endoscopy center from June 2013
through December 2013.
Ethical Considerations
This study was part of an ongoing quality improvement project aimed at evaluating the
performance of the SFGH endoscopy center with respect to a patient’s experience. Given our
study was related to quality improvement, and no personal health information was collected at
any time, formal institutional review was not required per the policy of the University of
California San Francisco Committee on Human Research.
RESULTS
Baseline Endoscopy Center Data
Utilizing data from the time and motion study, baseline endoscopy center statistics were
determined for patient arrival patterns as well as a number of structural domains (wait time in
waiting room, pre-procedure, procedure and recovery room times, sedation time, room turnover
time, percentage of on-time starts for procedures) (Table 1). There was a significant trend of
patients arriving earlier than their assigned appointment times; patients with afternoon
appointments (after 1PM) arrived 179.4 minutes earlier for their appointment compared to
patients at 8AM who arrived 28.5 minutes earlier. Little variation was noted in the pre-procedure
time regardless of the planned procedure, although EGD/colonoscopy procedures required more
time (31.2 minutes). Little variation was noted with recovery room time and required 34.6
minutes if recovery occurred in the recovery room. Procedure time itself differed significantly
16
depending on the type of procedure. The mean number of procedures performed per week was
53.8 (51.0-56.6) with patients spending 2.3 (2.2-2.5) hours at the endoscopy center with 22.3%
of that time spent waiting.
In order to determine the optimal scenario(s) that would increase throughput, optimize utilization
and minimize patient wait time a series of simulation models were run (Table 2). Scenarios
included 1) revising endoscopy appointment times and overall endoscopy schedule, 2) increasing
the number of nurses or providers, 3) minimizing recovering time and 4) a combination of these
scenarios.
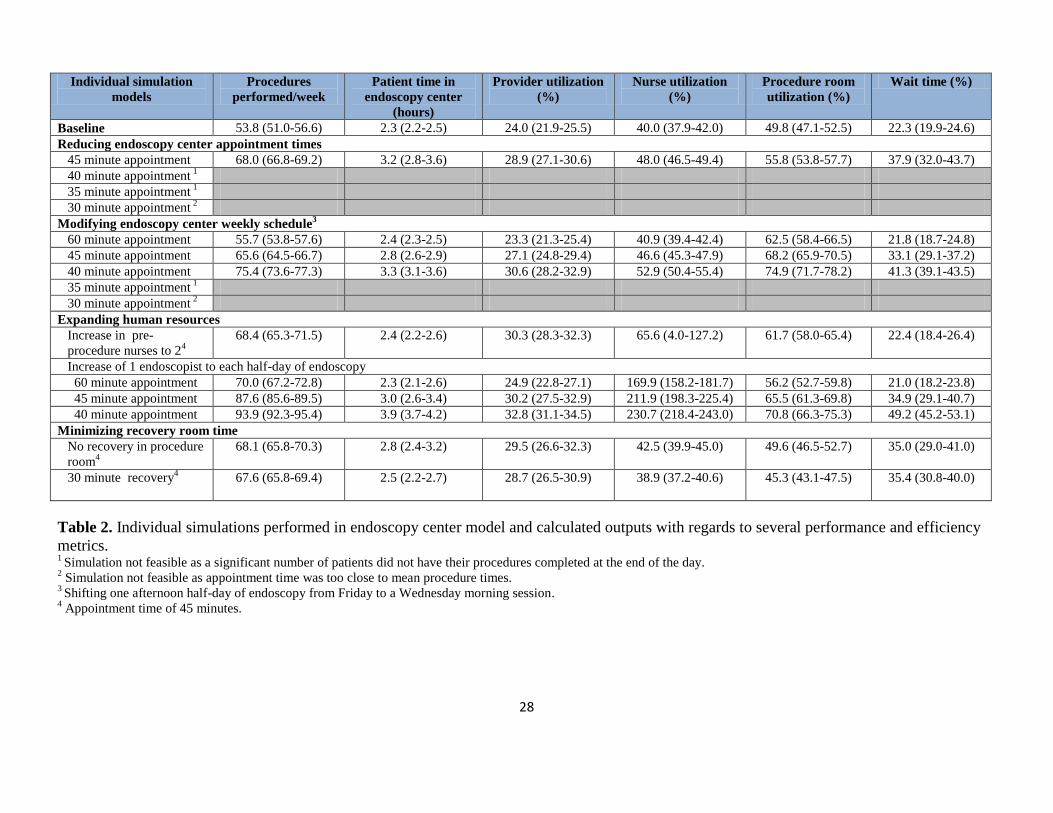
Revision of Endoscopy Schedule
The first scenario examined a revised endoscopy schedule using shorter appointment times.
When appointment time was decreased to 45 minutes (from a baseline of 60 minutes) there was a
20.9% rise in the number of procedures performed/week with both patient time in the endoscopy
center increasing to 3.2 hours and percentage of time waiting rising to 37.9%. Additionally, there
was a rise in overall utilization with the greatest rise noted in procedure room utilization. At
shorter appointment times of 40 and 35 minutes the model was not sustainable without additional
resources to serve patients; at these times there was queuing of patients in the pre-procedure area
as the day progressed to the point where a significant number of patients would not have had
their procedures performed by the end of the day. If the appointment was decreased further to 30
minutes the simulation was not feasible since the appointment time was nearly identical to the
procedure times and a queue built up infinitely.

17
An additional change included revising the overall weekly endoscopy schedule. Given that
patients had a preference for earlier appointments and the endoscopy center was closed on
Wednesdays - a half day of endoscopy appointments was moved from Friday afternoon to
Wednesday morning in a simulation. In this simulation, there was no significant change
(compared to baseline) other than procedure volume slightly increased to 55.7 procedures/week
and procedure room utilization rose. Moreover, we found that when appointment times were
shortened under this scenario to 45 and 40 minute intervals there was a steady rise in procedures
performed/week (with nearly an increase of a third of procedures performed) as well as improved
procedure room and nursing utilization. However, these changes did so at a cost of increasing the
number of hours a patient spent in the endoscopy center and increased patient wait time by
32.6% and 46.0% respectively when compared to baseline.
Human Resources Expansion
The next area explored was to improve endoscopy center operational efficiency by expanding
human resources. Patients spent a great deal of time in the pre-procedure area waiting for their
procedure. Thus the number of staff dedicated to the pre-procedure area was modeled to
determine if changes improved efficiency. Initially, the addition of 0.5 nurses to the pre-
procedure area in the baseline model resulted in no significant differences with respect to
outcomes. Yet, by increasing the number of pre-procedure nurses from 1.5 to 2 with an
appointment time of 45 minutes there was a 21.3% increase in the number of procedures
performed per week and a steady rises in provider (20.8%), and procedure room (19.3%)
utilization with minimal impact on patient wait time. There was no significant change in
outcomes with the addition of more nurses compared to 2 nurses in the pre-procedure area.
18
The number of providers that performed endoscopic procedures during the week was also varied;
one additional endoscopist was added to each half-day of endoscopy. With appointment time
held constant, procedure volume increased by 23.1% but it did so at a cost of increasing nursing
utilization over 100%. The results were similar if appointment times were lowered further with
procedure volume dramatically rising, but at the same time there was a concomitant rise in
patient wait time and nursing utilization exceeding capacity.
Minimizing Recovery Room Time
The next simulation examined minimizing patient time in the recovery room. Two simulations
were tested: 1) limiting recovery room time to 30 minutes (minimum required by state and
institutional regulations) and 2) not allowing patients to recover in a procedure room. In either
simulation at 60 minute appointments there were no significant differences with respect to
outcomes when compared to baseline data. But when limiting recovery room time and changing
appointment time to 45 minutes, procedure volume increased to 67.6 procedures/week with a
slight increase in provider utilization, but there was also an increase in patient wait time. Similar
results were observed in the model when patients were only allowed to recover in the recovery
room.
Expansion of Endoscopy Center Simulation Models
Using the data gathered and information learned from each individual simulation, a number of
simulations were expanded (Table 3 and Figure 3). Individual simulations that were expanded
included: 1) Reducing endoscopy center appointment times, 2) modifying endoscopy center
19
weekly schedule and 3) expanding human resources (adding more endoscopists). Additional
resources were built into each of these expanded simulations and included increasing the number
of pre-procedure nurses, minimizing recovery room time and expanding the hours of the
endoscope reprocessor to increase equipment usage (in order to make shorter appointment times
feasible). The first endoscopy center simulation included reducing the appointment time to 45
minutes, having 2 pre-procedure nurses, reducing recovery room time to 30 minutes, and
extending the endoscope reprocessor day by 30 minutes. This change resulted in a 21.6%
increase in procedures performed per week, 17.4%, drop in patient time in the endoscopy center,
and no significant change in patient wait time. A second endoscopy center simulation
incorporated the same changes except appointment time was lowered further to 40 minutes and
there was a steeper rise in procedure volume with patient wait times and total time in the
endoscopy center remaining unchanged.
The above changes were then incorporated into simulations whereby a half-day of Friday
afternoon endoscopy appointments were moved to Wednesday morning. In this simulation the
number of procedures performed rose significantly in conjunction with provider, nursing and
procedure room utilization improving, yet patient time in the endoscopy center was not
significantly changed. For example, in simulations at 45 and 40 minute appointment times
procedure volume rose by 23.4% and 34.2%, while patient time spent in the endoscopy center
declined by 17.4% and 13.0% respectively.
Finally, the same changes were also incorporated into an endoscopy center simulation whereby
one additional provider was also made available on each half day of endoscopy. Procedure
volume increased with a rise of 39.6% and 46.7% for simulations at 45 and 40 minute
20
appointment times with overall provider utilization increasing to its highest levels. However,
nursing utilization exceeded capacity in both simulations. Furthermore, as appointment times
were shortened under these simulations patient wait time steadily increased to one point where
patients spent nearly a third of their time in the endoscopy center waiting.
During the validation phase the simulation model did quite well at predicting specific outcomes
of the three proposed scenarios that were implemented in the endoscopy center. The
implemented scenario where appointment times were shortened to 45 minutes had outcomes in
line with those of the model. The model predicted fairly well the outcomes for the other two
scenarios although procedure volume, provider utilization, and nurse utilization, while trending
in the same direction as the model, were somewhat higher than what the model had predicted
(Table 3).
DISCUSSION
Through observation, time and motion study and discrete event simulation modeling we
demonstrated that in a large, diverse safety-net hospital endoscopy center that weekly patterns,
although variable, are predictable and provide insight and recommendations as to what potential
changes are beneficial. We illustrate that patient throughput as well as provider and nursing
utilization are substantially increased with only simple changes such as decreasing endoscopy
appointment times, realigning the endoscopy schedule with patient preferences for early morning
appointments and minimizing and streamlining the recovery room and pre-procedure process.
Additional improvements in throughput are possible but only with additional costly human
resources, over utilizing nurses and unacceptable patient wait times.

21
With an emphasis on cost containment and improving efficiency in healthcare a number of
methods, such as time and motion studies and discrete event simulation modeling, have been
successfully advocated and implemented to attain these goals; specialties that have been at the
forefront of this include anesthesia19,20
, primary care21-24
, emergency rooms25-27
, and
pediatrics28,29
. Our study is not the first to conduct a time and motion study or employ simulation
modeling in the endoscopy center; however there is sparse and disparate literature on this topic.
Some studies have used only a qualitative approach10
, conducted solely a time and motion
study13
, incorporated only one endoscopic procedure in their models11
or limited their
simulations to only one component of the endoscopy center process such as scheduling17
. In
addition, all of these studies were limited by their setting; all examined large tertiary hospitals or
a private setting, most included endoscopy centers outside of the U.S. and had minimal trainee
involvement. Our study is unique in that we involved clinical staff in developing and testing
changes while other studies generally utilized GI data and then worked on it separately from
providers and staff. Additionally, we are the first to use such methods to examine efficiency and
change in a large safety-net hospital system with significant trainee involvement.
Our study highlights the importance of two key areas in the endoscopy center: pre-procedure and
recovery room processes. With respect to the pre-procedure process, no clear evidence exists on
how to improve the pre-procedure process with only scant expert opinions available30,31
. A
number of factors influence this process including obtaining vitals, placing intravenous catheters,
completing paperwork, patient changing, and in some cases the use of interpreting services. The
majority of these tasks center on nursing/medical assistant roles13
and in most cases these tasks
are fixed and difficult to streamline. Previous work in the operating room has realized this

22
challenge and some work has demonstrated that parallel processing of tasks among staff
members can lead to a dramatic reduction in operating room pre-procedure and room turnover
time6,7
. In this same light, we modeled an increase in the pre-procedure personnel in order to
utilize this strategy of parallel processing which to date has not been modeled in endoscopy
centers. We noted an increase in procedure volume by 14.6 procedures/week (mean increase of
730 procedures/year) while at the same time significantly improving nursing, provider and room
utilization and keeping patient wait time constant. Other potential improvements in the pre-
procedure process, but difficult to model, may focus on patient education for patient
preparedness, prior communication with patients who do not speak English, and education
programs aimed at improving pre-procedure processes for staff.
Another vital step in improving endoscopy center efficiency is the recovery room; specifically
limiting recovery room time can profoundly help increase efficiency. Grossman modeled an
ambulatory surgery center and demonstrated that recovery time was the main bottleneck. In fact,
a 50% reduction in recovery time increased the number of patients per room per day and
shortened the overall length of stay of patients14
. Similarly, in our study by limiting recovery to
the recovery room (which reduces room turnover time) and reducing recovery time to 30 minutes
(a reduction of 13.3% from baseline) we observed an increase of 14.3 procedures/week with no
effect on patient wait time. While some regulations require a specific recovery time, there is no
clear method on how to address this bottleneck. Aside from increasing the physical space of the
recovery room (which is quite costly in a resource limited environment) the only specific
intervention proposed to reduce this time has been sedation related. The use of Propofol® in
some centers and only using one sedating medication compared to two medications has been
23
demonstrated to help not only reduce sedation time, but overall recovery time as well32
.
However, these strategies present challenges of their own. Using only one sedating medication,
rather than two, may result in the loss of synergy between sedative and analgesics and could also
led to longer sedation times in order to achieve adequate sedation. Also, the use of Propofol®
comes with the additional costs of utilizing anesthesiologists or certified nurse anesthetists given
the current restrictions and inability of gastroenterologists to administer this drug themselves.
Further research on strategies aimed at improving the endoscopy recovery process is warranted.
Lastly, unlike previous work we did not focus our changes solely on providers/endoscopists. Of
the limited work on this topic, all studies have focused on two key outcomes: increasing patient
throughput and improving physician efficiency. However, only focusing on physician efficiency
doesn’t translate into overall efficiency for the endoscopy center. Rex et al clearly illustrated this
concept by showing that increasing patients served and physician utilization does so at a cost of
the endoscopy center being sub-optimized with patient length of stays increased and non-
physician staff utilization decreasing12
. Our model echoed this point whereby in several
simulations adding an endoscopist did increase procedure volume, but did so at a detriment to
overutilization of the nursing staff, increasing patient time in the endoscopy center, and wait
time ranging from a third to almost half of a patient’s visit. Also, adding additional endoscopists
is a costly option (mean salary of $321,575/year) especially in resource limited areas such as
public hospitals. On the other hand, personnel such as nursing, medical assistants, or extending
reprocessors hours, which can impact processes before and after a procedure, are far less costly
and in our simulations not only provided improvements in volume and provider efficiency, but
did so in a more balanced approach.
24
There are several limitations in our study. First, our study setting occurred in a safety-net
hospital with a diverse, primarily non-English speaking patient population and may not be
generalizable to other endoscopy centers. However, the techniques employed in our study and
our team based approach to improve endoscopy center efficiency can be applied to any
endoscopy center setting. Second, our study is a mathematical model and may not precisely
predict reality. Yet in examining three of the proposed scenarios during a validation phase, the
model did quite well in predicting reality within the endoscopy center; some variations were
noted between the model and reality but this occurred in situations where a scenario had to be
modified. Moreover, in some cases the differences were large, but were overall better. One
possible explanation for such findings may be that the changes had a ripple effect on factors not
included in our simulation, such as staff motivation. Nevertheless the model correctly predicted
trends with regards to specific outcomes, even in those scenarios that were modified, thereby
demonstrating the power and usefulness of it. Third, we did not model other possible, but more
complex changes, such as assessing the impact of same day bowel preparation which may
increase the desirability of afternoon appointments, scheduling complex procedures at the end of
the day as is done in surgery33
, expanding the number of pre-procedure and recovery rooms to
accommodate more patients, scheduling a mix of procedures that vary by time throughout the
day, or evaluating the further impact of changes to arrival “earliness” as was noted in our patient
population. Fourth, many of the procedures performed in our endoscopy center involved GI
trainees and thus our center differs in this respect from many community and ambulatory
endoscopy centers. The use of GI trainees may impact several aspects of endoscopy center flow,
namely an increase in procedure time owing to teaching that occurs during the procedure and a

25
likely increase in the pre-procedure time as GI trainees may not be as knowledgeable with the
systems and operations of the endoscopy center and/or may not be as familiar with the patients
scheduled for a procedure. Finally, we observed that patients scheduled for an afternoon
appointment arrived for their procedure appointment significantly earlier than did patients for
morning appointments; an observation that is unlikely to occur in most endoscopy centers. A
number of factors could explain this finding such as the majority of our patients did not speak
English, many have substance abuse and psychiatric illnesses and many have low health literacy
rates. Any one of these factors or a combination could have led to patients not understanding
their instructions and thus showing up much earlier for their appointment. Additionally, many
clinics within our hospital will evaluate patients on a “first-come, first-serve” basis despite their
scheduled appointment and thereby this belief on the part of patients in our system may have
impacted their decision to arrive earlier for their procedure appointment. Despite these
limitations, our model has much strength in that it demonstrates that with only small changes to
resource assignments one can dramatically improve patient volume and other performance
metrics and can do so in a cost-effective manner especially in an endoscopy center where space
and resources are limited. Furthermore, using time and motion studies and building a simulation
model with input from all staff members, endoscopy centers can evaluate potential changes with
a tool not currently being used in GI services.
In summary, through observation of workflow and analysis of simulation results we illustrate
that weekly endoscopy center patterns are predictable and provide insight into what changes can
be beneficial. Minor changes such as reducing appointment times, minimizing recovery room
time and increasing ancillary staff in the pre-procedure area are effective tools that significantly
26
improve endoscopy center efficiency and do not substantially increase costs. By balancing pre
and post procedure capacity a continuous flow is created and patient waiting is reduced. More
costly decisions such as increasing the number of endoscopists can improve procedure volume,
but at an impairment of endoscopy center functions and metrics. Overall, in a resource limited
setting we discovered that understanding patterns and behaviors can be used to develop solutions
in a cost effective manner.

27
Metric Mean 95% Confidence Interval
Patient arrival (minutes early)
8:00 AM -28.5 -19.7 to -37.3
9:00 AM -58.8 -49.1 to -68.6
10:00 AM -70.5 -62.9 to -78.1
11:00 AM -72.0 -63.7 to -80.3
> 13:00 PM -179.4 -148.4 to -210.4
Wait time in waiting room (minutes)
Colonoscopy 28.8 5.0-52.6
EGD1 38.6 8.0-69.2
EGD/Colonoscopy 31.9 1.4-62.4
Pre-procedure time (minutes)
Colonoscopy 22.3 20.0-24.6
EGD1
20.9 14.9-26.9
EGD/Colonoscopy 31.2 21.0-41.3
On-time procedure start time (%)
Colonoscopy 55.0 49.7-60.3
EGD 53.3 48.0-58.6
EGD/Colonoscopy 55.1 49.8-60.4
Procedure time (minutes)
Colonoscopy 28.5 26.6-30.4
EGD 9.5 8.3-10.8
EGD/Colonoscopy 36.4 33.3-39.5
Sedation time (minutes)
Colonoscopy 11.2 -0.9-23.2
EGD 10.0 0.1-20.1
EGD/Colonoscopy 23.7 1.9-45.5
Recovery time (minutes)
Recovery room 34.6 32.5-36.6
Room turnover time (minutes)
Colonoscopy 13.2 -3.3-29.7
EGD 9.9 7.1-12.7
EGD/Colonoscopy 8.2 4.5-11.9
Table 1. Baseline endoscopy center data. 1 EGD = esophagogastroduodenoscopy
28
Individual simulation
models
Procedures
performed/week
Patient time in
endoscopy center
(hours)
Provider utilization
(%)
Nurse utilization
(%)
Procedure room
utilization (%)
Wait time (%)
Baseline 53.8 (51.0-56.6) 2.3 (2.2-2.5) 24.0 (21.9-25.5) 40.0 (37.9-42.0) 49.8 (47.1-52.5) 22.3 (19.9-24.6)
Reducing endoscopy center appointment times
45 minute appointment 68.0 (66.8-69.2) 3.2 (2.8-3.6) 28.9 (27.1-30.6) 48.0 (46.5-49.4) 55.8 (53.8-57.7) 37.9 (32.0-43.7)
40 minute appointment 1
35 minute appointment 1
30 minute appointment 2
Modifying endoscopy center weekly schedule3
60 minute appointment 55.7 (53.8-57.6) 2.4 (2.3-2.5) 23.3 (21.3-25.4) 40.9 (39.4-42.4) 62.5 (58.4-66.5) 21.8 (18.7-24.8)
45 minute appointment 65.6 (64.5-66.7) 2.8 (2.6-2.9) 27.1 (24.8-29.4) 46.6 (45.3-47.9) 68.2 (65.9-70.5) 33.1 (29.1-37.2)
40 minute appointment 75.4 (73.6-77.3) 3.3 (3.1-3.6) 30.6 (28.2-32.9) 52.9 (50.4-55.4) 74.9 (71.7-78.2) 41.3 (39.1-43.5)
35 minute appointment 1
30 minute appointment 2
Expanding human resources
Increase in pre-
procedure nurses to 24
68.4 (65.3-71.5) 2.4 (2.2-2.6) 30.3 (28.3-32.3) 65.6 (4.0-127.2) 61.7 (58.0-65.4) 22.4 (18.4-26.4)
Increase of 1 endoscopist to each half-day of endoscopy
60 minute appointment 70.0 (67.2-72.8) 2.3 (2.1-2.6) 24.9 (22.8-27.1) 169.9 (158.2-181.7) 56.2 (52.7-59.8) 21.0 (18.2-23.8)
45 minute appointment 87.6 (85.6-89.5) 3.0 (2.6-3.4) 30.2 (27.5-32.9) 211.9 (198.3-225.4) 65.5 (61.3-69.8) 34.9 (29.1-40.7)
40 minute appointment 93.9 (92.3-95.4) 3.9 (3.7-4.2) 32.8 (31.1-34.5) 230.7 (218.4-243.0) 70.8 (66.3-75.3) 49.2 (45.2-53.1)
Minimizing recovery room time
No recovery in procedure
room4
68.1 (65.8-70.3) 2.8 (2.4-3.2) 29.5 (26.6-32.3) 42.5 (39.9-45.0) 49.6 (46.5-52.7) 35.0 (29.0-41.0)
30 minute recovery4 67.6 (65.8-69.4) 2.5 (2.2-2.7) 28.7 (26.5-30.9) 38.9 (37.2-40.6) 45.3 (43.1-47.5) 35.4 (30.8-40.0)
Table 2. Individual simulations performed in endoscopy center model and calculated outputs with regards to several performance and efficiency
metrics. 1 Simulation not feasible as a significant number of patients did not have their procedures completed at the end of the day.
2 Simulation not feasible as appointment time was too close to mean procedure times.
3 Shifting one afternoon half-day of endoscopy from Friday to a Wednesday morning session.
4 Appointment time of 45 minutes.

29
Expanded endoscopy center
simulations and validation
Procedures
performed/week
Patient time in
endoscopy center
(hours)
Provider utilization
(%)
Nurse utilization
(%)
Procedure room
utilization (%)
Wait time (%)
Baseline 53.8 (51.0-56.6) 2.3 (2.2-2.5) 24.0 (21.9-25.5) 40.0 (37.9-42.0) 49.8 (47.1-52.5) 22.3 (19.9-24.6)
Reducing endoscopy center appointment times
45 minute appointment 1 68.6 (66.2-70.9) 1.9 (1.8-2.0) 30.1 (27.4-32.7) 69.0 (-8.5-146.5) 51.2 (47.1-55.2) 21.7 (17.6-25.9)
Simulation validation2
71.8 (68.6-75.0) 2.2 (1.6-2.8) 41.6 (37.4-45.8) 69.3 (45.9-92.7) 56.2 (51.7-60.7) 14.0 (7.9-20.1)
40 minute appointment 3
78.0 (76.4-79.6) 2.1 (2.0-2.3) 34.5 (32.5-36.6) 47.4 (44.8-49.9) 56.4 (53.2-59.6) 25.2 (22.4-28.0)
Modifying endoscopy center weekly schedule4
45 minute appointment
70.2 (68.7-71.8) 1.9 (1.8-2.0) 29.6 (27.1-32.2) 41.9 (39.3-44.6) 61.9 (58.8-65.1) 18.2 (15.6-20.8)
Simulation validation2
89.0 (85.5-92.5) 2.4 (1.8-3.0) 47.3 (42.9-51.7) 71.1 (48.3-93.9) 58.9 (55.6-62.2) 17.1 (7.8-26.4)
40 minute appointment
81.8 (80.5-83.0) 2.0 (1.9-2.1) 35.1 (32.0-38.2) 49.6 (47.4-51.8) 71.0 (67.4-74.7) 22.7 (19.7-25.6)
Expanding human resources5
45 minute appointment
89.1 (87.6-90.7) 2.1 (1.9-2.2) 32.5 (29.6-35.4) 175.8 (166.4-185.2) 55.9 (52.7-59.1) 25.3 (22.7-27.9)
Simulation validation2 101.3 (97.8-104.8) 2.6 (1.7-3.5) 59.4 (54.6-64.2) 100.7 (69.8-131.6) 68.5 (63.9-73.1) 19.9 (11.8-28.0)
40 minute appointment
101.0 (98.0-104.0) 2.5 (2.2-2.7) 36.4 (33.3-39.4) 201.9 (190.9-212.8) 62.1 (58.5-65.8) 33.1 (27.5-38.7)
Table 3. Expanded endoscopy center simulations (individual simulations with additional resources) and calculated outputs with regards to several
performance and efficiency metrics. 1 Additional resources added: 2 pre-procedure nurses, recovery time of 30 minutes, recovery only in recovery room, and endoscope reprocessor hours extended to 4:30PM. 2 Implementation of specific scenario in the endoscopy center over a two month timeframe and calculated outputs (i.e. results from operations rather than simulation output) 3 Additional resources added: 2 pre-procedure nurses, recovery time of 30 minutes, recovery only in recovery room, and endoscope reprocessor hours extended to 5:00PM. 4 Additional resources added: Friday PM appointments moved to Wednesday AM, 2 pre-procedure nurses, recovery time of 30 minutes, recovery only in recovery room, and endoscope
reprocessor hours extended to 4:30PM. 5 Additional resources added: One additional endoscopist added to each half-day of endoscopy, 2 pre-procedure nurses, recovery time of 30 minutes, recovery only in recovery room, and
endoscope reprocessor hours extended to 4:30PM.
30
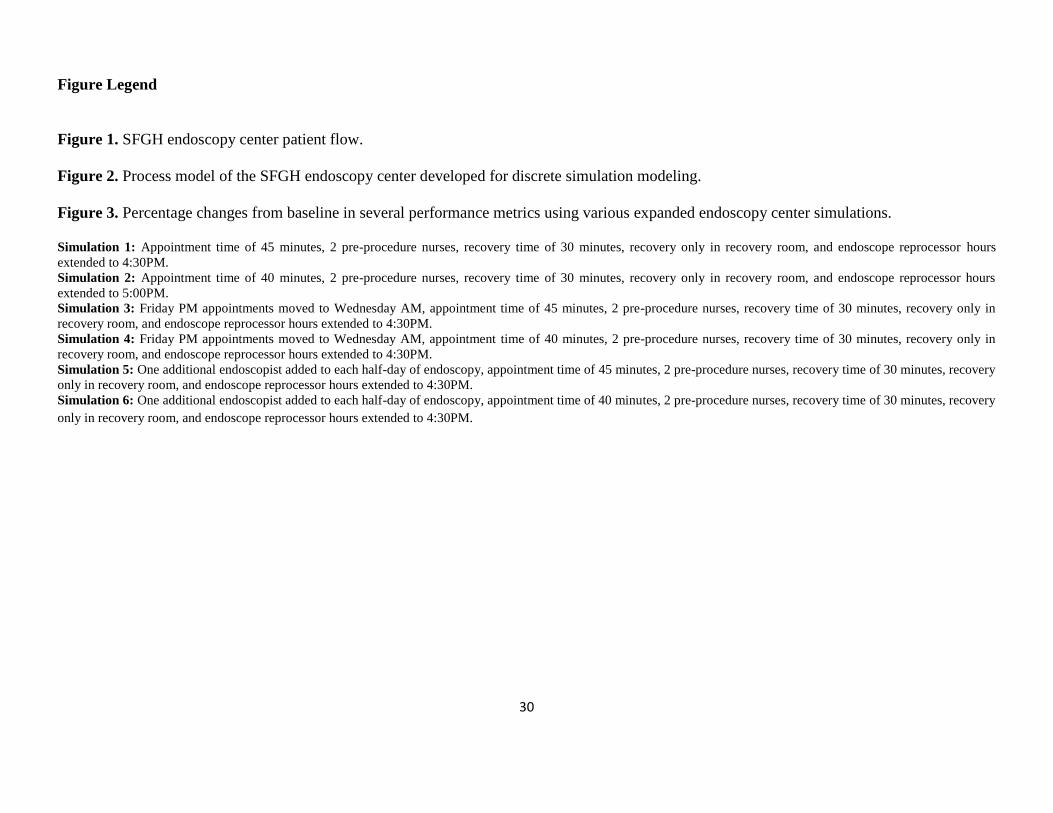
Figure Legend
Figure 1. SFGH endoscopy center patient flow.
Figure 2. Process model of the SFGH endoscopy center developed for discrete simulation modeling.
Figure 3. Percentage changes from baseline in several performance metrics using various expanded endoscopy center simulations. Simulation 1: Appointment time of 45 minutes, 2 pre-procedure nurses, recovery time of 30 minutes, recovery only in recovery room, and endoscope reprocessor hours
extended to 4:30PM.
Simulation 2: Appointment time of 40 minutes, 2 pre-procedure nurses, recovery time of 30 minutes, recovery only in recovery room, and endoscope reprocessor hours
extended to 5:00PM.
Simulation 3: Friday PM appointments moved to Wednesday AM, appointment time of 45 minutes, 2 pre-procedure nurses, recovery time of 30 minutes, recovery only in
recovery room, and endoscope reprocessor hours extended to 4:30PM.
Simulation 4: Friday PM appointments moved to Wednesday AM, appointment time of 40 minutes, 2 pre-procedure nurses, recovery time of 30 minutes, recovery only in
recovery room, and endoscope reprocessor hours extended to 4:30PM.
Simulation 5: One additional endoscopist added to each half-day of endoscopy, appointment time of 45 minutes, 2 pre-procedure nurses, recovery time of 30 minutes, recovery
only in recovery room, and endoscope reprocessor hours extended to 4:30PM.
Simulation 6: One additional endoscopist added to each half-day of endoscopy, appointment time of 40 minutes, 2 pre-procedure nurses, recovery time of 30 minutes, recovery
only in recovery room, and endoscope reprocessor hours extended to 4:30PM.
31
REFERENCES
1. Bohra S, Byrne MF, Manning D, Smyth C, Patchett SE, Murray FE. A prospective analysis of
inpatient consultations to a gastroenterology service. Ir Med J 2003;96:263-5.
2. Cai Q, Bruno CJ, Hagedorn CH, Desbiens NA. Temporal trends over ten years in formal inpatient
gastroenterology consultations at an inner city hospital. J Clin Gastroenterol 2003;36:34-8.
3. Jordan MR, Conley J, Ghali WA. Consultation patterns and clinical correlates of consultation in a
tertiary care setting. BMC Res Notes 2008;1:96.
4. Canin L WB. Specialty Care in the Safety Net: Efforts to Expand Timely Access (online). Available
at: http://www.chcf.org. Accessed August 1, 2013.
5. Dexter F, Macario A. Decrease in case duration required to complete an additional case during
regularly scheduled hours in an operating room suite: a computer simulation study. Anesth Analg
1999;88:72-6.
6. Friedman DM, Sokal SM, Chang Y, Berger DL. Increasing operating room efficiency through
parallel processing. Ann Surg 2006;243:10-4.
7. Olmstead J, Coxon P, Falcone D, Ignas L, Foss P. World-class OR turnaround times: secrets
uncovered. AORN J 2007;85:942-5, 7-9.
8. Overdyk FJ, Harvey SC, Fishman RL, Shippey F. Successful strategies for improving operating room
efficiency at academic institutions. Anesth Analg 1998;86:896-906.
9. Weinbroum AA, Ekstein P, Ezri T. Efficiency of the operating room suite. Am J Surg 2003;185:244-
50.
10. Zamir S, Rex DK. An initial investigation of efficiency in endoscopy delivery. Am J Gastroenterol
2002;97:1968-72.
11. Berg B, Denton B, Nelson H, et al. A discrete event simulation model to evaluate operational
performance of a colonoscopy suite. Med Decis Making 2010;30:380-7.
12. Rex DK LB DR. Impact of two procedure rooms per physician on productivity: computer simulation
examines the impact of process change in the hospital gastroenterology department [abstract]. Gastrointest
Endosc 2005; 61: AB154.
13. Harewood GC, Chrysostomou K, Himy N, Leong WL. A "time-and-motion" study of endoscopic
practice: strategies to enhance efficiency. Gastrointest Endosc 2008;68:1043-50.
14. Grossman P LB DR. Where are ambulatory surgery center (ASC) bottlenecks? Use of computer
simulation modeling to evaluate efficiency targets [abstract]. Gastrointest Endosc 2005;61:AB 150.
15. Pilgrim H TP, Chilcott J, et al. The costs and benefits of bowel cancer service developments using
discrete event simulation. Journal of the Operational Research Society. 2009;60:1305-1314.
16. Lang L. Study shows how to lower costs, waiting times for colonoscopies. Gastroenterology 2009;
137: 1866.
17. Joustra PE, de Wit J, Struben VM, Overbeek BJ, Fockens P, Elkhuizen SG. Reducing access times
for an endoscopy department by an iterative combination of computer simulation and linear programming.
Health Care Manag Sci 2010;13:17-26.
18. Gellad ZF, Thompson CP, Taheri J. Endoscopy unit efficiency: quality redefined. Clin Gastroenterol
Hepatol 2013;11:1046-9 e1.
19. Van Houdenhoven M, van Oostrum JM, Hans EW, Wullink G, Kazemier G. Improving operating
room efficiency by applying bin-packing and portfolio techniques to surgical case scheduling. Anesth Analg
2007;105:707-14.
20. van Oostrum JM, Van Houdenhoven M, Vrielink MM, et al. A simulation model for determining the
optimal size of emergency teams on call in the operating room at night. Anesth Analg 2008;107:1655-62.
32
21. Edwards RH, Clague JE, Barlow J, Clarke M, Reed PG, Rada R. Operations research survey and
computer simulation of waiting times in two medical outpatient clinic structures. Health Care Anal
1994;2:164-9.
22. Penneys NS. A comparison of hourly block appointments with sequential patient scheduling in a
dermatology practice. J Am Acad Dermatol 2000;43:809-13.
23. Stahl JE, Roberts MS, Gazelle S. Optimizing management and financial performance of the teaching
ambulatory care clinic. J Gen Intern Med 2003;18:266-74.
24. Parks JK, Engblom P, Hamrock E, Satjapot S, Levin S. Designed to fail: how computer simulation
can detect fundamental flaws in clinic flow. J Healthc Manag 2011;56:135-44; discussion 45-6.
25. Connelly LG, Bair AE. Discrete event simulation of emergency department activity: a platform for
system-level operations research. Acad Emerg Med 2004;11:1177-85.
26. Saunders CE, Makens PK, Leblanc LJ. Modeling emergency department operations using advanced
computer simulation systems. Ann Emerg Med 1989;18:134-40.
27. Storrow AB, Zhou C, Gaddis G, et al. Decreasing lab turnaround time improves emergency
department throughput and decreases emergency medical services diversion: a simulation model. Acad
Emerg Med 2008;15:1130-5.
28. Hung GR, Whitehouse SR, O'Neill C, Gray AP, Kissoon N. Computer modeling of patient flow in a
pediatric emergency department using discrete event simulation. Pediatr Emerg Care 2007;23:5-10.
29. Racine AD, Davidson AG. Use of a time-flow study to improve patient waiting times at an inner-city
academic pediatric practice. Arch Pediatr Adolesc Med 2002;156:1203-9.
30. Marasco JA, Marasco RF. Designing the ambulatory endoscopy center. Gastrointest Endosc Clin N
Am 2002;12:185-204, v.
31. Petersen BT. Promoting efficiency in gastrointestinal endoscopy. Gastrointest Endosc Clin N Am
2006;16:671-85.
32. McQuaid KR, Laine L. A systematic review and meta-analysis of randomized, controlled trials of
moderate sedation for routine endoscopic procedures. Gastrointest Endosc 2008;67:910-23.
33. Gul S. Optimization of Surgery Delivery Systems (dissertation at University of Arizona); 2010: 1-
103. Accessed: http://repository.asu.edu/attachments/56262/content/Gul_asu_0010E_10193.pdf. on August
1, 2013.

33