Embed Size (px)
Citation preview

Optimizing draft strategies in fantasy football
Papa Chakravarthy
Abstract
Data was collected from ESPN.com and Pro Football Reference to determine a
conditionally optimal auction draft strategy contingent on correct risk estimation in a fantasy
football league. The study considers several draft styles including point based drafting, value
based drafting, risk-averse drafting and risk neutral drafting. It attempts to determine the risk
level that provides risk neutral drafting, as well as the ways risk neutrality can increase a team
owner’s utility, where utility is directly related to the fantasy point output of a team. The paper
finds that risk neutrality involves hedging auction bids by 10% and using a position specific
pricing and discount bonus of the same amount. Using value based bidding in a risk-neutral
scenario was confirmed as the best overall auction draft strategy for increasing utility, but in a
draft with multiple risk neutral bidders, bidding with risk aversion was a conditionally optimal
strategy.
Introduction
Fantasy Football Overview
Fantasy football is an interactive, often online, game played within a group of people.
Such a group is often termed a “league.” Each of the people involved is considered an “owner”
and runs a “team.” Each owner selects players in the National Football League for his team.

Based on the performance of those players in real games against NFL opponents, each owner
receives points for his team. The number of points received depends on the conditions of the
league, but as a rule, better players earn their owners more points. The more points a team
receives, the more likely a team is to win its league, which may earn its owner money or simply
bragging rights.
League Format
Even with a superficial understanding of the game, it is immediately apparent that
obtaining the best players provides an owner with the best chance to increase his utility by
winning. Acquiring players occurs just prior to the beginning of the NFL season in a process
known as a draft. Most leagues do this draft online using a draft engine, often through
ESPN.com or Yahoo’s Fantasy Football portal. These drafts are separated into two major
categories: snake and auction. A snake draft requires a random number generator to
predetermine draft order for every team in the league. Then, each team makes a player
selection in that defined order. The process is repeated, but in alternating forward and reverse
order until every team has a full roster. This type of draft is currently very popular but that
number is trending downwards in favor of the more complex auction draft.
In an auction draft, owners are again randomly defined in an order, but instead of
selecting players in that order, owners nominate players. Then, each team bids on those players
in a slightly modified English auction. Whichever owner bids highest retains that player for the
year. In this internet-driven age, every owner has similar information about each player.
Moreover, the online draft portal provides an estimated valuation for the player. This English

auction has some important distinctions from a standard auction. Because each owner needs to
fill his roster, the draft consists of a series of auctions which affect one another. Finally, each
owner has a salary cap, a number set by the league to protect parity and prevent one owner
with more money from buying all of the best players.
Draft Strategy
In order to understand a draft strategy, one must understand the rules of a league. For
this analysis, I used standard league rules and a league of ten teams. Each team needs to fill its
roster with several positions, within a salary cap set at $200, the default setting for ESPN
leagues. The positions included are quarterback, running back, wide receiver, and tight end. A
team will generally draft two quarterbacks, three running backs, five wide receivers, and two
tight ends, but each team can draft a maximum number of three quarterbacks, four running
backs, six wide receivers and three tight ends. Of these players, a team can only earn points for
one quarterback, two running backs, three wide receivers, and a tight end. The remainder of a
team’s roster makes up its “bench.” Players may be interchanged by the owner between the
starters and the bench in between games due to performance, injury, or any other reason.
Points are earned for passing, rushing, and receiving touchdowns (each is worth 6 points);
passing yards (0.04 points); and rushing and receiving yards (0.1 points). Points are lost for
interceptions thrown (-2 points). These rules are the standard rules for ESPN Fantasy Football,
and therefore, applicable to many leagues.
Question

Rationality
This study will focus on the rationality of the draft strategy of each owner in an auction
draft, and whether it is possible to define a conditionally optimal draft strategy. A rational
strategy for one owner is playing to maximize only his own utility function. A utility function is
denoted as follows:
Owneri and Teami refer to an owner and his team and P(Teami) is the number of fantasy points
produced by Teami while Teamj is another team in the league. Thus, in order for an owner to
maximize his utility, he must win his league.
All the strategies this paper will discuss are based on maximizing utility, or more clearly,
maximizing a fantasy team’s expected point output, thereby increasing the probability that the
team wins its league. It is crucial to recognize that increasing mean points is not necessarily the
same as increasing utility. For example, injuries provide risk that could decrease probability of
winning, despite an increased mean. There are multiple possible sources of bias for draft
strategies, including owners having favorite players and teams. Most individuals who play
fantasy football follow the NFL and have a favorite team, so bias toward those players should
be balanced among owners in a league. This study does not consider personal biases in the
drafting of a team, only utility.
Risk
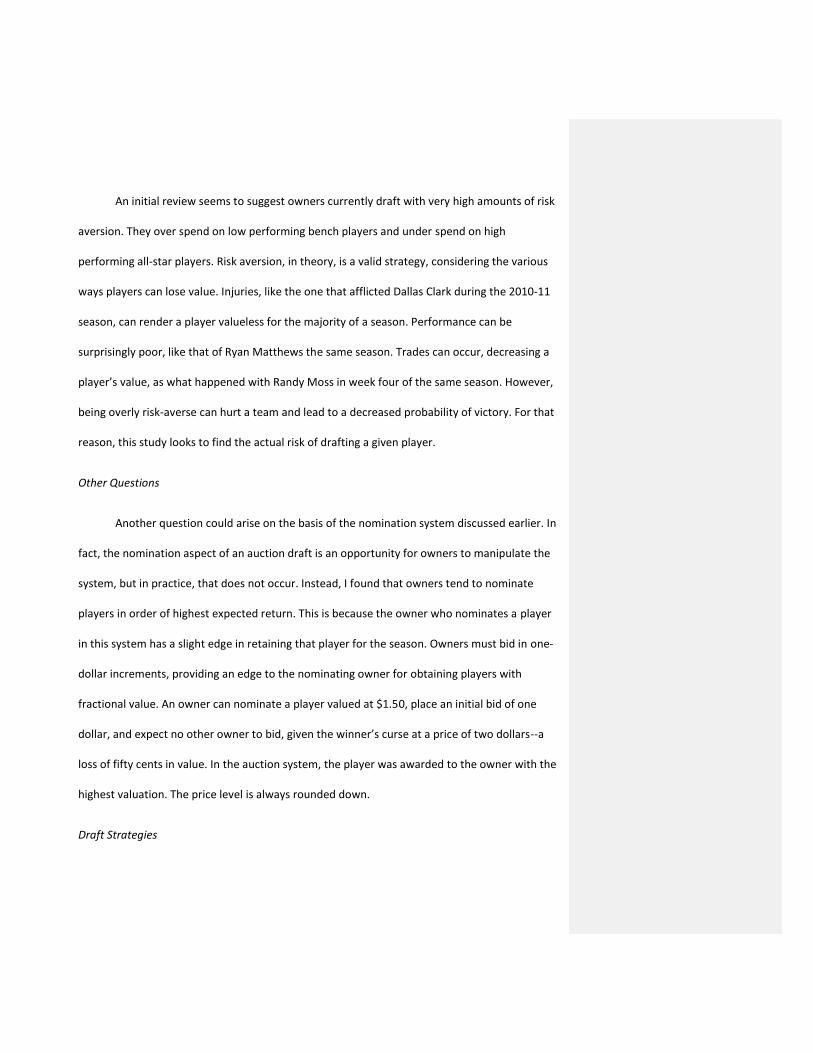
An initial review seems to suggest owners currently draft with very high amounts of risk
aversion. They over spend on low performing bench players and under spend on high
performing all-star players. Risk aversion, in theory, is a valid strategy, considering the various
ways players can lose value. Injuries, like the one that afflicted Dallas Clark during the 2010-11
season, can render a player valueless for the majority of a season. Performance can be
surprisingly poor, like that of Ryan Matthews the same season. Trades can occur, decreasing a
player’s value, as what happened with Randy Moss in week four of the same season. However,
being overly risk-averse can hurt a team and lead to a decreased probability of victory. For that
reason, this study looks to find the actual risk of drafting a given player.
Other Questions
Another question could arise on the basis of the nomination system discussed earlier. In
fact, the nomination aspect of an auction draft is an opportunity for owners to manipulate the
system, but in practice, that does not occur. Instead, I found that owners tend to nominate
players in order of highest expected return. This is because the owner who nominates a player
in this system has a slight edge in retaining that player for the season. Owners must bid in one-
dollar increments, providing an edge to the nominating owner for obtaining players with
fractional value. An owner can nominate a player valued at $1.50, place an initial bid of one
dollar, and expect no other owner to bid, given the winner’s curse at a price of two dollars--a
loss of fifty cents in value. In the auction system, the player was awarded to the owner with the
highest valuation. The price level is always rounded down.
Draft Strategies

There are many feasible draft strategies in a fantasy football draft. In fact, many of them
are combinations of a few basic ideas. The first, and simplest, is to draft the best viable player
available. The term “viable fantasy player” generally refers to a player expected to play in all 16
games in a season and contribute a meaningful number of points to a team. Alternatively, there
are players who will not contribute and are nonviable. The best viable player is the one most
likely to earn an owner the most points. The bidding function used to determine a bid in this
format is as follows:
V(Xi) is the bid valuation, P(Xi) is the point output for player i of position X, Budget is the $200
(in most leagues) salary cap, Pnecessary is the number of points required to win and R is the risk
aversion factor.
While most of the above values are self-explanatory, the risk aversion factor may be
difficult to understand. In general, risk aversion refers to trading variance in exchange for the
mean. For example, a risk-averse investor would prefer a stock giving a return of mean 100 and
variance 10 to a stock giving a return of mean 105 and variance 20 due to the latter stock’s
possibility of a very low return, whereas a risk neutral person would accept the second stock
due to its higher mean return. A risk seeking person would also take the second stock because
he enjoys the thrill of a risk. We will not consider this type of strategy. In fantasy football drafts,
the same idea holds. A risk-averse owner will not bid for very talented players; instead he will
win players who are in the next tier, but still fantasy starters. Meanwhile, a risk neutral owner
will buy the best players, but because of the salary cap structure, he will be unable to bid on

any second tier players, and will be forced to fill the remainder of his roster with replacement-
level players. This allows a risk-averse owner to have a roster full of players near the median of
the fantasy viable player pool, whereas a risk neutral owner has players from both extremes of
the pool. In this manner, even though a risk neutral owner has a higher possible mean fantasy
point output, a risk-averse owner has low variance in output.
The method by which this is applied to models of bidding is based on the fact that risk-
averse owners can afford to bid lower than risk neutral owners consistently, and rely on the
salary cap to prevent riskier owners from bidding on players near the median of the player
pool. In this manner, we can discount all valuations by a certain risk aversion coefficient, with
the expectation that the fact that better players are bid upon first and the salary cap will take
effect on risk neutral teams. A higher R means the owner is more risk-averse, and his bid is
discounted more due to said risk.
The second draft strategy requires meeting the needs of the team. Every team needs to
fill out the roster spots mentioned above. This draft strategy requires choosing players that will
start for your team and spending less money on other players. When combined with point-
based drafting, it combines the strength of the two systems in a logical way. The bid valuation
appears as follows:
T(X) is a function that provides the amount of players in a given position X on the team already.
It is important to note that the minimum value of a player is $1, which is the source of cost of
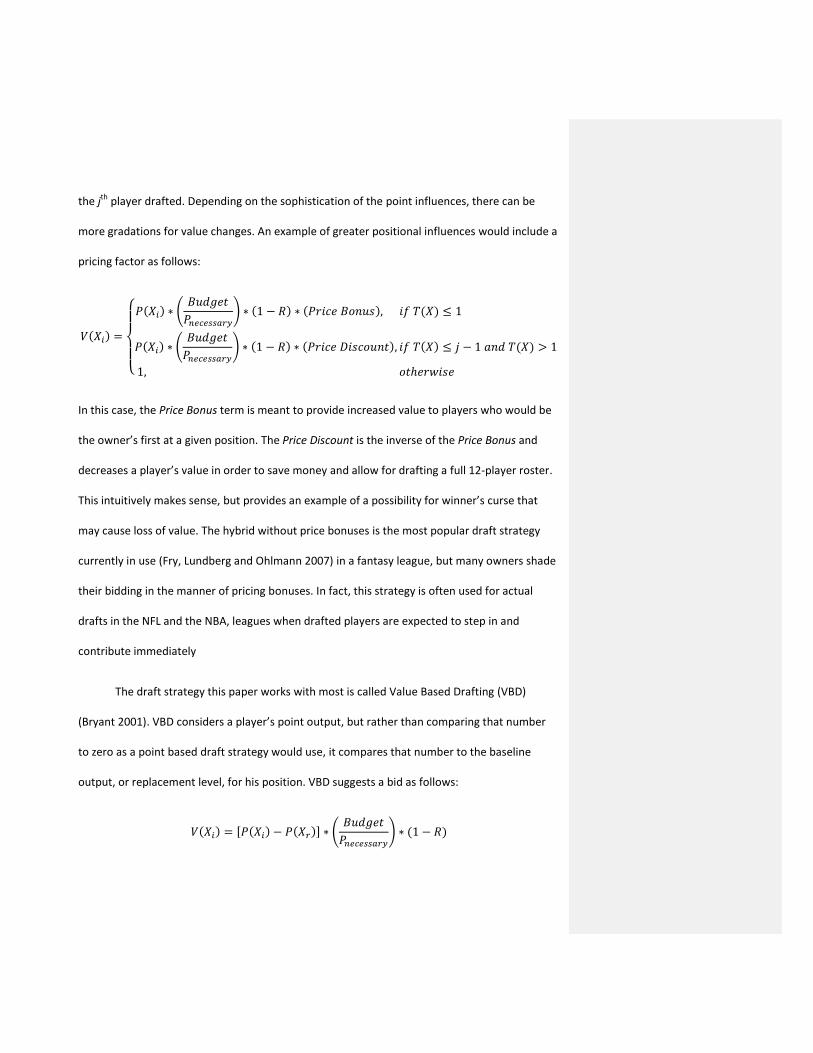
the jth player drafted. Depending on the sophistication of the point influences, there can be
more gradations for value changes. An example of greater positional influences would include a
pricing factor as follows:
In this case, the Price Bonus term is meant to provide increased value to players who would be
the owner’s first at a given position. The Price Discount is the inverse of the Price Bonus and
decreases a player’s value in order to save money and allow for drafting a full 12-player roster.
This intuitively makes sense, but provides an example of a possibility for winner’s curse that
may cause loss of value. The hybrid without price bonuses is the most popular draft strategy
currently in use (Fry, Lundberg and Ohlmann 2007) in a fantasy league, but many owners shade
their bidding in the manner of pricing bonuses. In fact, this strategy is often used for actual
drafts in the NFL and the NBA, leagues when drafted players are expected to step in and
contribute immediately
The draft strategy this paper works with most is called Value Based Drafting (VBD)
(Bryant 2001). VBD considers a player’s point output, but rather than comparing that number
to zero as a point based draft strategy would use, it compares that number to the baseline
output, or replacement level, for his position. VBD suggests a bid as follows:

Here, Xr is the replacement-level player. Value Based Drafting, when combined with a position
oriented system, allows for greater differentiation between players and helps select the best
player available. This is intuitive because even a poor Quarterback earns more points than a
valuable Tight End. A purely points based system would suggest drafting the Quarterback
higher than the Tight End, while a smarter, value based system would draft the Tight End
higher. Value drafting can be combined with any of the draft techniques above, by replacing the
P(Xi) function with the P(Xi) – P(Xr) for a positional approach. Value Based Drafting with
positional influences is the technique being studied in this paper as a possibly ideal draft
strategy.
Finally, there are many draft strategies aimed not at improving one’s team, but at other
goals. An owner may want to draft his favorite players or draft players purely for trade value.
These scenarios are not considered here because they do not necessarily fulfill the goal of
increasing an owner’s utility. Utility is only dependent on the probability of winning a league,
and choosing players to prevent them from landing on other teams does not directly increase
probability of winning in a league as it may lead to over-spending for unwanted players or poor
positional selections.
Studying draft strategies in fantasy football is valuable because fantasy football is played
by 30 million people in North America alone, and many leagues involve betting. It is estimated
that $100 million changes hands each year in fantasy football leagues. Moreover, this auction is
similar to other markets, like the actual drafting of players in sports leagues and the market for

foreclosed homes, where every prospective buyer has the same information and each has a cap
on cost, when the winner’s curse outweighs the utility of purchasing the home.
Methodology
Data
Specifying data is particularly important because fantasy football experiences differ
between expectations and outcomes. Although most owners have similar values for a player,
they do not know how that player will perform with regard to those valuations. In order to
reconcile expectations with results, I chose to study the results of a season and to apply those
as the expected values for next season’s performance. This type of analysis has drawbacks: it
does not account for changes occurring in the offseason. However, it can be used in
conjunction with injury data to develop an estimate of risk, or the variance in total point
output. Total point expectation is the main form of output used to study efficacy of a draft
strategy, but including variance is the only effective way to study risk.
Strategies
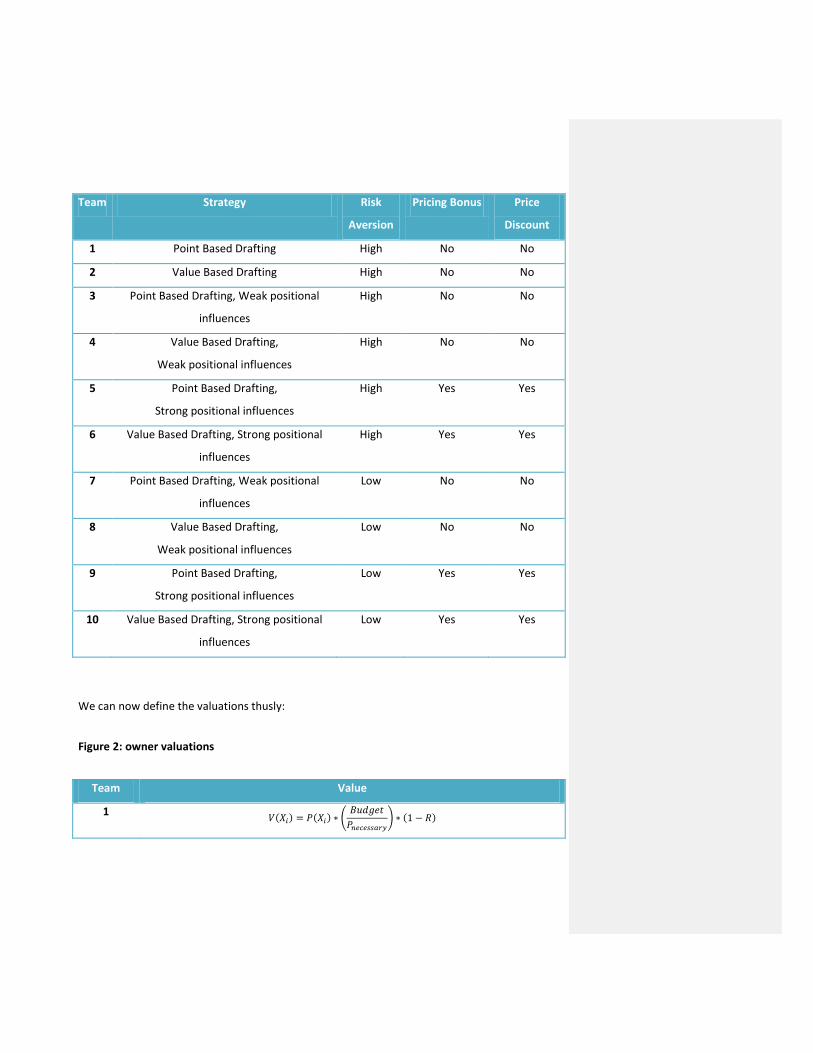
In order simulate a real league and draft strategies, valuations were chosen as follows. I
chose these techniques based on the various possible draft styles. Determining which team
number had which draft style was arbitrary.
Figure 1: owner draft strategies
Team Strategy Risk
Aversion
Pricing Bonus Price
Discount
1 Point Based Drafting High No No
2 Value Based Drafting High No No
3 Point Based Drafting, Weak positional
influences
High No No
4 Value Based Drafting,
Weak positional influences
High No No
5 Point Based Drafting,
Strong positional influences
High Yes Yes
6 Value Based Drafting, Strong positional
influences
High Yes Yes
7 Point Based Drafting, Weak positional
influences
Low No No
8 Value Based Drafting,
Weak positional influences
Low No No
9 Point Based Drafting,
Strong positional influences
Low Yes Yes
10 Value Based Drafting, Strong positional
influences
Low Yes Yes
We can now define the valuations thusly:
Figure 2: owner valuations
Team Value
1

2
3
4
5
6
7
8
9
10

The questions of risk aversion and pricing bonus are interesting as well, because the amount of
risk affects the possible pricing bonus. For example, a risk-averse person would use a very small
positional bonus due to fear of player injury or other underperformance.
Results
Goals
The total value to win a league is an important number because it provides a goal for
fantasy owners to work toward. I calculated the number of points scored by fantasy teams in
2008 and 2009 by computing the value of the average fantasy viable Quarterback (QB), Running
Back (RB), Wide Receiver (WR), and Tight End (TE), as well as the standard deviation of the
same set. By multiplying by the number of players occupying those positions on a team, I was
able to develop a model for mean and standard deviation number of points by teams in a ten
team league. By plotting point outputs in ESPN standard leagues, I found that Gaussian curves
best approximated production, and used this model to describe my hypothetical league. This
means that there are many owners with teams who score near the mean for point output, a
few owners scoring well above the mean and a few owners scoring far below the mean. In
order to win his ten team league, an owner needs to be in the top 10% of his league. The Z
score for .9 is approximately 1.29 standard deviations above the mean, suggesting that a league
winning owner must draft a team that scores more than 1.29 standard deviations above the
league average.

Figure 3: points scored in ten team leagues in 2008 Mean: 1314.6 Standard Deviation: 80.21
1
Figure 4: points scored in ten team leagues in 2009 Mean: 1365.1 Standard Deviation 93.13
1 Please note that the data for all charts and statistical analysis is from pro-football-reference.com and ESPN.com;
a full citation is on the Works Cited page.
900 1100 1300 1500 1700 1900
F
r
e
q
u
e
n
c
y
Fantasy Points
2008
900 1100 1300 1500 1700 1900
F
r
e
q
u
e
n
c
y
Fantasy points
2009
Using the method above, in 2008, the total fantasy point output required to win a
league was approximately 1418. In 2009, that number increased to 1485. To get an idea of
where these numbers are in comparison to total fantasy points in those years, see Figures 3 and
4. Each of these charts shows the spectrum of fantasy results for a team.
2009 was a particularly high scoring fantasy year (Harris 2010), so if we use that year as
baseline we may find a goal point total. 1500 points, by virtue of being the above goal in a very
high scoring season, should fit in the top 10% of a league almost every year. It is visible on both
of these charts that 1500 is comfortably in the top 10% of fantasy scores, placing an owner with
such a score in a good position to win his league. We now have a baseline for point-oriented
drafting schemes, but this will not apply to value based drafting strategies. Such schemes use
the difference between the goal and a replacement level team. A replacement level team will
score the sum of a group of replacement level players. By adding up the scores for a series of
replacement players, we obtain a mark of 1000 points for a replacement. The difference
between 1500 and 1000 is 500 points, therefore, a value based team needs to choose a team
earning 500 points over the replacement level in order to win its league.
Risk
Risk is dependent on three major aspects: position, injuries and performance decrease.
Position is important because different players have different likelihoods of consistent success.
Tight ends are known for being unpredictably successful while running backs are thought to
show more longevity. Therefore, we must calculate risk by position. Injury calculations are
simply games played by viable players over total games available. This may underestimate

injury risk as some players develop injuries before the season begins, making them nonviable,
despite being drafted. On the other hand performance risk, which is calculated by comparing
performance from one season to the next, may easily overestimate risk. That value fails to
include players outperforming their expectations and improving. Still, only allowing for negative
variation in performance provides a high range for possible risk aversion coefficients, which
would help to compensate for underestimation from injuries and find a total risk figure near the
actual risk.
The injury risks are as follows:
Figure 5: games played by fantasy viable players in 2008
2008 Games
Played
Total Games
Possible
Risk
QB 314 320 0.01875
RB 456 480 0.05
WR 912 960 0.05
TE 312 320 0.025
Figure 6: games played by fantasy viable players in 2009
2009 Games
Played
Total Games
Possible
Risk
QB 311 320 0.028125
RB 467 480 0.027083
WR 916 960 0.045833
TE 304 320 0.05

Performance risk can be calculated for 2009 based on the difference in performance
from 2008, which is often used by fantasy owners as a predictor of performance in the next
season.
Figure 7: underperformance in 2009 compared to performance in 2008
Players
Underperforming
Ratio of
Underperformance
Risk
QB 8 0.885755 0.114245
RB 7 0.978474 0.021526
WR 15 0.9777 0.0223
TE 4 0.89665 0.10335
By averaging the amount of injury risk from 2008 and 2009, and then combining with
the performance risk from 2009, we may calculate total risk.
Figure 8: Complete Player Risk
Position Average Injury
Risk
Performance
Risk
Total Risk
QB 0.023438 0.114245 0.137683
RB 0.038542 0.021536 0.060078
WR 0.047917 0.0223 0.070217
TE 0.0375 0.10335 0.14085

Figure 9: Complete Player Risk
Risk Aversion
Figures 8 and 9 illustrate a few important points. Namely, injury risk is fairly consistent among
players, regardless of position. Performance risk, however, varies widely. Running backs show
little performance risk, but quarterbacks and tight ends can experience a large degree of
performance risk with regard to their predicted information. All of these risk values are near
enough the algebraic mean of .10175 that we can feel safe assuming .1 as a value for real risk
and a risk coefficient for risk neutral owners.
The risk coefficient depends on whether the owner is risk-averse or not. If an owner is
particularly risk-averse, he could increase his risk aversion coefficient, decreasing the ratio of
spending on starters to spending on bench players. Risk aversion can also play a role in defining
the bonus and discount for a positional draft strategy. The bonus functions opposite to the risk
aversion coefficient; it allows an owner to overpay for a prized player, increasing the possible
financial loss if that player gets injured. Therefore, for a very risk-averse owner, the risk
0
0.04
0.08
0.12
0.16
QB RB WR TE
R
i
s
k
Position
Overall risk by position
Performance Risk
Average Injury Risk
aversion coefficient should be large and the bonus should be very small. To determine that
number, we can compare valuations without risk to the valuations used most often in ESPN
fantasy leagues.
Comparing draft values with a risk aversion coefficient of zero and the values used in
drafts on ESPN.com, we can find the risk aversion coefficients people generally use for drafting
by finding the slope of a regression line and subtracting from 1.

Figure 10: calculating actual risk
In Figure 10, the x-axis is performance of quarterbacks during 2009 adjusted to give a
bid value without a risk value. The y-axis is those quarterbacks’ draft auction values this year.
We must recognize then, that the coefficient on x in the above chart is the correct risk
adjustment, in the equations as (1-r), for a team. The least squares regression line implies that if
a player’s expected performance increases by enough to raise his non risk adjusted value by $1,
his risk adjusted value increases by $0.6. This means that the discount for the risk adjusted
value is 0.4. This chart does not include quarterbacks who changed teams, retired, or were
suspended for part of the year. The coefficient value of 0.4 = (1 – 0.6) was chosen to match
these results, as shown in Figure 11. The lower risk value was selected as .1 based on the true
estimates calculated above. Then, to determine how a price discount would appear for a risk-
averse owner, we used the same 1:4 ratio.
y = 0.5942x - 7.2727
0
9
18
27
36
45
0 20 40 60 80 100
A
u
c
t
i
o
n
P
r
i
c
e
Actual Value
QB actual values vs bid values
Comment [GK1]: Same thing- axis, title, legend

Figure 11: coefficients for various draft strategies
Team Strategy Risk Aversion
Coefficient
Pricing
Bonus
Price
Discount
1 Point Based Drafting 0.4
2 Value Based Drafting 0.4
3 Point Based Drafting, Weak positional
influences
0.4
4 Value Based Drafting,
Weak positional influences
0.4
5 Point Based Drafting,
Strong positional influences
0.4 1.025 0.975
6 Value Based Drafting, Strong positional
influences
0.4 1.025 0.975
7 Point Based Drafting, Weak positional
influences
0.1
8 Value Based Drafting,
Weak positional influences
0.1
9 Point Based Drafting,
Strong positional influences
0.1 1.1 0.91
10 Value Based Drafting, Strong positional
influences
0.1 1.1 0.91
Auction Results
Based on Figures 2 and 11, we can create initial player values for every owner. Figure 12
gives an example of these player values for Aaron Rodgers, a Quarterback. Note that the
subtitle 1 or j-2 refers to the player being bid upon, not the number of players on the team. If

there is not a subtitle, the team is either bidding on the jth player, or the team does not have
positional preferences. The column labeled “Team 2 no risk” is the valuation used to determine
the actual risk aversion coefficient above.
Figure 12: valuations of each draft strategy
Aaron Rodgers (Green Bay Packers)
Fantasy Position QB Team 4 (j-1) 81.6 Team 7 1
Fantasy Points 405 Team 4 1 Team 8 (j-1) 73.44
Value Points 204 Team 5 (1) 32.724 Team 8 1
Real Prices 36 Team 5 (j-1) 32.076 Team 9 (1) 53.46
Team 1 32.4 Team 5 1 Team 9 (j-1) 44.226
Team 2 48.96 Team 6 (1) 49.4496 Team 9 1
Team 2 No Risk 81.6 Team 6 (j-1) 48.4704 Team 10 (1) 80.784
Team 3 (j-1) 32.4 Team 6 1 Team 10 (j-1) 66.8304
Team 3 1 Team 7 (j-1) 48.6 Team 10 1
By running an auction with all ten teams pitted against one another, we can find the
results of various bidding valuations. The results of this auction appear in Figure 13. note that
the remainder of the results portion deals almost entirely with points rather than utility, but as
a rule, higher point output corresponds to higher utility as a higher point output makes the
likelihood of winning a league higher.

Figure 13: results of auction described above
Team Strategy Risk
Aversion
Expected Point Total from
Starting Lineup
1 Point Based Drafting High 1002
2 Value Based Drafting High 1190
3 Point Based Drafting, Weak positional
influences
High 1040
4 Value Based Drafting,
Weak positional influences
High 1301
5 Point Based Drafting,
Strong positional influences
High 1356
6 Value Based Drafting, Strong positional
influences
High 1409
7 Point Based Drafting, Weak positional
influences
Low 1398
8 Value Based Drafting,
Weak positional influences
Low 1394
9 Point Based Drafting,
Strong positional influences
Low 1410
10 Value Based Drafting, Strong positional
influences
Low 1523
Confidence Interval of Points
Points are not the only important piece of information. It is also important to consider
that a player has 10% likelihood to drastically lose value. We must mimic a repeated simulation
by finding the variance of the figures above for each team. Essentially, if we played 1000
seasons, we would find that in every season 1.2 of the 12 players on the roster drastically lost
value and needed to be replaced, but the players that were replaced changed every season.
The ideal way to do this would be to simulate 1000 drafts and simulate those 1000 seasons.
Then, we could calculate the number of times each team won the league and generate a
probability for each team to win the league and each owner’s utility based on this draft
strategy. Because auction draft values do not change, bidding would be approximately identical
over time and the only simulation required would be that of injuries. This is still beyond the
means of this study; instead, we will look at the 95% confidence interval, which will
approximate the range of probable scores. Comparing these ranges will allow for a less precise,
but still valuable view of expected utility given the draft strategy.
To calculate a confidence interval, we must first determine the likely loss of value for a
high risk team and then do the same for a low risk team. By assuming that a high risk team, in
the case of an injury, would exchange the player ranked in the top 1/8th of the total number of
fantasy viable players at that position for the player it drafted in the bottom 7/8th of the same
group, we may find the average drop-off for those owners. We can do the same thing for risk-
averse owners by measuring the difference between 3/8th and 5/8th of the number of fantasy
viable players. The reason for working with these fractions relies on the assumption that there
are five risk-averse teams and five risk neutral teams and universal distribution of two or more
players per team. For example, risk neutral teams would draft quarterbacks 1-5 and 16-20,
while risk-averse teams draft quarterbacks 6-15. If we treat the average risk neutral team as
owning quarterbacks 3 and 18, the drop off is from the top 1/8th of players to the bottom 1/8th
of players. The same logic can be applied to risk neutral teams which, on average, would own
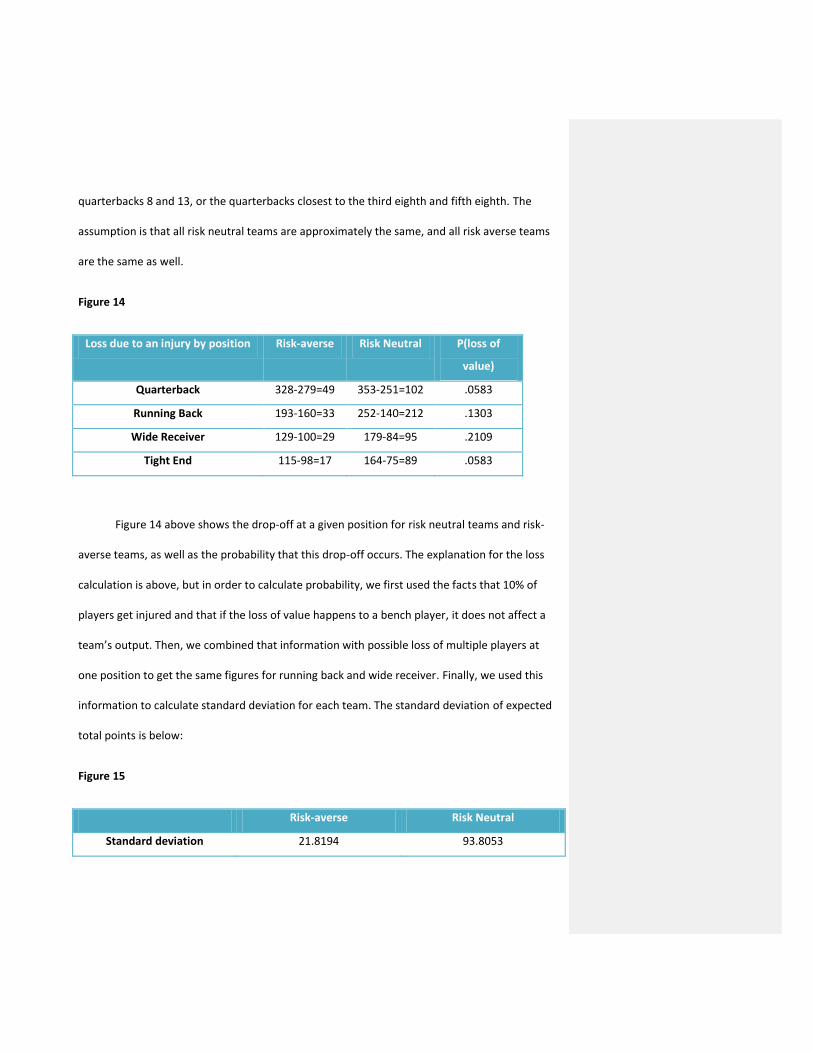
quarterbacks 8 and 13, or the quarterbacks closest to the third eighth and fifth eighth. The
assumption is that all risk neutral teams are approximately the same, and all risk averse teams
are the same as well.
Figure 14
Loss due to an injury by position Risk-averse Risk Neutral P(loss of
value)
Quarterback 328-279=49 353-251=102 .0583
Running Back 193-160=33 252-140=212 .1303
Wide Receiver 129-100=29 179-84=95 .2109
Tight End 115-98=17 164-75=89 .0583
Figure 14 above shows the drop-off at a given position for risk neutral teams and risk-
averse teams, as well as the probability that this drop-off occurs. The explanation for the loss
calculation is above, but in order to calculate probability, we first used the facts that 10% of
players get injured and that if the loss of value happens to a bench player, it does not affect a
team’s output. Then, we combined that information with possible loss of multiple players at
one position to get the same figures for running back and wide receiver. Finally, we used this
information to calculate standard deviation for each team. The standard deviation of expected
total points is below:
Figure 15
Risk-averse Risk Neutral
Standard deviation 21.8194 93.8053

This clearly shows the trade-off risk-averse owners are making between increased mean and
lower uncertainty. However, when we apply these standard deviations to the results from
Figure 13, we see that even the greater certainty might not be particularly helpful.
Figure 16
Team Risk Aversion Expected Point
Total
95% Range Bottom Limit Upper
Limit
1 High 1002 43.6388 980.1806 1023.819
2 High 1190 43.6388 1168.1806 1211.819
3 High 1040 43.6388 1018.1806 1061.819
4 High 1301 43.6388 1279.1806 1322.819
5 High 1356 43.6388 1334.1806 1377.819
6 High 1409 43.6388 1387.1806 1430.819
7 Low 1398 187.611 1304.1947 1491.805
8 Low 1394 187.611 1300.1947 1487.805
9 Low 1410 187.611 1316.1947 1503.805
10 Low 1523 187.611 1429.1947 1616.805
Analysis of Draft Results
These points seem to show the value of a strong positional schematic. Risk neutral
teams were rewarded in this system by being able to consistently outbid risk-averse teams, but
these teams were unable to bid on many high quality players. Because the auction runs from
good players to bad ones, usually based on relative value rather than pure points, owners like 8

and 10 swoop in early, bid up a player, and win him. They soon lose money and are very limited
for the majority of the auction. It is important we remember that every owner has to fill all
twelve of his roster spots and that every player commands at least one dollar. That means the
maximum an owner can spend on one player is not $200 as the salary cap implies, but rather
$189. Therefore, when an owner spends heavily in the beginning of a draft, he is severely
handicapped during the middle, as evidenced by teams 8 and 10. Team 10 bid and won the top
two players available (Aaron Rodgers and Chris Johnson), but was left with only fifty dollars to
fill ten roster spots, four of which were in his starting lineup. Owner 8 used a similar style,
drafting four of the next five players, including two quarterbacks. A league like this does not
incentivize having multiple quarterbacks, meaning the lack of sophisticated positional
influences was truly damaging. Positional influences are most important with quarterback and
tight ends because most leagues only play with one player at each position. Quarterback is,
therefore, the most damaging position to have weak positional influencesThis fits almost
exactly with the risk-averse owner’s model developed earlier. Risk neutral owners bid early, and
risk-averse owners are able to take advantage in the middle rounds of bidding.
Another interesting detail is that Teams 8 and 10 often ended up bidding head to head,
pushing the price up between the two because both were risk neutral and had high price
ceilings. To see the effects of risk neutral bidding, I ran an auction with owner 10 and nine
owners who were identical to owner 6. In this scenario, Owner 10 was able to retain several
good players for a relatively low price because the other owners had much lower maximum
prices. The result was a very high expected point total for team 10 – 1623. In short, if every
other owner is risk-averse, bidding in a risk neutral manner can be extremely effective.

The results seem to reiterate that Team 10 is consistently fairly strong, indicating that
that the high risk aversion coefficient was high enough to be irrational and that in most
environments, value based drafting and risk neutrality was an optimal tactic combination for
increasing utility. However, in an environment with multiple risk neutral bidders, bidding with
risk aversion might be an optimal strategy. For example, Team 6 was able to take advantage of
the bidding wars between the two riskier owners and came away with a very good likelihood of
success, as is evidenced by Figure 16.
Conclusion
Fantasy owners often appear too risk-averse, as was illustrated by the difference
between the coefficient on the regression of the fantasy auction prices on fantasy value and the
calculated risk expected. The auction simulations supported the idea that risk aversion values
are too high. The lower risk aversion values were far more successful in drafting a team with a
higher point total, implying a higher expected utility. It also appears that having strong
positional influences, as well as a value based drafting strategy is the best way to obtain a team
with high output.
Limitations
This study includes several key limitations, mostly due to the difficulties of a more
complete analysis. For example, most owners make minor adjustments to their teams week by
week. This is possible because NFL teams play only once per week and a player has different

expectations against different teams. These changes, however, would be extremely difficult to
consider when determining final point totals because they require a model for performance
against a given team, which requires many inputs to develop. Moreover, final point totals are
not always the metric for success in a league. Instead, teams are often paired against each
other, playing a “matchup” once a week. The team with the higher point total in that week wins
the matchup. League champions are often determined by winning percentage (or record) over
a season. This system is very common in fantasy football leagues but is very difficult to model.
Ultimately, the strong correlation between point total and winning percentage makes such a
model effectively unnecessary. The largest limitation, however, is the incomplete analysis of
injury and actual utility. Mean team points are strongly positively correlated with owner’s
utility, but the actual measure of owner utility is based on probability of winning the league,
which can only be determined by simulating multiple seasons and finding probabilities for each
draft strategy winning the league.
Extensions
This study could be extended to looking at the limitations above. It could also be applied
to further applications involving real sports leagues in the NFL draft. Many sports gambling
options include betting on draft outcomes, and developing a model for that field could prove
lucrative. I think the model shown above is helpful for fantasy owners and websites like ESPN to
develop their player valuations. These valuations can shape the way people draft, so a more
accurate valuation can differentiate a strong, parity-laden league from an unequal one.

Works Cited
Bryant, Joe. "Principles of VBD." Fantasy Forecast Magazine, June 7, 2001.
ESPN. ESPN Fantasy Football Scoring Leaders 2009. August 1, 2009.
http://games.espn.go.com/ffl/leaders?seasonId=2009&seasonTotals=true (accessed December
1, 2010).
PRIMARY SOURCE
Fry, Michael J, Andrew W Lundberg, and Jefrey W Ohlmann. "A Player Selection Heuristic for a
Sports League Draft." Journal of Quantitative Analysis in Sports, 2007: 5.
Harris, Christopher. "The Value Based Drafting Method." ESPN. July 4, 2010.
http://sports.espn.go.com/fantasy/football/ffl/story?page=nfldk2k10vbd (accessed December
5, 2010).
Sports Reference LLC. Pro Football Reference. June 1, 2010. http://www.pro-football-
reference.com/ (accessed December 1, 2010).
PRIMARY SOURCE