Embed Size (px)
Citation preview

Worcester Polytechnic Institute
Optimized Design of Gating/Riser System in
Casting Based on CAD and Simulation Technology
By
Feng Liu
A Thesis
Submitted to the Faculty
of the
WORCESTER POLYTECHNIC INSTITUTE
in partial fulfillment of the requirements for the
Degree of Master of Science
in
Manufacturing Engineering
By
_____________________
Feng Liu
December 2008
APPROVED:
Prof. Yiming (Kevin) Rong, Advisor,
Associate Director of Manufacturing and Materials Engineering,

i
Abstract
Casting as a manufacturing process to make complex shapes of metal materials in
mass production may experience many different defects such as porosity and incomplete
filling. How to improve the casting quality becomes important. Gating/riser system
design is critical to improving casting quality. The objective of the research presented in
this thesis is to optimize gating/riser systems based on CAD and simulation technology
with the goal of improving casting quality such as reducing incomplete filling area,
decreasing large porosity and increasing yield.
Therefore in the thesis, an optimization framework is presented based on CAD
and simulation technology. Given a CAD model of part design and after converted to a
casting model, it is the first step to evaluate castability of the casting design. Then the
runner and risers are represented parametrically, and CAD models generated by varying
parameters can be used in the simulation. After analyzing simulation results, the
gating/riser system design is optimized to improve casting quality.
In the thesis, one engine block is used to verify the effectiveness of the
optimization method. Compared with the initial design, it is found that the optimized
casting design can decrease porosity around 18% while the yield increases 16%.
ii
Acknowledgement
It is a great pleasure to express my gratitude to the people who have helped me
during my pursuit of master degree in Manufacturing Engineering Department at
Worcester Polytechnic Institute.
My deepest gratitude goes to Professor Yiming (Kevin) Rong, my advisor.
Professor Rong stimulates my interest of working in the area of computer aided casting
process optimization with this specific approach, and guides me through the whole
process. Without his support and encouragement, this thesis can never been completed.
My special thanks go to the advisory committee members.
I would also like to thank Dr. Qigui Wang and Mr. Gerald Baker at GM for their
assistance in my research.
I appreciate the great help from Dr. Gang Wang for his professional suggestions
on my research work and the preparation of my thesis.
The financial assistantship from WPI is highly appreciated.
I would also cherish the support from my wife and my family.
iii
Table of Contents
Chapter 1 Introduction .......................................................................................................................... 1
Chapter 2 Background ........................................................................................................................... 3
2.1 Sand Casting Processes .................................................................................................................... 3
2.2 Sand Casting Process Design ........................................................................................................... 4
2.3 Quality Problems in Sand Casting Process ...................................................................................... 7
2.4 Gating/Riser System ......................................................................................................................... 9
2.4.1 Gating System ........................................................................................................................10
2.4.2 Riser .......................................................................................................................................12
2.5 Current Gating/Riser Design and Optimization Methods ...............................................................16
2.6 Castability Analysis ........................................................................................................................17
2.6.1 Importance of Castability Analysis ........................................................................................17
2.6.2 Current Castability Analysis Methods ...................................................................................18
2.7 Problems Remained In Castability Analysis And Gating/Riser Design And Optimization ............20
2.8 Thesis Objectives ............................................................................................................................20
Chapter 3 System Framework ..............................................................................................................22
3.1 Workflow of the System Framework ..............................................................................................22
3.2 Castability Analysis ........................................................................................................................23
3.3 Casting Design Matrix ....................................................................................................................24
3.4 Casting System Design ...................................................................................................................25
3.5 Simulation Results Analysis and Gating/Riser Optimization ..........................................................25
Chapter 4 Castability Analysis .............................................................................................................26
4.1 Castability Analysis Workflow .......................................................................................................26
4.2 Modulus Based Castability Analysis Method .................................................................................27
4.3 Part Feature Recognition .................................................................................................................29

iv
Chapter 5 Gating/riser Optimization ...................................................................................................31
5.1 Optimization Objectives and Initial Conditions ..............................................................................32
5.2 Flow Chart of Optimization Process ...............................................................................................33
5.2.1 Runner Optimization ..............................................................................................................35
5.2.2 Riser Optimization .................................................................................................................49
Chapter 6 Summary and Conclusion ...................................................................................................54
6.1 Summary .........................................................................................................................................54
6.2 Conclusion ......................................................................................................................................55
6.3 Future Work ....................................................................................................................................55
Reference ......................................................................................................................................................57

v
List of Figures
Figure 2.1 Production steps in a typical sand casting process .................................... 3
Figure 2.2 Schematic illustration of a sand mold ....................................................... 4
Figure 2.3 Examples of sand casting .......................................................................... 6
Figure 2.4 Some defects in sand casting ..................................................................... 7
Figure 2.5 Example of porosity .................................................................................. 8
Figure 2.6 Cold-shut defect......................................................................................... 9
Figure 2.7 Misrun defect ............................................................................................. 9
Figure 2.8 Typical gating/riser system...................................................................... 10
Figure 2.9 Progressive solidification can cause a shrinkage..................................... 13
Figure 2.10 Too large feeding distance can cause shrinkage .................................... 16
Figure 2.11 Several castability guidelines examples ................................................ 19
Figure 3.1 Computer aided system workflow ........................................................... 22
Figure 4.1 Castability analysis flowchart.................................................................. 26
Figure 4.2 CAD model used to illustrate the calculation of modulus ....................... 27
Figure 4.3 Split body................................................................................................. 28
Figure 4.4 Example of calculating modulus ............................................................. 28
Figure 5.1 Current gating/riser system design .......................................................... 31
Figure 5.2 Flow chart of optimization process ......................................................... 34
Figure 5.3 Runner and its parameters ....................................................................... 35
Figure 5.4 Runner presented parametrically ............................................................. 36
Figure 5.5 Runner parameterized presentation ......................................................... 37

vi
Figure 5.6 The KBE system ...................................................................................... 37
Figure 5.7 Part used for knowledge fusion ............................................................... 38
Figure 5.8 Toolbar .................................................................................................... 40
Figure 5.9 The steps to produce templates ................................................................ 40
Figure 5.10 Runner created by using KF .................................................................. 41
Figure 5.11 Runner1 with parameters - 1 ................................................................. 44
Figure 5.12 Runner3 with parameters - 2 ................................................................. 44
Figure 5.13 Runner filling velocity simulation result ............................................... 46
Figure 5.14 Runner free surface simulation result .................................................... 46
Figure 5.15 Riser shape............................................................................................. 50
Figure 5.16 Final casting assembly ........................................................................... 53

vii
List of Tables
Table 5-1 Factors and Levels Used in Runner Optimization .................................... 43
Table 5-2 Orthogonal Matrix of Runner ................................................................... 43
Table 5-3 Example of time serial data obtained from simulation ............................. 47
Table 5-4 Simulation Results Analysis ..................................................................... 48
Table 5-5 Orthogonal Matrix of Riser ...................................................................... 50
Table 5-6 Simulation Results of Riser ...................................................................... 51
Table 5-7 Simulation Result Analysis of Riser......................................................... 52
1
Chapter 1 Introduction
Casting is a manufacturing process for making complex shapes of metal materials
in mass production. There are two main consecutive stages, filling process and
solidification process, in casting production. In filling process gating system composed of
pouring cup, runner, sprue, sprue well and ingate, is designed to guide liquid metal filling.
Riser system is used to compensate shrinkage caused by casting solidification. Casting
process design is important for production quality and efficiency.
It is unavoidable that many different defects occur in casting process, such as
porosity and incomplete filling. How to improve the casting quality becomes important.
Casting quality is heavily dependent on the success of gating/riser system design, which
currently is conducted mainly relied on technicians’ experience. Therefore there is a need
for the development of a computer-aided casting process design tool with CAD,
simulation, and optimization functions to ensure the quality of casting.
The objective of the research presented in this thesis is to optimize gating/riser
systems based on CAD and simulation technology with the goal of improving casting
quality such as reducing incomplete filling area, decreasing large porosity and increasing
yield.
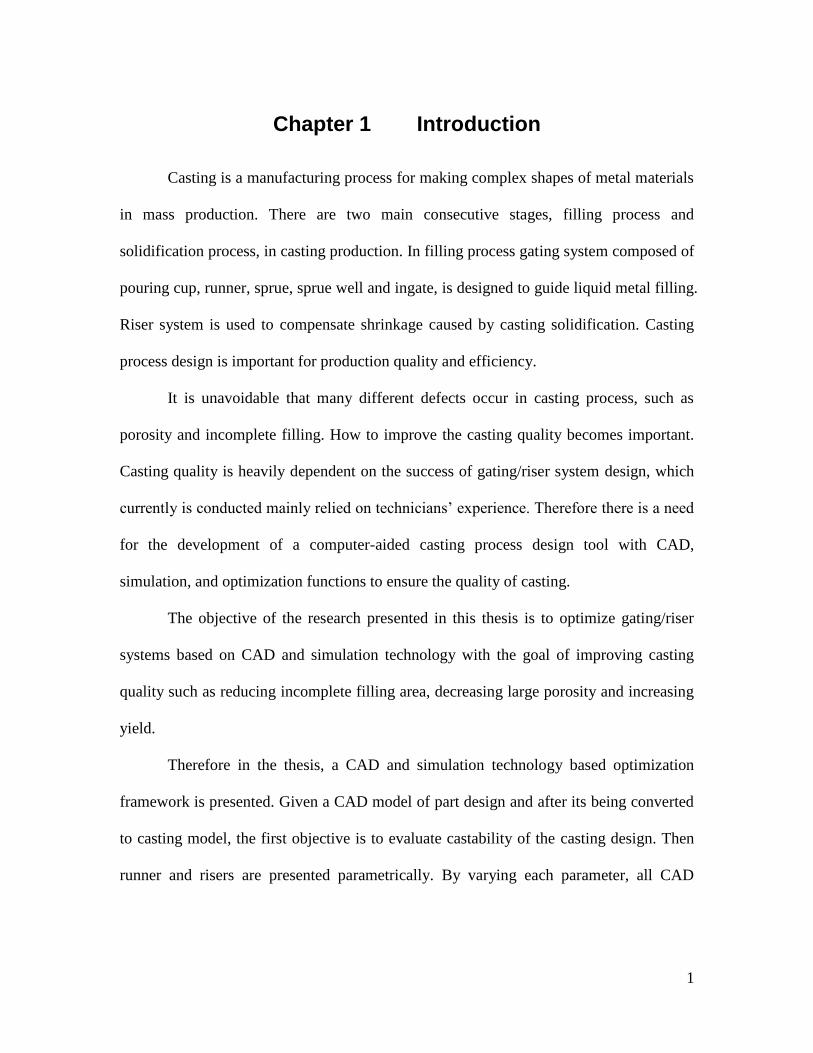
Therefore in the thesis, a CAD and simulation technology based optimization
framework is presented. Given a CAD model of part design and after its being converted
to casting model, the first objective is to evaluate castability of the casting design. Then
runner and risers are presented parametrically. By varying each parameter, all CAD

2
models will be obtained. After analyzing simulation results, the original gating/riser
system design will be optimized to improve casting quality.
In this thesis, one engine block is used to verify the effectiveness of the
optimization method. Compared with the initial design, the optimized casting assembly
can decrease porosity around 18% while the yield increases 16%.
3
Chapter 2 Background
This chapter provides an introduction to sand casting process. First the steps of
sand casting process are addressed. Then, considerations required for casting process
design are stated. Next, casting quality and some common defects are discussed. After
this, gating/riser system and castability analysis are explained in detail. Finally, the
remained problems of casting process design and the objective of the thesis are given.
2.1 Sand Casting Processes
Sand casting consists of placing a pattern (having the shape of the desired casting)
in sand to make an imprint, incorporating a gating system, filling the resulting cavity with
molten metal, allowing the metal to cool until it solidifies [21]
. Sand casting is still the
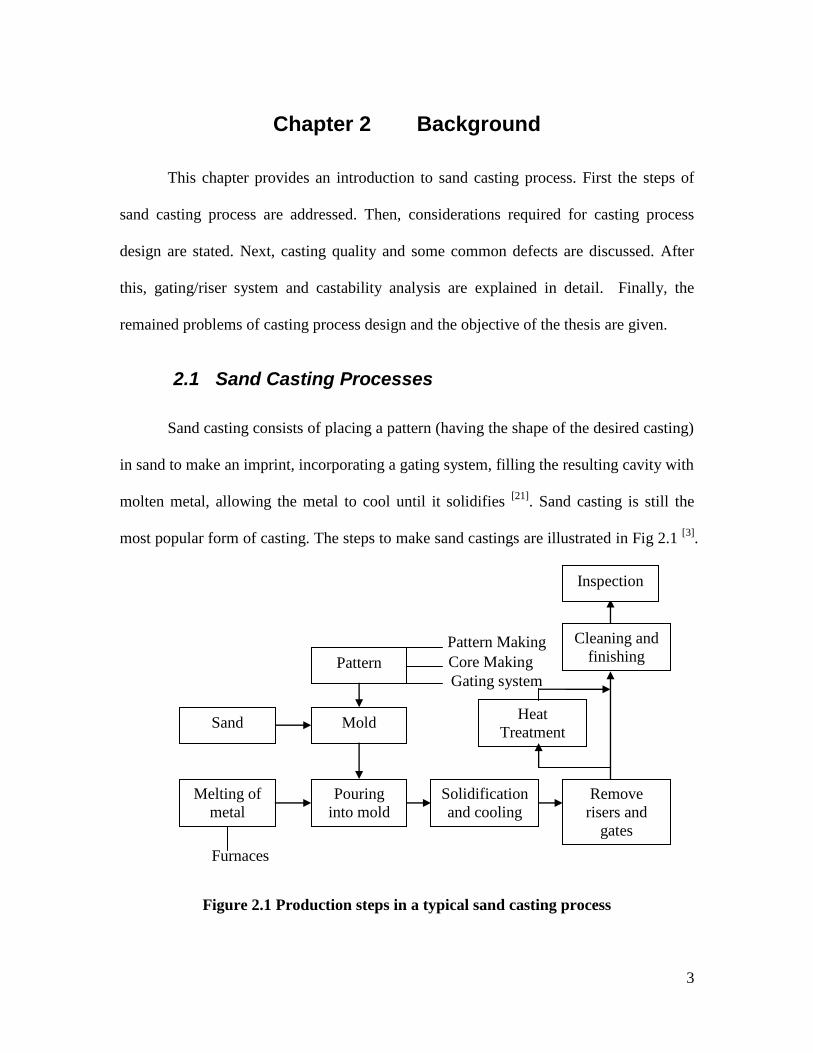
most popular form of casting. The steps to make sand castings are illustrated in Fig 2.1 [3]
.
Figure 2.1 Production steps in a typical sand casting process
Pattern
Mold Sand
Pouring
into mold
Melting of
metal
Solidification
and cooling
Remove
risers and
gates
Cleaning and
finishing
Heat
Treatment
Inspection
Pattern Making
Core Making
Gating system
Furnaces
4
Basically sand casting process consists of:
1) Placing a pattern (having the shape of the desired casting) in sand to make
an imprint;
2) Incorporating a gating system;
3) Removing the pattern and filling the mold cavity with the molten metal;
4) Allowing the metal to cool until it solidifies;
5) Breaking away the sand mold;
6) Removing the casting.
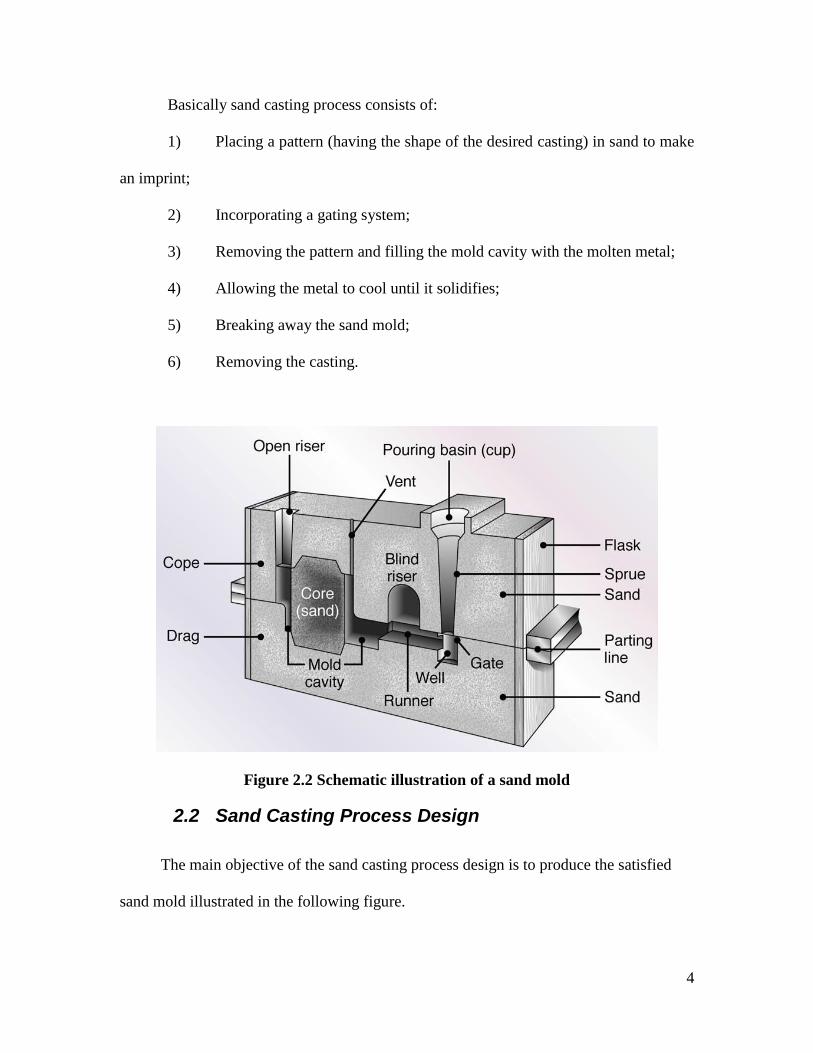
Figure 2.2 Schematic illustration of a sand mold
2.2 Sand Casting Process Design
The main objective of the sand casting process design is to produce the satisfied
sand mold illustrated in the following figure.

5
The typical sand casting process design consists of the following steps.
Sand Selection [3]
Several factors are important in the selection of sand for molds, and it involves
certain tradeoffs with respect to properties. Although fine-grained sand enhances mold
strength, the fine grains also lower mold permeability. Good permeability of molds and
cores allows gases and steam evolved during the casting to escape easily. The mold has
should have good collapsibility to allow for the casting to shrink while cooling and, thus,
to avoid defects in the casting, such as hot tearing and cracking.
Parting line
Parting line [3]
is the line or plane separating the upper and the lower halves of
molds. In general, the parting line should be along a flat plane rather than be contoured.
Whenever possible, the parting line should be at the corners or edges of castings rather
than on flat surfaces in the middle of the casting. It should be placed as low as possible
for less dense metals and located at around mid-height for denser metals.
Pattern design
The pattern [1]
is a replica of the object to be cast, used to prepare the cavity into
which molten material will be poured during the casting process. Patterns used in sand
casting may be made of wood, metal, plastic or other materials. Patterns are made to
exacting standards of construction, so that they can last for a reasonable length of time.
The mold is made by packing some readily formed aggregate material, such as
molding sand, around the pattern. When the pattern is withdrawn, its imprint provides the
mold cavity, which is ultimately filled with metal to become the casting.
6
During the design process of pattern, some considerations should be taken. For
example, the pattern needs to incorporate contraction allowances, which are suitable
allowances for shrinkage. And also it needs to incorporate suitable allowances for draft.
If the casting is to be hollow, as in the case of pipe fittings, additional patterns, referred to
as cores, are used to form these cavities.
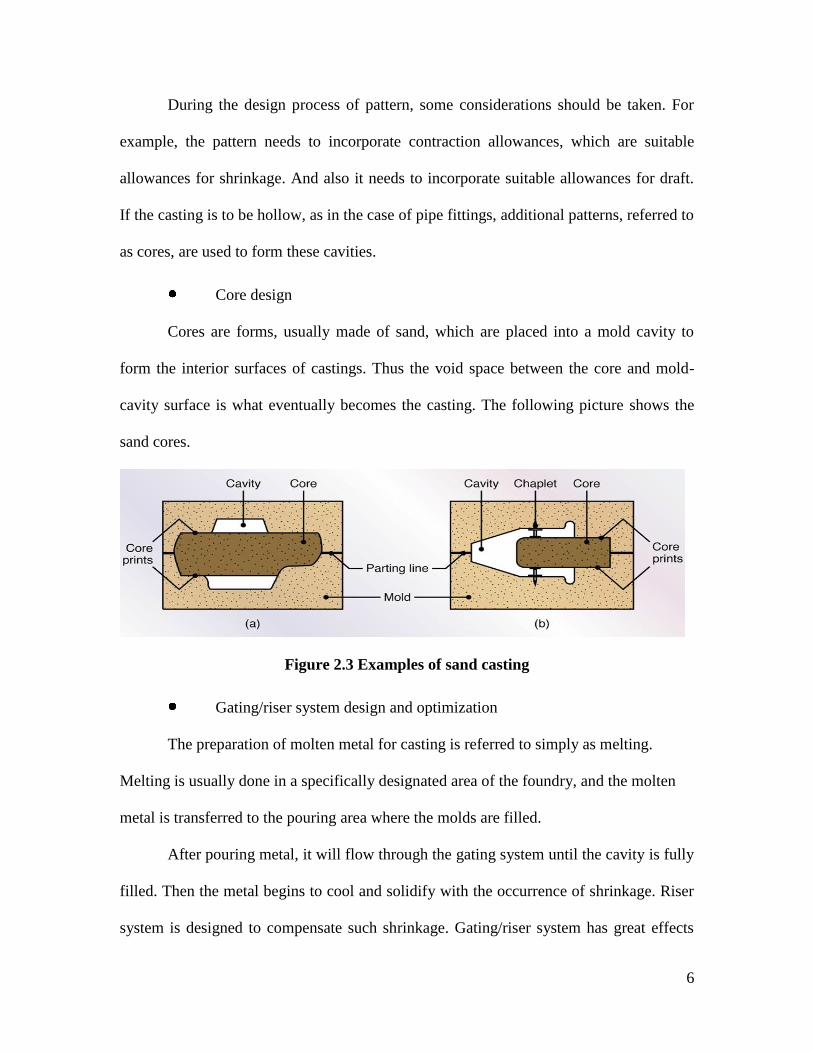
Core design
Cores are forms, usually made of sand, which are placed into a mold cavity to
form the interior surfaces of castings. Thus the void space between the core and mold-
cavity surface is what eventually becomes the casting. The following picture shows the
sand cores.
Figure 2.3 Examples of sand casting
Gating/riser system design and optimization
The preparation of molten metal for casting is referred to simply as melting.
Melting is usually done in a specifically designated area of the foundry, and the molten
metal is transferred to the pouring area where the molds are filled.
After pouring metal, it will flow through the gating system until the cavity is fully
filled. Then the metal begins to cool and solidify with the occurrence of shrinkage. Riser
system is designed to compensate such shrinkage. Gating/riser system has great effects

7
on the final quality of casting. A foundry can produce the best quality molds, cores and
molten aluminum and still end up with a poor quality casting by using poorly designed
gating and riser systems. So how to design a satisfied gating/riser system is very
important.
2.3 Quality Problems in Sand Casting Process
During the metal casting process, various defects can develop. They are illustrated
in figure 2.2 [6]
. It is important to improve the casting quality by eliminating or
minimizing the effects caused by those defects.
Figure 2.4 Some defects in sand casting

8
Two common defects in sand casting process are caused by porosity and
incomplete filling.
Porosity may be the most persistent phenomena in casting, and it is hard to be
eliminated completely. Porosity is harmful to the ductility of the casting and its surface
finish. Porosity in castings is due to bubbles being trapped during solidification. It may be
caused by shrinkage, or gases, or both. There are many factors contribute to the
development of porosity such as the entrapped air during filling, blowholes from
unvented cores, dissolved gases from melting, etc. Because liquid metals have much
greater solubility for gases than do solid metals, when a metal begins to solidify, the
dissolved gases are expelled from the solution. It will cause microporisty or accumulate
in regions of existing porosity.
Figure 2.5 Example of porosity
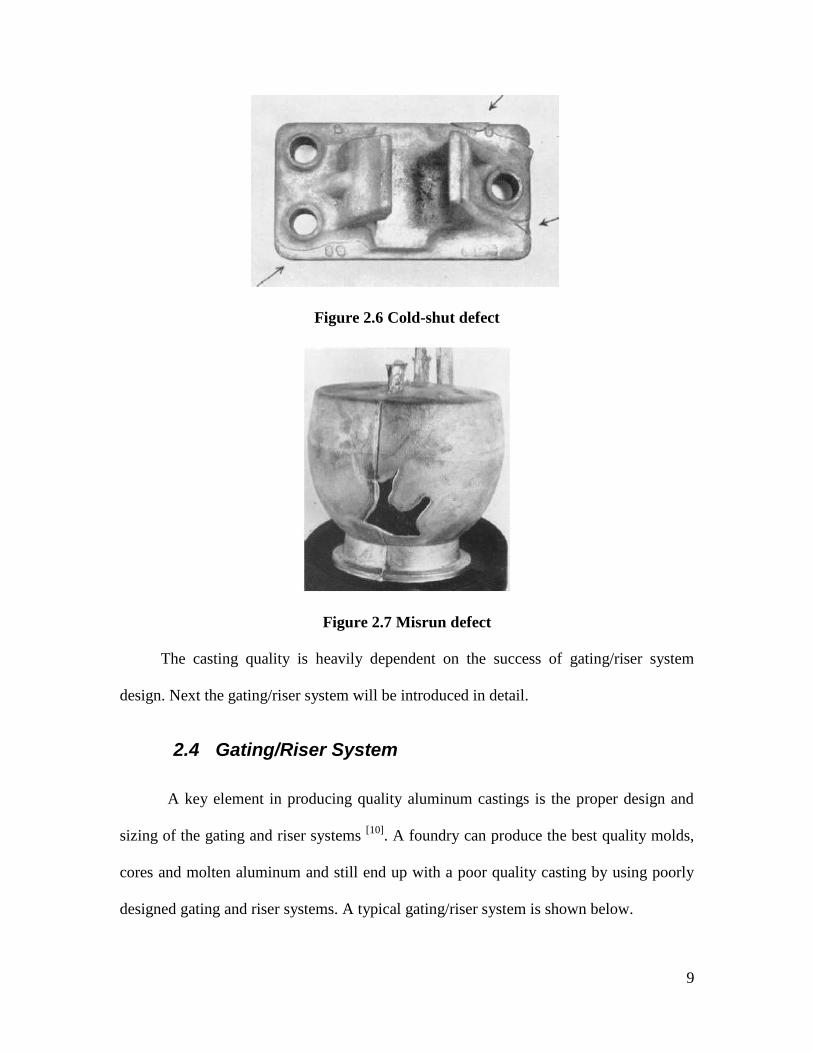
Incomplete filling [2]
is primarily caused by poor fluidity of molten metal, and
manifests in the form of a cold shut or misrun. A cold shut occurs when two streams of
molten metal coming from opposite directions meet, but don’t fuse completely. A misrun
occurs when the molten metal does not completely fill a section of the mould cavity. The
presence of surface oxides and impurities on the advancing front of liquid metal
aggravates such defects.
9
Figure 2.6 Cold-shut defect
Figure 2.7 Misrun defect
The casting quality is heavily dependent on the success of gating/riser system
design. Next the gating/riser system will be introduced in detail.
2.4 Gating/Riser System
A key element in producing quality aluminum castings is the proper design and
sizing of the gating and riser systems [10]
. A foundry can produce the best quality molds,
cores and molten aluminum and still end up with a poor quality casting by using poorly
designed gating and riser systems. A typical gating/riser system is shown below.

10
2.4.1 Gating System
The main objective [2]
of a gating system is to lead clean molten metal poured
from ladle to the casting cavity, ensuring smooth, uniform and complete filling. Clean
metal implies preventing the entry of slag and inclusions into the mould cavity, and
minimizing surface turbulence. Smooth filling implies minimizing bulk turbulence.
Uniform filling implies that all portions of the casting fill in a controlled manner, usually
at the same time. Complete filling implies leading molten metal to thin and end sections
with minimum resistance.
2.4.1.1 Fluidity of Molten Aluminum
Fluidity is the reciprocal of viscosity which measures the resistance of a fluid
being deformed by either shear stress or extensional stress. In general terms, fluidity
represents the extent of the molten aluminum to completely flow and fill the mold cavity.
The factors that have great influence on the fluidity include:
Figure 2.8 Typical gating/riser system
11
(1) Temperature: If the casting has thinner cross sections and if the pouring
temperature is low, misruns can be easily developed. So casting temperatures should be
just high enough to prevent flow misruns.
(2) Chemistry: Of the chemical elements added to aluminum alloys, silicon
has the greatest affect on fluid life. The higher the silicon level, the greater the fluid life.
While the chemistry of the alloy used also affects its solidification range. Pure metals,
eutectic alloys and narrow freezing range alloys tend to exhibit the best fluid life.
(3) Entrained gas and inclusions: It is easy to understand that both entrained
gas and inclusions tend to increase the viscosity of molten metal, so accordingly its
fluidity will be decreased.
2.4.1.2 Requirements of Gating System
There are many factors affecting the design of an ideal gating system. For
example, the gating system should be designed to allow the molten metal flow through
with the least amount of turbulence. It is a better design of the gating system that it can be
removed easily from the casting after filling. The gating system should be designed in
such a way to promote the directional solidification. After meeting other requirements of
gating system, it will also need lower yield.
2.4.1.3 Runner
Runner is typically located in the drag of the casting. Because molten aluminum
often changes its direction during the flow process in the runner, turbulence often
accumulates. For a good runner design, it must not promote turbulence. There are some
12
useful experience in real foundry such as always use radiuses corners, never sharp
corners, etc.
As described earlier, two primary requirements of a gating system are to prevent
cold shuts and misruns during mold filling. To meet these requirements, all the gates
must be feeding at the same time. This can be accomplished by stepping down the runner
as each gate is passed. In real foundry environment, engineers prefer to taper the runner
without stepping down to decrease the turbulence.
2.4.1.4 Gates
Gates are the inlets into the mold cavity. The gates can be no thicker than the
casting section to which they are attached. Even more it usually is best to have the gates
slightly thinner than the casting section. If the gating system is not completely filled
during the entire pour, it will not function correctly, and defective castings can result.
2.4.2 Riser
A riser [1]
or a feeder is a reservoir built into a metal casting mold to prevent
cavities due to shrinkage. Because metals are less dense as liquids than as solids (with
some exceptions), castings shrink as they cool. This can leave a void, generally at the last
point to solidify. Risers prevent this by providing molten metal at the point of likely
shrinkage, so that the cavity forms in the riser, not the casting.
2.4.2.1 Solidification
After molten metal is poured into a mold, solidification will take place. In the
casting process, solidification plays a critical role because the speed at which
13
solidification occurs largely determines the mechanical properties of the casting. The
faster the solidification rate, the finer the solidified structure and the higher the
mechanical properties.
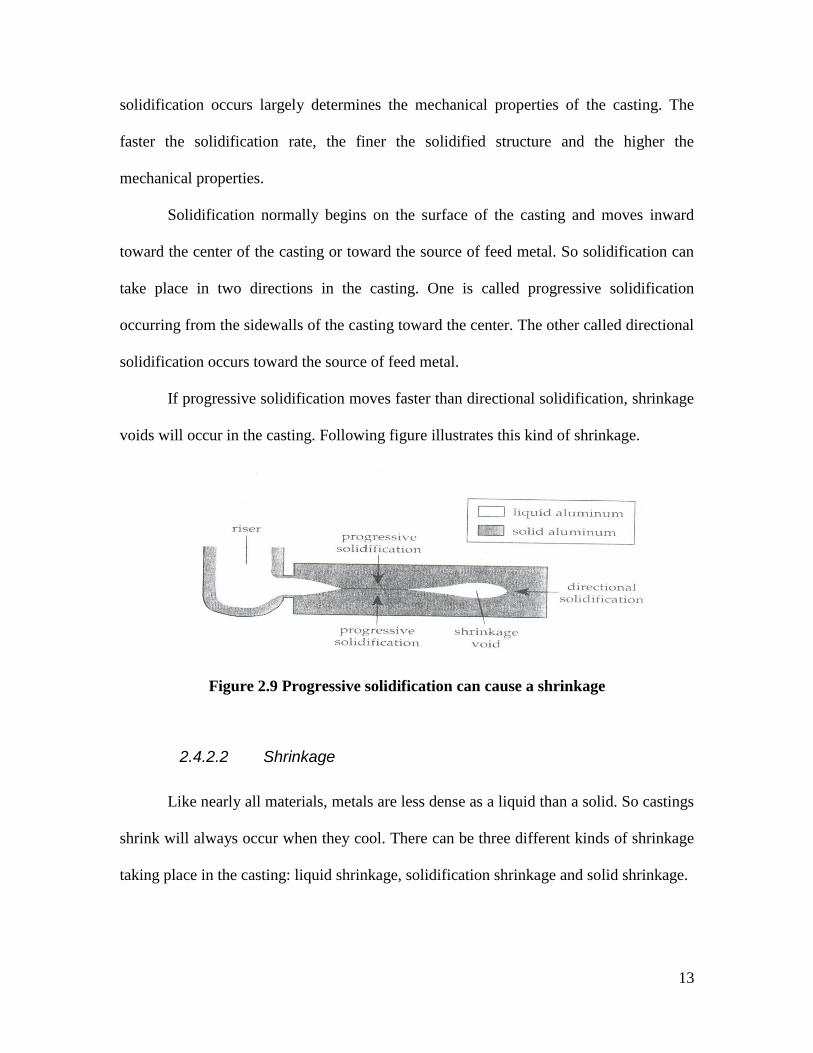
Solidification normally begins on the surface of the casting and moves inward
toward the center of the casting or toward the source of feed metal. So solidification can
take place in two directions in the casting. One is called progressive solidification
occurring from the sidewalls of the casting toward the center. The other called directional
solidification occurs toward the source of feed metal.
If progressive solidification moves faster than directional solidification, shrinkage
voids will occur in the casting. Following figure illustrates this kind of shrinkage.
Figure 2.9 Progressive solidification can cause a shrinkage
2.4.2.2 Shrinkage
Like nearly all materials, metals are less dense as a liquid than a solid. So castings
shrink will always occur when they cool. There can be three different kinds of shrinkage
taking place in the casting: liquid shrinkage, solidification shrinkage and solid shrinkage.
14
Liquid shrinkage takes place when the molten metal cools. Solidification
shrinkage occurs from the time the first solid metal appears until the casting is completely
solid. Risers can be used to compensate these two types of shrinkage. Solid shrinkage is
often called “patternmaker’s shrink” because a patternmaker can make a slightly larger
pattern than the finished casting dimensions to compensate for the solid shrinkage. The
casting cools to ambient temperature after it is completely solidified. During this time,
solid shrinkage takes place.
2.4.2.3 Riser Design
Risers are used to compensate for liquid shrinkage and solidification shrinkage.
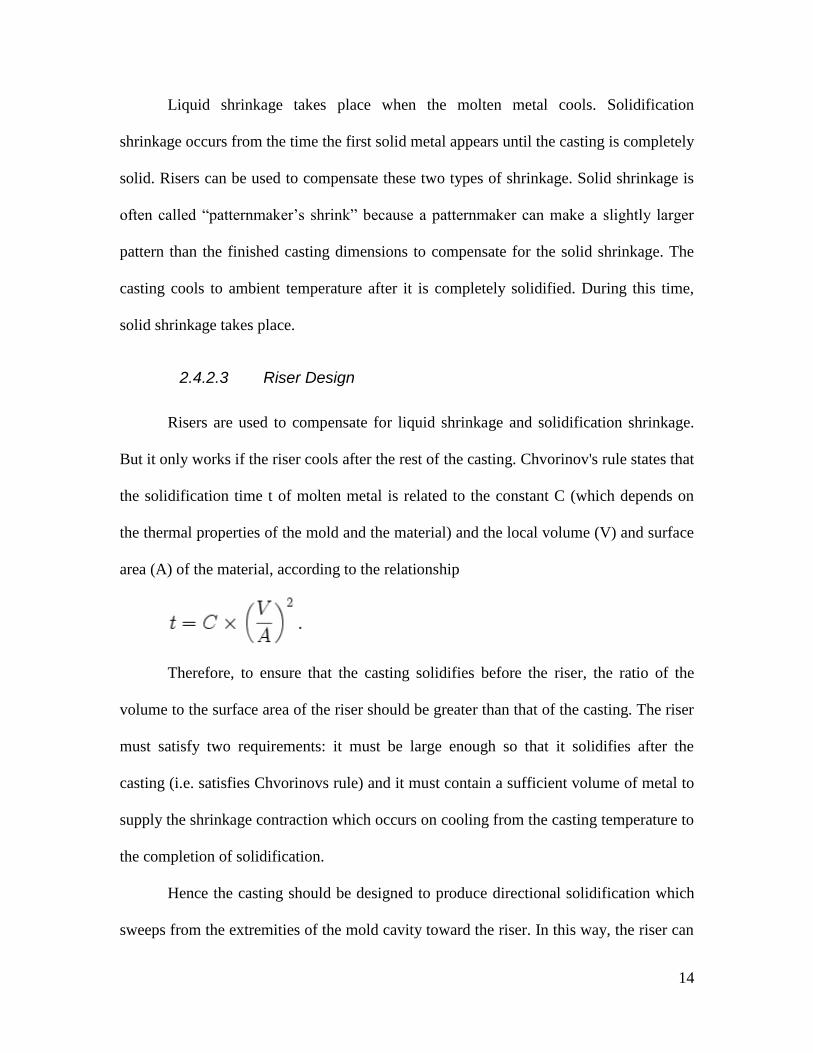
But it only works if the riser cools after the rest of the casting. Chvorinov's rule states that
the solidification time t of molten metal is related to the constant C (which depends on
the thermal properties of the mold and the material) and the local volume (V) and surface
area (A) of the material, according to the relationship
Therefore, to ensure that the casting solidifies before the riser, the ratio of the
volume to the surface area of the riser should be greater than that of the casting. The riser
must satisfy two requirements: it must be large enough so that it solidifies after the
casting (i.e. satisfies Chvorinovs rule) and it must contain a sufficient volume of metal to
supply the shrinkage contraction which occurs on cooling from the casting temperature to
the completion of solidification.
Hence the casting should be designed to produce directional solidification which
sweeps from the extremities of the mold cavity toward the riser. In this way, the riser can
15
feed molten metal continuously and will compensate for the solidification shrinkage of
the entire mold cavity. If this type of solidification is not possible, multiple risers may be
necessary with various sections of the casting solidifying toward their respective risers.
(1) Riser shape
Because it is required that the ratio of the volume to the surface area of the riser
should be greater than that of the casting, the riser’s geometric shape should be adjusted
to have a larger ratio. For a given volume of molten aluminum, the shape selected should
have the least possible amount of surface area.
(2) Riser size
Currently riser size can be calculated with the aid of modulus. As described in
chapter 3, modulus equals to the ratio between its volume and its surface area. The
modulus method compares the modulus of the riser and that of the casting or section to be
fed. Most literatures say the modulus of the riser should be 20% larger than that of
section being fed. This method can also be used to determine the size of riser neck. It is
commonly agreed that the modulus of the riser neck should be 10% larger than that of the
section being fed.
(3) Feeding distance
The distance a riser can deliver feed metal into the casting section to which it is
attached is called its feeding distance. If the feeding distance of one riser exceeds its limit,
it will become ineffective and shrinkage may be produced.

16
Figure 2.10 Too large feeding distance can cause shrinkage
Feeding distance of risers is determined by the alloy being poured and by the
thickness of the section being fed. For aluminum castings, the following formula can be
used to approximate the theoretical feeding distance of a hot riser:
FD = 2T
In the above equation, FD is the feeding distance and T is the thickness of the
section being fed.
Because gating/riser system is important in guaranteeing the casting quality, there
is a need to optimize the gating/riser system.
2.5 Current Gating/Riser Design and Optimization
Methods
Researchers and foundry engineers have taken many investigations on the
correlation between gating/riser parameters with casting quality [22] [23]
. Although there
were some general guidelines for gating/riser system design, the variations in casting
parameters chosen by different researchers have led to significant difference in empirical
guidelines [24] [25]
.
Traditionally gating/riser system design was performed by engineers’ own
experience. It is high cost to do trial and error practice to find the optimal gating/riser

17
system design. The first application of numerical optimization methodology to optimize a
gating system was conducted [27]
. Later the computer modeling enabled visualization of
mold filling and casting solidification which made the gating/riser system design and
optimization cost-effectively. Numerical simulators based on FDM and FEM methods
provide powerful means of analyzing various phenomena occurring during the casting
process [28]
.
In the casting process, there are lots of factors contribute to the final result of
casting quality. It is unrealistic to find and use all factors, so most cases some factors may
be selected to conduct investigation. The gating/riser system can be optimized by
comparing the simulation results output from casting simulation software. In previous
study the simulation technology was used to design and optimize gating system [30]
. And
Taguchi method with multiple performance characteristics was also used to optimize the
gating system parameters [26]
. In this research, the author selected four independent gating
parameters of ingate height, ingate width, runner height and runner width. By analyzing
the simulation results from MAGASOFT, the optimal gating system could be produced.
2.6 Castability Analysis
Castability analysis can help engineers evaluate if one part is suitable for casting.
It will decrease cost if sound castability analysis can be done before real casting process.
2.6.1 Importance of Castability Analysis
Castability analysis is an important step in sand casting process. It may include
two tasks. Given a cast part, the first task is to evaluate if the part can be produced with
casting method. The second task focuses on analyzing the structural layout of the cast
18
part, such as the better position of the gating, the optimized number and position of risers,
etc.
Only after castability analysis, it can be rightly determined if a part is suitable for
casting. If not, some suggestions should be given to design engineers and it is helpful for
them to make modifications. And the more important thing is it can help engineers get the
right positions to integrate gating and risers, which has great effects on the final casting
quality.
2.6.2 Current Castability Analysis Methods
Before castability analysis was totally based on technicians’ experience. Now
CAD and simulation technology become more mature, more efforts have been paid to
computer aided castability analysis. Professor B. Ravi from Indian Institute of
Technology has done a lot related work. According to his description, there are three
major approaches for castability analysis: process simulation, parametric cost estimation
and features-based castability checks.
Casting simulation relies on computer aided technologies to simulate all aspects
of casting process such as mould filling, solidification, grain structures, etc. If solid
models of product and material properties of part and mould can be given, theoretically it
can simulate all phases of casting process. Based on the simulation result, it can predict
casting defects such as shrinkage porosity, hard spots and cracks. But for this method, it
has some drawbacks such as it requires considerable expertise which it may not be easily
available to product designers.
If the casting cost exceeds the limit of financial plan, the casting process can’t
meet the requirement either. So casting cost estimation is also important. Different kinds
19
of parameters relate to the casting cost such as material property, the complexity of the
part, quality specifications, type of parting lines, the number and the shape of risers, etc.
The coefficients must be continuously updated to adjust for the current rates of material,
labour and energy.
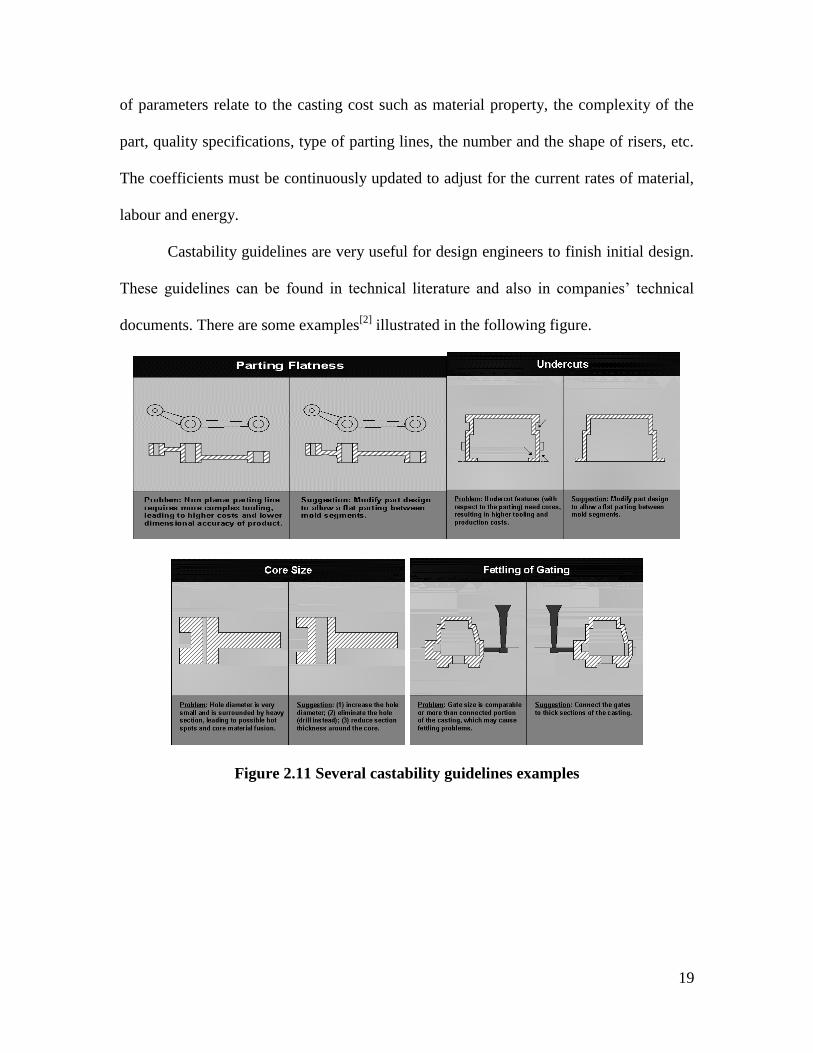
Castability guidelines are very useful for design engineers to finish initial design.
These guidelines can be found in technical literature and also in companies’ technical
documents. There are some examples[2]
illustrated in the following figure.
Figure 2.11 Several castability guidelines examples
20
2.7 Problems Remained In Castability Analysis And
Gating/Riser Design And Optimization
Although CAD and simulation technology makes sand casting process design
more efficient, there are some remained problems needs more consideration.
Currently castability analysis is mostly based on the experts’ experiences. But it is
difficult to convert these experiences into computer readable knowledge rule. How to
find quantity methods to do castability analysis is important.
As just mentioned, the success of gating/riser system design has great effects on
the final quality of casting. How to optimize gating/riser system is important. Currently
the gating/riser system design and optimization can be implemented by running
simulation software and analyzing simulation results. But given a CAD model and
possible parameters to change in the experiment, it is also important to know how to
semi-automatically or even automatically get all possible CAD models. Unfortunately
this kind of research wasn’t found in previous work.
2.8 Thesis Objectives
The objectives of this thesis are:
1) To provide the system framework for the computer-aided casting process
design tool
2) To propose a method for castability analysis. With the aim of locating the
possible hot spots, this method calculates and compares modulus of inputted CAD model

21
3) To change parameters of runner and risers or build templates of
gating/riser system. This will provide a semi-automatically way to build all CAD models
of runners and risers, which are the input of simulation software.
4) To design a method to optimize gating/riser system based on CAD and
simulation technology in order to reduce large porosity, decrease incomplete filling area,
and increase yield

22
Chapter 3 System Framework
This chapter presents the computer aided casting process design framework based
on CAD and simulation technology. First the workflow of the framework is addressed.
Then some steps in the workflow are explained in detail.
3.1 Workflow of the System Framework
The workflow of the framework is illustrated in Fig 3.1.
Figure 3.1 Computer aided system workflow
For a given CAD model, the first step of the process will include a complete
conceptual casting process design such as locating the parting line, initial design of
gating/riser system, casting parameters definition, possible casting defects prediction, etc.
In the next step, the part CAD model will be converted to casting model, which is heavily
dependent on the result of castability analysis. After completing casting model
Casting
Design
Optimization
Part CAD Model
Conceptual casting
process design
Casting Model Castability Analysis
Casting Design
Matrix
Simulation
Result Analysis Output the optimized
casting design
Casting system
design

23
parametrically, the casting design matrix can be generated with some selected parameters.
Consequentially all casting design models based on the matrix can be generated as input
to the simulation software. After analyzing simulation results, it will output the optimized
casting system design.
In this chapter, the steps of castability analysis and gating/riser system
optimization will be further explained.
3.2 Castability Analysis
It is important to verify the suitability of the given casting CAD model. When it is
not suitable, engineers may have interests in getting help from the output suggestions to
know the possible reasons.
Castability implies ease of producing a casting, minimizing cost, defects and lead-
time. This is facilitated by high compatibility between product requirements and process
capabilities [2]
. There are many factors may affect the castability of one casting product.
In the view of product design, three aspects will influence its castability such as material
selection, part geometry and quality specifications [2]
.
Part material is usually selected to satisfy the functional requirements of the
product, based on mechanical, physical and chemical properties such as tensile strength,
melting point and corrosion resistance. Cast metals are characterized by their casting
properties such as pouring temperature, fluidity, volumetric shrinkage during
solidification and slag/dross formation tendency. These influence the casting quality in
terms of dimensional stability and internal integrity.
Part geometry directly affects the complexity and number of tooling elements
(pattern and cores) and therefore their cost. The location of the parting line depends on
24
the extent of undercuts, which in turn depends on internal features in the part. Part
geometry also influences progressive directional solidification which governs internal
integrity. Long thin sections are difficult to fill. Critical surfaces can be planned in drag
section of the mould to ensure a dense and smooth casting sub-surface free from any
inclusions. For heavy parts, lifting arrangements can be provided to facilitate handling
during machining, assembly and shipping.
Quality specifications include defect-free surfaces, internal soundness (often
pressure tightness), dimensional accuracy and the desired surface roughness. Some of the
major defects that lead to rejection include macro shrinkage, cracks, blowholes, gas
porosity, sand/slag inclusions and cold shuts. Other defects, such as micro-porosity (in
non-critical sections), dimensional inaccuracy and rough surface will lead to rejection
only if quality specifications are stringent. Problem features such as excess rib thickness,
inadequate fillet radius, narrow holes and tight tolerances are quite common in cast
components, which result in high percentage of defects and avoidable labor costs for
repair work. Specifying a particular quality testing method (such as radiography and
pressure testing) should be justified for the desired quality level, which will otherwise
increase the manufacturing cost.
3.3 Casting Design Matrix
Most CAD software has embedded functions to support modeling parametrically.
For example, the runner with the circle cross section can be modeled with the parameters
of the radius of the circle and the length of the runner. And if each parameter takes two
possible values, it can produce the 2×2 design matrix. In the thesis, the similar method
will be used to get the design matrix of runner and risers.

25
3.4 Casting System Design
Based on the casting design matrix, all possible casting models as an input to
simulation software can be generated with CAD technology. In the thesis, two methods
are applied to produce the CAD models semi-automatically. One method is totally
dependent on the internal parametrical function provided by UG. If the runner or riser is
modeled parametrically, each parameter is expressed as a string name. The CAD models
will be changed and updated accordingly with the variation of expression values. The
implementation of the other method relies on the knowledge fusion module embedded in
UG. It has several advantages over the first method such as help users build more
comprehensive rules, let users develop their own user interface, and facilitate users
connecting with outer data sources.
3.5 Simulation Results Analysis and Gating/Riser
Optimization
It should be firstly to process simulation results such as extracting useful
information, formulating problem definitions, etc.
Gating/riser design can be optimized with the simulation results analysis. In the
first step, the optimization objectives should be defined well. Then range analysis method
is used to analyze the results and get the optimized gating/riser system.
In this chapter, the system framework is addressed and some of work that will be
studied in this thesis is briefly introduced. In the next chapter, the castability analysis will
be explained in detail.
26
Chapter 4 Castability Analysis
This chapter presents a modulus based castability analysis method. First, the
castability analysis workflow in this thesis is illustrated. Then, the modulus based
castability analysis method is explained in detail.
4.1 Castability Analysis Workflow
In the casting design process, at least two aspects, material selection and part
geometry, influence the part castability. Mechanical, physical and chemical properties
such as tensile strength, melting point and corrosion resistance, etc. will affect the part’s
castability. If the part has higher complicated shape and structure, it will make flowing
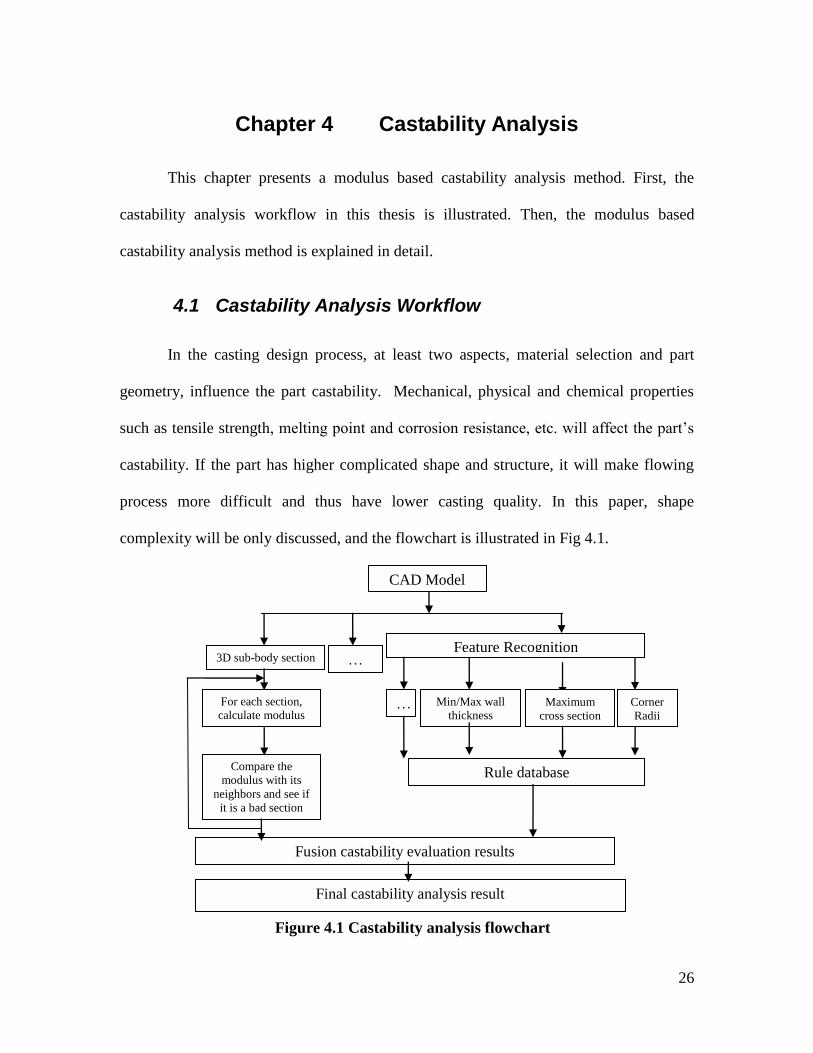
process more difficult and thus have lower casting quality. In this paper, shape
complexity will be only discussed, and the flowchart is illustrated in Fig 4.1.
CAD Model
3D sub-body section
For each section,
calculate modulus
Compare the
modulus with its
neighbors and see if
it is a bad section
Feature Recognition
Corner
Radii
Rule database
Fusion castability evaluation results
Final castability analysis result
Maximum
cross section
Min/Max wall
thickness …
..
…
Figure 4.1 Castability analysis flowchart

27
4.2 Modulus Based Castability Analysis Method
Casting modulus M is defined as the ratio between the casting volume V and the
cooling surface area A, that is M = V/A. With modulus calculation it becomes possible to
predict hot spot occurrence because of the fact that the isolated hot spot is located in
regions of high modulus surrounded by regions of lower modulus.
For example, considering a cylinder, its modulus is M=r*h/2*(r+h) if all its
surfaces have cooling effects, in which r represents the radius and h represents the height.
For simple geometry shape, it is easy to calculate its modulus. But in most cases, due to
the casting model’s complexity, it is hard to get the exact modulus values. There are
some research works focusing on how to calculate modulus in different situations.
In this thesis, relying on the volume calculation function provided by the UG, the
modulus is calculated based on its definition. If the given CAD model is like the one in
Fig 4.2, the steps to calculate the modulus are listed below:
Figure 4.2 CAD model used to illustrate the calculation of modulus
Flow
Direction
Coordinate
X
Z
Y

28
(1) split the body
Given an input CAD model, its bounding box can be obtained, Xmax, Ymax and
Zmax, and we can split it into Sn sub-bodies, each of them can be represented as Msi.
(2) Calculate modulus
Figure 4.3 Split body
Suppose we only split the body along X and Z direction, the resulted split bodies
are shown in Fig 4.3. For each sub-body, according to the definition of modulus, it can be
calculated. Take Ms2 as an example (Fig 4.4):
Figure 4.4 Example of calculating modulus
Ms1
Ms2
Ms3
Cooling surface S2

29
The modulus can be calculated as the ratio between the volume and the cooling
surface area. Its Volume, V, can be easily obtained by using the internal function
provided by UG. The exterior surface in this example can be treated as cooling surface.
So the modulus is:
M2 = V/Area of S2
(3) Evaluate the castability by using modulus
In the similar way, all sub-bodies’ modulus can be obtained with the
representation of a map like: M(i,j,k). i is X index, j is Y index and k is Z index. Then
compare the current modulus with all its neighbor spots. Its algorithm can be illustrated
as below:
For (i =0; i<Nmaxx; i++)
{
For(j =0; j< Nmaxy; j++)
{
For( k=0; k<Nmaxz; k++)
{
If(M(i,j,k) > M(i,j,k-1))
Return “it is a bad spot”
}
}
}
In the end, get the number of bad spots, and calculate the ratio between this
number and the total number of sub-bodies. If the ratio exceeds the predefined value, this
part can be thought as not suitable for casting.
4.3 Part Feature Recognition
Part geometry influences progressive directional solidification (from thin to
thicker to thickest regions). Some special features recognition can help engineers evaluate
the part’s castability analysis.
(1) Sudden variations in section thickness
30
Sudden variations in section thickness can cause turbulence during filling process.
So it is good to avoid sudden variations. Take the model in Fig 3.3 as an example, along
the flow direction, and use m reference planes to create m section planes. Then for each
section plane, get its width and compare the width with its previous section plane. If the
number of section planes having sudden variations exceeds the predefined value, the part
can be evaluated as not suitable for casting.
(2) Sharp corner
Sharp corner has the nearly same problems as sudden variations. For each corner
in a given CAD model, it is easy to get its radii from the function in Unigraphics. If the
value is smaller than the predefined value, it can be deemed as a sharp corner. And if the
total number of sharp corners exceeds the predefined valve value, the part can be thought
of not good for casting.
(3) Long thin section
If one part has long thin section, it is difficult to fill completely. For a given
section plane, calculate the ratio between its length and width. If the ratio is bigger, that
section is thought as long thin section. In the end, if the total number of long thin sections
exceeds predefined values, the part might be not good for casting.
In this chapter, the castability analysis workflow is introduced, and the modulus
based castability analysis method is detailed explained. In the next chapter, the
gating/riser system optimization method will be addressed.

31
Chapter 5 Gating/riser Optimization
This chapter presents gating/riser system optimization process. One engine block
is used to illustrate this process. First, the current gating/riser system of the engine block
is presented. Then, runner and riser optimization process is explained. Finally, the
simulation results are analyzed and that the optimized casting system assembly is
determined.
One engine block is used to illustrate the optimization process. Its current
gating/riser system is shown in the following figure.
Liquid metal pours by using low pressure pump and passes through runner.
Because the velocity at the entry of the runner is very high, the end area of the runner has
been increased to reduce the velocity. Filling is not uniform because the gates that
connect the risers and runner are straight. There are 10 risers on the each side and they
interconnected with each other. All risers are feeding the thick sections of casting under
gravity.
Figure 5.1 Current gating/riser system design
32
Conventional gravity pouring of aluminum alloys results in turbulent flow and the
formation of oxides in the casting is predominant. To overcome this problem, counter
gravity filling of the liquid aluminum from the bottom of the mould has become the
preferred method of casting. But this method has one major disadvantage of slow
production rates. So currently the method was used of disconnecting the mould from the
filling system and rotating the mould while the casting was still liquid. Once the mould
and casting are rotated through 180o the risers which supply liquid metal during the
solidification phase of the cast process are on top of the casting and gravity feed the
required liquid metal into the contracting casting.
There are three major problems in the current casting system.
(1) Filling incompletely of runner;
(2) Riser can’t feed effectively with the result of some large porosity;
(3) Lower yield. Yield equals to the ratio between the weight of casting and
sum of casting weight and the gating/riser weight.
So there exists the need to optimize the current gating/riser system to solve the
above problems.
5.1 Optimization Objectives and Initial Conditions
Based on the problems of the current gating/riser system, the main optimization
objectives include:
(1) To fill completely in the runner;
(2) To produce less porosity;
(3) To have high yield.

33
In the optimization process, the gating/riser system layout will be similar as the
current one. But their geometric shape and size will be optimized and changed. Other
initial conditions will the same as those currently used, which include:
(1) pump: the cross section shape of the pump is circle and its area at the
beginning is 1963mm2;
(2) flow rate: 920cm3/sec;
(3) Material: aluminum alloy
(4) Melting temperature: 720oC
(5) Liner material: cast iron
(6) Chill material: steal
5.2 Flow Chart of Optimization Process
For this specific engine block, its gating system only includes runner. So the
optimization process consists of two major tasks. One is the optimization of the runner,
and the other one is the optimization of riser. Both optimizations have similar steps. In
the first step, the cross section shape is defined. Then the parameters representing runner
or riser are listed and used for building design matrix. By varying each parameter, all
CAD models are produced semi-automatically. After getting simulation results, the
optimized gating/riser system and the whole casting system assembly are output.

34
Figure 5.2 Flow chart of optimization process
Runner
Optimization
Define cross section shape of runner
List parameters representing runner
Get design matrix
CAD model generation and input to
the simulation software
Analyze simulation results
and optimize the runner
Riser
Optimization
Define the shape of riser
List parameters representing riser
Get design matrix
CAD model generation and input to
the simulation software
Analyze simulation results,
and optimize the riser
35
5.2.1 Runner Optimization
As a key element in the gating system, the objectives of runner optimization
should include many goals. In this thesis, only filling surface area and maximum filling
velocity will be considered.
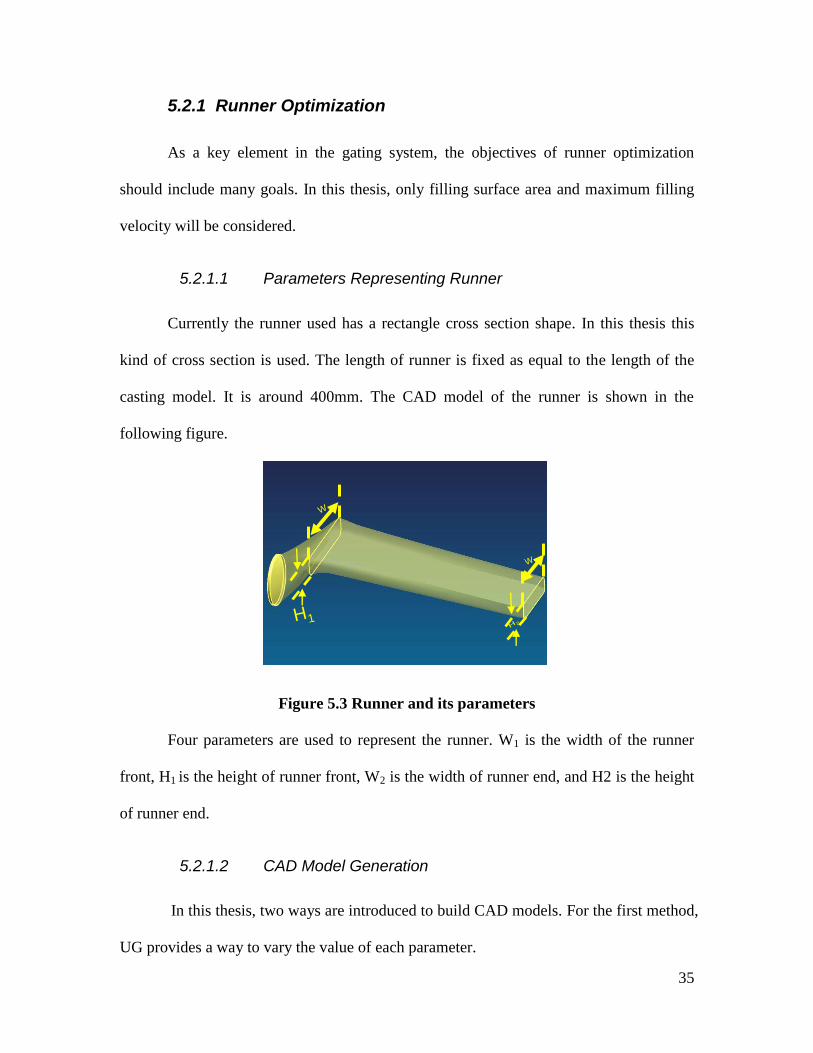
5.2.1.1 Parameters Representing Runner
Currently the runner used has a rectangle cross section shape. In this thesis this
kind of cross section is used. The length of runner is fixed as equal to the length of the
casting model. It is around 400mm. The CAD model of the runner is shown in the
following figure.
Figure 5.3 Runner and its parameters
Four parameters are used to represent the runner. W1 is the width of the runner
front, H1 is the height of runner front, W2 is the width of runner end, and H2 is the height
of runner end.
5.2.1.2 CAD Model Generation
In this thesis, two ways are introduced to build CAD models. For the first method,
UG provides a way to vary the value of each parameter.
W 1
H2
W 2
H1
36
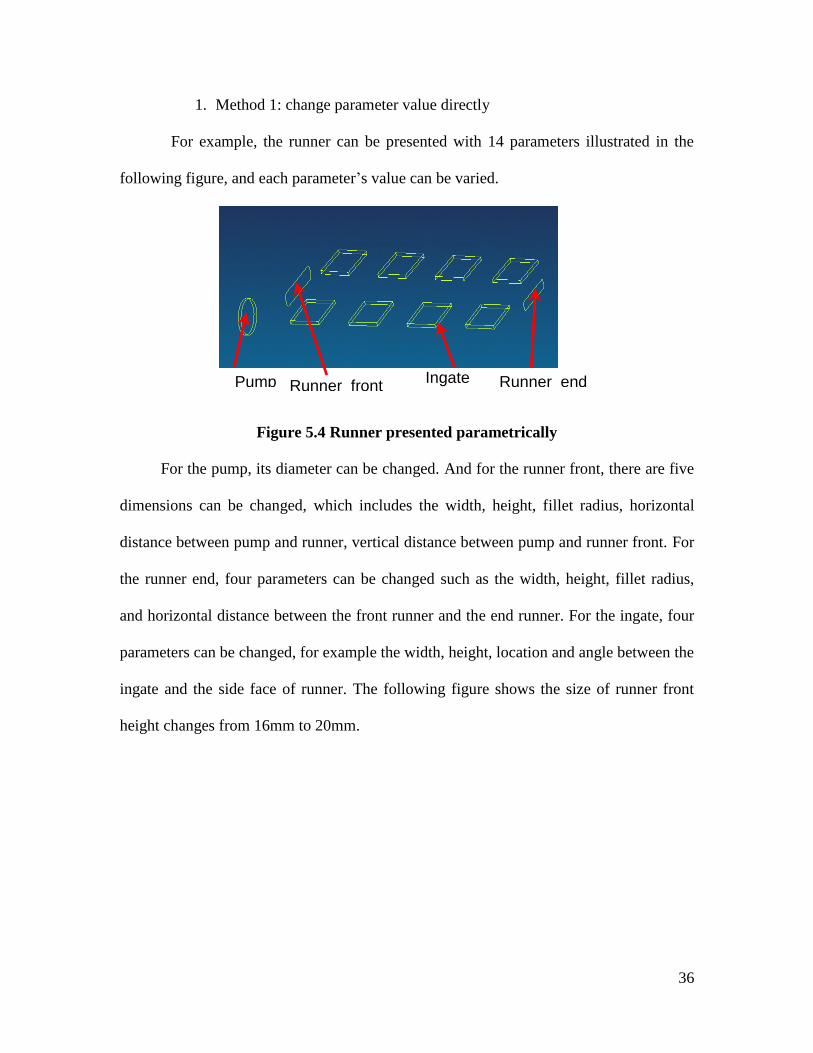
1. Method 1: change parameter value directly
For example, the runner can be presented with 14 parameters illustrated in the
following figure, and each parameter’s value can be varied.
Figure 5.4 Runner presented parametrically
For the pump, its diameter can be changed. And for the runner front, there are five
dimensions can be changed, which includes the width, height, fillet radius, horizontal
distance between pump and runner, vertical distance between pump and runner front. For
the runner end, four parameters can be changed such as the width, height, fillet radius,
and horizontal distance between the front runner and the end runner. For the ingate, four
parameters can be changed, for example the width, height, location and angle between the
ingate and the side face of runner. The following figure shows the size of runner front
height changes from 16mm to 20mm.
Pump Runner_front Ingate Runner_end

37
Figure 5.5 Runner parameterized presentation
Another method of CAD template can be used to build CAD models.
2. Method 2: knowledge fusion based CAD model generation
Knowledge-based engineering (KBE) [1]
is a discipline with roots in CAD and
knowledge-based system. Success of early KBE prototypes led to KBE being considered
as the basis for generative design with many expectations for hands-off performance
where there would be limited human involvement in the design process.
KBE [11]
allows capturing and structuring of a design and its design process. KBE
allows the designer to automate the routine work, which gives the designer more time for
creative work. A typical KBE system is illustrated in the following figure.
Figure 5.6 The KBE system
INPUT
Customer Specifications
Product Data
Product Model
Geometry
Configuration
Engineering Knowledge
External Data
Catalogues Tables
Materials Analysis
Output
Reports Drawings Costs
BOM Manufacturing plans
CAD Models
38
Input includes any kinds of product data or customer specification. Based on the
input, product model can be developed where the knowledge from the process and the
product is stored. Product model can update itself with interaction with external data.
Output can vary from drawing, costs and/or reports.
Introduction of Knowledge Fusion [11]
The rule engine in KBE is called Knowledge Fusion (KF) and the underlying
technology for a whole set of so-called “process wizards”. By activating these, the built-
in knowledge gets available; it can be own specified processes or processes that are based
o methods from experienced users. The template guides the user through the process and
links complex operations into automatic sequences. The idea is that you don’t have to be
an expert to be able to use the program.
In addition to the language itself, Knowledge Fusion provides an easy-to-use
visual interface for capturing and handling engineering knowledge. Benefits include
greatly reduced design cycle time, easy-to-understand models, and analysis
standardization. Knowledge Fusion makes multidisciplinary optimization and
probabilistic evaluations feasible which results in much more innovative and advanced
designs. Capabilities such as these can have a profound impact on the competitive nature
of a business. With reduced design time, you get automatically a financial benefit.
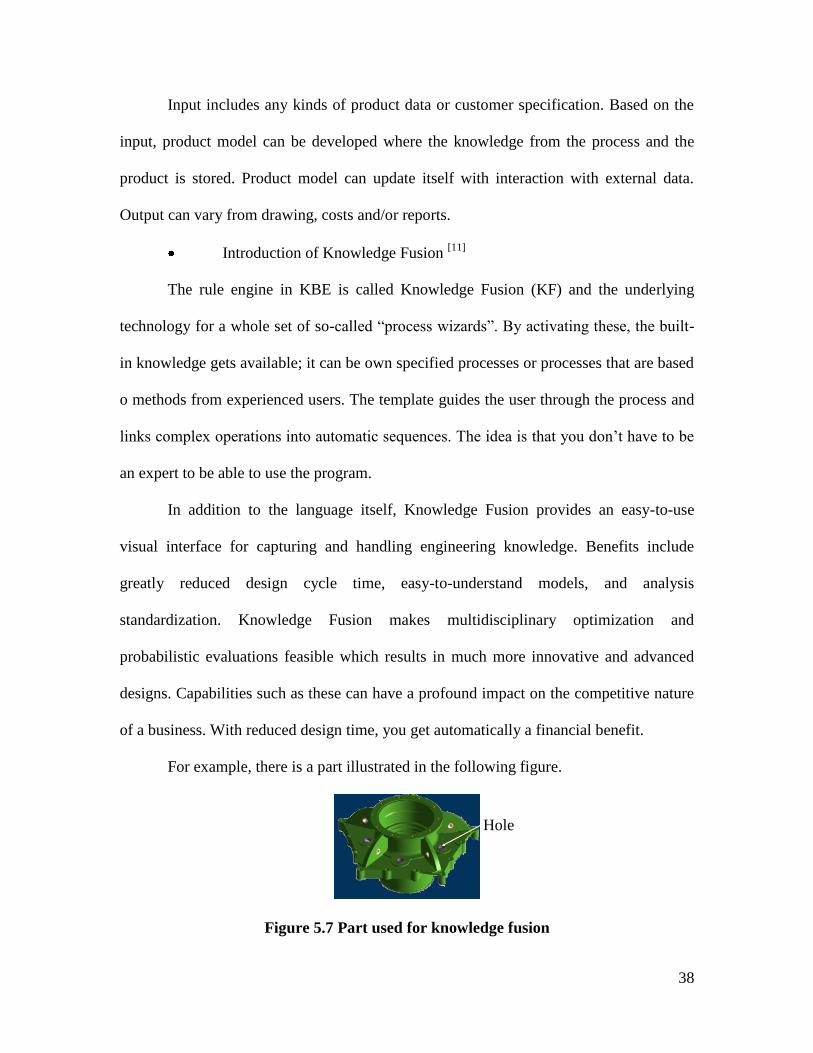
For example, there is a part illustrated in the following figure.
Figure 5.7 Part used for knowledge fusion
Hole
39
If expressions of hole are presented without KF but with driven parameters, it
may look like below:
Diameter of hole = thickness of plate * 0.5;
Diameter of hole = if thickness of plate > 0.5
5, else 8
….
For this method, it can only be used in simple conditionals.
If presentation of hole is supported with KF, its supporting engine rules may like
below:
Diameter of hole = ODBC Query (Access Database);
Diameter of hole = if material = steel,
5, else 10
Diameter of hole = if thickness of plate > 5
circle, else square
This method is driven topologically not parametrically. So it is easier to change
material, access to database, changed round hole to square, etc.
Implementation of gating/riser templates using KF
In casting assembly, if gating/riser can be represented as templates, it will become
easier for user to vary parameters and get different CAD models. In this paper, KF
technology will be used to build gating/riser templates. The process of building runner
template is illustrated below.
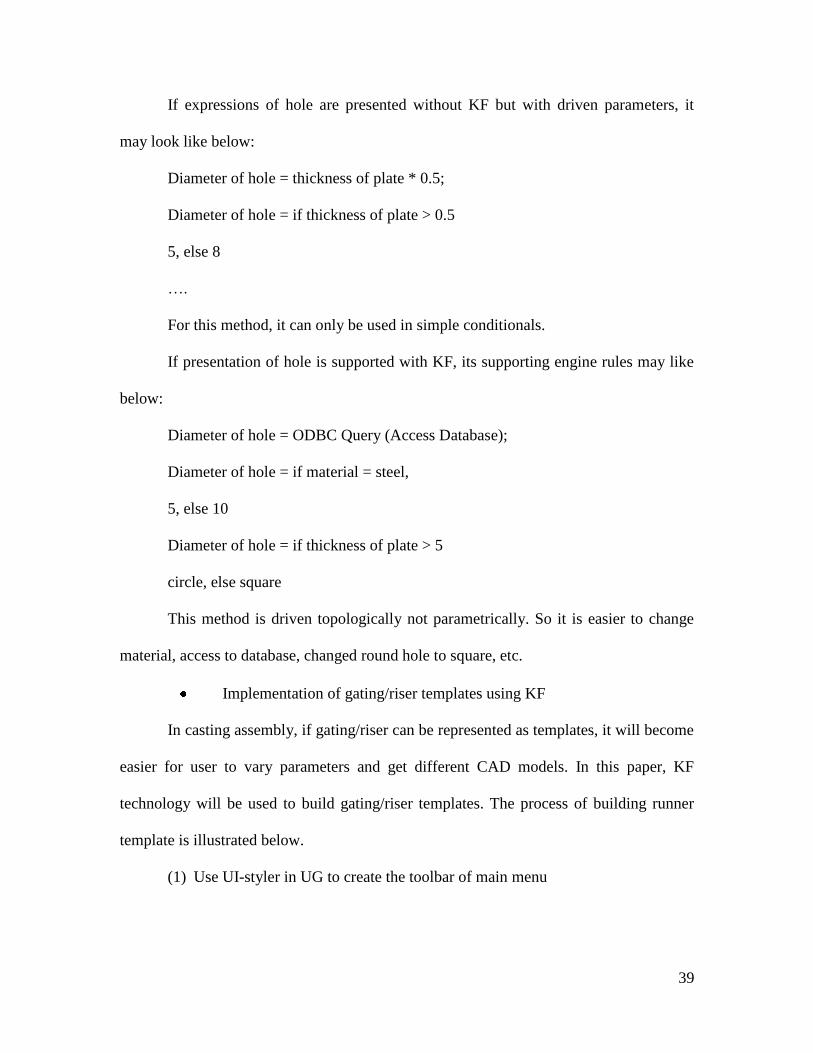
(1) Use UI-styler in UG to create the toolbar of main menu
40
Figure 5.8 Toolbar
There are two buttons in this toolbar, one is template to create templates of
gating/riser system, and the other is assembly to assemble gating/riser system with
casting model. In this paper, template is only be considered.
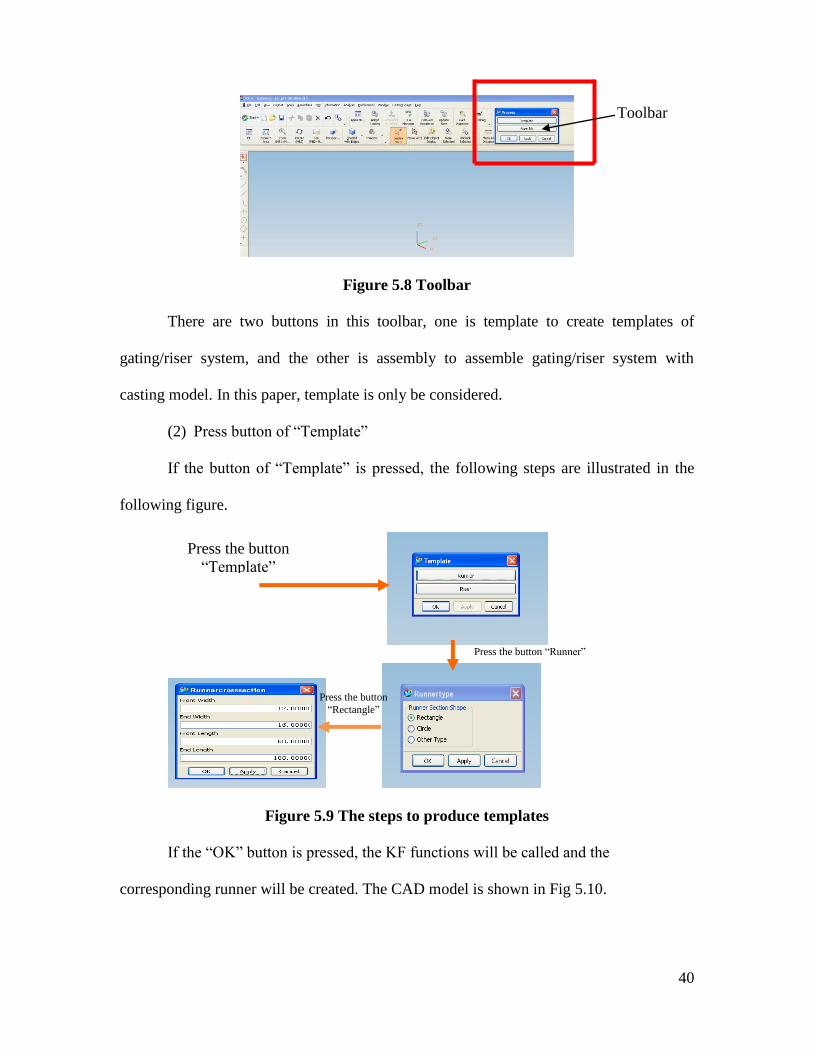
(2) Press button of “Template”
If the button of “Template” is pressed, the following steps are illustrated in the
following figure.
Figure 5.9 The steps to produce templates
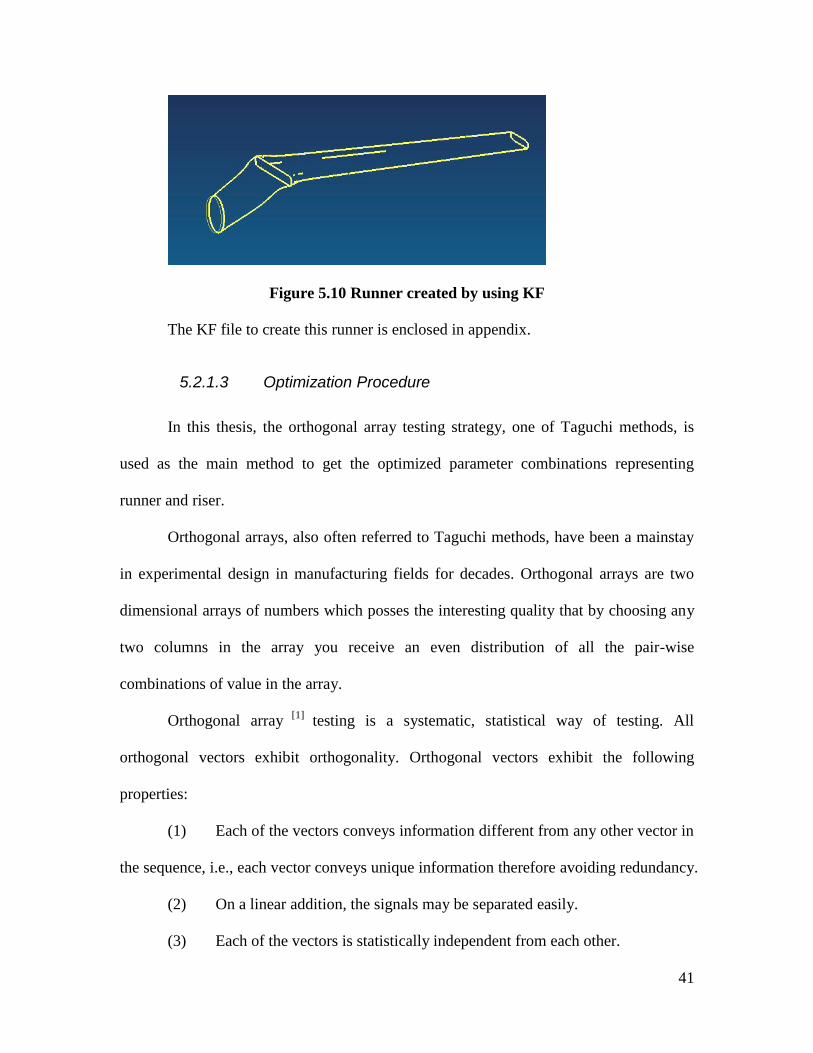
If the “OK” button is pressed, the KF functions will be called and the
corresponding runner will be created. The CAD model is shown in Fig 5.10.
Toolbar
Press the button
“Template”
Press the button “Runner”
Press the button
“Rectangle”
41
Figure 5.10 Runner created by using KF
The KF file to create this runner is enclosed in appendix.
5.2.1.3 Optimization Procedure
In this thesis, the orthogonal array testing strategy, one of Taguchi methods, is
used as the main method to get the optimized parameter combinations representing
runner and riser.
Orthogonal arrays, also often referred to Taguchi methods, have been a mainstay
in experimental design in manufacturing fields for decades. Orthogonal arrays are two
dimensional arrays of numbers which posses the interesting quality that by choosing any
two columns in the array you receive an even distribution of all the pair-wise
combinations of value in the array.
Orthogonal array [1]
testing is a systematic, statistical way of testing. All
orthogonal vectors exhibit orthogonality. Orthogonal vectors exhibit the following
properties:
(1) Each of the vectors conveys information different from any other vector in
the sequence, i.e., each vector conveys unique information therefore avoiding redundancy.
(2) On a linear addition, the signals may be separated easily.
(3) Each of the vectors is statistically independent from each other.
42
(4) When linearly added, the resultant is the arithmetic sum of the individual
components.
Benefits include:
(1) Provides uniformly distributed coverage of the test domain.
(2) Concise test set with fewer test cases is created.
(3) All pair-wise combinations of test set created.
(4) Arrives at complex combinations of all the variables.
(5) Simpler to generate and less error prone than test sets created manually.
(6) Reduces testing cycle time.
(7) It does not guarantee the extensive coverage of test domain
The steps to use this technique are listed below [12]
:
(1) Decide how many independent variables will be tested for interaction.
This is also called factors of the array.
(2) Find the maximum number of values that each independent variable will
take on. This is also called the levels of the array.
(3) Get a suitable orthogonal array with smallest number of runs.
(4) Map the factors and values onto the array
(5) Choose values for any levels;
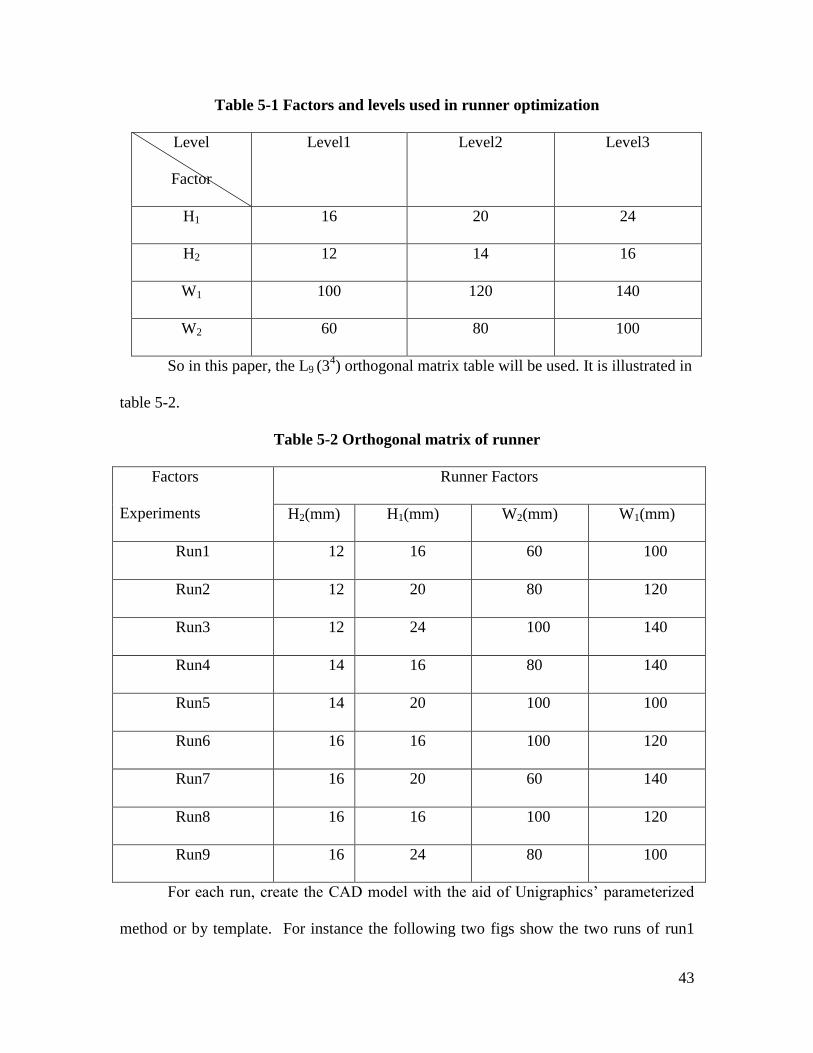
1. Use orthogonal array testing for the runner optimization
Four parameters are used to represent the runner. For each parameter, three
different levels will be selected.
43
Table 5-1 Factors and levels used in runner optimization
Level
Factor
Level1 Level2 Level3
H1 16 20 24
H2 12 14 16
W1 100 120 140
W2 60 80 100
So in this paper, the L9 (34) orthogonal matrix table will be used. It is illustrated in
table 5-2.
Table 5-2 Orthogonal matrix of runner
Factors
Experiments
Runner Factors
H2(mm) H1(mm) W2(mm) W1(mm)
Run1 12 16 60 100
Run2 12 20 80 120
Run3 12 24 100 140
Run4 14 16 80 140
Run5 14 20 100 100
Run6 16 16 100 120
Run7 16 20 60 140
Run8 16 16 100 120
Run9 16 24 80 100
For each run, create the CAD model with the aid of Unigraphics’ parameterized
method or by template. For instance the following two figs show the two runs of run1

44
with H1 =20mm, H2 =12mm, W1= 120mm and W2 = 80mm, and run3 with H1 =24mm,
H2 =12mm, W1= 140mm and W2 = 100mm
Figure 5.11 Runner1 with parameters - 1
Figure 5.12 Runner3 with parameters - 2
After getting all these CAD models, input these models to the simulation software.
2. Introduction to the simulation software-WRAFTS [13]
WRAFTS (Weighted Residual Analysis of Flow Transients) is a computer
simulation program which models transient fluid flow. The finite element method is used
for compatibility with structural design analysis. WRAFTS has a good reputation for
accurate and efficient simulations of mold filling transients. Using WRAFTS, foundry
45
process engineers can evaluate a wide variety of process parameters, ranging from gating
design to inlet flow rates, sand permeability and vent locations. These can be varied to
optimize productivity, improve product quality and reduce scrap.
Currently this software was used to simulate the casting process, so in this thesis,
this software will be also used for the simulation.
3. Simulation results
For the runner optimization, how it can be filled completely is the first priority. At
the same time, filling speed is another element should be considered. For each kind of
metal, there exists critical velocity, for example the critical velocity for aluminum is
0.5m/s. It is the maximum velocity the metal liquid fills without creating defects. If the
liquid exceeds the critical velocity there is a danger that the surface of the liquid metal
may be folded over by surface turbulence. So there is the danger of surface entrainment
leading to the defect creation when the filling velocity is above the critical velocity.
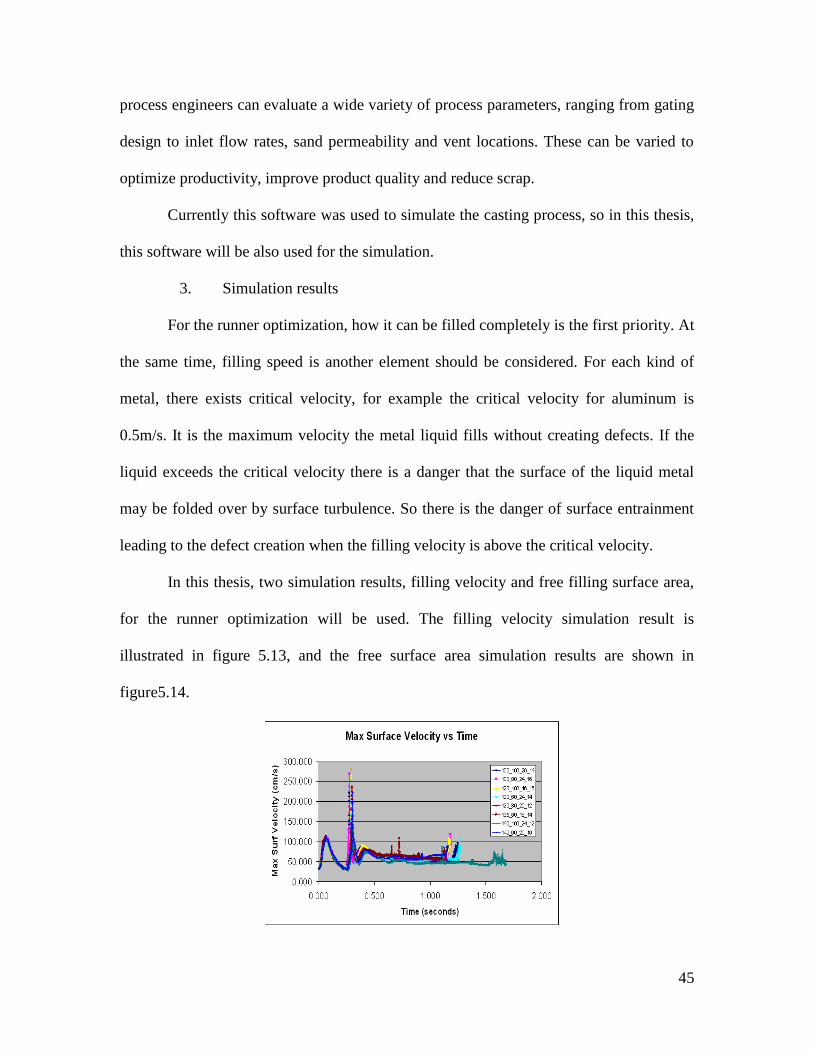
In this thesis, two simulation results, filling velocity and free filling surface area,
for the runner optimization will be used. The filling velocity simulation result is
illustrated in figure 5.13, and the free surface area simulation results are shown in
figure5.14.

46
Figure 5.13 Runner filling velocity simulation result
Figure 5.14 Runner free surface simulation result
4. Analyze simulation results
In this thesis, range analysis method will be used to analyze simulation results and
optimize runner.
Optimization objects should be firstly defined. For runner optimization, free
surface area and maximum velocity are two primary optimization goals. Accordingly its
optimization goal function can be defined as follows:
Yi = ai1(wi1)*yi1 + ai2(wi2)*yi2
In which: i - the index of experiments;
yi1 -free surface area of runner while filling;
yi2 -maximum velocity of runner while filling;
wi1 -weight of free surface area;
wi2 -weight of maximum velocity.
47
Because minimizing free surface area is more important than controlling the
maximum velocity for runner optimization, here wi1 will be set to 60 while wi2 is 40.
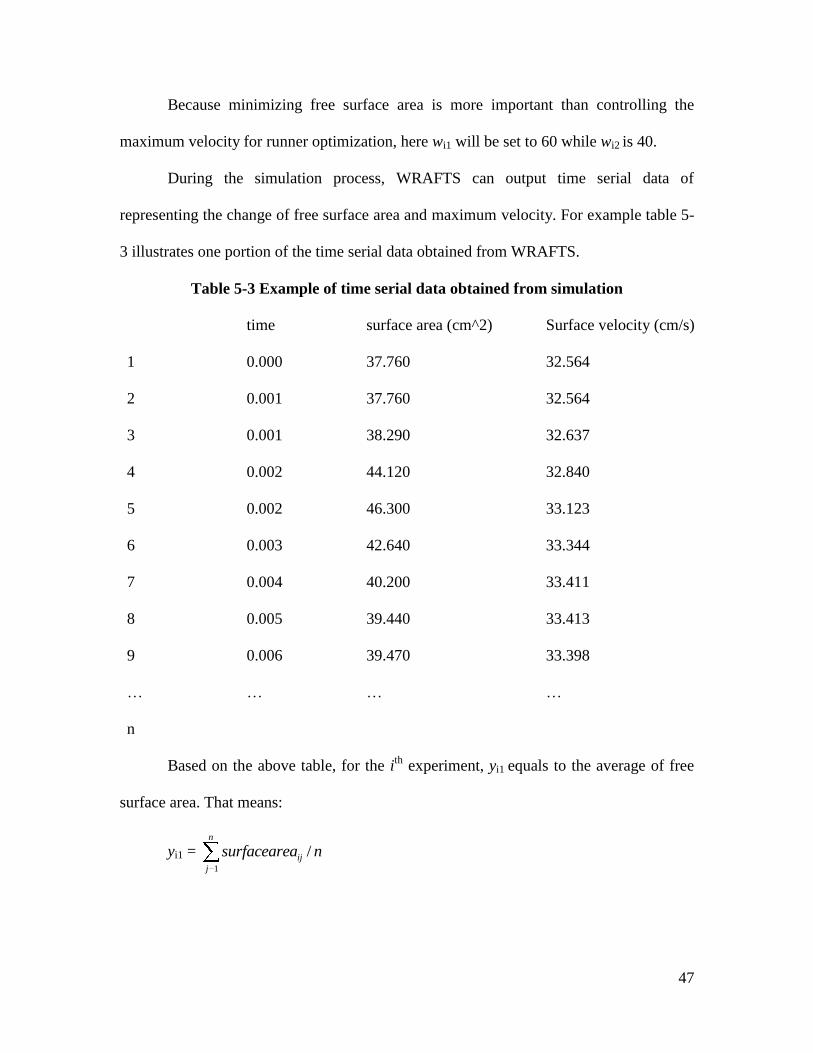
During the simulation process, WRAFTS can output time serial data of
representing the change of free surface area and maximum velocity. For example table 5-
3 illustrates one portion of the time serial data obtained from WRAFTS.
Table 5-3 Example of time serial data obtained from simulation
time surface area (cm^2) Surface velocity (cm/s)
1 0.000 37.760 32.564
2 0.001 37.760 32.564
3 0.001 38.290 32.637
4 0.002 44.120 32.840
5 0.002 46.300 33.123
6 0.003 42.640 33.344
7 0.004 40.200 33.411
8 0.005 39.440 33.413
9 0.006 39.470 33.398
… … … …
n
Based on the above table, for the ith
experiment, yi1 equals to the average of free
surface area. That means:
yi1 = 1
/n
ij
j
surfacearea n

48
For the ith
experiment, yi2 equals to the ratio between the numbers of elements in
table 5-4 whose velocity are greater than a threshold value and the numbers of total
elements.
Table 5-4 Simulation results analysis
W1 W2 H1 H2 yi1 yi2 yi
1 100 100 20 14 112 0.94 103
2 100 80 24 16 121 0.89 102
3 120 100 16 16 86 0.92 93
4 120 60 24 14 119 0.91 103
5 120 80 20 12 73 0.92 90
6 135 80 16 14 63 0.92 86
7 140 100 24 12 234 0.4 100
8 100 60 16 12 36 0.91 78
9 140 60 20 16 81 0.89 90
Sum1 285 272 259 268 Optimized combination:
W1 = 140
W2 = 60
H1 = 16
H2 = 12
And H1 has the most
effects while W1 has the least
effects
Sum2 287 279 283 293
Sum3 277 297 306 287
Aver1 95 90.7 86.3 89.3
Aver2 95.7 93 94.3 97.7
Aver3 92.3 99 102 95.7
R 3.4 8.3 15.7 8.4
In the above table:

49
yi = yi1*60/( yi1(max) - yi1(min)) + yi1*40/( yi2(max) - yi2(min));
Sumj equals the sum of yi when all factors take the jth
level;
Averj equals the ratio between Sumj and total number of level;
R equals Averj(max) – Averj(min).
Because the optimization object of runner is to minimize free surface area and
control surface speed, the optimized parameters combination is when W1 take the third
level, W2, H1 and H2 take the first level. From R value, it also can be concluded that H1
has the most effects on the final result because of its highest R value, while W1 has the
least effect.
5.2.2 Riser Optimization
The just optimized runner will be used for riser optimization. There are two major
goals for riser optimization, low porosity and high yield.
The riser shape looks like the following figure.
Suppose angle A is set to a const value 3o. And due to the mate constraints between
riser and the casting, its bottom circle radius is fixed. So there are four factors, H1, H2, H3
and angle B, can be varied and each factor has three different levels.
The modulus of the riser should be more than that of casting sections the riser will
feed. Based on this, the initial values of each factor can be obtained. The maximum
modulus of the casting model Mc is around 4.0mm, and if the modulus of riser Mr =
1.5*Mc, so Mr = 6mm. Given Mr, the initial values of H1, H2, H3 and B can be calculated
as 28mm, 22mm, 6mm and 12o. So the orthogonal matrix of riser is shown in table 5-5.

50
Figure 5.15 Riser shape
Table 5-5 Orthogonal matrix of riser
Factors
experiments
Riser Factors
H1(mm) H2(mm) H3(mm) B(o)
Run1 30 25 5 15
Run2 35 30 8 15
Run3 40 35 11 15
Run4 30 30 11 20
Run5 35 35 5 20
Run6 40 25 8 20
Run7 30 35 8 25
Run8 35 25 11 25
Run9 40 30 5 25
H1
H2
H3 B
A

51
Input these nine cases to WRAFTS, the simulation results are illustrated in table 5-
6.
Table 5-6 Simulation results of riser
Run # Porosity volume (cm^3
) Casting Yield (%)
Run1 22.01 0.777
Run2 19.31 0.742
Run3 17.52 0.710
Run4 19.3 0.738
Run5 16.88 0.706
Run6 17.46 0.713
Run7 17.21 0.707
Run8 17.68 0.712
Run9 15.21 0.673
Original 18.52 0.583
Also range analysis method will be used to get the optimized parameters
combination of riser. For the riser optimization, it has the same importance between
getting the lower porosity volume and improving yield. So the weights of porosity
volume and yield are set to 50. The result analysis is shown in table 5-7.

52
Table 5-7 Simulation result analysis of riser
H1(mm) H2(mm) H3(mm) B(o) yi1 yi2 yi
1 30 25 5 15 22.01 0.777 357.179
2 35 30 8 15 19.31 0.742 328.527
3 40 35 11 15 17.52 0.71 307.320
4 30 30 11 20 19.3 0.738 327.448
5 35 35 5 20 16.88 0.706 301.608
6 40 25 8 20 17.46 0.713 307.633
7 30 35 8 25 17.21 0.707 304.286
8 35 25 11 25 17.68 0.712 308.999
9 40 30 5 25 14.4 0.673 281.033
Sum1 988.914 973.812 939.821 993.026 Optimized combination:
H1 = 40
H2 = 30
H3 = 5
B = 25o
And B has the most effects
while H3 has the least effects
Sum2 939.135 937.008 940.447 936.690
Sum3 895.987 913.216 943.768 894.319
Aver1 329.638 324.604 313.273 331.008
Aver2 313.045 312.336 313.482 312.230
Aver3 298.662 304.405 314.589 298.106
R 30.97 20.19 1.31 32.9
So the optimized parameters combination is 40, 30, 5, 20o, and the porosity
volume decreases around 18% while the yield increases around 16%.
53
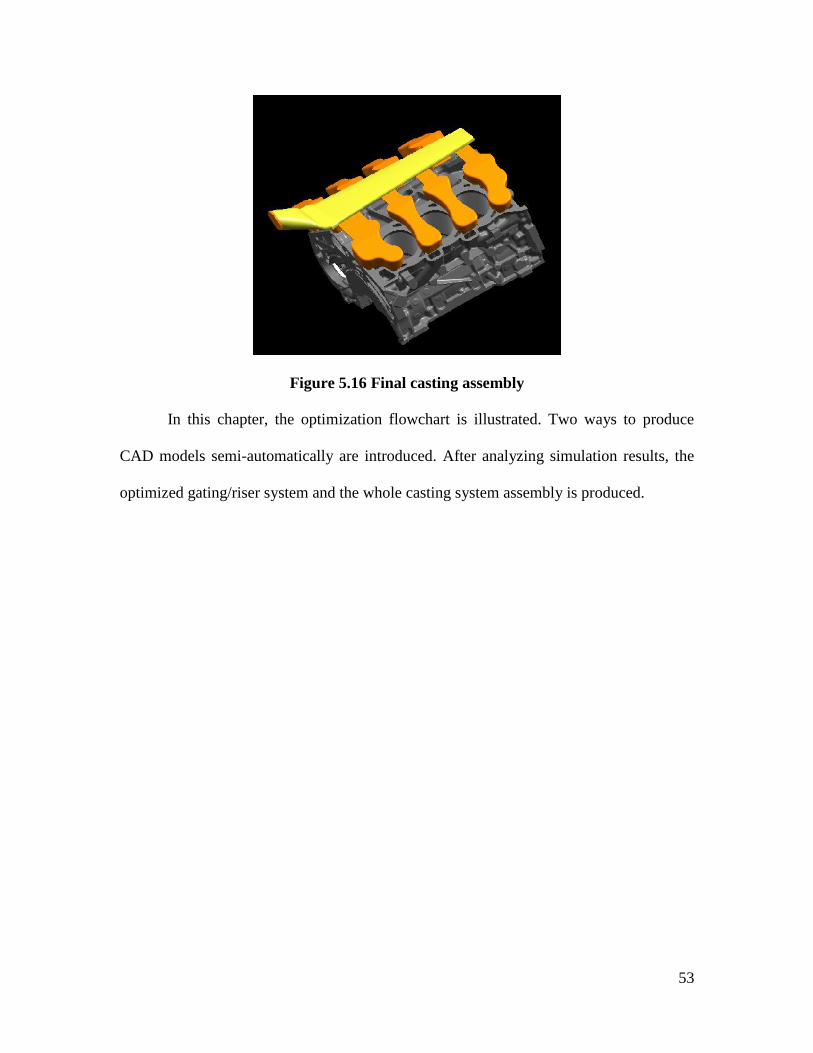
Figure 5.16 Final casting assembly
In this chapter, the optimization flowchart is illustrated. Two ways to produce
CAD models semi-automatically are introduced. After analyzing simulation results, the
optimized gating/riser system and the whole casting system assembly is produced.
54
Chapter 6 Summary and Conclusion
First, this chapter will present the summary and conclusion of the thesis. Then the
future work of the thesis is discussed.
6.1 Summary
This paper introduces a CAD and simulation technology method to solve some
common casting problems such as large porosity, and incomplete filling. It is important
to verify the suitability of the given part CAD model to the casting process. In this paper,
castability analysis is firstly presented. Then, modulus calculation, one of the most
effective ways to evaluate casting cooling rate, is used in castability analysis. Quality
must be the first consideration used in determining whether or not the CAD model is
suitable for casting. A key element in producing quality aluminum castings is the proper
design and sizing of the gating and riser systems. A foundry can produce the best quality
molds, cores and molten aluminum and still end up with a poor quality casting by using
poorly designed gating and riser systems. In this paper, with the aid of parametric
modeling technology in UG, runner and riser are modeled parametrically. By varying
each parameter, it is easy to get different casting CAD models. These models output data
populate the orthogonal matrix, which is used in the orthogonal array testing strategy to
define the most suitable combinations of runners and risers parameters. After inputting
the completed orthogonal matrix data and all CAD models into the simulation software,
WRAFTS, the simulation result can be obtained. Based on the predefined optimization
objectives of runner and riser, the range analysis method is also used to analyze the
simulation result and obtain the optimized runner and risers’ parameters.

55
6.2 Conclusion
To overcome the problems of current gating/riser system, a method based
on CAD and simulation technology is implemented.
Modulus based castability analysis is implemented to locate the possible
hot spots.
Runner and riser models are established parametrically.
By analyzing simulation results, the optimized gating/riser system is
determined.
By comparing the simulation result of optimized casting model with that
of the original model, it can be concluded that the porosity volume decreased by roughly
18% and the yield increased by about 16%.
6.3 Future Work
In this paper, only the system framework is proposed and the optimization method
is initially explored. Future work may include.
(1) Castability Analysis
- In this paper, modulus calculation relies on the UG functions. Built-in
functions may be explored along with alternative methods to calculate modulus;
- Castability analysis, as it stands now is a comprehensive task that requires
extensive casting process experience. Detailed and systematic analysis of the decision
making process used in castability analysis may yield a well defined, consistent-rules
database that may be incorporated into the software to automate the evaluation of a part
CAD model suitability for casting process.
56
(2) Gating/riser Optimization
- This study used orthogonal matrix and range to optimize the gating and
riser design. Other optimization methods may be explored;
- One runner and riser shape currently used was analyzed. Other shapes
should be explored..
(3) Gating/riser Templates
- Designing and integrating a gating/riser template database into the
software will speed up the analysis and optimization process.
57
Reference
1. http://en.wikipedia.org/wiki, 2008.
2. Ravi B, Metal Casting: Computer-Aided Design and Analysis, Prentice-Hall, New
Delhi, India, 2005.
3. Serope Kalpakjian, Steven R. Schmid, Manufacturing Engineering and Technology,
Fifth Edition, Prentice Hall, NJ, 2006
4. http:// www.sfsa.org/sfsa/cstintcp.html, 2008
5. http://www.eriebronze.com/bronze_castings/the_sand_casting_process.asp, 2008
6. http://www.me.gatech.edu/jonathan.colton/me4210/castdefect.pdf, 2008
7. Ravi B, Computer-aided casting method design, simulation and optimization, Institute
of India Foundrymen, 13 March 2008, Indore, India
8. Ravi B, Casting Simulation and Optimisation: Benefits, Bottlenecks, and Best
Practices, Indian Foundry Journal, 54 (1), Jan 2008, pp. 1-12
9. http://www.me.iitb.ac.in/~bravi/clab/paper/1999IFC_CADCastingPastPresentFuture%20.pdf,
2008
10. Aluminum casting technology, Amer Foundrymens Society, 1993
11. Mohammed Golkar, Development of Knowledge Based Engineering Support for
Design and Analysis of Car Components Using NX-Knowledge Fusion, Master thesis,
Lulea University of Technology, 2006
12. http://upiia.uab.es/teach/a21291/apunts/provaOO/OATS.pdf, 2008
13. http://www.wrafts.com, 2008

58
14. Akarte M M and Ravi B, Casting Product-Process-Producer Compatibility Evaluation
and Improvement, International Journal of Production Research, Vol. 45, No. 21, 2007,
pp 4917-4936.
15. Advanced Reasoning Technologies, AutoCAST information and case studies,
http://www.autocast.co.in, 2007.
16. Ravi B, Intelligent Design of Gating Channels for Casting, Materials Science and
Technology, 13, No. 9, 1997, pp 785-790.
17. Chougule R G, Jalan M K and Ravi B, Casting Knowledge Management for
Concurrent Casting Product Process Design, Transactions of the AFS, 112, 2004, pp 105-
114.
18. Ravi B and Srinivasan M N, Casting Solidification Analysis by Modulus Vector
Method, Int. Cast Metals Journal, 9, No 1, 1996, pp 1-7.
19. Ravi B and Joshi D, Feedability Analysis and Optimisation Driven by Casting
Simulation, Indian Foundry Journal, 53, No 6, 2007, pp 71-78.
20. Chougule R G and Ravi B, Casting Cost Estimation in an Integrated Product and
Process Design Environment, International Journal of Computer Integrated
Manufacturing, 19, No 7, 2006, pp 676-688.
21. R. Gregg Bruce, M.M. Tomovic, J.E. Neely, R.R. Kibbe, Modern Materials and
Manufacturing Processes, 2nd ed., Prentice-Hall, 1998.
22. Campbell, J., 2003. Castings. Elsevier Butterworth-Heinemann.
23. Yang, X., Jolly, M., Campbell, J., Reduction of Surface Turbulence During Filling of
Sand Castings Using a Vortex-flow Runner. In: Modeling of Casting, Welding and
Advanced Solidification Processes (MCWASP IX), Aachen, Germany, 2000.pp.420–427.

59
24. Campbell, J., 1998. The Ten Castings Rules Guidelines For The Reliable Production
Of Reliable Castings: A Draft Process Specification. In: Materials Solutions Conference
on Aluminum Casting Technology, Chicago, pp. 3–19.
25. Runyoro, J., Boutorabi, S.M.A., Campbell, J., Critical Gate Velocities for Film-
Forming Castings Alloy: A Basis For Process Specification. Trans. AFS, 1992. pp, 225–
234.
26. Zhizhong Sun, Henry Hu, Xiang Chen, Numerical Optimization Of Gating System
For A Magnesium Alloy Casting With Multiple Performance Characteristics. Journal Of
Material Processing Technology. 2008. pp, 256-264
27. Bradley, F., Heinemann, S., A Hydraulics-Based Optimization Methodology For
Gating Design. Appl. Math. Model. 17, 1993. pp. 406–414.
28. McDavid, R.M., Dantzig, J.A. Design Sensitivity And Finite Element Analysis Of
Free Surface Flows With Application To Optimal Design Of Casting Rigging System. Int.
J. Numer. Methods Fluids, 1998, pp, 28-35.
[29] McDavid, R.M., Dantzig, J.A., Experimental and numerical investigation of mold
filling. In: Modeling of Casting, Welding and Advanced Solidification Processes
(MCWASP VIII), Chicago, USA, 1998. pp. 59–66.
[30] B.H.Hu, K.K.Tong, X.P. Niu., Design And Optimisation Of Runner And Gating
Systems For The Die Casting Of Thin-Walled Magnesium Telecommunication Parts
Through Numerical Simulation. In: Journal of Materials Processing Technology, 2000,
pp. 128-133