Embed Size (px)
Citation preview
8/3/2019 Optimization Slides
http://slidepdf.com/reader/full/optimization-slides 1/19
CPGE
Optimization of Geological Storage of CO2
and Enhanced Oil Recovery
Y. Ghomian, K. Sepehrnoori, G. A. Pope
Center for Petroleum & Geosystems Engineering
University of Texas at Austin
8/3/2019 Optimization Slides
http://slidepdf.com/reader/full/optimization-slides 2/19
CPGE
Outline
Research Objectives and Methodology
General Background
Model Validation and Small-scale Simulation Studies
Experimental Design and Method of Response Surfaces
Field-Scale Water-Alternating-Gas (WAG) Simulations
Summary and Conclusions
8/3/2019 Optimization Slides
http://slidepdf.com/reader/full/optimization-slides 3/19
CPGE
ObjectiveInvestigate effect of hysteresis and Water-Alternating-Gas
process (WAG) parameters to optimize oil recovery andamount of CO2 sequestered in compositional simulation of3D heterogeneous fields
Research Objectives andMethodology
Methodology Sensitivity analysis is preformed to investigate the effectof uncertainties in the considered parameters
Apply statistical analysis such as Design of Experiment(DOE) and Method of Response Surfaces (MRS) to achieve
efficient studies
8/3/2019 Optimization Slides
http://slidepdf.com/reader/full/optimization-slides 4/19CPGE
Coupled CO2 Sequestration and EOR
Enhanced Oil Recovery Goals
Maximize Oil Recovery Minimize Amount of CO2 Injected Maximize Profit
Geological CO2 Sequestration Goals Maximize Amount of CO2 Sequestered Store for Thousands of Years without Leakage
Minimize Costs
Co-optimization Is Needed to Meet Both Goals
8/3/2019 Optimization Slides
http://slidepdf.com/reader/full/optimization-slides 5/19CPGE
Compositional Equation of State Model (PR-EOS)
Multidimensional, Multicomponent, Multiphase
Hysteresis in Relative Permeability
Solubility of CO2 in Brine
Geochemistry Models (GEM-GHG)Precipitation reactions & Dissolution
Explicit, Fully Implicit, and Adaptive Implicit Formulations
Handling Complex Reservoirs Corner Point Grid Blocks
Local and Hybrid Grid Refinement
Simulator Description
8/3/2019 Optimization Slides
http://slidepdf.com/reader/full/optimization-slides 6/19CPGE
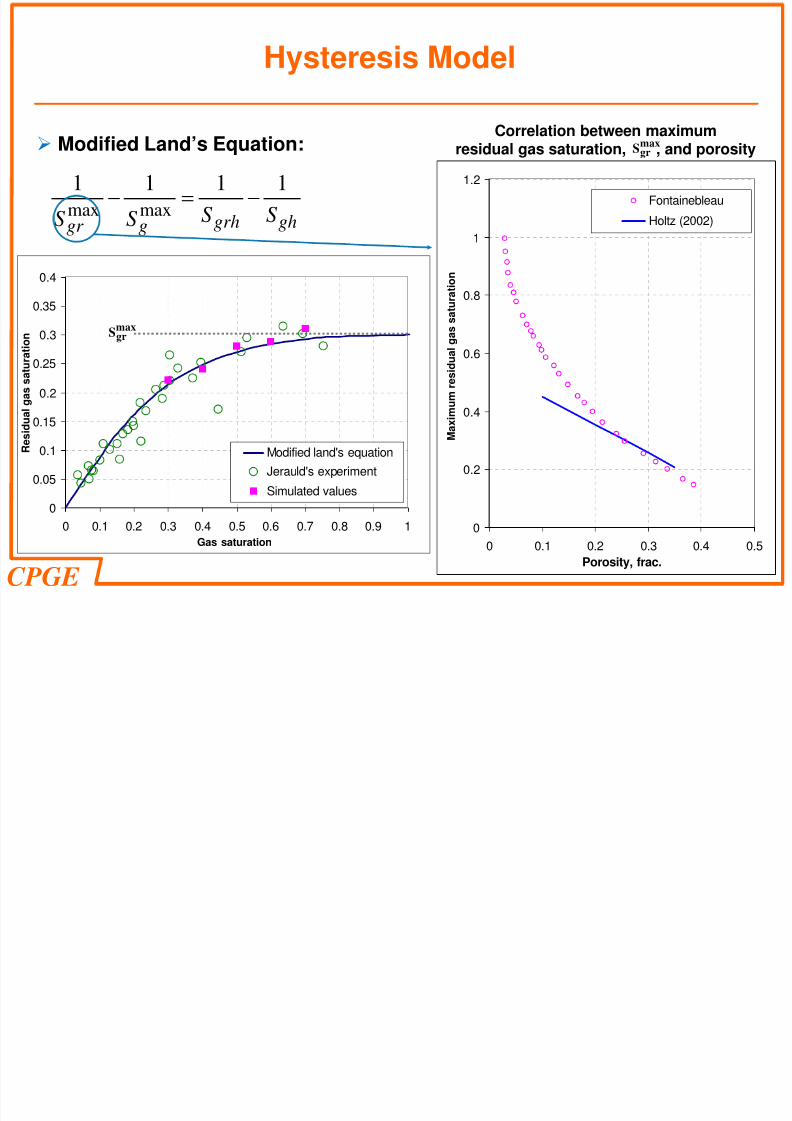
Hysteresis Model
Modified Land’s Equation:
max max
1 1 1 1
grh ghgr gS SS S
− = −
0
0.05
0.1
0.15
0.2
0.25
0.3
0.35
0.4
0 0.1 0.2 0.3 0.4 0.5 0.6 0.7 0.8 0.9 1
Gas saturation
R e s i d u a
l g a s s a t u r a t i o n
Modified land's equation
Jerauld's experiment
Simulated values
maxgrS
Correlation between maximumresidual gas saturation, , and porositymax
grS
0
0.2
0.4
0.6
0.8
1
1.2
0 0.1 0.2 0.3 0.4 0.5
Porosity, frac.
M a x i m
u m r e s i d u a l g a s s a t
u r a t i o n
Fontainebleau
Holtz (2002)
8/3/2019 Optimization Slides
http://slidepdf.com/reader/full/optimization-slides 7/19CPGE
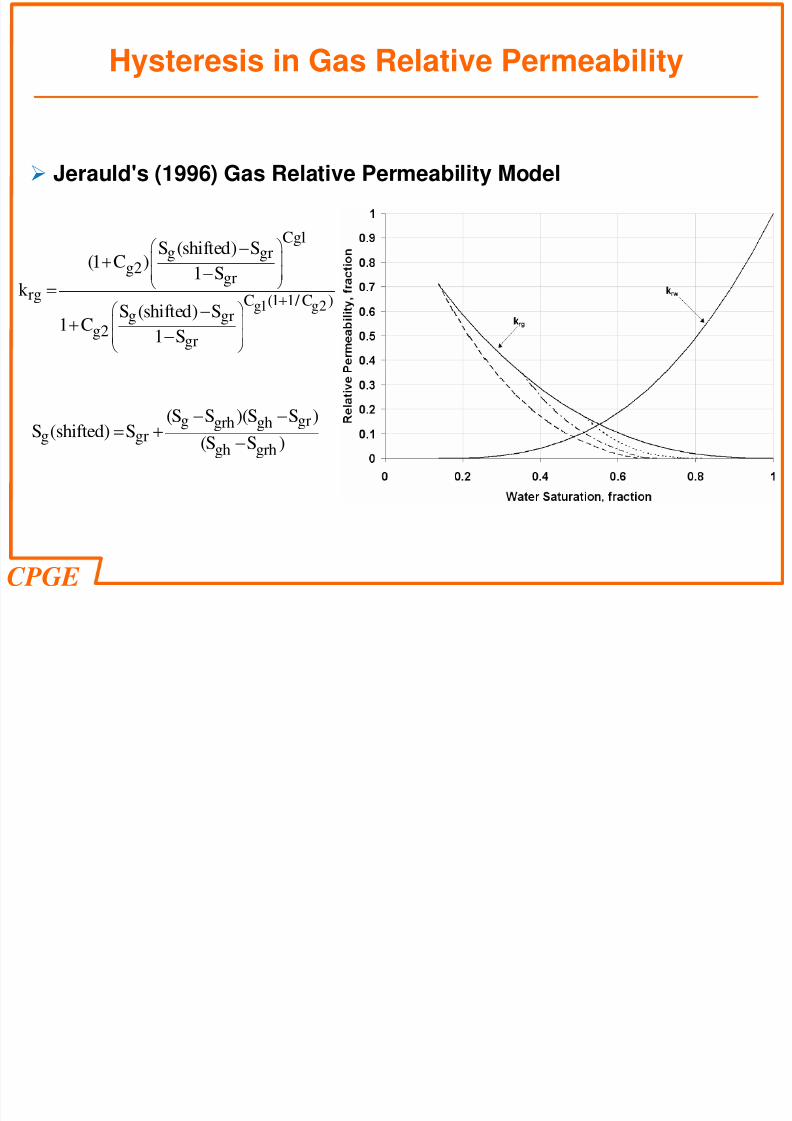
Hysteresis in Gas Relative Permeability
g grgrh ghg gr
gh grh
(S S )(S S )S (shifted) S
(S S )− −= +
−
g1 g2
Cg1g gr
g2gr
rg C (1 1/ C )g gr
g2gr
S (shifted) S(1 C )
1 Sk
S (shifted) S1 C1 S
⎛ ⎞⎜ ⎟⎜ ⎟⎝ ⎠
⎛ ⎞⎜ ⎟⎜ ⎟⎝ ⎠
+
−+
−=
−+−
Jerauld's (1996) Gas Relative Permeability Model
8/3/2019 Optimization Slides
http://slidepdf.com/reader/full/optimization-slides 8/19CPGE
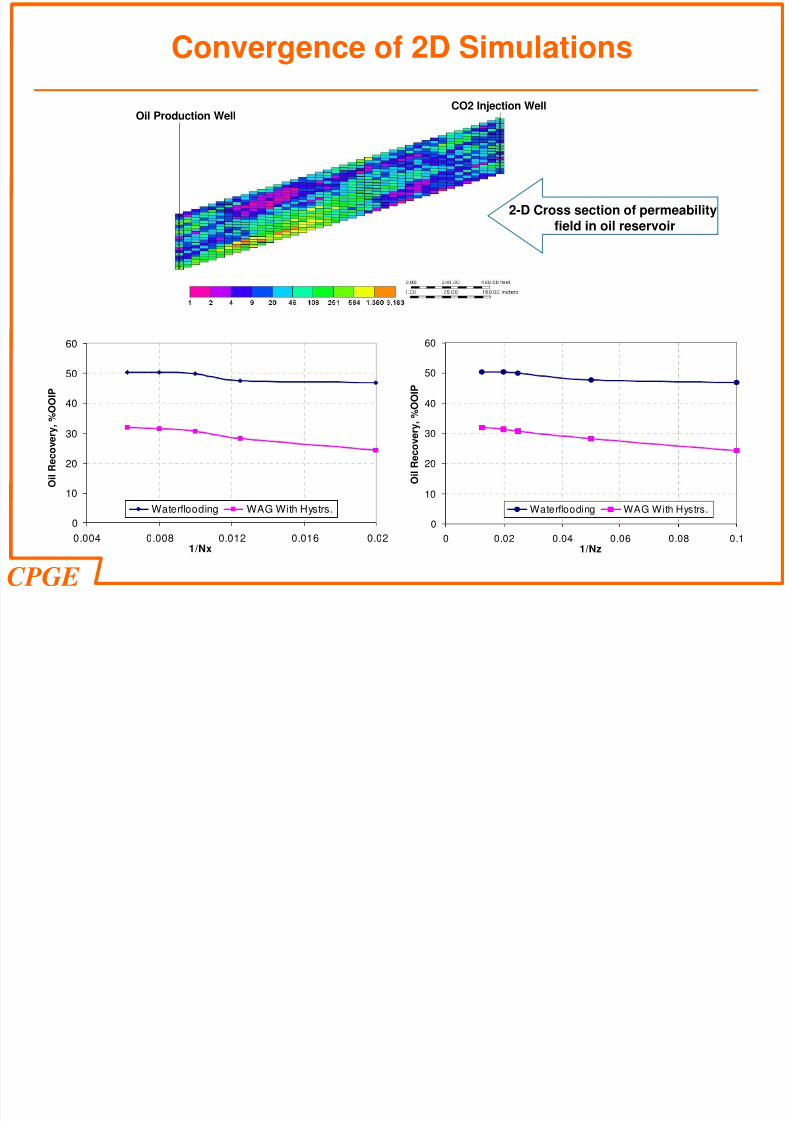
2-D Cross section of permeabilityfield in oil reservoir
Convergence of 2D Simulations
CO2 Injection WellOil Production Well
0
10
20
30
40
50
60
0 0.02 0.04 0.06 0.08 0.11/Nz
Waterflooding WAG With Hystrs.
0
10
20
30
40
50
60
0.004 0.008 0.012 0.016 0.021/Nx
Waterflooding WAG With Hystrs.
O i l R e c o v e r y , % O O I P
O i l R e c o v e r y , %
O O I P
8/3/2019 Optimization Slides
http://slidepdf.com/reader/full/optimization-slides 9/19CPGE
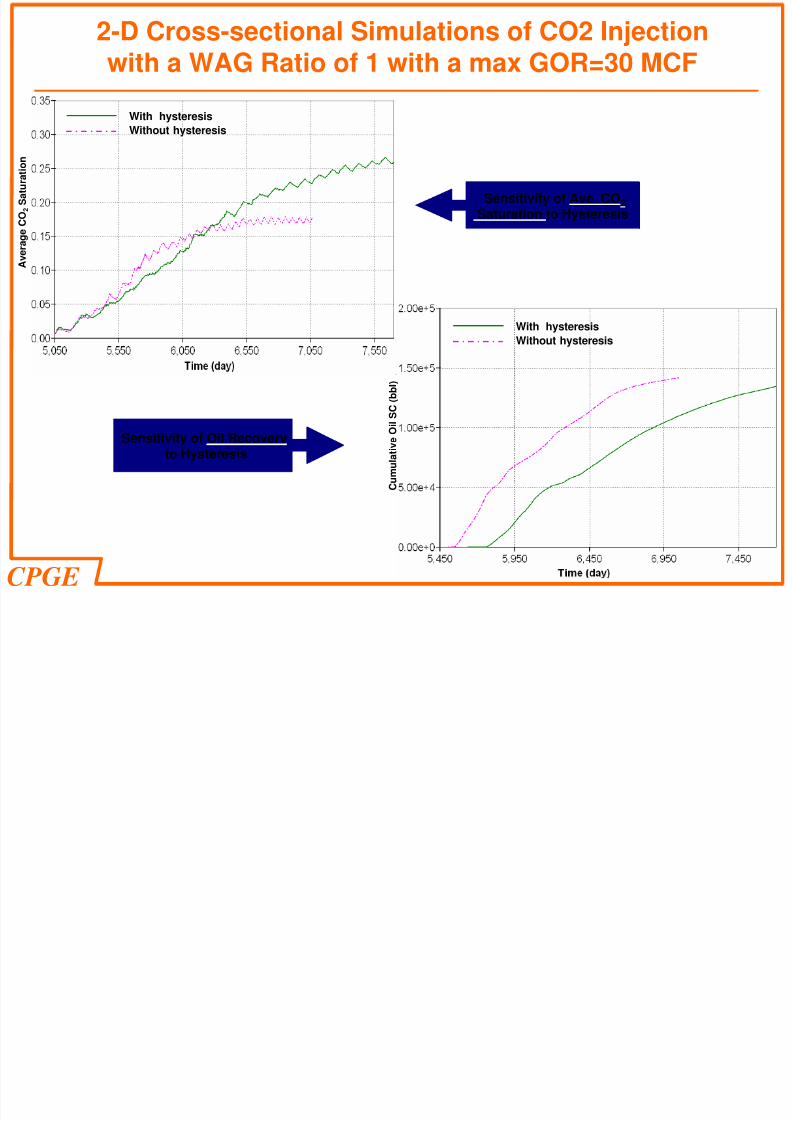
2-D Cross-sectional Simulations of CO2 Injectionwith a WAG Ratio of 1 with a max GOR=30 MCF
Sensitivity of Oil Recoveryto Hysteresis
Sensitivity of Ave. CO2
Saturation to Hysteresis
AverageCO
2
Saturation
CumulativeOilS
C(b
bl)
With hysteresis
Without hysteresis
With hysteresis
Without hysteresis
8/3/2019 Optimization Slides
http://slidepdf.com/reader/full/optimization-slides 10/19CPGE
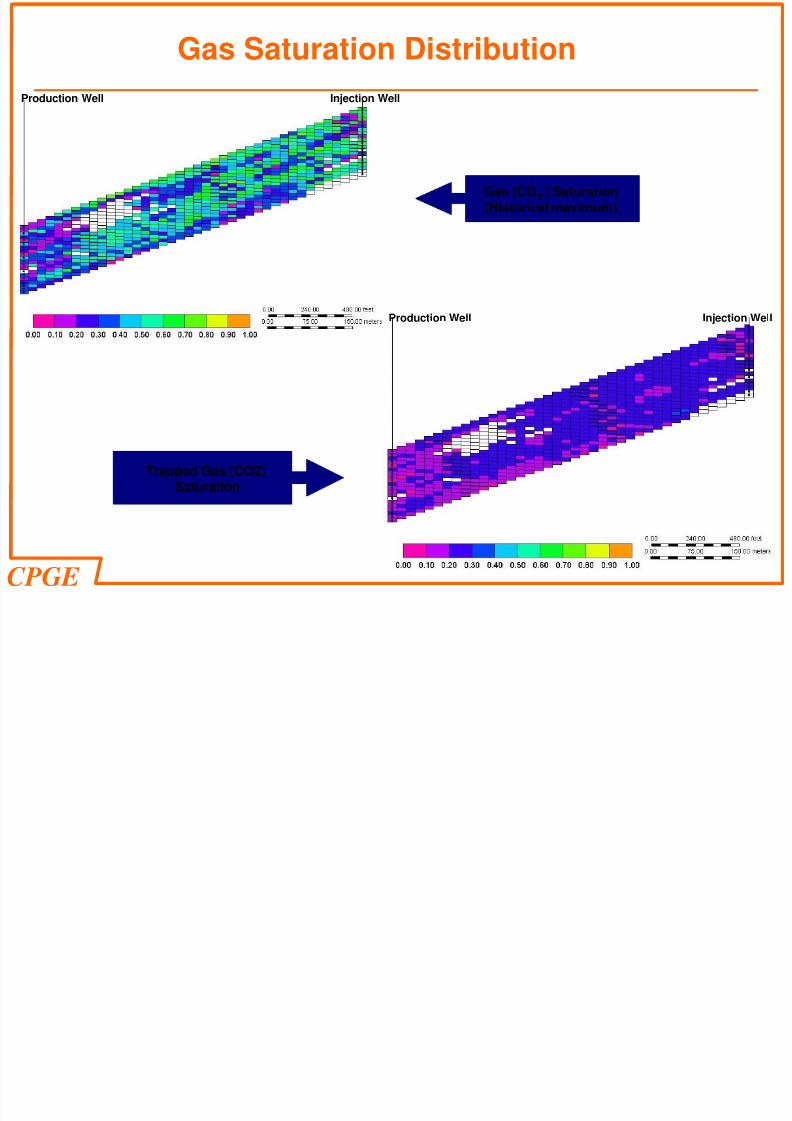
Gas Saturation Distribution
Production Well
Gas (CO2 ) Saturation
(Historical maximum)
Injection Well
Trapped Gas (CO2)Saturation
Production Well Injection Well
8/3/2019 Optimization Slides
http://slidepdf.com/reader/full/optimization-slides 11/19CPGE
Field-Scale Simulations
Quantifying the effect of WAG parameters (e.g. WAG ratio and CO2 slugsize) and hysteresis as well as reservoir heterogeneity in the WAG
injection processes for coupled CO2-EOR and sequestration studies
Experimental design and method of response surfaces to optimize theflood with range of uncertainties for each parameter and interaction among
different parametersSix different parameters with their range of uncertaintyTwo level fractional factorial designThree objective functions (Responses)
Stochastic permeability fields with the same reservoir fluid, relativepermeability, and hysteresis data used in the 2-D cases.
8/3/2019 Optimization Slides
http://slidepdf.com/reader/full/optimization-slides 12/19CPGE
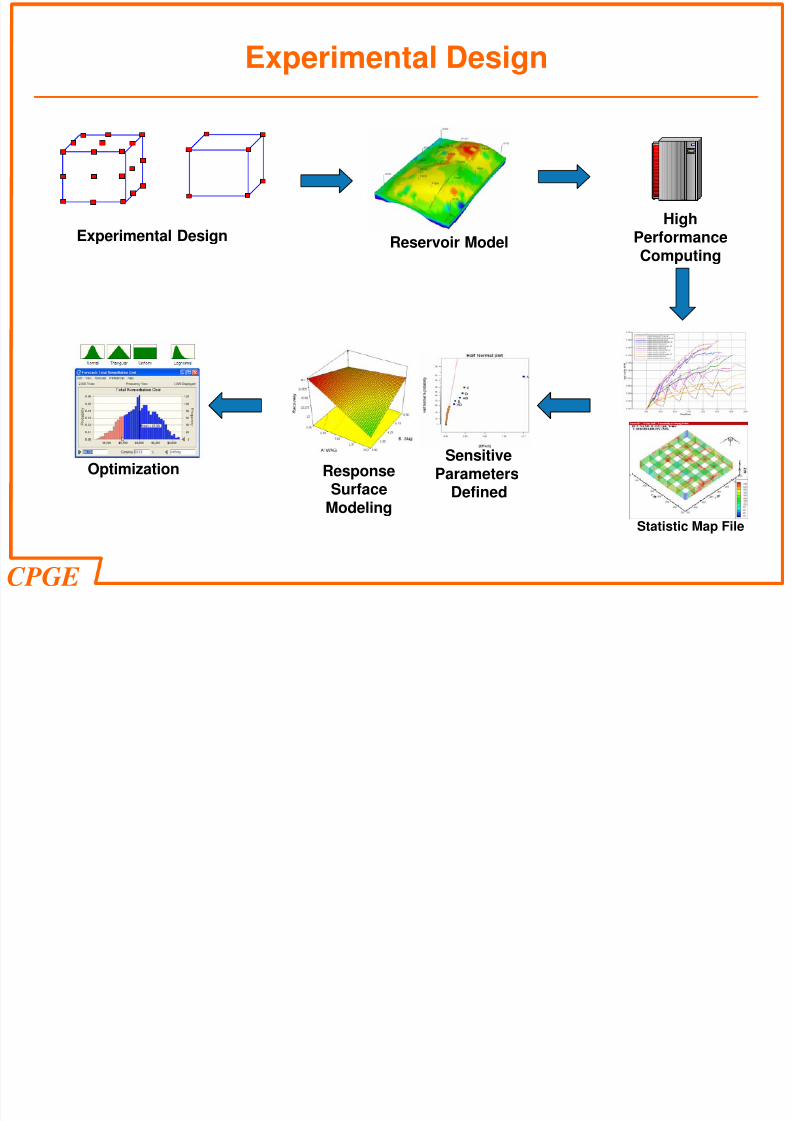
Experimental Design
Experimental Design Reservoir Model
ClusterHighPerformanceComputing
Statistic Map File
SensitiveParameters
Defined
Optimization ResponseSurface
Modeling
8/3/2019 Optimization Slides
http://slidepdf.com/reader/full/optimization-slides 13/19CPGE
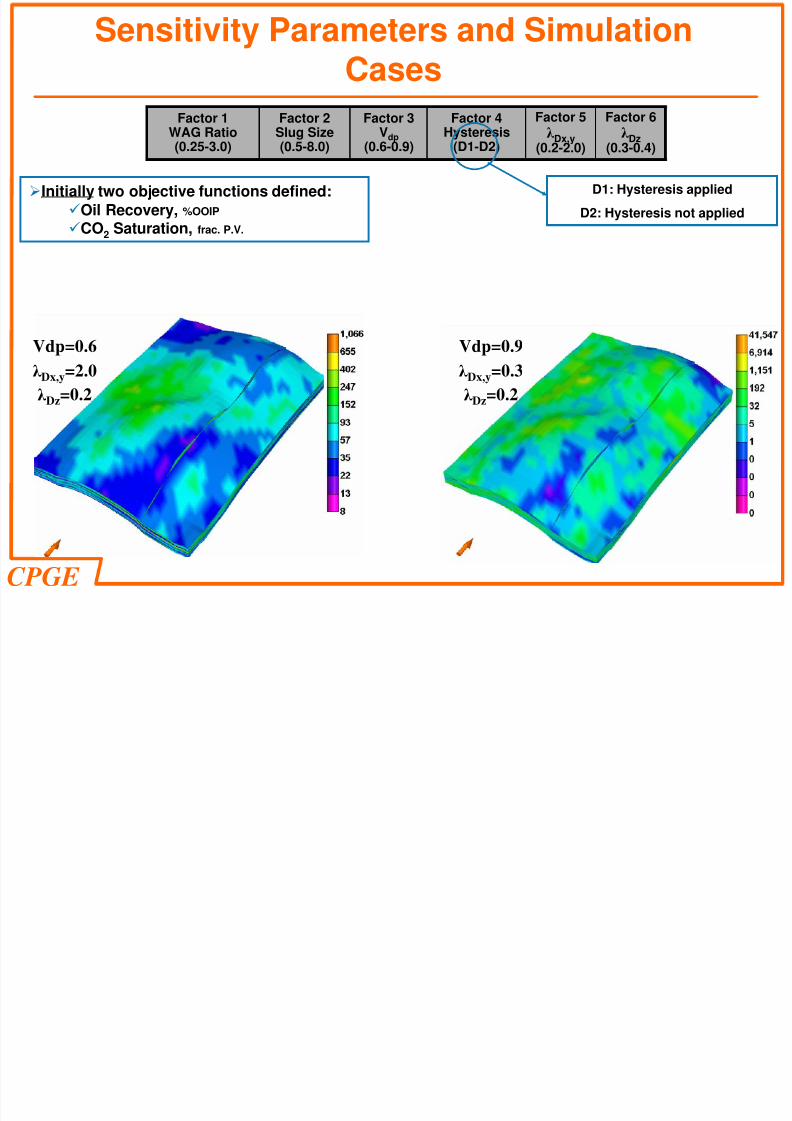
Sensitivity Parameters and SimulationCases
Factor 1WAG Ratio(0.25-3.0)
Factor 2Slug Size(0.5-8.0)
Factor 3Vdp
(0.6-0.9)
Factor 4Hysteresis
(D1-D2)
Factor 5λ Dx,y
(0.2-2.0)
Factor 6λ Dz
(0.3-0.4)
Initially two objective functions defined:
Oil Recovery, %OOIP
CO2 Saturation, frac. P.V.
D1: Hysteresis applied
D2: Hysteresis not applied
Vdp=0.6
λ Dx,y=2.0
λ Dz=0.2
Vdp=0.9
λ Dx,y=0.3
λ Dz=0.2
8/3/2019 Optimization Slides
http://slidepdf.com/reader/full/optimization-slides 14/19CPGE
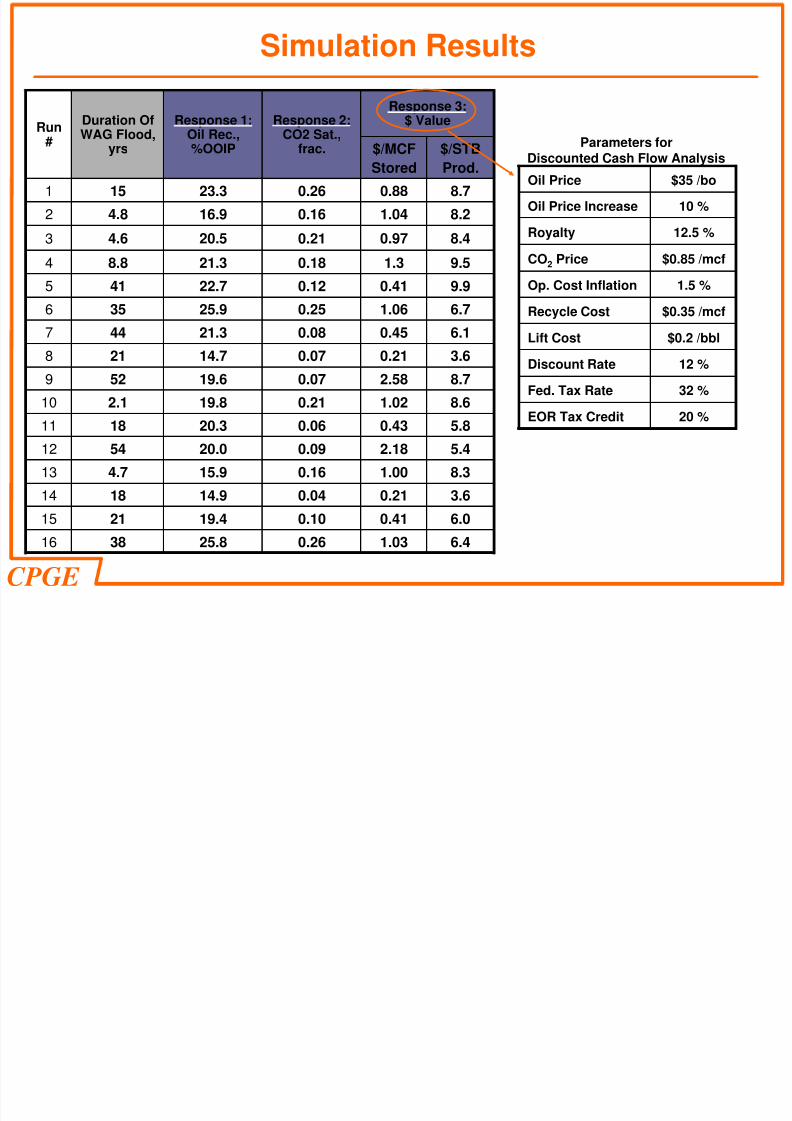
Simulation Results
Response 3:$ Value
Run#
Duration OfWAG Flood,
yrs
Response 1:Oil Rec.,%OOIP
Response 2:CO2 Sat.,
frac. $/MCF
Stored
$/STB
Prod.
0.26 0.88
0.16 1.04
0.97
1.3
0.41
1.060.45
0.21
2.58
1.02
0.43
2.18
1.00
0.21
0.411.03
0.21
0.18
0.12
0.250.08
0.07
0.07
0.21
0.06
0.09
0.16
0.04
0.100.26
1 15 23.3 8.7
2 4.8 16.9 8.2
3 4.6 20.5 8.4
4 8.8 21.3 9.5
5 41 22.7 9.9
6 35 25.9 6.77 44 21.3 6.1
8 21 14.7 3.6
9 52 19.6 8.7
10 2.1 19.8 8.6
11 18 20.3 5.8
12 54 20.0 5.4
13 4.7 15.9 8.3
14 18 14.9 3.6
15 21 19.4 6.016 38 25.8 6.4
20 %EOR Tax Credit
32 %Fed. Tax Rate
12 %Discount Rate
$0.2 /bblLift Cost
$0.35 /mcfRecycle Cost
1.5 %Op. Cost Inflation
$0.85 /mcfCO2 Price
12.5 %Royalty
10 %Oil Price Increase
$35 /boOil Price
Parameters forDiscounted Cash Flow Analysis

8/3/2019 Optimization Slides
http://slidepdf.com/reader/full/optimization-slides 15/19
CPGE
Sensitive Parameters
R e c o v e r y
R e s p o n s e
S e q u e s t r a t i o n
R e s p o n s e
8/3/2019 Optimization Slides
http://slidepdf.com/reader/full/optimization-slides 16/19
CPGE
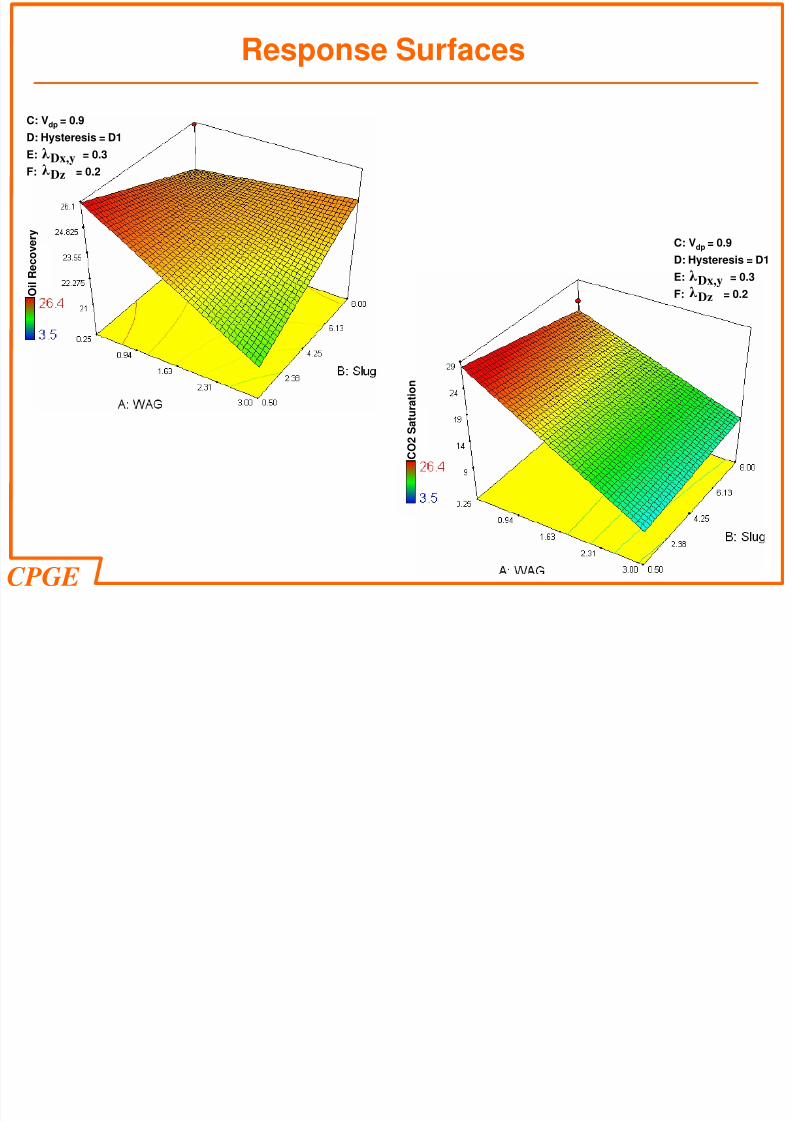
Response Surfaces
C O 2 S a t u r a t i o n
C: Vdp = 0.9
D: Hysteresis = D1
E: = 0.3
F: = 0.2Dx,yλ
Dzλ
C: Vdp = 0.9
D: Hysteresis = D1
E: = 0.3
F: = 0.2Dx,yλ
Dzλ
O i l R e c o v e r y
8/3/2019 Optimization Slides
http://slidepdf.com/reader/full/optimization-slides 17/19
CPGE
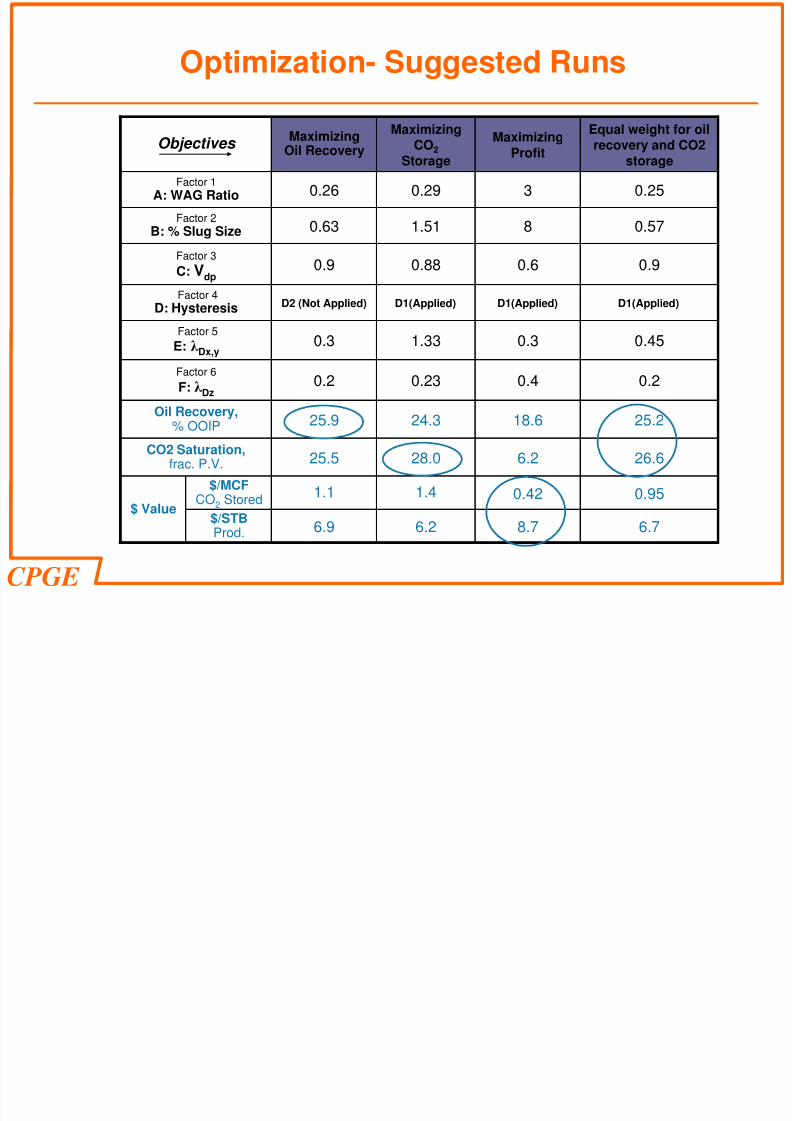
Optimization- Suggested Runs
Objectives Maximizing
Oil Recovery
MaximizingCO2
Storage
MaximizingProfit
Equal weight for oilrecovery and CO2
storage
Factor 1
A: WAG Ratio
Factor 2
B: % Slug Size
Factor 3
C: Vdp
Factor 4
D: HysteresisFactor 5
E: λ Dx,y
Factor 6
F: λ Dz
Oil Recovery,% OOIP
CO2 Saturation,frac. P.V.
0.26 0.29
$ Value
0.25
0.63 1.51
3
8
0.6
D1(Applied)
0.3
0.4
18.6
6.2
$/MCFCO2 Stored
1.1 1.4 0.42 0.95
$/STBProd.
0.57
0.9 0.88 0.9
D2 (Not Applied) D1(Applied) D1(Applied)
0.3 1.33 0.45
0.2 0.23 0.2
25.9 24.3 25.2
25.5 28.0 26.6
8.76.9 6.2 6.7
8/3/2019 Optimization Slides
http://slidepdf.com/reader/full/optimization-slides 18/19
CPGE
The optimized values for all objective functions predicted by Design ofExperiment and Response Surface Method are close to the values
obtained by an exhaustive simulation study but with a very efficientcomputational time
Compositional reservoir simulation in conjunction with experimentaldesign can be used to efficiently optimize both CO2 storage and oilrecovery
Summary
8/3/2019 Optimization Slides
http://slidepdf.com/reader/full/optimization-slides 19/19
CPGE
Hysteresis has a very large impact on the behavior of CO2 in termsof both oil recovery and storage in heterogeneous oil reservoirs
CO2 storage is greater forOil reservoirs with low heterogeneityLow WAG ratio
Small CO2 slug sizes
Profit from CO2 EOR is greater forOil reservoirs with low heterogeneity
High WAG ratioLarge CO2 slug sizes
Conclusions