Embed Size (px)
Citation preview
Malaysian Journal of Analytical Sciences, Vol 20 No 5 (2016): 1001 - 1010
DOI: http://dx.doi.org/10.17576/mjas-2016-2005-04
1001
MALAYSIAN JOURNAL OF ANALYTICAL SCIENCES
Published by The Malaysian Analytical Sciences Society
OPTIMIZATION PARAMETER FOR THERMOELECTRIC PROPERTIES OF
ZnO USING RESPONSE SURFACE METHODOLOGY
(Pengoptimuman Parameter Untuk Sifat Termoelektrik ZnO Menggunakan
Kaedah Gerak Balas Permukaan)
Lim Joon Hoong*, Yeoh Cheow Keat, Abdullah Chik, Teh Pei Leng
School of Materials Engineering,
Universiti Malaysia Perlis, 02600 Jejawi, Perlis, Malaysia
*Corresponding author: [email protected]
Received: 5 January 2016; Accepted: 23 May 2016
Abstract
The effect of Al dopants and sintering temperature on thermoelectric properties of ZnO was studied using the response surface
method. The design of experimental work was performed with the response surface method used to determine the significant
level of factors which are sintering temperature in the range of 800 – 1000 °C and Al dopants in the range of 0 – 4 wt.%. The
thermoelectric properties of Al-doped ZnO were enhanced with increasing Al dopants and slightly decreased when increasing
sintering temperature. Additional phase ZnAl2O4 was detected for 3 wt.% and 4 wt.% Al-doped ZnO pellets as the sintering
temperature increased to 1000 °C. The presence of ZnAl2O4 phase slightly decreased the electrical conductivity compared to
single ZnO phase samples. The optimum parameter values for this study was Al dopant (4 wt.%) and sintering temperature (800
°C). The effect of Al doping to the band structure of ZnO was studied using first-principles based on density functional theory
(DFT). The calculated band structure of ZnO and Al doped ZnO shows that ZnO is a direct band gap semiconductor. The
calculated band gap of ZnO (0.749 eV) become smaller with the concentration of Al doping increased to 4 wt.% (0.551 eV). The
trend of the calculated band gap of Al-doped ZnO was in agreement with the electrical conductivity test results which increased
with increasing Al content. However, it must be noted that the software predictions do not take into account the presence of
additional ZnAl2O4 phases. The presence of these extra phases may lead to even lower electrical conductivity.
Keywords: Al-doped ZnO, response surface method, sintering temperature, thermoelectric, electronic band structure
Abstrak
Kesan Al dop dan suhu pembakaran ke atas termoelektrik ZnO dikaji dengan menggunakan kaedah gerak balas permukaan. Reka
bentuk kerja eksperimen telah dilakukan dengan kaedah gerak balas permukaan untuk menentukan aras signifikan suhu
pembakaran pada julat 800 – 1000 °C dan Al dop dalam lingkungan 0 – 4% berat. Sifat – sifat termoelektrik Al-dop ZnO telah
dipertingkatkan dengan peningkatan Al dop dan pensinteran suhu. Fasa tambahan ZnAl2O4 dikesan bagi 3% berat dan 4% berat
Al-dop ZnO bila suhu pembakaran meningkat daripada 800 °C hingga 1000 °C. Kekonduksian elektrik menurun dengan
kehadiran fasa ZnAl2O4 berbanding sampel fasa ZnO tunggal. Nilai – nilai parameter optimum untuk kajian ini adalah Al
pendopan (4% berat) dan suhu pensinteran (800 °C). Kesan Al doping kepada struktur jalur ZnO dikaji menggunakan prinsip
pertama berdasarkan teori fungsi ketumpatan. Struktur jalur yang dikira pada ZnO dan Al dop ZnO menunjukkan bahawa ZnO
adalah semikonduktor jurang jalur terus. Dengan Al dop, jurang jalur ZnO (0.749 eV) menjadi lebih kecil dengan peningkatan
kepekatan Al dop pada 4 wt.% (0.551 eV). Trend jurang jalur yang dikira pada ZnO Al-didopkan adalah selari dengan keputusan
ujian kekonduksian elektrik yang meningkat dengan peningkatan kandungan Al. Walau bagaimanapun, ia perlu diambil
perhatian bahawa ramalan perisian tidak mengambil kira kehadiran fasa ZnAl2O4 tambahan. Kehadiran kedua – fasa tambahan
boleh membawa kepada kekonduksian elektrik yang lebih rendah.
ISSN
1394 - 2506
Lim et al: OPTIMIZATION PARAMETER FOR THERMOELECTRIC PROPERTIES OF ZnO USING
RESPONSE SURFACE METHODOLOGY
1002
Kata kunci: Al dop ZnO, kaedah gerak balas permukaan, suhu pembakaran, termoelektrik, struktur jalur elektronik
Introduction
Thermoelectric materials could potentially convert heat into electricity through thermoelectric power [1]. The
efficiency of energy conversion depends on the thermoelectric figure of merit of the material. Based on the figure of
merit, these materials must have the unique combination of high electrical conductivity, high Seebeck coefficient
and low thermal conductivity [2]. Seebeck coefficient (S) of a material is the voltage generated between two points
in the material per unit temperature difference between these points [3].
Zinc oxide (ZnO) is an II-VI compound semiconductor with a wide direct band gap at room temperature [4]. It is a
widely used material in various application such as gas sensors, varistors, UV resistive coatings, piezoelectric
devices, surface acoustic wave devices and transparent conductive oxide electrodes [5,6]. The main drawback of
ZnO as thermoelectric materials is due to the low electrical conductivity at room temperature. The electrical
conductivity can be increased by special heat treatment and doping of specific impurities into the crystal lattice. In
the hexagonal close packed lattice of the ZnO wurtzite structure, half of the tetrahedral holes and all of the
octahedral holes are empty, providing further possible dopant sites [7]. A dopant ion introduced to modify the
electronic properties of a material needs to be incorporated into the crystal structure of the host material (either in
lattice sites or interstitially). ZnO can even be made to exhibit metallic conductivity as for transparent electrode
similar to Indium tin oxide glass. In general, 0.5 – 1% addition of trivalent cations such as aluminium (Al) and
chromium (Cr) decrease the resistivity of ZnO approximately 10 orders of magnitude [8]. Jimenez-Gonzalez et al.
[9] explains the increase in the conductivity of ZnO when Al is introduced as a dopant, in terms of donor behaviour
from Al. Al has one valence electron more than Zn, substitution of Al for the Zn atom or Al occupation of the
interstitial sites increases the concentration of charge carriers present in the material.
The properties of ZnO are related to the composition and phase formation. The conductivity properties of ZnO can
be tailored by controlling the deviation from stoichiometry and doping [10]. Therefore, it is necessarily to
understand the effect of the individual dopant element to the electrical properties and phase formation of ZnO. In
this work, the effect of Al dopant (0 – 4 wt.%) and sintering temperature (800 – 1000 oC) on the thermoelectric
properties were studied using the response surface methodology. The band structure of ZnO with different Al
contents are calculated by first principles method based on Density Functional Theory (DFT) as a comparison for
the electrical conductivity.
Materials and Methods
Chemical and reagent
Analytical grade ZnO powder and Al2O3 powder were used as the starting materials for the preparation of pellet
samples. The properties of ZnO and Al2O3 were shown in Table 1.
Table 1. Properties of ZnO, Al2O3, Fe2O3 and CuO (HmbG Chemicals)
Properties Zinc oxide Alumina
Molecular formula ZnO Al2O3
Molar mass, g/mol 81.408 375.134
Appearance white solid white solid
Density, g/cm3 5.606 3.95 – 4.1
Experimental procedure
Appropriate amounts of ZnO and Al2O3 powder were mixed using the solid state method to prepare 0, 1, 2, 3 and 4
wt.% Al-doped ZnO. The samples were shaped into pellets of 5 mm of thickness and 15 mm in diameter. All

Malaysian Journal of Analytical Sciences, Vol 20 No 5 (2016): 1001 - 1010
DOI: http://dx.doi.org/10.17576/mjas-2016-2005-04
1003
samples were compacted using a cold hydraulic press machine at 75MPa for 10min. The green compact was
sintered in furnace (Model HT4-1600-SIC) at different sintering temperature 800 °C, 900 °C and 1000 °C for 4
hours with heating rate of 10 °C/min. The synthesized samples were characterized by X-ray diffraction analysis
(Shimadzu XRD 2000). The electrical conductivity of the samples was determined by the two-probe method. The
current voltage measurements were carried out using a Keithley’s source measure unit (Model SMU 236). The
thermal conductivity of the samples was determined based on Fourier’s law. The Seebeck coefficient was measured
by using differential method [11] at room temperature. Response surface methodology Response surface methodology is a statistical method used to improve and optimize process. The response surface
methodology has the advantages to evaluate multiple processing parameters and reduced the number of
experimental trials. The experimental results were evaluated by the dependent variables of thermoelectric efficiency
using Design Expert 8 [12] with surface response model. The results are obtained with the experimental design that
was aimed at identifying the best levels of the Al doping (0 – 4 wt.%) and sintering temperature (800 – 1000 °C).
The analysis of variance (ANOVA) is a statistical technique for the purpose of testing hypotheses on the parameters
of the model. A 3-factor, 3-level factorial Box–Behnken design (BBD) was employed to investigate the effects of
selected variables. BBD which is a widely used form of response surface methodology, specially made to require
only 3 levels, coded as –1, 0, and +1. BBD is an independent, rotatable or nearly rotatable quadratic design
(contains no embedded factorial or fractional factorial design) in which the treatment combinations are at the
midpoints of the edges of the process space and at the centre.
Computational method The ABINIT program was used to perform the band structure calculations. ABINIT is an open source program that
used to compute band structure and ground state properties. The band structures of Al doped ZnO was calculated
based on the DFT Kohn-Sham equations with GW computations. The GW method is a Green function technique
that obtained the electron self-energy and provides an accurate determination of the quasiparticle excitation energies
[13]. The k-point parameter was 3 x 3 x 1 Monkhorst-Pack. The cut off energy was set to be 816 eV (30 hartree).
The ideal ZnO has a wurtzite structure at normal temperatures and pressures. The primitive cell parameters for ideal
ZnO were determined as α = 3.2005 Å, с/α = 1.6131 and u = 0.3792. The parameters used in ABINIT were
optimized with a convergence criterion 0.01 eV to calculate self-energy for the band gap.
Results and Discussion
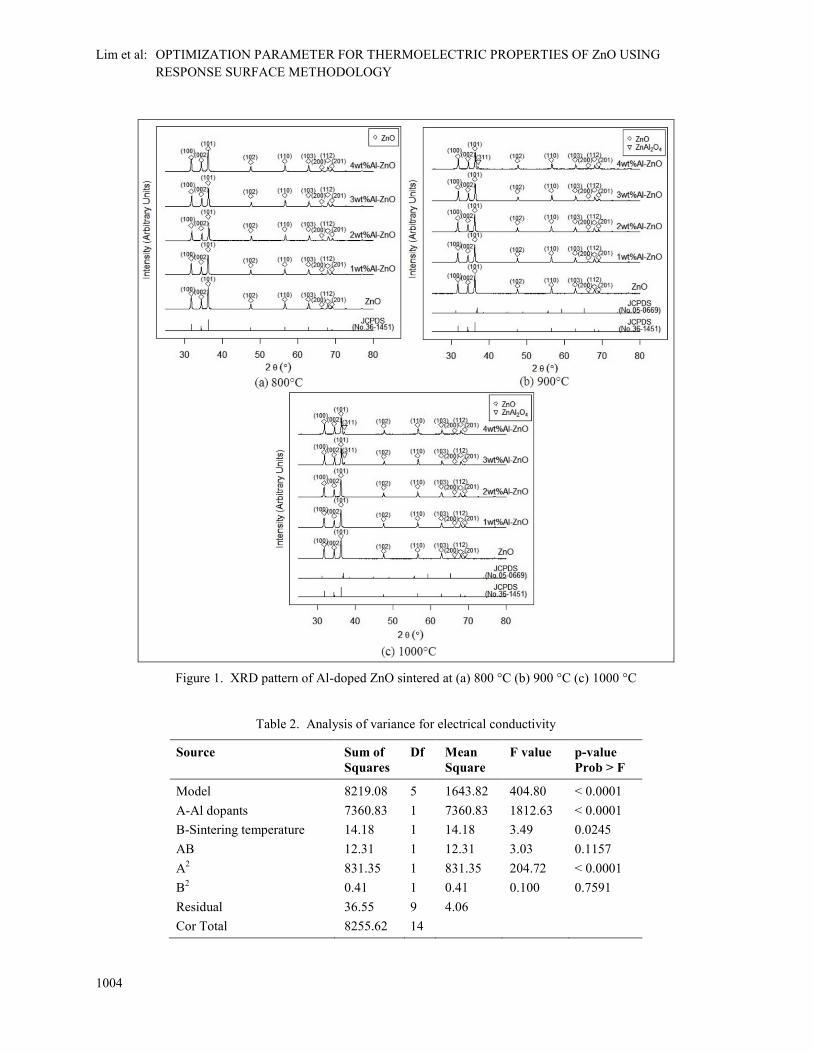
XRD analysis Based on Figure 1(a), all the samples peaks for 0, 1, 2, 3 and 4 wt.% Al-doped ZnO were identified as the plane
reflection for wurtzite phase of ZnO according to the JCPDS data file (No. 36-1451). The XRD pattern of Al-doped
ZnO sintered at 900 °C was indicated in Figure 1(b). Based on the test results, all the peaks for 0, 1, 2, 3 and 4 wt.%
Al-doped ZnO matched the JCPDS data file (No.36-1451) as the plane reflection for wurtzite phase of ZnO. There
was additional phase ZnAl2O4 that matched the JCPDS data file (No.05-0669) detected for 4 wt.% Al-doped ZnO
sintered at 900 °C. From the test results show in Figure 1(c), additional phase ZnAl2O4 was detected for 3 wt.% and
4 wt.% Al-doped ZnO with the sintering temperature increased to 1000 °C. The existence of secondary phase
ZnAl2O4 may reduce the electrical conductivity of the sample [14].
Electrical conductivity
Based on the analysis of variance (ANOVA) for electrical conductivity as shown in Table 2, the Model F-value of
404.80 implies the model was significant. The Prob > F values of less than 0.05 may indicate that Al dopants and
sintering temperature have significant effects on the electrical conductivity of the samples.
Lim et al: OPTIMIZATION PARAMETER FOR THERMOELECTRIC PROPERTIES OF ZnO USING
RESPONSE SURFACE METHODOLOGY
1004
Figure 1. XRD pattern of Al-doped ZnO sintered at (a) 800 °C (b) 900 °C (c) 1000 °C
Table 2. Analysis of variance for electrical conductivity
Source Sum of
Squares
Df Mean
Square
F value p-value
Prob > F
Model 8219.08 5 1643.82 404.80 < 0.0001
A-Al dopants 7360.83 1 7360.83 1812.63 < 0.0001
B-Sintering temperature 14.18 1 14.18 3.49 0.0245
AB 12.31 1 12.31 3.03 0.1157
A2
831.35 1 831.35 204.72 < 0.0001
B2
0.41 1 0.41 0.100 0.7591
Residual 36.55 9 4.06
Cor Total 8255.62 14
Malaysian Journal of Analytical Sciences, Vol 20 No 5 (2016): 1001 - 1010
DOI: http://dx.doi.org/10.17576/mjas-2016-2005-04
1005
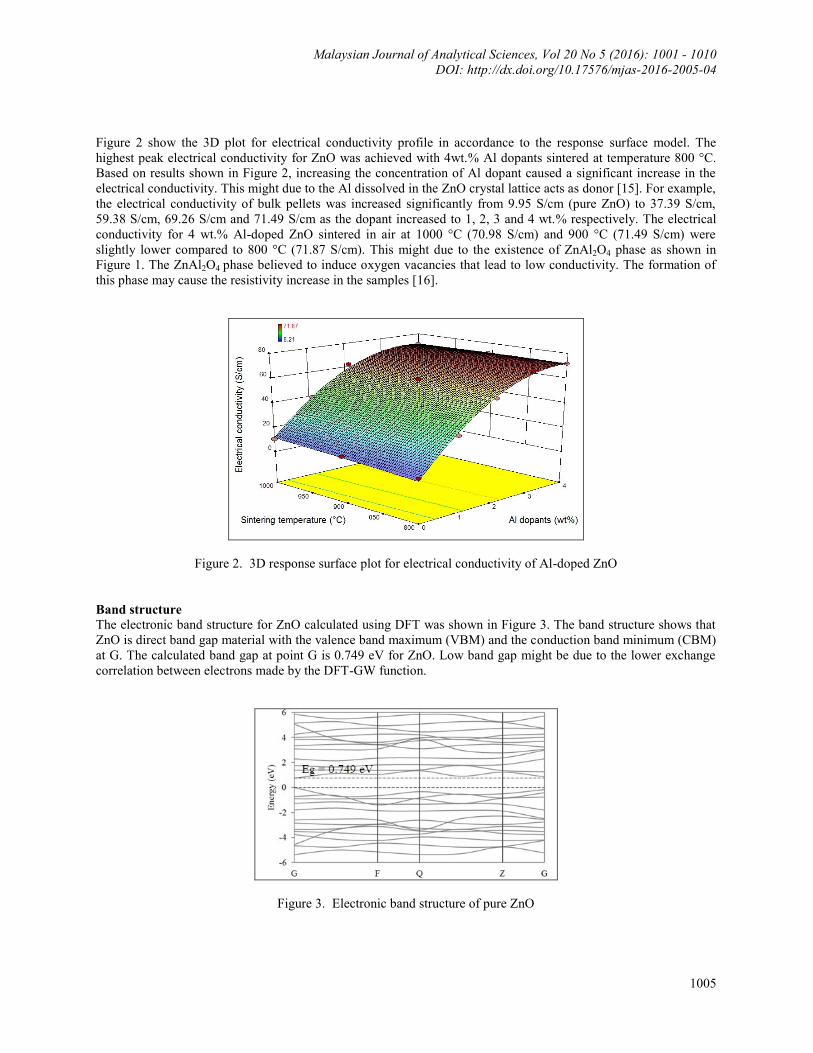
Figure 2 show the 3D plot for electrical conductivity profile in accordance to the response surface model. The
highest peak electrical conductivity for ZnO was achieved with 4wt.% Al dopants sintered at temperature 800 °C.
Based on results shown in Figure 2, increasing the concentration of Al dopant caused a significant increase in the
electrical conductivity. This might due to the Al dissolved in the ZnO crystal lattice acts as donor [15]. For example,
the electrical conductivity of bulk pellets was increased significantly from 9.95 S/cm (pure ZnO) to 37.39 S/cm,
59.38 S/cm, 69.26 S/cm and 71.49 S/cm as the dopant increased to 1, 2, 3 and 4 wt.% respectively. The electrical
conductivity for 4 wt.% Al-doped ZnO sintered in air at 1000 °C (70.98 S/cm) and 900 °C (71.49 S/cm) were
slightly lower compared to 800 °C (71.87 S/cm). This might due to the existence of ZnAl2O4 phase as shown in
Figure 1. The ZnAl2O4 phase believed to induce oxygen vacancies that lead to low conductivity. The formation of
this phase may cause the resistivity increase in the samples [16].
Figure 2. 3D response surface plot for electrical conductivity of Al-doped ZnO
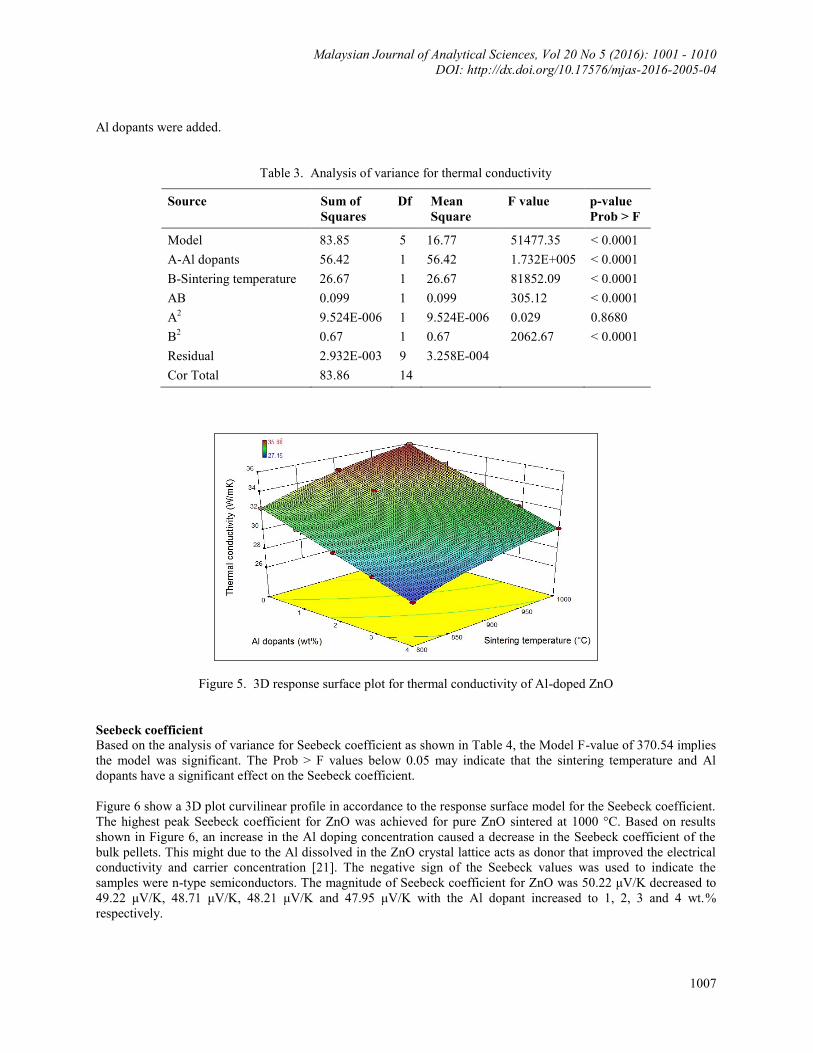
Band structure
The electronic band structure for ZnO calculated using DFT was shown in Figure 3. The band structure shows that
ZnO is direct band gap material with the valence band maximum (VBM) and the conduction band minimum (CBM)
at G. The calculated band gap at point G is 0.749 eV for ZnO. Low band gap might be due to the lower exchange
correlation between electrons made by the DFT-GW function.
Figure 3. Electronic band structure of pure ZnO

Lim et al: OPTIMIZATION PARAMETER FOR THERMOELECTRIC PROPERTIES OF ZnO USING
RESPONSE SURFACE METHODOLOGY
1006
Figure 4(a)-(d) shows the calculated band structure of 1 wt.% Al-ZnO, 2 wt.% Al-ZnO, 3 wt.% Al-ZnO and 4 wt.%
Al-ZnO respectively, the corresponding band gap are 0.684 eV, 0.619 eV, 0.557 eV and 0.551eV. The band gap
values of Al doped ZnO are smaller than pure ZnO shown in Figure 3. The band gap of Al doped ZnO becomes
smaller with increasing Al doping content. This may due to increase of carrier concentration and enhancement of
conduction [19]. As shown from Figure 4(a)-(d), The CBM and VBM are all located in the G point, it indicated that
Al doped ZnO is a direct band gap semiconductor. The electrical conductivity test results were similar to the
calculated band gap. The band gap becomes smaller with the amounts of Al doping increased that resulting an
increase in electrical conductivity. This emphasized that a reduction of the band gap would increase the intrinsic
(without defects) conductivity of ZnO. It shifts the intrinsic defect states to energies inside the conduction band.
Figure 4. Electronic band structure of Al doped ZnO
Thermal conductivity
Table 3 show the analysis of variance (ANOVA) output used to estimate the variation due to each factor. The Model
F-value of 51477.35 implies the model was significant. Values of “Prob > F” less than 0.05 indicate the model
terms are significant. The ANOVA indicates that changing the sintering temperature and Al dopants may have a
significant effect on the thermal conductivity of the samples.
The highest peak thermal conductivity for ZnO was achieved for pure ZnO sintered at 800°C. Based on results
shown in Figure 5, increasing the amount of Al dopants caused a decrease in the thermal conductivity of the
samples. The thermal conductivity of ZnO was 34.59 W/mK reduced to 33.21 W/mK, 31.82 W/mK, 30.44 W/mK
and 29.05 W/mK with the Al doping increased to 1, 2, 3 and 4 wt% respectively. The reduction of thermal
conductivity might due to the Al dopant suppress the lattice thermal conductivity of ZnO materials [20]. The
thermal conductivity of the ZnO pellets decreased slightly when increasing the amount of Al dopants. The wurtzite
ZnO has a high intrinsic thermal conductivity due to its strong covalent bonding and light atoms. The decrease in
the thermal conductivity might be due to a phonon scattering caused by increased ZnO crystal lattice disorder when
Malaysian Journal of Analytical Sciences, Vol 20 No 5 (2016): 1001 - 1010
DOI: http://dx.doi.org/10.17576/mjas-2016-2005-04
1007
Al dopants were added.
Table 3. Analysis of variance for thermal conductivity
Source Sum of
Squares
Df Mean
Square
F value p-value
Prob > F
Model 83.85 5 16.77 51477.35 < 0.0001
A-Al dopants 56.42 1 56.42 1.732E+005 < 0.0001
B-Sintering temperature 26.67 1 26.67 81852.09 < 0.0001
AB 0.099 1 0.099 305.12 < 0.0001
A2
9.524E-006 1 9.524E-006 0.029 0.8680
B2
0.67 1 0.67 2062.67 < 0.0001
Residual 2.932E-003 9 3.258E-004
Cor Total 83.86 14
Figure 5. 3D response surface plot for thermal conductivity of Al-doped ZnO
Seebeck coefficient Based on the analysis of variance for Seebeck coefficient as shown in Table 4, the Model F-value of 370.54 implies
the model was significant. The Prob > F values below 0.05 may indicate that the sintering temperature and Al
dopants have a significant effect on the Seebeck coefficient.
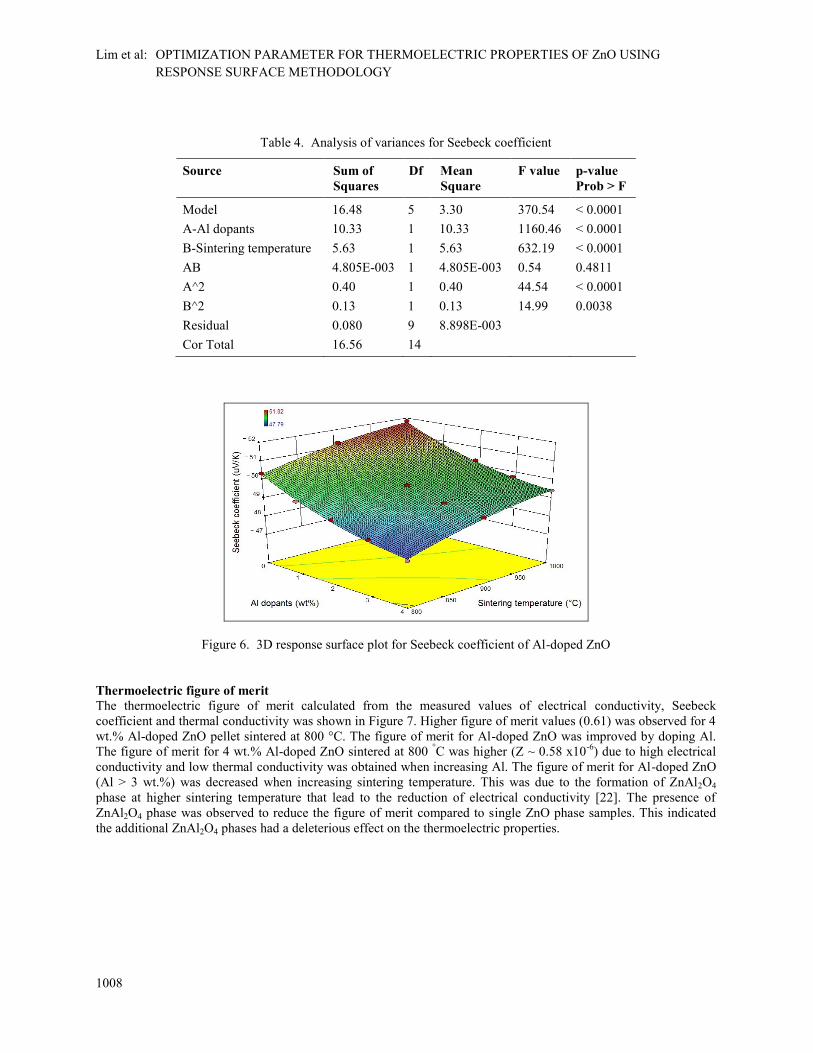
Figure 6 show a 3D plot curvilinear profile in accordance to the response surface model for the Seebeck coefficient.
The highest peak Seebeck coefficient for ZnO was achieved for pure ZnO sintered at 1000 °C. Based on results
shown in Figure 6, an increase in the Al doping concentration caused a decrease in the Seebeck coefficient of the
bulk pellets. This might due to the Al dissolved in the ZnO crystal lattice acts as donor that improved the electrical
conductivity and carrier concentration [21]. The negative sign of the Seebeck values was used to indicate the
samples were n-type semiconductors. The magnitude of Seebeck coefficient for ZnO was 50.22 μV/K decreased to
49.22 μV/K, 48.71 μV/K, 48.21 μV/K and 47.95 μV/K with the Al dopant increased to 1, 2, 3 and 4 wt.%
respectively.
Lim et al: OPTIMIZATION PARAMETER FOR THERMOELECTRIC PROPERTIES OF ZnO USING
RESPONSE SURFACE METHODOLOGY
1008
Table 4. Analysis of variances for Seebeck coefficient
Source Sum of
Squares
Df Mean
Square
F value p-value
Prob > F
Model 16.48 5 3.30 370.54 < 0.0001
A-Al dopants 10.33 1 10.33 1160.46 < 0.0001
B-Sintering temperature 5.63 1 5.63 632.19 < 0.0001
AB 4.805E-003 1 4.805E-003 0.54 0.4811
A^2 0.40 1 0.40 44.54 < 0.0001
B^2 0.13 1 0.13 14.99 0.0038
Residual 0.080 9 8.898E-003
Cor Total 16.56 14
Figure 6. 3D response surface plot for Seebeck coefficient of Al-doped ZnO
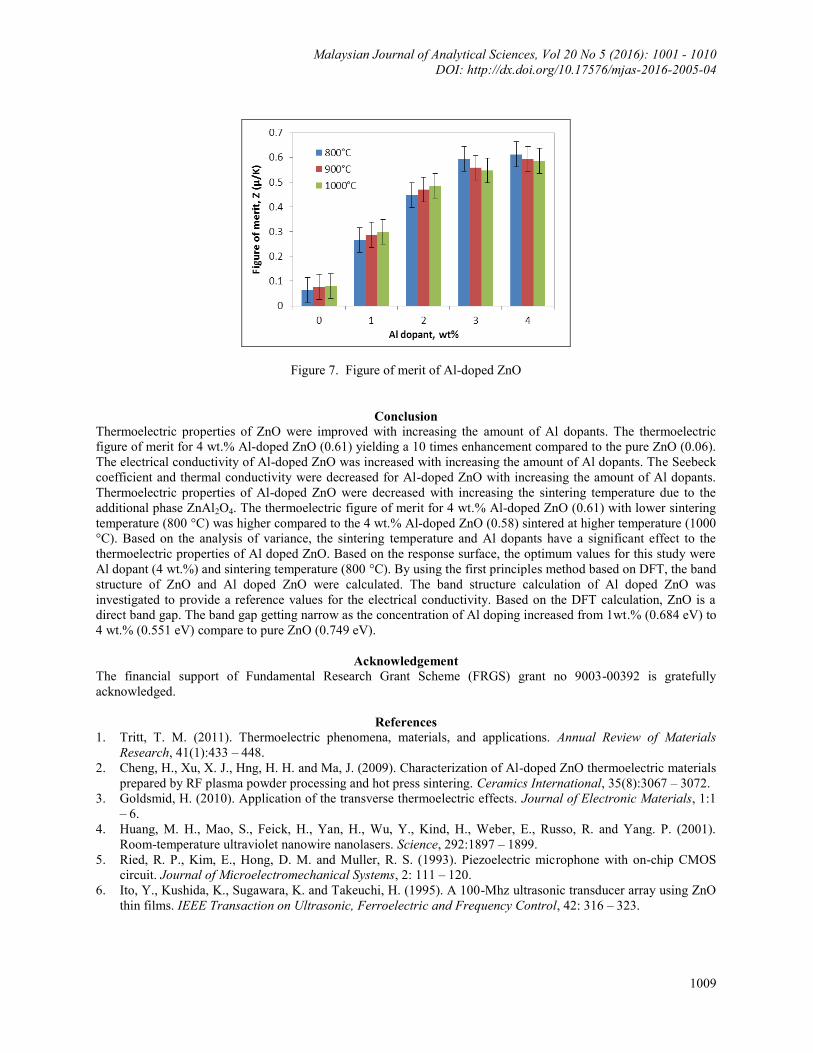
Thermoelectric figure of merit
The thermoelectric figure of merit calculated from the measured values of electrical conductivity, Seebeck
coefficient and thermal conductivity was shown in Figure 7. Higher figure of merit values (0.61) was observed for 4
wt.% Al-doped ZnO pellet sintered at 800 °C. The figure of merit for Al-doped ZnO was improved by doping Al.
The figure of merit for 4 wt.% Al-doped ZnO sintered at 800 °C was higher (Z ~ 0.58 x10
-6) due to high electrical
conductivity and low thermal conductivity was obtained when increasing Al. The figure of merit for Al-doped ZnO
(Al > 3 wt.%) was decreased when increasing sintering temperature. This was due to the formation of ZnAl2O4
phase at higher sintering temperature that lead to the reduction of electrical conductivity [22]. The presence of
ZnAl2O4 phase was observed to reduce the figure of merit compared to single ZnO phase samples. This indicated
the additional ZnAl2O4 phases had a deleterious effect on the thermoelectric properties.
Malaysian Journal of Analytical Sciences, Vol 20 No 5 (2016): 1001 - 1010
DOI: http://dx.doi.org/10.17576/mjas-2016-2005-04
1009
Figure 7. Figure of merit of Al-doped ZnO
Conclusion
Thermoelectric properties of ZnO were improved with increasing the amount of Al dopants. The thermoelectric
figure of merit for 4 wt.% Al-doped ZnO (0.61) yielding a 10 times enhancement compared to the pure ZnO (0.06).
The electrical conductivity of Al-doped ZnO was increased with increasing the amount of Al dopants. The Seebeck
coefficient and thermal conductivity were decreased for Al-doped ZnO with increasing the amount of Al dopants.
Thermoelectric properties of Al-doped ZnO were decreased with increasing the sintering temperature due to the
additional phase ZnAl2O4. The thermoelectric figure of merit for 4 wt.% Al-doped ZnO (0.61) with lower sintering
temperature (800 °C) was higher compared to the 4 wt.% Al-doped ZnO (0.58) sintered at higher temperature (1000
°C). Based on the analysis of variance, the sintering temperature and Al dopants have a significant effect to the
thermoelectric properties of Al doped ZnO. Based on the response surface, the optimum values for this study were
Al dopant (4 wt.%) and sintering temperature (800 °C). By using the first principles method based on DFT, the band
structure of ZnO and Al doped ZnO were calculated. The band structure calculation of Al doped ZnO was
investigated to provide a reference values for the electrical conductivity. Based on the DFT calculation, ZnO is a
direct band gap. The band gap getting narrow as the concentration of Al doping increased from 1wt.% (0.684 eV) to
4 wt.% (0.551 eV) compare to pure ZnO (0.749 eV).
Acknowledgement
The financial support of Fundamental Research Grant Scheme (FRGS) grant no 9003-00392 is gratefully
acknowledged.
References
1. Tritt, T. M. (2011). Thermoelectric phenomena, materials, and applications. Annual Review of Materials
Research, 41(1):433 – 448. 2. Cheng, H., Xu, X. J., Hng, H. H. and Ma, J. (2009). Characterization of Al-doped ZnO thermoelectric materials
prepared by RF plasma powder processing and hot press sintering. Ceramics International, 35(8):3067 – 3072. 3. Goldsmid, H. (2010). Application of the transverse thermoelectric effects. Journal of Electronic Materials, 1:1
– 6. 4. Huang, M. H., Mao, S., Feick, H., Yan, H., Wu, Y., Kind, H., Weber, E., Russo, R. and Yang. P. (2001).
Room-temperature ultraviolet nanowire nanolasers. Science, 292:1897 – 1899. 5. Ried, R. P., Kim, E., Hong, D. M. and Muller, R. S. (1993). Piezoelectric microphone with on-chip CMOS
circuit. Journal of Microelectromechanical Systems, 2: 111 – 120. 6. Ito, Y., Kushida, K., Sugawara, K. and Takeuchi, H. (1995). A 100-Mhz ultrasonic transducer array using ZnO
thin films. IEEE Transaction on Ultrasonic, Ferroelectric and Frequency Control, 42: 316 – 323.
Lim et al: OPTIMIZATION PARAMETER FOR THERMOELECTRIC PROPERTIES OF ZnO USING
RESPONSE SURFACE METHODOLOGY
1010
7. Burdett, J. K., Price, G. D. and Price, S. L. (1982). Role of the crystal field theory in determining the structures
of spinels. Journal of the American Chemical Society, 104(1): 92 – 95. 8. Yan, X. D., Han, J., Chen, R. Q., Gao, W., Metson, J. and Zou., C. W. (2009). Study of a nitrogen-doped ZnO
film with synchrotron radiation. Applied Physics Letters, 94: 171903. 9. Jimenez-Gonzalez, A. E., Jose A., Urueta, S. and Suarez-Parra, R. (1998). Optical and electrical characteristics
of aluminum-doped ZnO thin films prepared by sol-gel technique. Journal of Crystal Growth, 192: 430 – 438. 10. Look, D. C. (2001). Recent advances in ZnO materials and devices. Materials Science and Engineering B,
80(1-3): 383 – 387. 11. Ravinder, D. (1999). Thermoelectric power studies of zinc substituted copper ferrites. Journal of Alloys and
Compounds, 291(1-2): 208 – 214. 12. Inc.Stat-Ease. (2007). Design Expert Software, Educational Version 7.0.3, Wiley Publishing. 13. Gonze, X., Amadon, B., Anglade, P. M., Beuken, J. M., Bottin, F. and Boulanger, P. (2009). ABINIT: first-
principles approach to material and nanosystem properties. Computer Physical Communication, 180: 2582 – 2615.
14. Takagi, Y., Ito, M., Majima, K., Nagai, H., and Katsuyama, S. (2002). Thermoelectric properties of
(Zn1yMgy)1xAlxO ceramics prepared by the polymerized complex method. Journal of Applied Physics, 92:
1391 – 1398. 15. Qu, X., Wang, W., Lv, S., and Jia, D. (2011). Thermoelectric properties and electronic structure of Al-doped
ZnO. Solid State Communications, 151(4): 332 – 336. 16. Han, J., Mantas, P. Q., and Senos, A.M.R. (2001). Effect of Al and Mn doping on the electrical conductivity of
ZnO. Journal of the European Ceramic Society, 21(10-11): 1883 – 1886. 17. Zhang, M., Zhang, C. H. and Shen, J. (2011). First-principles calculation of electronic structure of MgxZn1-xO
codoped with aluminium and nitrogen. Chinese Physics B, 20: 017101. 18. Yang, P., Zhao, Y. and Yang, H. (2015). Investigation on optoelectronic performances of Al, N codoped ZnO:
First-principles method. Ceramics International, 41: 2446 – 2452. 19. Li, P., Deng, S. H., Li, Y. B., Huang, J., Liu, G. H. and Zhang, L. (2011). Aluminum and nitrogen impurities in
Wurtzite ZnO: first-principles studies, Physica B, 406: 3125 – 3129. 20. Ozgur, U., Ya, Liu, C., Teke, A., Reshchikov, M. A., Dogan, S., V., Avrutin, Cho, S. J. and Morkoc, H. (2005).
A comprehensive review of ZnO materials and devices. Journal of Applied Physics, 98(4): 1 –103. 21. Bhan, R. and Dhar, V. (2004). Carrier density approximation for non-parabolic and highly degenerated
HgCdTe semiconductors. Semiconductor Science and Technology, 19(3): 413 – 416. 22. Cheng, H., Xu, X. J., Hng, H. H. and Ma, J. (2009). Characterization of Al-doped ZnO thermoelectric materials
prepared by RF plasma powder processing and hot press sintering. Ceramics International, 35(8): 3067 – 3072.