Embed Size (px)
Citation preview
REV.CHIM.(Bucharest)♦ 67♦ No. 4 ♦ 2016 http://www.revistadechimie.ro 665
Optimization of Total Monomeric Anthocyanin andTotal Flavonoid Content Extractions from Purple Potato
Tubers Using Ultrasonic Treatments
FLORENTINA DAMSA1,2*, ALEXANDRU WOINAROSCHY1, GHEORGHE OLTEANU2, CARMEN LILIANA BADARAU2,3
1 Politehnica University of Bucharest, Department of Chemical and Biochemical Engineering, 1-7 Polizu Str., 011061, Bucharest,Romania2 National Institute of Research and Development for Potato and Sugar Beet, 2 Fundaturii Str., 500470, Brasov, Romania3 University Transilvania of Brasov, Faculty of Food and Tourism, 148 Castelului Str., 500014, Brasov, Romania
The recent interest on phenolic bioactive compounds has caused an increased attention for optimizing thetechniques used in bioactive phytochemicals extraction from different natural sources. In order to determinethe best extraction conditions using direct sonication were varied amplitude (20, 50 and 80%) ant sonicationtime (5, 15 and 25 min). To optimize the extraction process was performed mathematical modeling (fullfactorial experiments 22) using SigmaXL software. The total anthocyanins content were determinedspectrophotometrically by the pH differential method and the total flavonoids content were determinecolorimetric by AlCl3 method.
Keywords: purple potato tuber, anthocyanin pigments, flavonoids, sonication
* email: [email protected]
Potato is the fourth food culture of the world, after corn,wheat and rice, with a production of 329 million tonnesper year. Worldwide, in terms of harvested area potatoranks seven after wheat, rice, corn, barley, sorghum andrapeseed. In terms of consumption, potato ranks third afterrice and wheat. In Romania, currently, from the totalcultivated area of 8.9 million hectares, potato ranks thirdwith a share of about 3.2% after cereals which represent62% and oilseeds 15% [1].
Potatoes are significant source of natural antioxidantsand exhibit antioxidant activity as demonstrated in recenttime by many authors. Studies have indicated that thesephytochemicals have high free-radical scavenging activity,which helps to reduce the risk of chronic diseases andage-related neuronal degeneration [2]. Genotypes of potatowith peel and pulp intensely colored (red, purple, blue) haveantioxidant capacity 2-3 times higher than the white / yellowgenotypes, and these aliments could help to supplementthe required daily doses of antioxidants in the diet [3]. As aresult, in recent years, breeder’s efforts intensified to getnew potato genotypes in different versions: blue peel andpulp [4, 5].
Because anthocyanin pigments are powerfulantioxidants [6] has increased the need to improveextraction techniques. In order to increase the extractionefficiency can be used ultrasonic extraction technique.Ultrasound-assisted extraction is one of the most importanttechniques used for the extraction of valuable compoundsfrom plant materials and is quite adaptable to a small orlarge scale. The method involves the use of ultrasound withfrequencies ranging from 20 kHz to 2000 kHz, whichincreases the permeability of cell walls and causing celllysis, thus favoring the extraction of biologically activecompounds [7, 8]. The application of ultrasound-assistedextraction for plant materials [9] and its opportunities inthe food processing industry [10] has proved manyadvantages [11].
The main objective of this paper was to optimise theextraction yield of total anthocyanin and total flavonoid
content from purple potato tuber by varying the amplitudeand sonication time of a direct ultrasonic treatment. Theultrasonic conditions were compared with an indirectsonication using a bath system.
Experimental partMaterial and methodsPlant materials
The potato variety, violet-blue de Galanesti, a populationfound in Romania [10], was analysed after 20 days ofharvest from the research field of NIRDPSB Brasov,Romania.
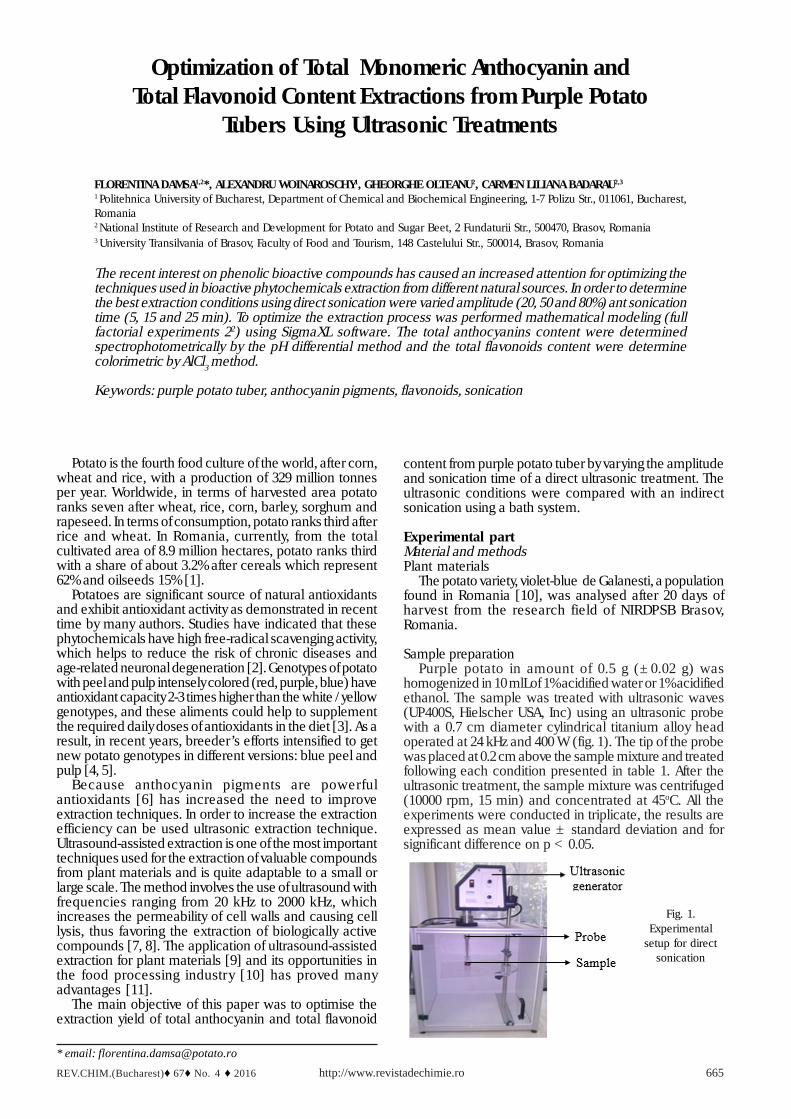
Sample preparationPurple potato in amount of 0.5 g (±0.02 g) was
homogenized in 10 mlLof 1% acidified water or 1% acidifiedethanol. The sample was treated with ultrasonic waves(UP400S, Hielscher USA, Inc) using an ultrasonic probewith a 0.7 cm diameter cylindrical titanium alloy headoperated at 24 kHz and 400 W (fig. 1). The tip of the probewas placed at 0.2 cm above the sample mixture and treatedfollowing each condition presented in table 1. After theultrasonic treatment, the sample mixture was centrifuged(10000 rpm, 15 min) and concentrated at 45oC. All theexperiments were conducted in triplicate, the results areexpressed as mean value ± standard deviation and forsignificant difference on p < 0.05.
Fig. 1.Experimental
setup for directsonication
http://www.revistadechimie.ro REV.CHIM.(Bucharest)♦ 67♦ No. 4 ♦ 2016666
Full factorial design for the extraction process ofanthocyanins and flavonoids
A two-level and two-factor full factorial experiment(table 2) with two-centered point was design and createdusing SigmaXL statistical analysis software (EconotronSoftware Inc., Canada) to cover the range of investigatedultrasonic treatment time and amplitude. Sonication timeand sonication amplitude were chosen as independentvariables ant the total flavonoid content (TFC) and totalmonomeric anthocyanins (TAC) were the responses of thedesign.
The full factorial experimental design for each responsewith each extraction solvent was analyzed using SigmaXLand expressed in a first order model:
Y=β0+β1T+β2A+β12TA (1)
The semnifications of symbols used in this formula are:Y – Response design (TFC or TAC);β0 – Intercept term;β1 and β2 – Linear coefficients;β12 – Interaction coefficient;T and A – Independent variables (sonication time and
amplitude).
Determination of total monomeric anthocyanin contentThe total monomeric anthocyanins content (TAC) were
determined through pH differential method [11] based onthe property of anthocyanin pigments to change the colorwith pH. Two dilutions of the same sample were prepared,the first one in potassium chloride buffer (0.025 M, pH 1.0)and the second one in sodium acetate buffer (0.4 M, pH4.5), pH being adjusted with HCl 0.2N. After equilibration atroom temperature for 15 min, the absorbance of twodilutions was read at 510 nm and 700 nm using a UV-VisMicroplate Readers (Sunrise-Basic Tecan, Switzerland).Total monomeric anthocyanins - mg cyanidin 3-glucoside(cy-3-glu) equivalent / 100 g Fresh Weight - were calculatedas follows:
The semnifications of symbols used in these relationsare:
A – Absorbanceε – Molar extinction coefficient (34300 L / mol . cm for
cy-3-glu)L – Path lengthMW – Molecular weight (484.84 g/mol for cy-3-glu)DF – Dilution factorV – VolumeWt – sample weight
Determination of total flavonoid contentThe total flavonoid content (TFC) of purple potato
extracts was determined by a colorimetric method asdescribed previously in other studies [12, 13].
The extracts were diluted with 2 mL of distilled waterand 150 µL 5% NaNO2 was added. After 6 min the mixturewas treated with 150 µL AlCl3 10% and, after 6 min, with 2ml NaOH 1N and the volum were made to 5 mL. Theabsorbance was recorded at 510 nm using a specto-photometer (DR2800, Hach, USA) and the flavonoid contentwas expressed as mg of quercetin equivalents for 100 g ofFresh Weigh (FW).
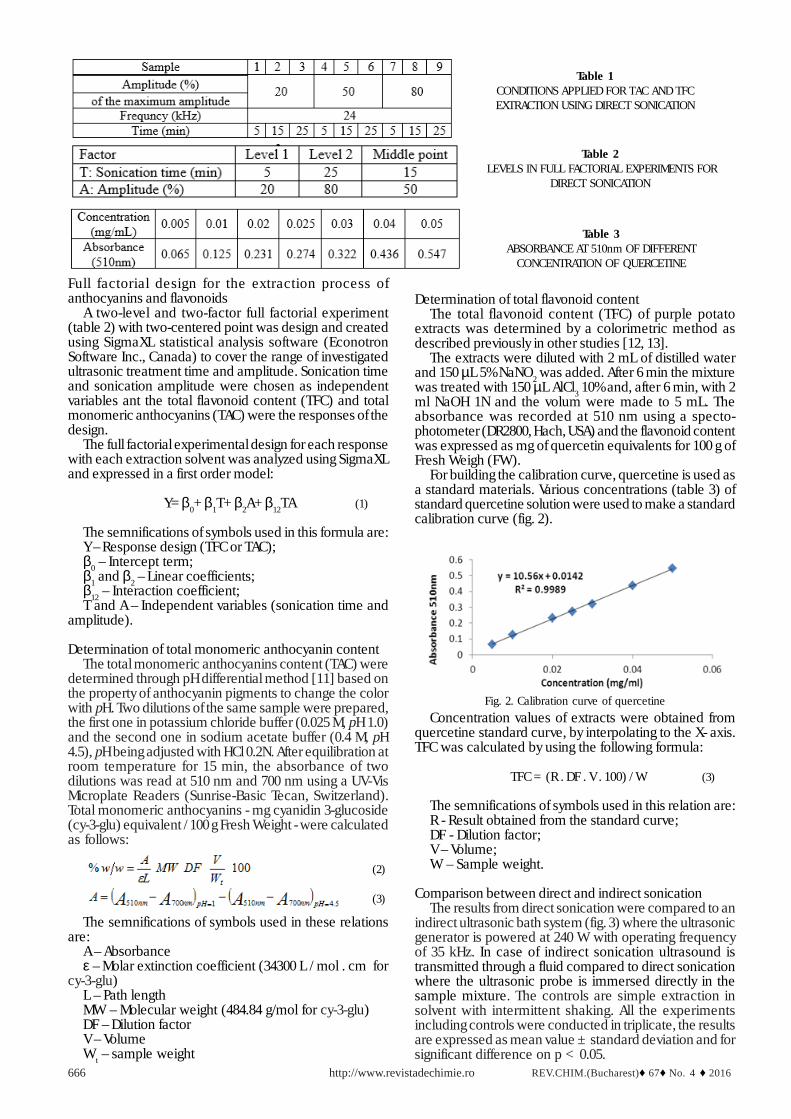
For building the calibration curve, quercetine is used asa standard materials. Various concentrations (table 3) ofstandard quercetine solution were used to make a standardcalibration curve (fig. 2).
Table 2 LEVELS IN FULL FACTORIAL EXPERIMENTS FOR
DIRECT SONICATION
(2)
Table 3ABSORBANCE AT 510nm OF DIFFERENT
CONCENTRATION OF QUERCETINE
Table 1CONDITIONS APPLIED FOR TAC AND TFCEXTRACTION USING DIRECT SONICATION
Fig. 2. Calibration curve of quercetineConcentration values of extracts were obtained from
quercetine standard curve, by interpolating to the X- axis.TFC was calculated by using the following formula:
TFC = (R . DF . V . 100) / W (3)
The semnifications of symbols used in this relation are:R - Result obtained from the standard curve;DF - Dilution factor;V – Volume;W – Sample weight.
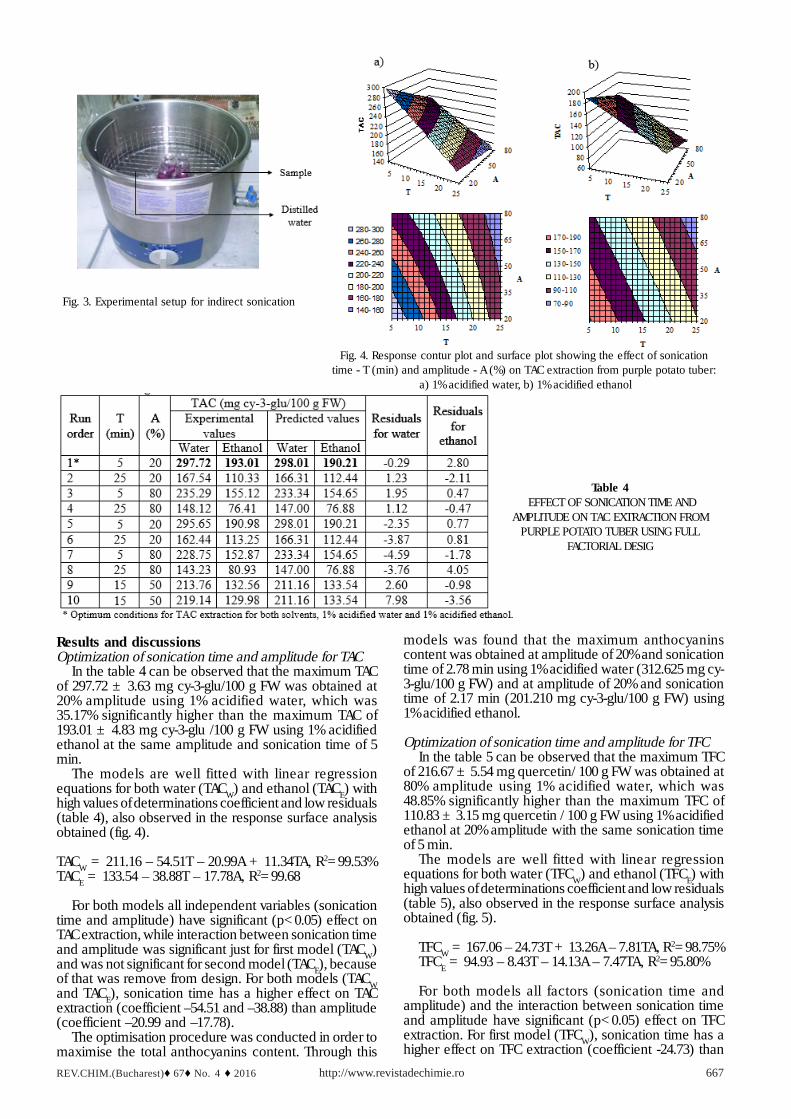
Comparison between direct and indirect sonicationThe results from direct sonication were compared to an
indirect ultrasonic bath system (fig. 3) where the ultrasonicgenerator is powered at 240 W with operating frequencyof 35 kHz. In case of indirect sonication ultrasound istransmitted through a fluid compared to direct sonicationwhere the ultrasonic probe is immersed directly in thesample mixture. The controls are simple extraction insolvent with intermittent shaking. All the experimentsincluding controls were conducted in triplicate, the resultsare expressed as mean value ± standard deviation and forsignificant difference on p < 0.05.
(3)
REV.CHIM.(Bucharest)♦ 67♦ No. 4 ♦ 2016 http://www.revistadechimie.ro 667
Results and discussionsOptimization of sonication time and amplitude for TAC
In the table 4 can be observed that the maximum TACof 297.72 ± 3.63 mg cy-3-glu/100 g FW was obtained at20% amplitude using 1% acidified water, which was35.17% significantly higher than the maximum TAC of193.01 ± 4.83 mg cy-3-glu /100 g FW using 1% acidifiedethanol at the same amplitude and sonication time of 5min.
The models are well fitted with linear regressionequations for both water (TACW) and ethanol (TACE) withhigh values of determinations coefficient and low residuals(table 4), also observed in the response surface analysisobtained (fig. 4).
TACW = 211.16 – 54.51T – 20.99A + 11.34TA, R2=99.53%TACE = 133.54 – 38.88T – 17.78A, R2=99.68
For both models all independent variables (sonicationtime and amplitude) have significant (p<0.05) effect onTAC extraction, while interaction between sonication timeand amplitude was significant just for first model (TACW)and was not significant for second model (TACE), becauseof that was remove from design. For both models (TACWand TACE), sonication time has a higher effect on TACextraction (coefficient –54.51 and –38.88) than amplitude(coefficient –20.99 and –17.78).
The optimisation procedure was conducted in order tomaximise the total anthocyanins content. Through this
models was found that the maximum anthocyaninscontent was obtained at amplitude of 20% and sonicationtime of 2.78 min using 1% acidified water (312.625 mg cy-3-glu/100 g FW) and at amplitude of 20% and sonicationtime of 2.17 min (201.210 mg cy-3-glu/100 g FW) using1% acidified ethanol.
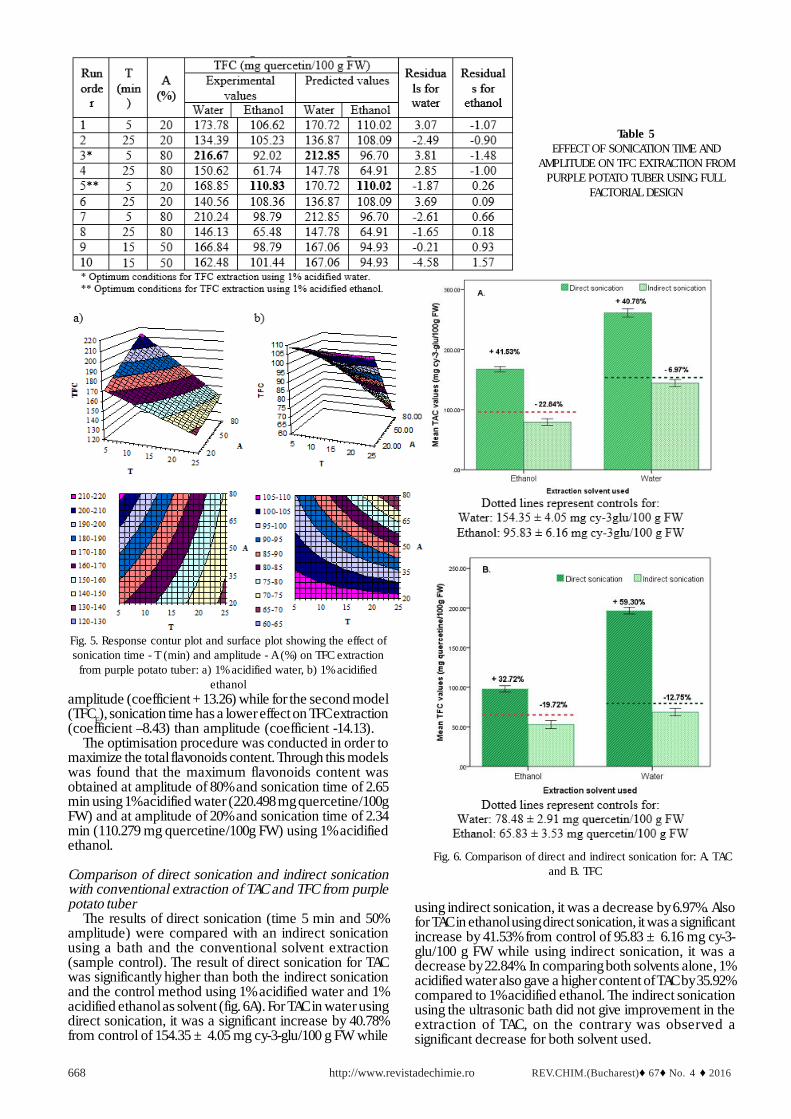
Optimization of sonication time and amplitude for TFCIn the table 5 can be observed that the maximum TFC
of 216.67 ± 5.54 mg quercetin/ 100 g FW was obtained at80% amplitude using 1% acidified water, which was48.85% significantly higher than the maximum TFC of110.83 ± 3.15 mg quercetin / 100 g FW using 1% acidifiedethanol at 20% amplitude with the same sonication timeof 5 min.
The models are well fitted with linear regressionequations for both water (TFCW) and ethanol (TFCE) withhigh values of determinations coefficient and low residuals(table 5), also observed in the response surface analysisobtained (fig. 5).
TFCW = 167.06 – 24.73T + 13.26A – 7.81TA, R2=98.75%TFCE = 94.93 – 8.43T – 14.13A – 7.47TA, R2=95.80%
For both models all factors (sonication time andamplitude) and the interaction between sonication timeand amplitude have significant (p<0.05) effect on TFCextraction. For first model (TFCW), sonication time has ahigher effect on TFC extraction (coefficient -24.73) than
Fig. 3. Experimental setup for indirect sonication
Fig. 4. Response contur plot and surface plot showing the effect of sonicationtime - T (min) and amplitude - A (%) on TAC extraction from purple potato tuber:
a) 1% acidified water, b) 1% acidified ethanol
Table 4 EFFECT OF SONICATION TIME AND
AMPLITUDE ON TAC EXTRACTION FROMPURPLE POTATO TUBER USING FULL
FACTORIAL DESIG
http://www.revistadechimie.ro REV.CHIM.(Bucharest)♦ 67♦ No. 4 ♦ 2016668
amplitude (coefficient +13.26) while for the second model(TFCE), sonication time has a lower effect on TFC extraction(coefficient –8.43) than amplitude (coefficient -14.13).
The optimisation procedure was conducted in order tomaximize the total flavonoids content. Through this modelswas found that the maximum flavonoids content wasobtained at amplitude of 80% and sonication time of 2.65min using 1% acidified water (220.498 mg quercetine/100gFW) and at amplitude of 20% and sonication time of 2.34min (110.279 mg quercetine/100g FW) using 1% acidifiedethanol.
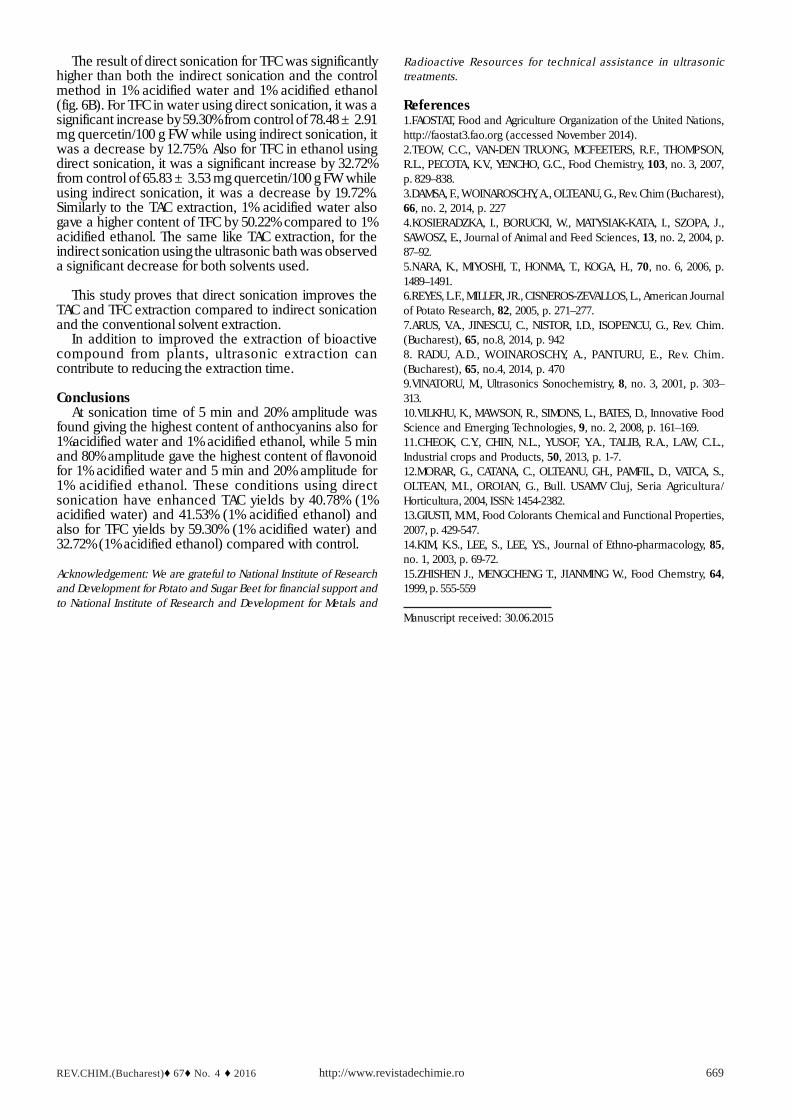
Comparison of direct sonication and indirect sonicationwith conventional extraction of TAC and TFC from purplepotato tuber
The results of direct sonication (time 5 min and 50%amplitude) were compared with an indirect sonicationusing a bath and the conventional solvent extraction(sample control). The result of direct sonication for TACwas significantly higher than both the indirect sonicationand the control method using 1% acidified water and 1%acidified ethanol as solvent (fig. 6A). For TAC in water usingdirect sonication, it was a significant increase by 40.78%from control of 154.35 ± 4.05 mg cy-3-glu/100 g FW while
Fig. 5. Response contur plot and surface plot showing the effect ofsonication time - T (min) and amplitude - A (%) on TFC extraction
from purple potato tuber: a) 1% acidified water, b) 1% acidifiedethanol
Table 5EFFECT OF SONICATION TIME AND
AMPLITUDE ON TFC EXTRACTION FROMPURPLE POTATO TUBER USING FULL
FACTORIAL DESIGN
Fig. 6. Comparison of direct and indirect sonication for: A. TACand B. TFC
using indirect sonication, it was a decrease by 6.97%. Alsofor TAC in ethanol using direct sonication, it was a significantincrease by 41.53% from control of 95.83 ± 6.16 mg cy-3-glu/100 g FW while using indirect sonication, it was adecrease by 22.84%. In comparing both solvents alone, 1%acidified water also gave a higher content of TAC by 35.92%compared to 1% acidified ethanol. The indirect sonicationusing the ultrasonic bath did not give improvement in theextraction of TAC, on the contrary was observed asignificant decrease for both solvent used.
REV.CHIM.(Bucharest)♦ 67♦ No. 4 ♦ 2016 http://www.revistadechimie.ro 669
The result of direct sonication for TFC was significantlyhigher than both the indirect sonication and the controlmethod in 1% acidified water and 1% acidified ethanol(fig. 6B). For TFC in water using direct sonication, it was asignificant increase by 59.30% from control of 78.48 ± 2.91mg quercetin/100 g FW while using indirect sonication, itwas a decrease by 12.75%. Also for TFC in ethanol usingdirect sonication, it was a significant increase by 32.72%from control of 65.83 ± 3.53 mg quercetin/100 g FW whileusing indirect sonication, it was a decrease by 19.72%.Similarly to the TAC extraction, 1% acidified water alsogave a higher content of TFC by 50.22% compared to 1%acidified ethanol. The same like TAC extraction, for theindirect sonication using the ultrasonic bath was observeda significant decrease for both solvents used.
This study proves that direct sonication improves theTAC and TFC extraction compared to indirect sonicationand the conventional solvent extraction.
In addition to improved the extraction of bioactivecompound from plants, ultrasonic extraction cancontribute to reducing the extraction time.
ConclusionsAt sonication time of 5 min and 20% amplitude was
found giving the highest content of anthocyanins also for1%acidified water and 1% acidified ethanol, while 5 minand 80% amplitude gave the highest content of flavonoidfor 1% acidified water and 5 min and 20% amplitude for1% acidified ethanol. These conditions using directsonication have enhanced TAC yields by 40.78% (1%acidified water) and 41.53% (1% acidified ethanol) andalso for TFC yields by 59.30% (1% acidified water) and32.72% (1% acidified ethanol) compared with control.
Acknowledgement: We are grateful to National Institute of Researchand Development for Potato and Sugar Beet for financial support andto National Institute of Research and Development for Metals and
Radioactive Resources for technical assistance in ultrasonictreatments.
References1.FAOSTAT, Food and Agriculture Organization of the United Nations,http://faostat3.fao.org (accessed November 2014).2.TEOW, C.C., VAN-DEN TRUONG, MCFEETERS, R.F., THOMPSON,R.L., PECOTA, K.V., YENCHO, G.C., Food Chemistry, 103, no. 3, 2007,p. 829–838.3.DAMSA, F., WOINAROSCHY, A., OLTEANU, G., Rev. Chim (Bucharest),66, no. 2, 2014, p. 2274.KOSIERADZKA, I., BORUCKI, W., MATYSIAK-KATA, I., SZOPA, J.,SAWOSZ, E., Journal of Animal and Feed Sciences, 13, no. 2, 2004, p.87–92.5.NARA, K., MIYOSHI, T., HONMA, T., KOGA, H., 70, no. 6, 2006, p.1489–1491.6.REYES, L.F., MILLER, JR., CISNEROS-ZEVALLOS, L., American Journalof Potato Research, 82, 2005, p. 271–277.7.ARUS, V.A., JINESCU, C., NISTOR, I.D., ISOPENCU, G., Rev. Chim.(Bucharest), 65, no.8, 2014, p. 9428. RADU, A.D., WOINAROSCHY, A., PANTURU, E., Rev. Chim.(Bucharest), 65, no.4, 2014, p. 4709.VINATORU, M., Ultrasonics Sonochemistry, 8, no. 3, 2001, p. 303–313.10.VILKHU, K., MAWSON, R., SIMONS, L., BATES, D., Innovative FoodScience and Emerging Technologies, 9, no. 2, 2008, p. 161–169.11.CHEOK, C.Y., CHIN, N.L., YUSOF, Y.A., TALIB, R.A., LAW, C.L.,Industrial crops and Products, 50, 2013, p. 1-7.12.MORAR, G., CATANA, C., OLTEANU, GH., PAMFIL, D., VATCA, S.,OLTEAN, M.I., OROIAN, G., Bull. USAMV Cluj, Seria Agricultura/Horticultura, 2004, ISSN: 1454-2382.13.GIUSTI, M.M., Food Colorants Chemical and Functional Properties,2007, p. 429-547.14.KIM, K.S., LEE, S., LEE, Y.S., Journal of Ethno-pharmacology, 85,no. 1, 2003, p. 69-72.15.ZHISHEN J., MENGCHENG T., JIANMING W., Food Chemstry, 64,1999, p. 555-559
Manuscript received: 30.06.2015