Embed Size (px)
Citation preview
249
Optimization of total flavonoid compound extraction from Camellia sinensis using the artificial neural network and response surface methodology
Ivan M. Savić1, Vesna D. Nikolić1, Ivana M. Savić1, Ljubiša B. Nikolić1, Mihajlo Z. Stanković1, Karl Moder2 1University of Niš, Faculty of Technology, Leskovac, Serbia 2University of Natural Resources and Life Sciences, Institute of Applied Statistics and Computing, Center of Experimental Design, Vienna, Austria
Abstract The aim of this paper was to model and optimize the process of total flavonoid extractionfrom green tea using the artificial neural network and response surface methodology, aswell as the comparison of these optimization techniques. The extraction time, ethanolconcentration and solid-to-liquid ratio were identified as the independent variables, whilethe yield of total flavonoid was selected as the dependent variable. Central compositedesign (CCD), using a second-order polynomial model and multilayer perceptron (MLP)were used for fitting the obtained experimental data. The values of root mean squareerror, cross-validated correlation coefficient and normal correlation coefficient for bothmodels indicate that the artificial neural network is better in prediction of total flavonoidyield than CCD. The optimal conditions using the desirability function at CCD model wasachieved for the extraction time of 32.5 min, ethanol concentration of 100% (v/v) andsolid-to-liquid ratio of 1:32.5 (m/v). The predicted yield at these conditions was 2.11 g/100g of the dried extract (d.e.), while the experimentally obtained yield was 2.39 g/100 g d.e.The extraction process was optimized by the use of the simplex method for the MLPmodel. The optimal value of total flavonoid yield (2.80 g/100 g d.e.) was achieved after the extraction time of 27.2 min using ethanol concentration of 100% (v/v) at solid-to-liquid ratio of 1:20.7 (m/v). The predicted response value under optimal conditions for MLPmodel was also experimentally confirmed (2.71 g/100 g d.e.).
Keywords: artificial neural network, response surface methodology, extraction, total flavor-noid, Camelia sinensis.
SCIENTIFIC PAPER
UDC 66.061.3:663.951:004.94
Hem. Ind. 67 (2) 249–259 (2013)
doi: 10.2298/HEMIND120313066S
Available online at the Journal website: http://www.ache.org.rs/HI/
Green tea (Camellia sinensis) [1] can be found in the form of dried buds and leaves [2] on the market. Processing, packaging, storage and types of plants used are crucial for its quality. Also, the color, taste and quality of green tea depend on how the plant leaves are treated after harvest. Green tea has attracted the attention of people in the prevention of various di-seases, ranging from weight loss to cancer [3]. The study of green tea carcinogenesis in animals confirmed its preventive effects on breast, prostate, lung and skin cancer [4]. The beneficial effects of green tea are at-tributed to its polyphenolic compounds. Tea catechins constitute about 80–90% of total flavonoids, while the content of flavonols is less than 10% [5]. Tea polyphe-nols, such as ketehin and flavonols remove the reactive oxygen species [6,7] and metal ions [6,8]. These fla-vonoids are antioxidants with phenolic hydroxyl groups [7]. The tea flavonoids remove NO and peroksinitrite, Correspondence: I.M. Savić, Faculty of Technology, University of Niš, Bulevar oslobođenja 124, 16000 Leskovac, Serbia. E-mail: [email protected] Paper received: 13 March, 2012 Paper accepted: 15 May, 2012
produced from superoxide radicals and NO [9,10]. Cer-tain polyphenols inhibit cell growth and proliferation, particularly in transformed cells, and also accelerate cell death. Tea polyphenols enhance the activity of antioxidant enzymes and hence antioxidant defense. Also, the polyphenolic components of green tea reduce LDL fat peroxidation of endothelial cells and therefore inhibit heme oxygenase gene expression [11]. These observations may be important, because the heme oxygenase is related to the transformation of mono-cyte-macrophages [12].
The determination of total flavonoids proposed in the literature was analyzed by the use of indirect VIS spectrophotometric methods based on the formation of complexes between the flavonoids and aluminum chloride [13–16]. Aluminum chloride builds the acid stable complexes with C-4 keto groups and/or C-3 or C-5 hydroxyl groups of flavones and flavonols. In addition, the aluminum chloride builds the acid unstable com–plexes with o-dihydroxyl groups A or B-ring flavonoids [17]. The flavones complexes with C-3 and C-5 hydroxyl groups, as well as o-dihydroxyl groups have an absorp–tion maximum in the range of 415–440 nm.
I.M. SAVIĆ et al.: FLAVONOID COMPOUND EXTRACTION FROM C. sinensis Hem. ind. 67 (2) 249–259 (2013)
250
Response surface methodology (RSM) is a conven-tional method and effective statistic technique for opti-mization of complex processes. It has been successfully demonstrated that RSM can be used to optimize the isolation of total flavonoids from many medicine plants [18–22].
An artificial neural network (ANN) is a flexible ma-thematical structure which is capable of identifying the complex nonlinear relationships between input and output data sets. ANN models have been found useful and efficient, particularly in problems for which the characteristics of processes are difficult to describe using mathematical equations [23].
The optimization simplex method [24–27] is a very effective technique for finding the best process para-meter values leading to optimal conditions. The sim-plex method for linear programming [28], developed by Dantzig [29], is perhaps the most well-studied algo-rithm in the optimization literature.
Moreover, personal computers, statistical software and computer graphics for desired function methodo-logy implementation are now available and have been successfully applied in various processes and researches to optimize conditions for sample preparation and analysis of analytes. Carro and Lorenzo [30] used the desirability function to simultaneously optimize the solid-phase extraction of organochlorine and organo-phosphorus pesticide. Jimidar et al. [31] applied the desirability function the selection of optimum separa-tion conditions in capillary zone electrophoresis. Bour-guignon and Massart [32] simultaneously optimized several chromatographic performance goals using the desirability function.
Due to the health benefits of tea flavonoids, there is increasing interest their extraction. Since the optimiza-tion of total flavonoid extraction from green tea has not yet been described in the literature, the aim of this paper was to optimize this process using the ANN and RSM, as well as to compare these models. These ap-proaches in optimization of extraction process have the advantage over other conventional techniques, owing to the small number of performed experiments. Extrac-tion time, ethanol concentration and solid-to-liquid ratio (solvomodule) were selected as the independent variables, while the amount of total flavonoids was selected as the dependent variable.
EXPERIMENTAL
Samples and reagents. Standard of rutin was pur-chased from Merck Chemicals Ltd. (United Kingdom). Absolute ethanol and ethanol of 96% (v/v) were pur-chased from Zorka Pharma (Serbia) and Alkaloid AD (Macedonia), respectively.
Plant material. Green tea (Camellia sinensis) was purchased from AD Aleva (Serbia) and dried to the
moisture content of 6% at room temperature in a dark place. The fine powder of tea was obtained by ground-ing the plant material in the electrical mill to the ave-rage particle size of 0.4 mm.
Apparatus. A double-beam Varian Cary-100 Conc. UV-Vis spectrophotometer, connected to a computer with Cary WinUV software, was used for measuring absorbance. The instrument has an automatic wave-length accuracy of 0.1 nm and matched quartz cells of the 10 mm cell path length.
Extraction procedure. Green tea powder (2 g) was transferred to a 100 cm3 round bottom flask and covered with the selected volume of solvent. The ethanol con-centration was varied according to CCD in order to investigate the effects on the yield of total flavonoid. All extractions were performed under reflux at the boil-ing temperature of the solvent. The flask was put in a thermostatic water bath. After the extraction, the solid matrix was separated from the liquid phase by filtering. The extract was evaporated under reduced preassure on a rotary evaporator at a temperature of 50 °C. After that, it was dried to constant mass in a desiccator and analyzed by the indirect UV-Vis method.
Determination of total flavonoid. The aluminum chloride colorimetric method was modified from the procedure reported by Woisky and Salatino [33]. Rutin was used to make the calibration curve. Rutin (10 mg) was dissolved in 80% (v/v) ethanol and then diluted in the range of 5–100 μg cm–3. The diluted standard solu-tions (0.5 cm3) were separately mixed with 1.5 cm3 of 96% (v/v) ethanol, 0.1 cm3 of 10% (m/v) aluminum chloride, 0.1 cm3 of 1 mol dm–3 potassium acetate and 2.8 cm3 of distilled water. After incubation at room temperature for 30 min, the absorbance of reaction mixture was measured at the wavelength of 415 nm. Quartz cuvettes (1 cm×1 cm) were used for recording at room temperature. The amount of 10% (m/v) alu-minum chloride was substituted by the same amount of distilled water in the blank. Similarly, 0.5 cm3 of ethanol extracts were reacted with the aluminum chlo-ride for determination of flavonoid content, as des-cribed above.
Experimental design. RSM consists of an adjustment of empirical models to the data obtained experiment-ally. Linear and quadratic mathematical models are employed to describe the system to be optimized [34]. If there are several factors that influence the particular system, it is necessary to use a screening design to in-vestigate the significance of variables. The screening design, such as the factorial design 2f, can be used to meet this objective [14].
The first-order effects can be determined on the basis of factorial design, but if the second-order effects are observed, it is necessary to perform additional ex-perimental runs. Thus, the second-order model is used
I.M. SAVIĆ et al.: FLAVONOID COMPOUND EXTRACTION FROM C. sinensis Hem. ind. 67 (2) 249–259 (2013)
251
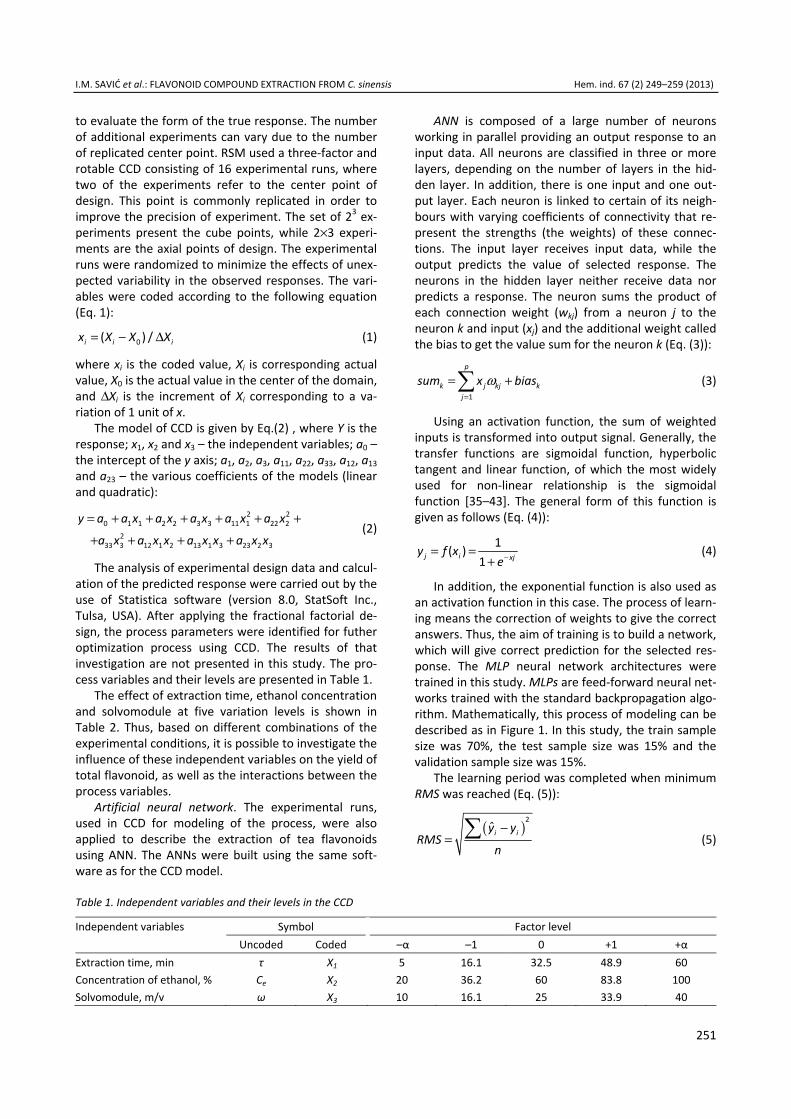
to evaluate the form of the true response. The number of additional experiments can vary due to the number of replicated center point. RSM used a three-factor and rotable CCD consisting of 16 experimental runs, where two of the experiments refer to the center point of design. This point is commonly replicated in order to improve the precision of experiment. The set of 23 ex-periments present the cube points, while 2×3 experi-ments are the axial points of design. The experimental runs were randomized to minimize the effects of unex-pected variability in the observed responses. The vari-ables were coded according to the following equation (Eq. 1):
0( ) /i i ix X X X= − Δ (1)
where xi is the coded value, Xi is corresponding actual value, X0 is the actual value in the center of the domain, and ΔXi is the increment of Xi corresponding to a va-riation of 1 unit of x.
The model of CCD is given by Eq.(2) , where Y is the response; x1, x2 and x3 – the independent variables; a0 – the intercept of the y axis; a1, a2, a3, a11, a22, a33, a12, a13 and a23 – the various coefficients of the models (linear and quadratic):
2 20 1 1 2 2 3 3 11 1 22 2
233 3 12 1 2 13 1 3 23 2 3
y a a x a x a x a x a x
a x a x x a x x a x x
= + + + + + +
+ + + + (2)
The analysis of experimental design data and calcul-ation of the predicted response were carried out by the use of Statistica software (version 8.0, StatSoft Inc., Tulsa, USA). After applying the fractional factorial de-sign, the process parameters were identified for futher optimization process using CCD. The results of that investigation are not presented in this study. The pro-cess variables and their levels are presented in Table 1.
The effect of extraction time, ethanol concentration and solvomodule at five variation levels is shown in Table 2. Thus, based on different combinations of the experimental conditions, it is possible to investigate the influence of these independent variables on the yield of total flavonoid, as well as the interactions between the process variables.
Artificial neural network. The experimental runs, used in CCD for modeling of the process, were also applied to describe the extraction of tea flavonoids using ANN. The ANNs were built using the same soft-ware as for the CCD model.
ANN is composed of a large number of neurons working in parallel providing an output response to an input data. All neurons are classified in three or more layers, depending on the number of layers in the hid-den layer. In addition, there is one input and one out-put layer. Each neuron is linked to certain of its neigh-bours with varying coefficients of connectivity that re-present the strengths (the weights) of these connec-tions. The input layer receives input data, while the output predicts the value of selected response. The neurons in the hidden layer neither receive data nor predicts a response. The neuron sums the product of each connection weight (wkj) from a neuron j to the neuron k and input (xj) and the additional weight called the bias to get the value sum for the neuron k (Eq. (3)):
1
p
k j kj kj
sum x biasω=
= + (3)
Using an activation function, the sum of weighted inputs is transformed into output signal. Generally, the transfer functions are sigmoidal function, hyperbolic tangent and linear function, of which the most widely used for non-linear relationship is the sigmoidal function [35–43]. The general form of this function is given as follows (Eq. (4)):
1( )
1j i xjy f xe−= =
+ (4)
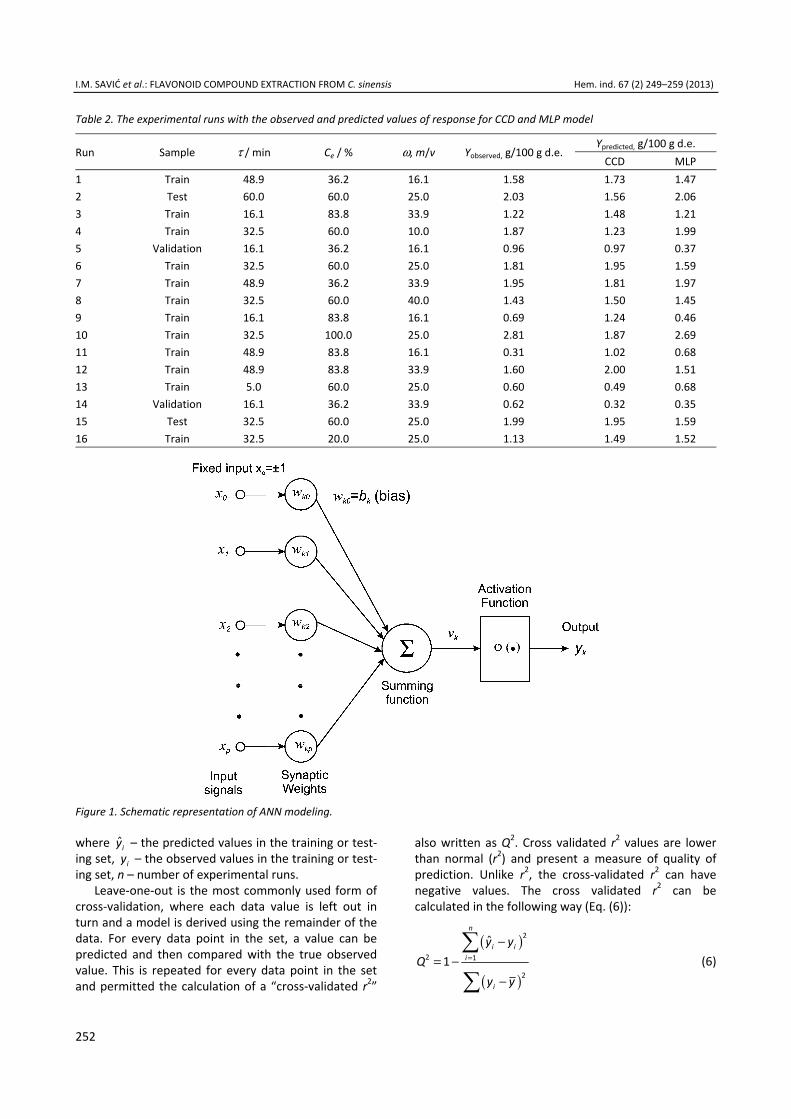
In addition, the exponential function is also used as an activation function in this case. The process of learn-ing means the correction of weights to give the correct answers. Thus, the aim of training is to build a network, which will give correct prediction for the selected res-ponse. The MLP neural network architectures were trained in this study. MLPs are feed-forward neural net-works trained with the standard backpropagation algo-rithm. Mathematically, this process of modeling can be described as in Figure 1. In this study, the train sample size was 70%, the test sample size was 15% and the validation sample size was 15%.
The learning period was completed when minimum RMS was reached (Eq. (5)):
( )2ˆi iy y
RMSn
−= (5)
Table 1. Independent variables and their levels in the CCD
Independent variables Symbol Factor level Uncoded Coded –α –1 0 +1 +α
Extraction time, min τ X1 5 16.1 32.5 48.9 60 Concentration of ethanol, % Ce X2 20 36.2 60 83.8 100 Solvomodule, m/v ω X3 10 16.1 25 33.9 40
I.M. SAVIĆ et al.: FLAVONOID COMPOUND EXTRACTION FROM C. sinensis Hem. ind. 67 (2) 249–259 (2013)
252
where ˆiy – the predicted values in the training or test-ing set, iy – the observed values in the training or test-ing set, n – number of experimental runs.
Leave-one-out is the most commonly used form of cross-validation, where each data value is left out in turn and a model is derived using the remainder of the data. For every data point in the set, a value can be predicted and then compared with the true observed value. This is repeated for every data point in the set and permitted the calculation of a “cross-validated r2”
also written as Q2. Cross validated r2 values are lower than normal (r2) and present a measure of quality of prediction. Unlike r2, the cross-validated r2 can have negative values. The cross validated r2 can be calculated in the following way (Eq. (6)):
( )
( )
2
2 1
2
ˆ1
n
i ii
i
y yQ
y y
=
−= −
−
(6)
Table 2. The experimental runs with the observed and predicted values of response for CCD and MLP model
Run Sample τ / min Ce / % ω, m/v Yobserved, g/100 g d.e. Ypredicted, g/100 g d.e.
CCD MLP 1 Train 48.9 36.2 16.1 1.58 1.73 1.47 2 Test 60.0 60.0 25.0 2.03 1.56 2.06 3 Train 16.1 83.8 33.9 1.22 1.48 1.21 4 Train 32.5 60.0 10.0 1.87 1.23 1.99 5 Validation 16.1 36.2 16.1 0.96 0.97 0.37 6 Train 32.5 60.0 25.0 1.81 1.95 1.59 7 Train 48.9 36.2 33.9 1.95 1.81 1.97 8 Train 32.5 60.0 40.0 1.43 1.50 1.45 9 Train 16.1 83.8 16.1 0.69 1.24 0.46 10 Train 32.5 100.0 25.0 2.81 1.87 2.69 11 Train 48.9 83.8 16.1 0.31 1.02 0.68 12 Train 48.9 83.8 33.9 1.60 2.00 1.51 13 Train 5.0 60.0 25.0 0.60 0.49 0.68 14 Validation 16.1 36.2 33.9 0.62 0.32 0.35 15 Test 32.5 60.0 25.0 1.99 1.95 1.59 16 Train 32.5 20.0 25.0 1.13 1.49 1.52
Figure 1. Schematic representation of ANN modeling.
I.M. SAVIĆ et al.: FLAVONOID COMPOUND EXTRACTION FROM C. sinensis Hem. ind. 67 (2) 249–259 (2013)
253
where ˆiy – the predicted values, iy – the observed values, y – the average observed values, n – number of experimental runs. A model is considered acceptable when the value of Q2 is higher than 0.5.
RESULTS AND DISCUSSION
Extraction of the bioactive compounds from the medical plant materials has wide application for the phytopreparations production. Each procedure of phy-topreparations production includes the extractions of bioactive compounds from the plant materials [44].
Extraction of the bioactive compounds from the plant material is the process of mass transfer in the solid–liquid system [45]. Factors such as the type of sol-vent, particle size, hydrodinamic conditions, tempera-ture and density of plant material, affect the mass transfer and extraction degree. The selection of solvent type is critical for the yield and extraction degree, as well as the economy of the extraction process. The mass transfer rate is higher when the particle size de-creases, due to the lower distance which the solvent has to pass through the solid phase. The hydrodinamic conditions, as well as the solid-to-liquid ratio have great effects on the extraction yield. Extraction can be per-formed at the solid-to-liquid ratio which provides a high extraction efficiency with less energy consumption and the use of simple devices. Increasing the tempera-ture commonly improves the solubility of extracted compounds. Although, there are situations when the temperature has a negative impact due to poor solu-bility of bioactive compounds at higher temperatures.
Maceration is one-step extraction of the biactive compounds from the herbal drugs at the defined tem-perature and solid-to-liquid ratio by the solvent with or without mixing. The commonly used solvents are vola-tile organic compounds and, for this reason, it is neces-sary to perform the maceration under reflux. An extract is separated from the plant material by filtering and by further pressing.
Experimental design
An experimental design was applied to model and optimize the process extraction of total flavonoid from green tea. CCD was used as the best model for opti-mization. Statistica 8.0 provides a possibility to build different polynomial models by the use of different options in the software. There are four possibilities, where two of them refer to the linear modeling, and the remaining two on the second-order modeling. The second-order polynomial models have an advantages over the linear models, because they are better for pre-dictions of the selected response. Thus, the differences between the observed and predicted values are smaller.
The final predicted process model in terms of coded factors for total flavonoid content is given below by Eq. (7):
2 21 1 2 2 3
23 1 2 1 3 2 3
1.95 0.32 0.33 0.11 0.1 0.08
0.21 0.24 0.18 0.22
Y X X X X X
X X X X X X X
= + − + − +
− − + + (7)
When the coded values of variables were replaced with the actual values, the empirical equation was obtained. This model is presented by Eq. (8):
2 2
2
1.95 0.64 0.66 0.22 0.19 0.16
0.41 0.49 0.37 0.45e e
e e
Y C C
C C
τ τ ωω τ τ ω ω
= + − + − +
− − + + (8)
The significant factors of the equation are the linear and quadratic terms of extraction time, as well as the interaction between the extraction time and ethanol concentration. Unlike the quadratic term of extraction time and interaction extraction time/ethanol concen-tration, the linear term of extraction time has a positive effects on the yield of total flavonoid.
The characteristics of the CCD model are presented over the calculated RMS value of 0.4219, r2 value of 0.5779 and Q2 value of 0.5771.
Artificial neural network
A feed-forward neural network (MLP) trained by a back-propagation algorithm was selected to develop the prediction model. The performances of ANNs were compared based on values of RMS training, RMS testing, Q2 and r2.
The selected MLP model had three layers: the first layer had three units, the second layer had seven units, and the third layer had one output unit. In addition to these units, the architecture of this model contained two more bias in the input layer and in the hidden layer. The number of neurons in the hidden layer was selected after achieving a minimum error of the pro-posed model. The hyperbolic tangent function was used as an activation function in the hidden layer, while the logistic sigmoidal function was used in the output layer. When the learning period was over, the MLP model was tested with test data. For built MLP model, the calculated RMS training was 0.1929, and RMS testing was 0.2836. The value of Q2 was 0.9139, while the value of r2 was 0.9572.
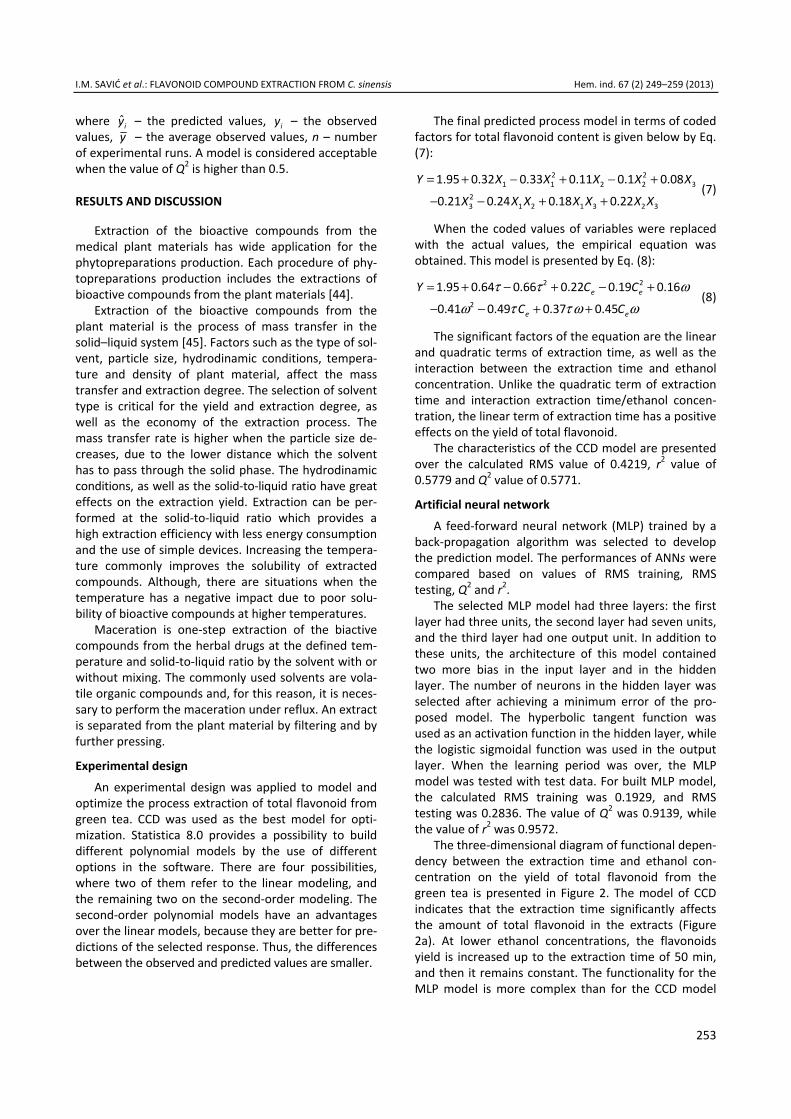
The three-dimensional diagram of functional depen-dency between the extraction time and ethanol con-centration on the yield of total flavonoid from the green tea is presented in Figure 2. The model of CCD indicates that the extraction time significantly affects the amount of total flavonoid in the extracts (Figure 2a). At lower ethanol concentrations, the flavonoids yield is increased up to the extraction time of 50 min, and then it remains constant. The functionality for the MLP model is more complex than for the CCD model
I.M. SAVIĆ et al.: FLAVONOID COMPOUND EXTRACTION FROM C. sinensis Hem. ind. 67 (2) 249–259 (2013)
254
(Figure 2b). Increasing the extraction time at lower ethanol concentrations leads to the increase of a res-ponse. At higher ethanol concentrations, the impact of extraction time has a positive effect on the flavonoid yield up to the extraction time of 35 min, and then it has a negative impact. By changing the ethanol concen-tration for short extraction times the influence on the yield is too small, while the yield increases for the ex-traction times from 30–40 min. It is very interesting that the yield decreases with increasing the ethanol concentration for longer extraction times.
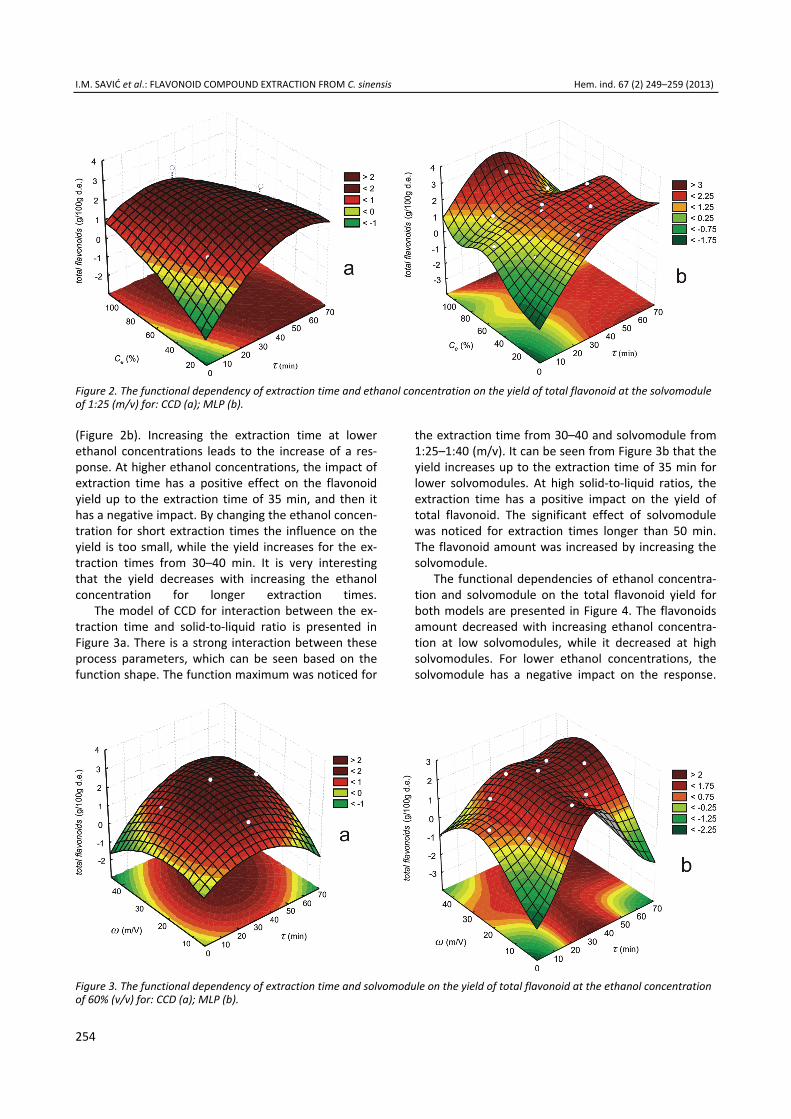
The model of CCD for interaction between the ex-traction time and solid-to-liquid ratio is presented in Figure 3a. There is a strong interaction between these process parameters, which can be seen based on the function shape. The function maximum was noticed for
the extraction time from 30–40 and solvomodule from 1:25–1:40 (m/v). It can be seen from Figure 3b that the yield increases up to the extraction time of 35 min for lower solvomodules. At high solid-to-liquid ratios, the extraction time has a positive impact on the yield of total flavonoid. The significant effect of solvomodule was noticed for extraction times longer than 50 min. The flavonoid amount was increased by increasing the solvomodule.
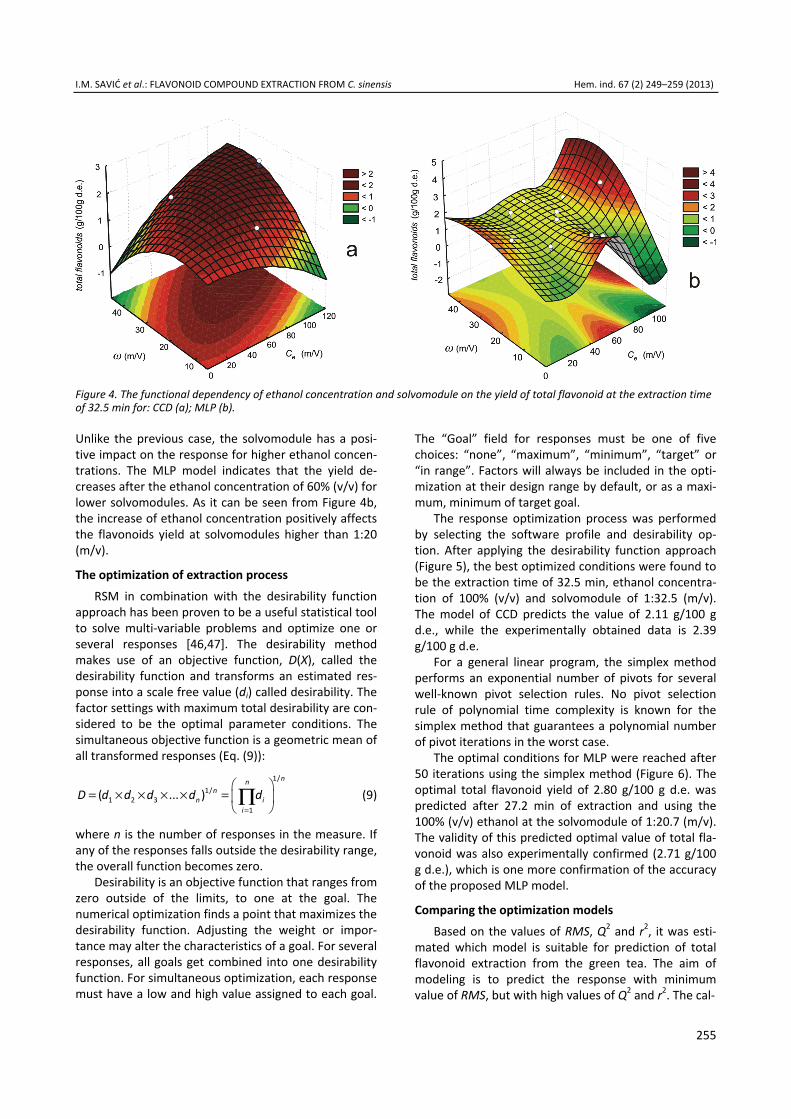
The functional dependencies of ethanol concentra-tion and solvomodule on the total flavonoid yield for both models are presented in Figure 4. The flavonoids amount decreased with increasing ethanol concentra-tion at low solvomodules, while it decreased at high solvomodules. For lower ethanol concentrations, the solvomodule has a negative impact on the response.
Figure 3. The functional dependency of extraction time and solvomodule on the yield of total flavonoid at the ethanol concentration of 60% (v/v) for: CCD (a); MLP (b).
Figure 2. The functional dependency of extraction time and ethanol concentration on the yield of total flavonoid at the solvomodule of 1:25 (m/v) for: CCD (a); MLP (b).
I.M. SAVIĆ et al.: FLAVONOID COMPOUND EXTRACTION FROM C. sinensis Hem. ind. 67 (2) 249–259 (2013)
255
Unlike the previous case, the solvomodule has a posi-tive impact on the response for higher ethanol concen-trations. The MLP model indicates that the yield de-creases after the ethanol concentration of 60% (v/v) for lower solvomodules. As it can be seen from Figure 4b, the increase of ethanol concentration positively affects the flavonoids yield at solvomodules higher than 1:20 (m/v).
The optimization of extraction process
RSM in combination with the desirability function approach has been proven to be a useful statistical tool to solve multi-variable problems and optimize one or several responses [46,47]. The desirability method makes use of an objective function, D(X), called the desirability function and transforms an estimated res-ponse into a scale free value (di) called desirability. The factor settings with maximum total desirability are con-sidered to be the optimal parameter conditions. The simultaneous objective function is a geometric mean of all transformed responses (Eq. (9)):
1/1/
1 2 31
( ... )nn
nn i
i
D d d d d d=
= × × × × =
Π (9)
where n is the number of responses in the measure. If any of the responses falls outside the desirability range, the overall function becomes zero.
Desirability is an objective function that ranges from zero outside of the limits, to one at the goal. The numerical optimization finds a point that maximizes the desirability function. Adjusting the weight or impor-tance may alter the characteristics of a goal. For several responses, all goals get combined into one desirability function. For simultaneous optimization, each response must have a low and high value assigned to each goal.
The “Goal” field for responses must be one of five choices: “none”, “maximum”, “minimum”, “target” or “in range”. Factors will always be included in the opti-mization at their design range by default, or as a maxi-mum, minimum of target goal.
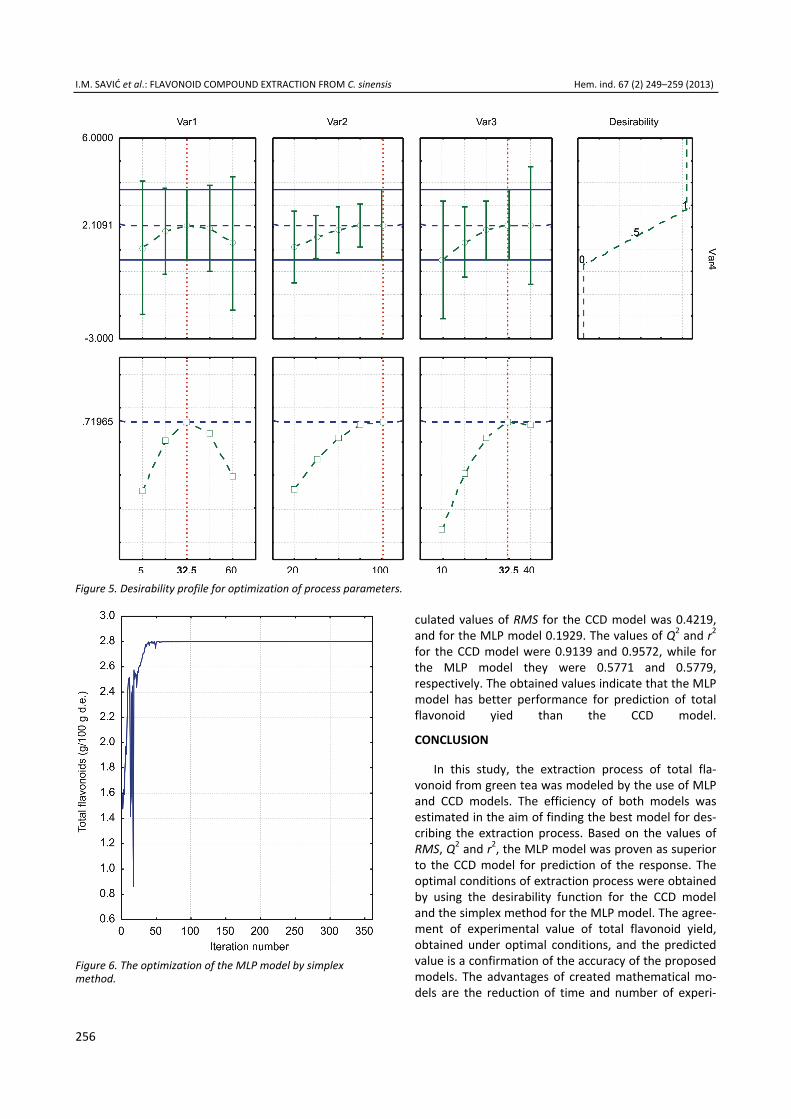
The response optimization process was performed by selecting the software profile and desirability op-tion. After applying the desirability function approach (Figure 5), the best optimized conditions were found to be the extraction time of 32.5 min, ethanol concentra-tion of 100% (v/v) and solvomodule of 1:32.5 (m/v). The model of CCD predicts the value of 2.11 g/100 g d.e., while the experimentally obtained data is 2.39 g/100 g d.e.
For a general linear program, the simplex method performs an exponential number of pivots for several well-known pivot selection rules. No pivot selection rule of polynomial time complexity is known for the simplex method that guarantees a polynomial number of pivot iterations in the worst case.
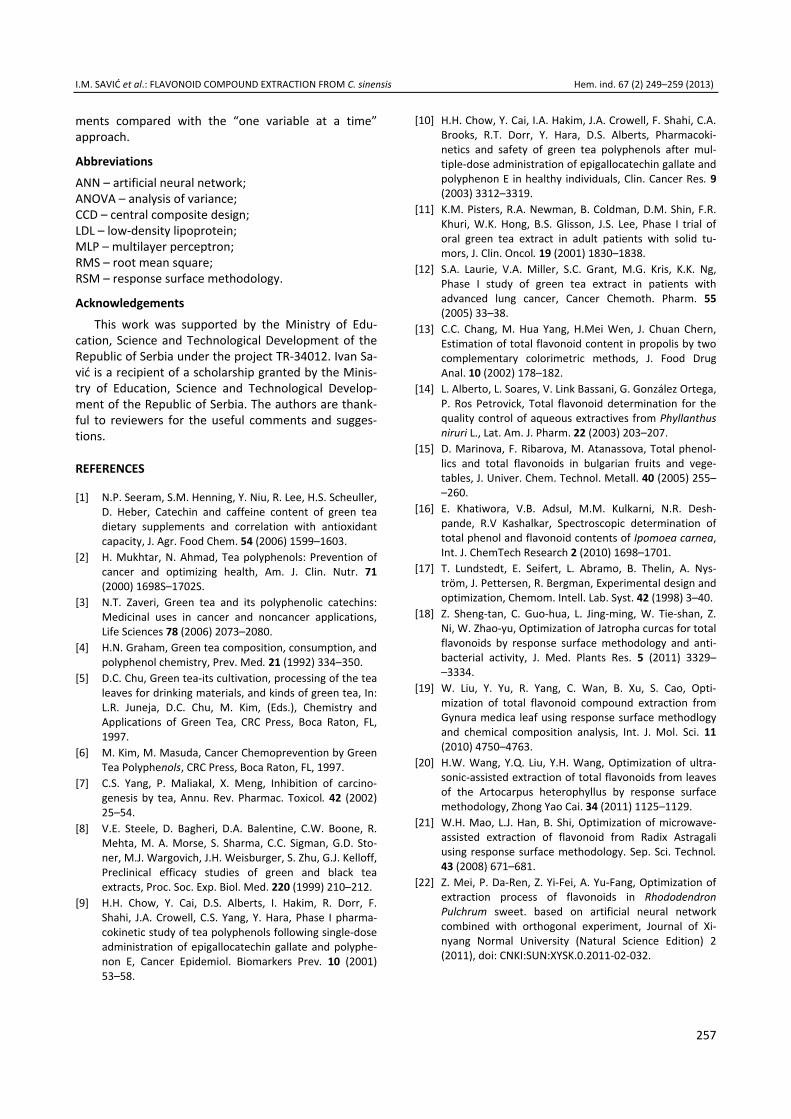
The optimal conditions for MLP were reached after 50 iterations using the simplex method (Figure 6). The optimal total flavonoid yield of 2.80 g/100 g d.e. was predicted after 27.2 min of extraction and using the 100% (v/v) ethanol at the solvomodule of 1:20.7 (m/v). The validity of this predicted optimal value of total fla-vonoid was also experimentally confirmed (2.71 g/100 g d.e.), which is one more confirmation of the accuracy of the proposed MLP model.
Comparing the optimization models
Based on the values of RMS, Q2 and r2, it was esti-mated which model is suitable for prediction of total flavonoid extraction from the green tea. The aim of modeling is to predict the response with minimum value of RMS, but with high values of Q2 and r2. The cal-
Figure 4. The functional dependency of ethanol concentration and solvomodule on the yield of total flavonoid at the extraction time of 32.5 min for: CCD (a); MLP (b).
I.M. SAVIĆ et al.: FLAVONOID COMPOUND EXTRACTION FROM C. sinensis Hem. ind. 67 (2) 249–259 (2013)
256
Figure 6. The optimization of the MLP model by simplex method.
culated values of RMS for the CCD model was 0.4219, and for the MLP model 0.1929. The values of Q2 and r2 for the CCD model were 0.9139 and 0.9572, while for the MLP model they were 0.5771 and 0.5779, respectively. The obtained values indicate that the MLP model has better performance for prediction of total flavonoid yied than the CCD model.
CONCLUSION
In this study, the extraction process of total fla-vonoid from green tea was modeled by the use of MLP and CCD models. The efficiency of both models was estimated in the aim of finding the best model for des-cribing the extraction process. Based on the values of RMS, Q2 and r2, the MLP model was proven as superior to the CCD model for prediction of the response. The optimal conditions of extraction process were obtained by using the desirability function for the CCD model and the simplex method for the MLP model. The agree-ment of experimental value of total flavonoid yield, obtained under optimal conditions, and the predicted value is a confirmation of the accuracy of the proposed models. The advantages of created mathematical mo-dels are the reduction of time and number of experi-
Figure 5. Desirability profile for optimization of process parameters.
I.M. SAVIĆ et al.: FLAVONOID COMPOUND EXTRACTION FROM C. sinensis Hem. ind. 67 (2) 249–259 (2013)
257
ments compared with the “one variable at a time” approach.
Abbreviations
ANN – artificial neural network; ANOVA – analysis of variance; CCD – central composite design; LDL – low-density lipoprotein; MLP – multilayer perceptron; RMS – root mean square; RSM – response surface methodology.
Acknowledgements
This work was supported by the Ministry of Edu-cation, Science and Technological Development of the Republic of Serbia under the project TR-34012. Ivan Sa-vić is a recipient of a scholarship granted by the Minis-try of Education, Science and Technological Develop-ment of the Republic of Serbia. The authors are thank-ful to reviewers for the useful comments and sugges-tions.
REFERENCES
[1] N.P. Seeram, S.M. Henning, Y. Niu, R. Lee, H.S. Scheuller, D. Heber, Catechin and caffeine content of green tea dietary supplements and correlation with antioxidant capacity, J. Agr. Food Chem. 54 (2006) 1599–1603.
[2] H. Mukhtar, N. Ahmad, Tea polyphenols: Prevention of cancer and optimizing health, Am. J. Clin. Nutr. 71 (2000) 1698S–1702S.
[3] N.T. Zaveri, Green tea and its polyphenolic catechins: Medicinal uses in cancer and noncancer applications, Life Sciences 78 (2006) 2073–2080.
[4] H.N. Graham, Green tea composition, consumption, and polyphenol chemistry, Prev. Med. 21 (1992) 334–350.
[5] D.C. Chu, Green tea-its cultivation, processing of the tea leaves for drinking materials, and kinds of green tea, In: L.R. Juneja, D.C. Chu, M. Kim, (Eds.), Chemistry and Applications of Green Tea, CRC Press, Boca Raton, FL, 1997.
[6] M. Kim, M. Masuda, Cancer Chemoprevention by Green Tea Polyphenols, CRC Press, Boca Raton, FL, 1997.
[7] C.S. Yang, P. Maliakal, X. Meng, Inhibition of carcino-genesis by tea, Annu. Rev. Pharmac. Toxicol. 42 (2002) 25–54.
[8] V.E. Steele, D. Bagheri, D.A. Balentine, C.W. Boone, R. Mehta, M. A. Morse, S. Sharma, C.C. Sigman, G.D. Sto-ner, M.J. Wargovich, J.H. Weisburger, S. Zhu, G.J. Kelloff, Preclinical efficacy studies of green and black tea extracts, Proc. Soc. Exp. Biol. Med. 220 (1999) 210–212.
[9] H.H. Chow, Y. Cai, D.S. Alberts, I. Hakim, R. Dorr, F. Shahi, J.A. Crowell, C.S. Yang, Y. Hara, Phase I pharma-cokinetic study of tea polyphenols following single-dose administration of epigallocatechin gallate and polyphe-non E, Cancer Epidemiol. Biomarkers Prev. 10 (2001) 53–58.
[10] H.H. Chow, Y. Cai, I.A. Hakim, J.A. Crowell, F. Shahi, C.A. Brooks, R.T. Dorr, Y. Hara, D.S. Alberts, Pharmacoki-netics and safety of green tea polyphenols after mul-tiple-dose administration of epigallocatechin gallate and polyphenon E in healthy individuals, Clin. Cancer Res. 9 (2003) 3312–3319.
[11] K.M. Pisters, R.A. Newman, B. Coldman, D.M. Shin, F.R. Khuri, W.K. Hong, B.S. Glisson, J.S. Lee, Phase I trial of oral green tea extract in adult patients with solid tu-mors, J. Clin. Oncol. 19 (2001) 1830–1838.
[12] S.A. Laurie, V.A. Miller, S.C. Grant, M.G. Kris, K.K. Ng, Phase I study of green tea extract in patients with advanced lung cancer, Cancer Chemoth. Pharm. 55 (2005) 33–38.
[13] C.C. Chang, M. Hua Yang, H.Mei Wen, J. Chuan Chern, Estimation of total flavonoid content in propolis by two complementary colorimetric methods, J. Food Drug Anal. 10 (2002) 178–182.
[14] L. Alberto, L. Soares, V. Link Bassani, G. González Ortega, P. Ros Petrovick, Total flavonoid determination for the quality control of aqueous extractives from Phyllanthus niruri L., Lat. Am. J. Pharm. 22 (2003) 203–207.
[15] D. Marinova, F. Ribarova, M. Atanassova, Total phenol-lics and total flavonoids in bulgarian fruits and vege-tables, J. Univer. Chem. Technol. Metall. 40 (2005) 255– –260.
[16] E. Khatiwora, V.B. Adsul, M.M. Kulkarni, N.R. Desh-pande, R.V Kashalkar, Spectroscopic determination of total phenol and flavonoid contents of Ipomoea carnea, Int. J. ChemTech Research 2 (2010) 1698–1701.
[17] T. Lundstedt, E. Seifert, L. Abramo, B. Thelin, A. Nys-tröm, J. Pettersen, R. Bergman, Experimental design and optimization, Chemom. Intell. Lab. Syst. 42 (1998) 3–40.
[18] Z. Sheng-tan, C. Guo-hua, L. Jing-ming, W. Tie-shan, Z. Ni, W. Zhao-yu, Optimization of Jatropha curcas for total flavonoids by response surface methodology and anti-bacterial activity, J. Med. Plants Res. 5 (2011) 3329– –3334.
[19] W. Liu, Y. Yu, R. Yang, C. Wan, B. Xu, S. Cao, Opti-mization of total flavonoid compound extraction from Gynura medica leaf using response surface methodlogy and chemical composition analysis, Int. J. Mol. Sci. 11 (2010) 4750–4763.
[20] H.W. Wang, Y.Q. Liu, Y.H. Wang, Optimization of ultra-sonic-assisted extraction of total flavonoids from leaves of the Artocarpus heterophyllus by response surface methodology, Zhong Yao Cai. 34 (2011) 1125–1129.
[21] W.H. Mao, L.J. Han, B. Shi, Optimization of microwave-assisted extraction of flavonoid from Radix Astragali using response surface methodology. Sep. Sci. Technol. 43 (2008) 671–681.
[22] Z. Mei, P. Da-Ren, Z. Yi-Fei, A. Yu-Fang, Optimization of extraction process of flavonoids in Rhododendron Pulchrum sweet. based on artificial neural network combined with orthogonal experiment, Journal of Xi-nyang Normal University (Natural Science Edition) 2 (2011), doi: CNKI:SUN:XYSK.0.2011-02-032.
I.M. SAVIĆ et al.: FLAVONOID COMPOUND EXTRACTION FROM C. sinensis Hem. ind. 67 (2) 249–259 (2013)
258
[23] A.E. Giles, C. Aldrich, J.S.J. Van Deventer, Modeling of rare earth solvent extraction with artificial neural nets, Hydrometallurgy 43 (1996) 241–255.
[24] C. Porte, Méthodes directes d'optimisation: méthodes d'optimisation à une variable et méthode Simplex, Tech. Ing. P. 228 (2002) 7–14.
[25] F.H. Walters, S.L. Morgan, L.R. Paker, S.N. Deming, Se-quential Simplex Optimization, CRC Press, Boca Raton, FL, USA, 1991.
[26] S.N. Deming, S.L. Morgan, Simplex optimization of va-riables in analytical chemistry, Anal. Chem. 3 (1973) 278a–282a.
[27] C. Porte, Méthodes directes d'optimisation: Méthodes dérivées de la method Simplex, Tech. Ing. P. 229 (2002) 1–8.
[28] K.G. Murty, Linear and Combinatorial Programming, John Wiley & Sons Inc., New York, USA, 1976.
[29] G.B. Dantzig, Linear Programming and Extensions, Prin-ceton University Press, Princeton, NJ, 1963.
[30] A.M. Carro, R.A. Lorenzo, Simultaneous optimization of the solid-phase extraction of organochlorine and orga-nophosphorus pesticides using the desirability function, Analyst 126 (2001) 1005–1010.
[31] M. Jimidar, B. Bourguignon, D.L. Massart, Application of Derringer’s desirability function for the selection of opti-mum separation conditions in capillary zone electro-phoresis, J. Chromatogr., A 740 (1996) 109–117.
[32] B. Bourguignon, D.L. Massart, Simultaneous optimi-zation of several chromatographic performance goals using Derringer’s desirability function, J. Chromatogr. 586 (1991) 11–20.
[33] R. Woisky, A. Salatino, Analysis of propolis: some para-meters and procedures for chemical quality control, J. Apicult. Res. 37 (1998) 99–105.
[34] R.F. Teófilo, M.M.C. Ferreira, Chemometrics II: spread-sheets for experimental design calculations, a tutorial, Quim. Nova 29 (2006) 338–350.
[35] M. Dornier, M. Decloux, G. Trystram, A. Lebert, Dynamic modelling of crossflow microfiltration using neural net-works, J. Membrane Sci. 98 (1995) 263–273.
[36] H. Niemi, A. Bulsari, S. Palosaari, Simulation of mem-brane separation by neural networks, J. Membrane Sci. 102 (1995) 185–191.
[37] E. Piron, E. Latrille, F. Rene, Application of artificial neural networks for crossflow microfiltration modelling: ‘‘Blackbox’’ and semi-physical approaches, Comput. Chem. Eng. 21 (1997) 1021–1030.
[38] W.R. Bowen, M.J. Jones, H.N.S. Yousef, Dynamic ultrafil-tration of proteins – A neural network approach, J. Membrane Sci. 146 (1998) 225–235.
[39] W.R. Bowen, M.J. Jones, H.N.S. Yousef, Prediction of the rate of crossflow membrane ultrafiltration of colloids: A neural network approach, Chem. Eng. Sci. 53 (1998) 3793–3802.
[40] N. Delgrange, C. Cabassud, M. Cabassud, L. Durand-Bourlier, J.M. Laine, Modelling of ultrafiltration fouling by neural networks, Desalination 118 (1998) 213–227.
[41] M. Hamachi, M. Cabassud, A. Davin, M. Mietton Peu-chot, Dynamic modelling of crossflow microfiltration of bentonite suspension using recurrent neural network, Chem. Eng. Proces. 38 (1999) 203–210.
[42] C. Teodosiu, O. Pastravanu, M. Macoveanu, Neural net-work models for ultrafiltration and backwashing, Water Res. 34 (2000) 4371–4380.
[43] S.M.A. Razavi, S.M. Mousavi, S.A. Mortazavi, Dynamic prediction of milk ultrafiltration performance, a neural network approach, Chem. Eng. Sci. 11 (2003) 4185– –4195.
[44] J. Asghari, B. Ondruschka, M. Mazaheritehrani, Extrac-tion of bioactive chemical compounds from the medi-cinal Asian plants by microwave irradiation, J. Med. Plants Res. 5 (2011) 495–506.
[45] V.D. Ponomarev, Ekstragirovanie lekarstvennogo syr'ya, Medicina, Moskva, 1976.
[46] R.H. Myers, D.C. Montgomery, Response Surface Me-thodology: Process and Product Optimization using De-signed Experiments, 2nd ed., John Wiley & Sons, Inc., New York, USA, 2002.
[47] G. Derringer, R. Suich, Simultaneous optimization of several response variables, J. Qual. Technol. 12 (1980) 214–219.
I.M. SAVIĆ et al.: FLAVONOID COMPOUND EXTRACTION FROM C. sinensis Hem. ind. 67 (2) 249–259 (2013)
259
IZVOD
OPTIMIZACIJA EKSTRAKCIJE UKUPNIH FLAVONOIDA IZ Camellia sinensis PRIMENOM VEŠTAČKE NEURONSKE MREŽE I METODOLOGIJE POVRŠINSKOG ODGOVORA
Ivan M. Savić1, Vesna D. Nikolić1, Ivana M. Savić1, Ljubisa B. Nikolić1, Mihajlo Z. Stanković1, Karl Moder2
1Univerzitet u Nišu, Tehnološki fakultet, Leskovac, Srbija 2University of Natural Resources and Life Sciences, Institute of Applied Statistics and Computing, Center of Experimental Design, Vienna, Austria
(Naučni rad)
Poznato je da slobodni radikali deluju vrlo nepovoljno na čovekov organizam, oštećujući ćelije tkiva i organa dovodeći do degenerativnih oboljenja i raznihoblika raka. Utvrđeno je da su polifenoli nekih biljaka jaki antioksidansi, a za zeleni čaj potvrđeno je da ima najveću količinu polifenola (300–400 mg). Zbog visoke koncentracije polifenola i flavonoida (5–27%), zeleni čaj se koristi kod infekcija,prehlada smanjujući oštećenja ćelija pod dejstvom virusa. Upotrebom zelenog čaja sprečava se razvoj malignih ćelija, a redovno konzumiranje je povezano sasmanjenom incidencom razvoja raka jajnika, jednjaka, mokraćne bešike, pluća,pankreasa, prostate i kože. Takođe, sprečava razvoj ateroskleroze i srčanih obo-ljenja, ubrzava metabolizam i sagorevanje masti. Snižava nivo holesterola, pa se primenjuje i kod povećanog nivoa holesterola u krvi. Cilj ovog rada bio je mode-lovanje i optimizacija procesa ekstrakcije ukupnih flavonoida iz zelenog čaja (Ca-mellia sinensis) primenom veštačke neuronske mreže (eng. artificial neural net-work, ANN) i metodologije površine odgovora (eng. response surface methodo-logy, RSM), kao i poređenje ovih optimizacionih tehnika. Vreme ekstrakcije, kon-centracija etanola i solvomodul posmatrani su kao nezavisno promenljive, dok je prinos ukupnih flavonoida odabran kao zavisno promenljiva. Centralni kompozitnidizajn (eng. central composite design, CCD), primenom polinomnog modela dru-gog reda i višeslojni perceptron korišćeni su za fitovanje dobijenih eksperimen-talnih podataka. Vrednosti RMS, Q2 i r2 za optimizacione modele ukazuju da jemodel „višeslojnog filtiriranja“ (eng. multilayer perceptron, MLP) bolji za predvi-đanje prinosa ukupnih flavonoida od CCD modela. Kod CCD modela, primenom“poželjne” (eng. desirability) funkcije, optimalni uslovi ekstrakcije ukupnih flavo-noida postignuti su pri vremenu ekstrakcije od 32,5 min, koncentraciji etanola od100% (v/v) i solvomodulu od 1:32,5 (m/v). Pri datim uslovima, predviđeni prinosukupnih flavonoida je 2,11 g/100 g suvog ostatka (s.o.), dok je eksperimentalnodobijena vrednost od 2,39 g/100 g s.o. Proces ekstrakcije optimizovan je prime-nom simpleks algoritma kod MLP modela. Po ovom modelu optimalni uslovi eks-trakcije ukupnih flavonoida iz zelenog čaja postižu se za vreme ekstrakcije od 27,2min, pri koncentraciji etanola od 100% (v/v) i solvomodulu od 1:20,7 (m/v). Priovim optimalnim uslovima ekstrakcije, predviđena vrednost prinosa ukupnih fla-vonoida (2,80 g/100 g s.o.) potvrđena je eksperimentalno (2,71 g/100 g s.o.).
Ključne reči: Veštačka neuronska mreža •Metodologija površine odgovora • Eks-trakcija • Ukupni flavonoidi • Camelia sinensis