Embed Size (px)
Citation preview
OPTIMIZATION OF THERMOPLASTIC PULTRUSION PROCESS USING COMMINGLED FIBERS
by
VISHAL D. KAMBLE
UDAY VAIDYA, CHAIR BURTON PATTERSON
DERRICK DEAN SELVUM (BRIAN) PILLAY
A THESIS
Submitted to the graduate faculty of The University of Alabama at Birmingham,
in partial fulfillment of the requirements for the degree of Master of Science
BIRMINGHAM, ALABAMA
2008

ii
OPTIMIZATION OF THERMOPLASTIC PULTRUSION PROCESS USING COMMINGLED FIBERS
VISHAL D. KAMBLE
MATERIALS SCIENCE AND ENGINEERING
ABSTRACT
This work focuses on experimental studies and process modeling pertaining to
pultrusion of glass reinforced thermoplastic composites. The experimental work focuses
on optimizing the process and investigating process variables which are relevant to the
processing of commingled glass polypropylene (PP) fibers. Several parameters affecting
the quality of the pultruded parts were identified. A laboratory scale thermoplastic
pultrusion machine was set up and glass/PP pultruded composite profiles were fabricated
using commingled yarns for different processing variables. The pultrusion process
includes tows of commingled fibers, preheater, heating die, chiller and a pulling
mechanism. The work describes the process conditions that govern the pultrusion of PP
reinforced glass fibers and their behavior on the final properties. The process variables
investigated were the number of tows, die temperature, pulling force and pulling speed.
Optical microscopy and mechanical testing including flexural strength and modulus have
been conducted to evaluate the structure-process-property relationships. Finite element
modeling (FEM) study showed that the temperature of the composite in the pultrusion
process correlated well with the experiment, hence validating the process.

iii
TABLE OF CONTENTS
ABSTRACT ........................................................................................................................ ii
ACKNOWLEDGMENTS .................................................................................................. v
LIST OF TABLES ............................................................................................................. vi
LIST OF FIGURES .......................................................................................................... vii
1 INTRODUCTION ........................................................................................................... 1
2 LITERATURE REVIEW ................................................................................................ 6
2.1 Thermoplastic Pultrusion ........................................................................................... 6 2.2 Processing Cycle ....................................................................................................... 9 2.3 Thermoplastic Pultrusion Methods ............................................................................ 9
2.3.1. Reactive Pultrusion .......................................................................................... 10 2.3.2 Non- Reactive Pultrusion .................................................................................. 11
2.5 Technology Development ....................................................................................... 12 2.6 Processing parameters and its effect on other variables and mechanical properties 13 2.7 Impregnation models and heat transfer simulation ................................................. 24 2.8 Pulling Force Measurement ..................................................................................... 36
3 OBJECTIVES ................................................................................................................ 42
4 MATERIALS AND METHODS ................................................................................... 43
4.1 Material .................................................................................................................... 43 4.2 Experimental Method .............................................................................................. 45 4.3 Pulling force measurement ...................................................................................... 47 4.4 Mechanical Testing ................................................................................................. 48 4.5 Microscopy and Void Content Measurement .......................................................... 48 4.6 FEM Modeling ........................................................................................................ 49
5 RESULTS AND DISCUSSIONS .................................................................................. 50
5.1 Objective # 1. To develop a thermoplastic pultrusion process using commingled fibers. ............................................................................................................................. 50 5.2 Objective # 2. To study the effect of different processing variables in thermoplastic pultrusion. ...................................................................................................................... 52
5.2.1 Effect of die temperature on pulling force ........................................................ 53 5.2.2 Effect of die temperature on line speed ............................................................. 55 5.2.3 Effect of number of tows on pulling force ........................................................ 56 5.2.4 Effect of line speed on pulling force ................................................................. 58
5.3 Objective # 3. To evaluate mechanical and physical properties of pultruded thermoplastic composite and compare them with relevant published work. ................. 59
5.3.1 Effect of line speed on flexural strength ........................................................... 59

iv
5.3.2 Effect of die temperature on flexural strength .................................................. 61 5.3.3 Effect of number of tows on flexural strength .................................................. 63 5.3.4 Microstructural analysis .................................................................................... 65
5.4 Objective # 4. To develop finite element analysis model to describe the heat transfer of the material in the die. .................................................................................. 68
6 SUMMARY ................................................................................................................... 76
7 CONCLUSIONS............................................................................................................ 78
LIST OF REFERENCES .................................................................................................. 80

v
ACKNOWLEDGMENTS
I would like to express the deepest appreciation to my mentor and committee
chair, Dr. Uday Vaidya who has the attitude and the substance of a genius: he continually
and convincingly conveyed a spirit of adventure in regard to research and an excitement
in regard to teaching. Without his guidance and persistent help this dissertation would not
have been possible.
I sincerely thank my advisory committee members Dr. Burton Patterson, Dr.
Derrick Dean and Dr. Selvum Pillay for their valuable inputs in my thesis project.
I would like to thank department chair, Dr. Barry Andrews for giving me an
opportunity to pursue Master’s at a very prestigious university.
I am very grateful to Dr. Selvum Pillay, Dr. Haibin Ning and Dr. Florentina
Simionescu for helping me with the techniques and their valuable time and advice.
Lastly sincere thanks to all of my fellow lab students, who helped me a lot in
every aspect during my academic years at UAB, Birmingham.

vi
LIST OF TABLES
Table Page 1 Void fraction values ........................................................................................ 67
2 Density Measurement ..................................................................................... 67

vii
LIST OF FIGURES
Figure Page 1 Schematic of pultrusion process ........................................................................6
2 Various thermoplastic pultrusion methods ......................................................10
3 Schematic of reactive thermoplastic pultrusion process ..................................11
4 Gloss versus pulling speed ...............................................................................14
5 Roughness versus pulling speed ......................................................................15
6 Pulling force versus die length .........................................................................16
7 Pulling force versus pultrusion velocity at various temperatures ....................18
8 Pulling force versus temperature: comparison between the numerical models .............................................................................................19
9 Flexural strength of pultruded and compression molded samples .............................................................................................................20
10 Flexural strength versus linespeed for a PA12/GF powder impregnated laminate .......................................................................................22
11 Flexural strength versus line speed for pultruded commingled PP/GF 20 X 2 mm strip ....................................................................................23
12 Flexural strength versus line speed for a pultruded commingled PP/GF 2 mm diameter rod ...............................................................................24
13 Simplification of the cross section of the commingled yarn as an array of agglomeration ................................................................................25
14 Microphotographs of a typical cross section of the pultruded parts (a) poorly impregnated part using RPP75 yarns and (b) fully impregnated part form RPP60 yarns with same processing conditions .........................................................................................................27
15 Degree of impregnation of pultruded parts as functions of pulling speed for different processing temperatures and die inlet areas for RPP75. Comparisons between experimental data and predictions by the model ...........................................................................28
16 Pressure in the die as a function of the temperature difference .......................30
17 RPP75 commingled tows provided by Vetrotex [7] ........................................44
18 Set up of thermoplastic pultrusion line ............................................................44
19 Floating die mechanism for measuring force ...................................................47

viii
20 Processing cycle for thermoplastic PP/glass fibers ..........................................51
21 Effect of die temperature on pulling force for commingled PP/glass fiber composite ..................................................................................54
22 Effect of die temperature on line speed for commingled PP/ glass fiber composite ........................................................................................56
23 Effect of number of tows on pulling force for commingled PP/ glass fiber .........................................................................................................57
24 Effect of line speed on pulling force for commingled PP/ glass fiber composite.................................................................................................59
25 Effect of line speed on flexural strength for commingled PP/ glass fiber composite ........................................................................................60
26 Flexural stress versus strain curve showing maximum modulus at minimum line speed 0.38 m/min ..................................................................61
27 Effect of temperature on flexural strength for commingled PP/glass fiber composite ..................................................................................62
28 Effect of temperature on flexural modulus ......................................................63
29 Effect of number of tows of flexural strength for commingled PP/ glass fiber composite .................................................................................64
30 Effect of number of tows of flexural modulus .................................................64
31 Microphotographs of impregnated pultruded product using RPP75 (a) with 80 number of tows (b) with 85 number of tows (c) with 90 number of tows ..............................................................................66
32 Finite element model of the die .......................................................................69
33 Meshed model of the die system ......................................................................71
34 Heat transfer distribution through the die ........................................................73
35 Longitudinal section of the die through the material .......................................74
36 Heat transfer distribution through the composite.............................................75

1
1 INTRODUCTION
The pultrusion process which was conceptualized in 1950 by Brandt
Goldsworthy is used for making fiber reinforced polymer composites of constant cross
section and continuous length. Pultrusion finds applications in electrical, corrosion,
building and consumer markets [1, 2]. In the pultrusion process, reinforcing fibers,
impregnated with matrix, are pulled through a heated die where they acquire the shape of
the die cavity and consolidate before they are cut into required lengths [2-5]. The
pultrusion process provides an economical way to produce thermoplastic as well as
thermoset materials and promises to deliver superior quality product [1]. Processing
parameters play an important role with regards to the appearance and quality of a
pultruded part. The process parameters which affect the final properties of the pultruded
part are; pulling speed, preheating condition, heating temperature in the die, and cooling
rate [6, 7]. A recent study conducted by Composites Fabricators Association (CFA)
reported that the annual United States (US) output of pultruded materials is
approximately 8.6 million kg of 5% of the total 1.7 billion kg of FRP materials
manufactured in US’s $24 billion composites industry. The true growth prospect for this
technology is in the development of structural profiles, particularly for bridge
construction, offshore structures and large overhead infrastructure applications.
In recent years, pultruded profiles are replacing conventional construction
materials such as wood, aluminum and steel in infrastructure, construction,

2
transportation, consumer, corrosion and electrical markets because it provides high
strength structural composite parts and complex profiles. The process is suitable for high
volume fabrication of high fiber content linear profiles with a constant cross section such
as beams, channels, tubing and rod stock.
Pultruded products are advantageous over structures made from conventional
materials like steel and aluminum because of their superior mechanical properties, ease of
installation, weight saving and cost effectiveness. Pultruded profiles weigh 50% less than
aluminum and 75% less than steel for equivalent strength. Pultruded structures can be
pre-assembled into sections and readily brought to the installation site for construction of
sea walls, bridges and other structural profiles. A retrofit installation on a bridge made of
glass fiber reinforced pultruded tubes filled with concrete and epoxy coated steel cables
in Ohio took only 14 days as compared to 32 days it would had taken using conventional
materials [8]. In the bridge upgrade in Blacksburg, Virginia, steel flange beams were
replaced by pultruded carbon fiber reinforced plastics (FRP) beams which contributed to
increased stiffness to magnitude of 6x10^6 psi [8].
Pultruded beams can achieve better performance over all long term than steel and
concrete because it can get rid of the corrosion elements. Despite the fact that initial cost
of pultruded structures would be higher than steel, they are replacing steel in sea walls
and off shore oil exploration members owing to their weight savings, durability, and
resistance to salt and salt air. Pultruded structures are far less expensive over the long
run, because structures can last much longer.
Pultrusion has significant market potential in the construction of trim, gutters,
doors and windows. The profiles provide resistance to moisture; they do not warp, rot or

3
corrode. FRP materials maintain dimensional stability over changing temperatures.
Pultrusion also finds market in electrical applications such as pultruded power
transmission poles and towers. The products are lighter, enable faster installation, are
much safer, required reduced maitainance and longer lasting than structures made of
conventional materials. Creative Pultrusions in collaboration with General Motors (GM)
has developed a prototype pultruded tailgate assembly for a pickup truck [8]. It offers
30% weight savings and 90% reduction in investment costs over metallic couterpart.
Pultruded panels have also been used in fire trucks and buses, roll up doors, corner
sections, side posts and other structural components for automotive applications [8]. GM
has developed a light weight drive shaft made up of glass and carbon fiber reinforced
vinyl ester pultruded over an aluminum tube for pickup trucks. These shafts have
superior performance based on two years of testing simulating 20 years of vehicle life
with an average weight savings of 9 kg [8].
Thermoplastics in powder form have been used to produce the frame and chassis
of an all composite passenger sedan developed by Automotive Design and Composites
Ltd. [8]. The vehicle featured pultruded carbon fiber reinforced frame rails, overhead
supports, and other structural members that were post formed using heat and pressure to
bend them into required shapes.
In pultrusion, thermoset resins have been historically preferred over thermoplastic
resins because of the ease of impregnation. Thermoset resins are materials that cannot be
melted once they are cured. The curing takes place through a chemical reaction which
involves a cross linking process. On reheating, thermosets undergo decomposition before
they reach the melting point. A thermoset resin cannot be melted and reused, implying

4
that they cannot be recycled, except when used as a filler material. On the other hand,
thermoplastic resins melt to a liquid state when heated and freeze to a brittle, glassy state
when sufficiently cooled. Unlike that of thermoset, a thermoplastic resin does not
undergo any curing reaction. On reheating, the polymeric chains break easily because
they are linked by weak van der Waals forces causing the thermoplastic to melt.
Therefore, thermoplastic resins can be recycled [10].
In recent years, pultrusion of thermoplastic composites has grown because it
presents significant advantages over thermosets including improved toughness and
durability, enhanced damage resistance, environmental resistance, cost-effective
processing, post-process formability and recyclability [6, 11, 12]. Thermoplastic
materials provide ease of processing which is limited to melting the matrix, compaction
under pressure and finally cooling [4]. Thermoplastic are easy to join using plastic
welding processes instead of adhesives and fasteners.
In previous years, pultrusion with thermoplastic materials had been difficult and
challenging, primarily due to the higher viscosity of thermoplastic resins as compared to
thermoset resins, resulting in poor fiber impregnation [4, 10, 13]. But this drawback has
been overcome due to the development of new processing technologies and number of
intermediate material forms such as commingled fibers, powder impregnated bundles, hot
melt impregnated tows and in-situ polymerization.
In 1999, Dow plastics developed Fulcrum, a low viscosity resin technology,
especially for thermoplastic pultrusion process. Fulcrum provided a solution to overcome
poor fiber impregnation [5, 8]. In this technology thermoplastic polyurethane resin was
pultruded by reversing the polymerization process in its melt stage. Thermoplastic

5
composites fabricated using this technology demonstrated the same mechanical
properties as that of the thermoset composites, in addition to providing improved
toughness and damage tolerance with greater processing versatility; since the profiles
were thermoformable.
Commingled tows with partial impregnation capabilities have been developed to
improve processability of thermoplatics [11, 12]. In commingled tows, the fibers as well
as the matrix (PP) are in fiber form. The matrix fibers are commingled with reinforcing
fibers essentially of similar diameter in order to achieve adequate distribution of the
respective constituents [11]. Commingled tows provide a good balance between
versatility of performance, ease of processing and price. PP and polyethylene (PE) are
commonly used since they can be processed easily and are less expensive than other
resins. A number of semi finished products have been developed where the matrices and
the reinforcing fibers are commingled, but there still remain difficulties to achieve good
wetting of fibers with the resin [12, 13]. However, pultrusion of thermoplastic matrices
is becoming increasingly popular with the development of commingled tows which
facilitates impregnation [14].

6
CHAPTER 2 LITERATURE REVIEW
2.1 Thermoplastic Pultrusion
Thermoplastic pultrusion is a manufacturing process in which thermoplastic
materials which might be in pre impregnated form, powder impregnated bundles, hybrid
yarns, melt form etc. are pulled through the heating die where they impregnate the
reinforcing fibers before cooling sufficiently to consolidate and are then cut to required
lengths [15-19].
Figure 1. Schematic of pultrusion process
A typical set up for thermoplastic pultrusion is shown in Fig. 1. The
thermoplastic material stored on the creel is guided into the preheating chamber, where it
is heated to the melt temperature of the polymer in order to facilitate fast processing.

7
After preheating, the commingled tows are pulled through the electrically heated die
where the resin melts and impregnates the reinforcing fibers, before in the cooling die.
The profile is then pulled through the die with the help of a pulling device placed at the
end of the pultrusion line. The profile is cut to required shapes.
A typical pultrusion machine consists of the following parts:
1. Preheater
2. Die assembly
A. Heating die
B. Cooling die
3. Pulling Mechanism
1. Preheater
The preheater facilitates rapid processing of the material since it heats the
polymer close to its melt temperature and initiates wet out of the reinforcing fibers. It is
essential to preheat the material before it enters the heated die, otherwise the required
process temperature in the core section of the material is not attained and the composite
does not fully consolidate. During heating the material must be:
(1) in no contact with the inner area of the preheater to prevent it from melting
and sticking to the preheater.
(2) continuous to avoid localized overheating and degradation; and
(3) uniform to minimize temperature difference through the thickness of
composite.

8
The length of the preheater can be decreased by short preheating times, and
increased pultrusion speed. The preheater zone is equipped with strip heaters or infrared
heaters to heat the material, and thermocouples to monitor and control the material
temperature.
2. Die assembly
The die assembly comprises of heating and cooling dies separated by a narrow
gap and are perfectly assembled, ensuring alignment. In the heating die the material gets
heated to its melt temperature. The PP polymer flows, impregnating the glass fiber
bundles. The exiting material from the heating die cools and consolidates in the cooling
die. The die assembly has a cavity which is tapered at the entrance to allow slight overfill
in order to assist build up of consolidation pressure. The heating dies are provided with
heaters which ensure heating of the material in the die and thermocouples to monitor the
temperature. The cooling dies are generally equipped with chillers. The cooling die
extracts heat from the material aiding consolidation.
The die assembly consists of a lower and an upper part that are assembled by
screws. A graphite gasket is placed between the upper and lower die to along the length
to increase the pressure inside the die. It also avoids heat loss and prevents material of
the sides of the die.
The dies are machined from tool steel and the cavities are highly polished. The
die cavity is chrome plated in order to reduce friction between the moving material and
the cavity walls.

9
3. Pulling Mechanism
The pultrusion line is equipped with a pulling mechanism that enables to pull the
material through the die at different speeds and then it is cut into required lengths. The
pulling mechanism consists of polyurethane coated metal plates of constant cross section
that aid in gripping the material while pulling. The pulling mechanism is operated via a
variable speed direct current (DC) motor. The DC motor drives polyurethane plates
through a pneumatic transmission. Each machine is designed for a maximum linear
speed and pulling force that can be changed by varying the motor speed.
2.2 Processing Cycle
Bernet et al. [20] described the processing cycle for a thermoplastic pultruded part
made up of commingled fibers assuming that the mechanism of consolidation is fiber
impregnation which is validated using the work done by Phillips et al. [21] on
consolidation of carbon fiber (CF)/polyetherimide (PEI) prepregs. The processing cycle
consists of raising the heating temperature to the melting point of the resin and applying
pressure for a fixed period of time for appropriate consolidation and finally cooling at
constant pressure. Three main mechanisms take place during the consolidation stage, (1)
close contact of fibers due to compression; (2) autohesion (resistance to separate two
bonded identical film); and (3) fiber impregnation. From these three processes, close
fiber contact and autohesion processes contribute to only 1% of total consolidation time,
the rest is consumed by impregnation.
2.3 Thermoplastic Pultrusion Methods The thermoplastic pultrusion can be carried out in two ways as shown in Fig. 2,

10
1. Reactive pultrusion
2. Non-reactive pultrusion
Figure 2. Various thermoplastic pultrusion methods
Note: Adapted from “Reaction injection pultrusion of PA12 composites: process and modeling”, A. Luisier, P.E. Bourban, J.E. Manson, 2003, Composites: Part A 34, p. 583-595. 2.3.1. Reactive Pultrusion
The reactive pultrusion process comprises of both thermoset as well as
thermoplastic pultrusion processes. It features an injection unit to pump low viscosity
thermoplastic resin to bring about the chemical reaction necessary for in-situ
polymerization. As shown in Fig. 3, reactive pultrusion process is similar to that of
Reactive Non Reactive
Prepegs Polymer Filaments
Polymer Melt
Polymer Solution
Polymer Powder
RIM Pultrusion
Thermoplastic Pultrusion

11
reactive thermoset pultrusion but differs in the design of the in injection unit used for in-
situ polymerization. In this process, the injection unit comprises of a two small storage
tanks to store molten lactum above its melting point and a liquid system (nitrogen) at
room temperature and is designed in such a way that both the materials inject into the
mold with an accurate ratio, under high pressure and short residence time.
Figure 3. Schematic of reactive thermoplastic pultrusion process
Note: Adapted from “Reaction injection pultrusion of PA12 composites: process and modeling”, A. Luisier, P.E. Bourban, J.E. Manson, 2003, Composites: Part A 34, p. 583-595. 2.3.2 Non- Reactive Pultrusion
In non-reactive pultrusion process there is no chemical reaction involved. The
material passes through the heating die, melts in the heating die and consolidates in the
cooling die as shown in Fig. 1.
2.4 Limitations of Thermoplastic pultrusion process
Though thermoplastic materials are replacing thermoset materials in several
applications, they have limitations summarized as follows:

12
1. The process parameters for thermoplastics are not fully developed which results in
pre-production cost and quality limitations.
2. Thermoplastic materials have high melt viscosity which results in improper
impregnation of reinforcing fibers.
3. They are susceptible to deformation while consolidation.
4. There are pressure limitations in the die resulting in inadequate pressure for
impregnation.
5. High line speeds are difficult to achieve since it detoriates the mechanical properties,
because of improper impregnation.
2.5 Technology Development
Several researchers have investigatied the pultrusion technology for
thermoplastics as well as thermoset materials with respect to choice of material used,
optimization, parametric effects on mechanical properties and heat transfer modeling.
With respect to technology development in case of thermoplastic pultrusion
Michaeli et al [22] carried out braided fiber layup pultrusion using PP. They employed a
core spinning process for one of the material systems using PP/glass hybrid, commingled
yarn of carbon (C)/liquid crystalline polymer (LPC) and carbon (C)/poly ether ether
ketone (PEEK).
The basic setup of a pultrusion braider is similar to that of the thermoset
pultrusion line with the only difference that the coil magazine is replaced by a textile
braiding machine. In this process the preliminary material used is filaments of dry hybrid
yarns used as reinforcements.

13
According to Michaeli et al [22] the processing of hybrid yarns provides
advantages over other thermoplastic fiber reinforced materials as starting products being:
1. Limitless combinations of materials
2. Ease of transport and handling
3. Potential for textile processing, and
4. Easy process technology, only a little different as compared to traditional pultrusion.
Sala et al [23] used fiber impregnation technique using poly butylene
terephthalate (PBT) thermoplastic resin. They demonstrated manufacturing rates 5-10
times higher than thermoset pultrusion, better diffusion of the matrix in the fiber network
and higher toughness of the resulting part.
Luiser et al [24] developed a reactive thermoplastic pultrusion process by using
PA12 and took into account in-situ polymerization of low viscosity thermoplastic
lauryllactum monomer. This technology includes principles of thermosets as well as
thermoplastic pultrusion. It differs from conventional thermoplastic pultrusion because it
involves complex chemical reactions of thermoset resin cure.
2.6 Processing parameters and its effect on other variables and mechanical properties
As in any other processes, processing parameters play an important role on the
outcome of the product.
In case of pultrusion process the processing parameters that are varied for
obtaining a good quality part are; preheating temperature, heating die temperature,
pulling speed and pulling force. Carlson et al [4] describe the processing conditions for

14
melt impregnated glass/PP prepeg and the influence of processing conditions on the
resulting mechanical properties. They investigated process variables with respect to
preheating temperature, die temperature, cooled die temperature and pulling speed and
assessed the effects of these variables by characterizing flexural modulus and strength,
surface finish, and pulling force. They showed that with increase in line speed, good
surface finish can be obtained, but the fiber distribution over the cross section is not
properly obtained. With increase in pulling speed from 2 to 6 mm/s, they observed the
surface to become glossy and smoother as shown in Fig. 4 and 5. They observed the
appearance of smaller spherulites at the surface of the composite that creates many
nucleation sites resulting in further crystallization. However higher pulling speeds
adversely affect mechanical properties because it does not provide enough time for the
fibers to distribute uniformly throughout the cross section resulting in improper
impregnation.
0
1
2
3
4
5
6
0 1 2 3 4 5 6 7
Pulling Speed (mm/s)
Glo
ss
Figure 4. Gloss versus pulling speed

15
Note: Adapted from “Experimental investigation of pultrusion of glass fiber reinforced polypropylene composites”, A. Carlsson and B. Tomas Astrom, 1998, Composites: Part A 29A, p. 585-593.
Carlson et al [4] also studied the effect of preheat temperature on the appearance
and mechanical properties of the material. They reported that preheat temperature
controls the shine of the surface. They found that at higher preheat temperature (175°C),
the prepeg resin melts, resulting in fiber relaxation and upsetting the fiber distribution,
resulting in small decrease in the flexural modulus (around 2 GPa) along with loss of
gloss and surface finish.
0
5
10
15
20
25
30
0 1 2 3 4 5 6 7
Pulling speed (mm/s)
Rou
ghne
ss R
a (u
m)
Figure 5. Roughness versus pulling speed
Note: Adapted from “Experimental investigation of pultrusion of glass fiber reinforced polypropylene composites”, A. Carlsson and B. Tomas Astrom, 1998, Composites: Part A 29A, p. 585-593.
With variation in the heating die temperature they found a variety of fiber
distribution patterns. The pultruded profiles manufactured using high die (225°C)

16
temperature showed a fairly uniform distribution of fibers over the cross section. Some
of the samples demonstrated a distinctive ply structure which slowly disappeared at the
surface giving a fairly uniform fiber distribution. On the other hand, samples
manufactured using low die temperature (205°C) showed distinctive ply structures which
did not disappear at the surface, therefore lacking uniform distribution. The temperature
did not reach the center of the composite resulting in low level of consolidation and fiber
distribution.
Sala et al [23] evaluated the influence of parameters including pultrusion velocity,
temperature and die length using PBT powder impregnated glass fiber bundles. They
studied the effect of die length on pulling force, speed on pulling force and die length on
pressure. They developed various models including a pulling force model.
Figure 6. Pulling force versus die length
17
Note: Adapted from “The pultrusion of powder impregnated thermoplastic composites”, G. Sala and D. Cutolo, 1997, Composites PartA 28A, p. 637-646.
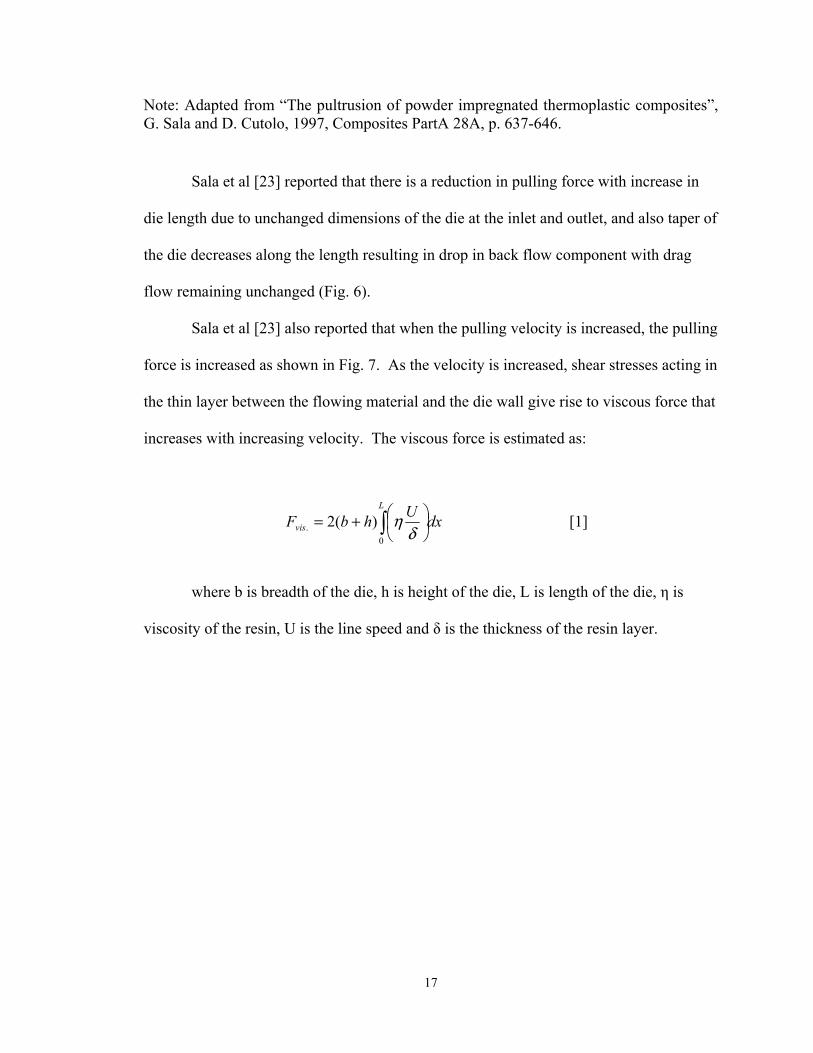
Sala et al [23] reported that there is a reduction in pulling force with increase in
die length due to unchanged dimensions of the die at the inlet and outlet, and also taper of
the die decreases along the length resulting in drop in back flow component with drag
flow remaining unchanged (Fig. 6).
Sala et al [23] also reported that when the pulling velocity is increased, the pulling
force is increased as shown in Fig. 7. As the velocity is increased, shear stresses acting in
the thin layer between the flowing material and the die wall give rise to viscous force that
increases with increasing velocity. The viscous force is estimated as:
dxUhbFL
vis ∫ ⎟⎠⎞
⎜⎝⎛+=
0. )(2
δη [1]
where b is breadth of the die, h is height of the die, L is length of the die, η is
viscosity of the resin, U is the line speed and δ is the thickness of the resin layer.

18
Figure 7. Pulling force versus pultrusion velocity at various temperatures
Note: Adapted from “The pultrusion of powder impregnated thermoplastic composites”, G. Sala and D. Cutolo, 1997, Composites PartA 28A, p. 637-646.
Based on the experimental work and numerical modeling, the pulling force
decreased gradually with increase in temperature as shown in Fig. 8 [23]. Their
reasoning was that with increase in temperature, the resin flows freely and provides less
resistance to pulling, which results in decreased pulling force.

19
Figure 8. Pulling force versus temperature: comparison between the numerical models
Note: Adapted from “The pultrusion of powder impregnated thermoplastic composites”, G. Sala and D. Cutolo, 1997, Composites PartA 28A, p. 637-646.
Michaeli et al [22] studied different processing parameters in which pultrusion
was carried out using braided fibers and a thermoplastic PP matrix. Pultrusion trials were
carried out using different processing variables. The quality of the pultruded profile was
found to depend on the kind of material used during processing and on the amount of
resin and fiber content [22]. The optical properties show marked improvement when
parallel hybrid materials such as commingled fibers were used. This is due to improved
fiber-matrix wet out and homogeneous fiber distribution.
Angelov et al [13] studied the influence of line speed on pultruded profiles and
evaluated the quality by performing a three point bend test, as well as Charpy impact test

20
on flax/PP material. Flax fibers are natural fibers which are environmental friendly,
recyclable and exhibit superior specific properties alike to the properties of glass fiber
reinforced composites. The authors found that at higher pulling speeds flexural strength
of the pultruded profile decreased as compared to lower pulling speed. Additionally they
found that the flexural strength gets affected with variation in fiber content. When they
increased the fiber content from 30% to 50% the flexural properties increased
approximately by 30%. They reported the same magnitude of impact energy for samples
pultruded using 30% and 50% fiber content respectively.
Figure 9. Flexural strength of pultruded and compression molded samples
Note: Adapted from “Pultrusion of a flax/polypropylene yarn”,I. Angelov, S. Weidmer, M. Evstatiev, K. Friedrich, G. Mennig, 2007, Composites: Part A 38, p. 1431-1438.
Angelov et al [13] also compared the mechanical properties of the composites
manufactured using a pultrusion process and a compression molding process. They
found that the samples made using compression molding process demonstrated higher

21
flexural properties than the pultruded samples as shown in Fig. 9. This can be attributed
to higher impregnation attained in compression molded samples than the pultruded
samples. This shows that there is strong dependency of processing parameters including
temperature and pressure on the impregnation quality, and hence on the mechanical
properties of the composite.
Miller et al [11] developed a correlation between experiments and a model for
commingled glass/PP fibers and dry powder impregnated PA 12/glass fiber reinforced
towpregs. They found that although high pultrusion speeds were not successfully
achieved the mechanical properties, surface and impregnation qualities were adequate.
The mechanical properties deteriorate due to inadequate consolidation. They reported
minimal void content at high line speeds as high as 10 m/min.
Miller et al [11] evaluated the mechanical properties using three point bend
flexural test for pultruded profiles of PA12/GF laminates manufactured from prepegs.
The pultrusion line speeds varied between 1-10 m/min. Figure 10 shows decrease in
flexural strength with increase in the line speed. Cavities appeared inside the pultruded
part because of void formation with increase in line speed. The values of flexural
strength changed between 600 to 700 MPa with the final void content values ranging
from 1 to 4 %. Mechanical properties were adequate and are not notably influenced by
void content with the increase in line speed.

22
Figure 10. Flexural strength versus linespeed for a PA12/GF powder impregnated laminate
Note: Adapted from “High speed pultrusion of thermoplastic matrix composites”, A. Miller, N. Dodds, J. Hale and A. Gibson, 1998, Composites: Part A 29, p. 773-782.
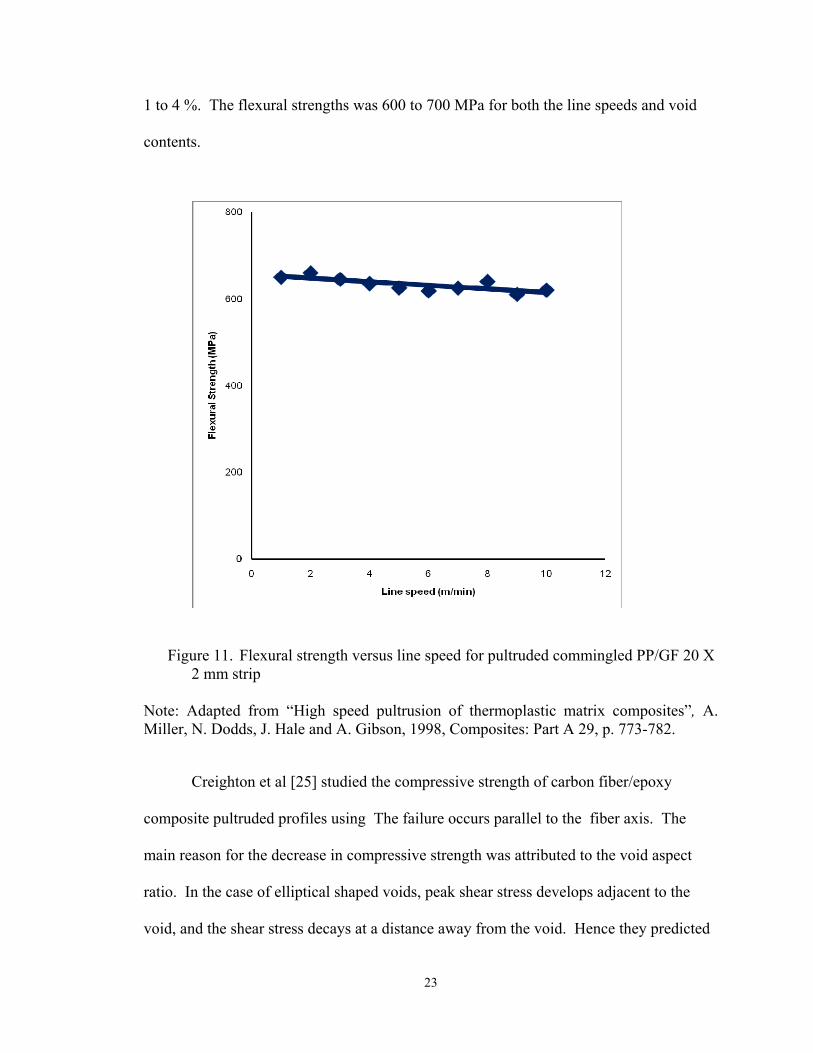
The mechanical properties relative to line speed and impregnation quality for
commingled profiles were measured in terms of flexural strength. Figures 11 and 12
illustrate that the flexural properties were reduced to some extent as the line speed was
increased, due to the decrease in impregnation time causing improper fiber wetout and
resulting in void formation. For the speeds varying from 1-5 m/min the void content was
measured to from 0 to 2 %. For the speed varying from 5-10 m/min, the void content was
23
1 to 4 %. The flexural strengths was 600 to 700 MPa for both the line speeds and void
contents.
Figure 11. Flexural strength versus line speed for pultruded commingled PP/GF 20 X 2 mm strip
Note: Adapted from “High speed pultrusion of thermoplastic matrix composites”, A. Miller, N. Dodds, J. Hale and A. Gibson, 1998, Composites: Part A 29, p. 773-782.
Creighton et al [25] studied the compressive strength of carbon fiber/epoxy
composite pultruded profiles using The failure occurs parallel to the fiber axis. The
main reason for the decrease in compressive strength was attributed to the void aspect
ratio. In the case of elliptical shaped voids, peak shear stress develops adjacent to the
void, and the shear stress decays at a distance away from the void. Hence they predicted

24
that these changes in the stress state influenced by the aspect ratio significantly affect the
mechanical properties resulting in reduced strength.
Figure 12. Flexural strength versus line speed for a pultruded commingled PP/GF 2 mm diameter rod
Note: Adapted from “High speed pultrusion of thermoplastic matrix composites”, A. Miller, N. Dodds, J. Hale and A. Gibson, 1998, Composites: Part A 29, p. 773-782.
2.7 Impregnation models and heat transfer simulation
The heating system in a pultrusion line is comprised of a heating die where melt
impregnation takes place, and a cooling die where consolidation takes place [12, 26, 27].
Most of the impregnation takes place at the tapered end of the die where the temperature
of the composite is in steady state. In commingled tows, the molten resin does not

25
disperse uniformly among the reinforcing fibers. This leads to fiber agglomeration and
formation of voids due to incomplete impregnation, which causes deterioration of
mechanical properties as can be seen in Fig. 13.
The major problem of optimizing the thermoplastic pultrusion process is to find a
way by which maximum impregnation can be achieved under given processing
conditions. This can be achieved through modeling which can help in predicting the
temperature profiles in both the pultruded part and pultrusion die. But the real problem is
the impregnation of the fibers by the polymer in thermoplastic materials.
Figure 13. Simplification of the cross section of the commingled yarn as an array of agglomeration
Note: Adapted from “A model for a thermoplastic pultrusion process using commingled tows”, D.H. Kim, W.I. Lee, K. Friedrich, 2001, Composites Science and Technology, 61, p. 1065-1077.
Several authors conducted numerical modeling to predict impregnation of the
system and the heating mechanism taking place in the die. In developing the model for a
die, many authors [28-31] assumed temperature and pressure to be the dominant factors

26
involved in proper wet out, and hence built their models to evaluate the temperature and
pressure profiles in the die and the composite , and the subsequent influence of these
parameters on the final pultruded part.
The impregnation and consolidation of commingled fibers has been studied by
several researchers [32-37]. Some authors have developed microsocopic models of the
impregnation process. Gibson et al [38] and van West et al [39] established a model by
employing a semi empirical Darcy’s law. Van West et al further developed the model by
implementing the work done by Kozeny-Carman [40] and Gutowski [41] which describes
variation in permeability in the fibrous bed related to extremely viscous resin flow of a
thermoplastic matrix.
The work published thus far differs in the intricacies present in the computer
model, the variety of materials used, and whether a microscopic or a macroscopic path is
followed. Because the pultrusion process and its mechanisms involve heat transfer and
flow of the material through the die, the problem of heat transfer is divided into a heat
transfer problem and flow problem pertaining to impregnation. To address these
problems, well-known equations including the energy equation, equation of motion and
Darcy’s law among others are used.
Kim et al [14] studied the pultrusion process using a set of thermoplastic
commingled yarns (Twintex® RPP60 and RPP75 respectively) and implemented
macroscopic and microscopic sub models to develop an impregnation model. They
examined and studied the development of the resin pressure inside the heating die in
order to effectively model the impregnation process. Their model describes macroscopic

27
axial flow of resin along the arrangement of fiber agglomerations and resin flow
impregnation through fiber agglomerations respectively.
Figure 14. Microphotographs of a typical cross section of the pultruded parts (a) poorly impregnated part using RPP75 yarns and (b) fully impregnated part form RPP60 yarns with same processing conditions
Note: Adapted from “A model for a thermoplastic pultrusion process using commingled tows”, D.H. Kim, W.I. Lee, K. Friedrich, 2001, Composites Science and Technology, 61, p. 1065-1077.
They performed analysis and experiments and found that the fiber agglomeration
size is the most significant factor in improving the degree of impregnation. Figure 14
shows a pultruded part from Twintex® RPP75 and RPP60 yarns respectively. As the

28
agglomeration size of RPP75 is large, it exibits incomplete impregnation as compared to
RPP60 yarns for the same processing conditions. This suggests that for rapid and
adequate impregnation of the fibers, the agglomeration size has to be small because it
will induce high macroscopic pressure resulting in good impregnation.
Figure 15. Degree of impregnation of pultruded parts as functions of pulling speed for different processing temperatures and die inlet areas for RPP75. Comparisons between experimental data and predictions by the model
Note: Adapted from “A model for a thermoplastic pultrusion process using commingled tows”, D.H. Kim, W.I. Lee, K. Friedrich, 2001, Composites Science and Technology, 61, p. 1065-1077.
According to Kim et al [14], the taper geometry also plays an important role in
affecting the degree of impregnation but not as significant as the agglomeration size. To
accomplish better impregnation a small taper entrance and long taper length is considered

29
necessary. This helps in building high macroscopic pressure inside the die resulting in
good impregnation. However, the drawback of using a die with a small taper entrance is
it may obstruct the entry of raw material into the die because of high shear rate caused by
backward resin flow. It may also lead to high pulling force due to increase in
macroscopic pressure. However the data they generated for smaller die entrance area
demonstrated lower degree of impregnation than estimated at high pulling speed as
shown in Fig. 15. They attributed this to shear thinning of the resin at high shear rates of
induced pressure with decrease in resin velocity.
Michaeli et al [22] investigated the pressure in the die and they assumed that
impregnation is a function of temperature, time and resin viscosity for commingled
fibers. Their emphasis was on the temperature difference in the die and its effect on the
die pressure. They offered two reasons for pressure built up in the die. Pressure built up
in the die cavity is due to the thermal expansion which is caused by a temperature
difference at the entrance and end of the die. Pressure also builds up at the entrance of the
die because of resin back flow. They measured the pressure inside the die using strain
gauges and calculated the pressure using a thermal expansion model. The pressure in the
die plotted versus the temperature difference for measured average values and calculated
value is illustrated in Fig. 16. The difference in the pressure shows that both values are
independent of the type of semi-finished product used during processing.

30
0
10
20
30
40
50
60
70
80
90
100
0 5 10 15 20 25 30 35 40 45 50
Temperature difference [ºC]
Pres
sure
in th
e di
e [b
ar]
Calculated
Measured
Figure 16. Pressure in the die as a function of the temperature difference
Note: Adapted from “Thermoplastic pull braiding: pultrusion of profiles with braided fiber lay up and thermoplastic matrix system”, W. Michaeli and D. Jurss, 1996, Composites Part A 27A, p. 3-7.
Seo et al [42] examined the impregnation of continuous thermoplastic PEEK
150P/graphite composite. They explained the degree of impregnation as a function of
time for different processing variables including pressure, temperature and tow size.
Seo et al [42] discussed two cases for impregnation i.e. an ideal and a real case.
They reported that permeability of the fiber bundle is a function of the applied pressure.
In an ideal condition, each single fiber is perfectly straight and parallel with respect to
each other. When the pressure is applied, the fiber bundle moves closer to each other
leaving no space for resin to penetrate between them. In the real case, however, every

31
fiber is not perfectly straight and parallel to each other, but is somewhat wavy in nature.
This makes fiber bundles to come into physical contact with each other at some points
when the pressure is applied. Between these contact points there is some space for the
resin to pass through and this space is directly associated with the permeability of the
fiber bundle which provides resistance to the flow of resin. With increase in pressure
the space gets smaller, leaving less space for the resin to penetrate, and decreases the
resistance to the resin flow providing adequate impregnation.
Haffner et al [1] studied the pressure and velocity profile. They observed that at
the entrance of the die the pressure is not evenly distributed because of high viscosity of
the polymer. However, as the material passes through the die, pressure starts to stabilize
gradually as the polymer becomes more fluid and is well distributed towards the end. In
the velocity profile they found the resin near the walls of the die has low viscosity, while
the viscosity closer to the center of the composite is high. In the center section of the die,
the matrix is evenly distributed and the polymer flows in a forward direction, while at the
end of the heating die, the matrix accelerates due to decrease in pressure resulting in
steadily impregnating moving fiber bundles.
They reported that the fiber bundle which is nearer to the heating die wall goes
beyond the melting temperature of the matrix, while the fiber bundle closer to the center
of the die is in the process of reaching this critical temperature at some distance in the
die. In case the fiber bundle does not reach the melting temperature, the grouped
polymer particles get squeezed into the interstitial regions between the single glass fibers.
This results in improper wetting and hence voids appear.

32
Michaeli et al [22] applied improved heat transfer and conduction theory for a
system under high pressure and found that with high pressure and temperature the resin
tends to flow back and decreases viscosity; resulting in improper impregnation. In
addition, they measured the temperature profile on the length of the pultrusion line to
calculate the definite temperature profiles in different zones for different fiber/resin
combinations and stated that the material gets heated by conduction, convection and
radiation.
They concluded that hot air heating (convection) is more suitable for heating,
since it protects the material from overheating due to variation in the pultrusion speed
caused due to gripping and releasing of the material by the pullers. For cooling systems
and fiber/matrix combinations, the highest cooling rate was achieved with water, and a
system with high specific heat capacity has lower cooling rate as in case of the system
with PP matrix as compared to poly ethylene terepthalate (PET) system. According to
them these two factors contribute to the consolidation of the material in the cooling zone.
Astrom et al [43] developed a set of models to explain the distribution of
temperature and pressure inside a carbon (C)/polyether ether ketone (PEEK)
thermoplastic composite when it is moving through the pultrusion die. In addition to this,
a model to describe the build up of pulling resistance in the pultrusion die was also
developed. The models presented in their paper relates to an idealized and steady state
pultrusion process.
The temperature model put forth by Astrom et al [43] accounts for one
dimensional heat transfer taking place in an infinite composite slab with a set boundary
temperature or heat flux from the surfaces. In developing the temperature model they
33
considered the material to be transversely isotropic in nature, and ignored the heat
transfer along the width.
Haffner et al [1] developed a three dimensional model to simulate the temperature
profile and macroscopic flow in the die for a thermoplastic composite material employing
both non Newtonian model and enthalpy model. Their study concentrated on various
process parameters using thermoplastic prepegs such as powder impregnated sheathed
yarns (glass fibers and PBT). They presented an approach focusing on the finite element
simulation of the conditions in the heated die. Their model explains the anisotropic fluid
flow and thermal properties inside the die section. In addition to this the effect of shear
thinning behavior is presented and its effect on the flow of the matrix profile is shown.
Chachad et al [9] reported three dimensional numerical investigations of the
thermochemical aspects of the design and manufacturing of a pultruded composite. They
formulated a numerical model based on the Patankar’s finite difference technique [44]
and developed a three dimensional model accounting for cure and for the anisotropic
material in the heating die. They developed temperature profiles for each of the heating
components including metal platens, heating platens, die and composite, eliminating the
need for predetermined die wall temperatures as a boundary condition.
Liu [45] described a numerical simulation of the pultrusion process using fiber-
vinyl ester composite I-beam using. The procedure is capable of predicting temperature
profiles in both the pultruded part and the pultrusion tool, as well as the curing profile in
the part under different process conditions. Liu et al [3] formulated a numerical model to
obtain temperature and curing profiles at different temperature settings and pull speeds.

34
In most studies [3, 19, 46], the conservation of energy principle is used in the
governing equation for heat transfer in the die. This is represented by:
qzTk
zyTk
yxTk
xtTc zyxp +⎟
⎠⎞
⎜⎝⎛
∂∂
∂∂+⎟⎟
⎠
⎞⎜⎜⎝
⎛∂∂
∂∂+⎟
⎠⎞
⎜⎝⎛
∂∂
∂∂=
∂∂ρ [4]
where, T is the temperature in degree Kelvin;ρ is the density of the die material; cp is the
specific heat of the tooling material; k is the thermal conductivity of the die; and q is the
rate of energy transfer at the boundary.
In pultrusion, the fibers are impregnated with the resin before entering the heated
die, so it can be assumed that the resin does not flow. The pultruded part is moving in the
pull direction at the pull speed [3, 9, 24, 45]. The energy equation for the part can be
written as
QVzTk
zyTk
yxTk
xxTu
tTc rzyxp +⎟
⎠⎞
⎜⎝⎛
∂∂
∂∂+⎟⎟
⎠
⎞⎜⎜⎝
⎛∂∂
∂∂+⎟
⎠⎞
⎜⎝⎛
∂∂
∂∂=⎟
⎠⎞
⎜⎝⎛
∂∂+
∂∂ρ [5]
where Vr is the volume fraction of resin; u is the pulling speed; ρ is the lumped
density; pc is the specific heat for the composite material; zyx kkk ,, are the lumped
thermal conductivities in x, y and z directions respectively; and Q is the rate of internal
heat generation caused by the resin reaction.
The lumped properties are evaluated by the following equations:
( ) ,1 rrfr VpV ρρ +−= [6]
( )
,1
ρρρ prrrpffr
p
cVcVc
+−=r [7]

35
( ) ⎟⎟⎠
⎞⎜⎜⎝
⎛
+−=
frrrfr
rf
kVkVkk
kρρ
ρ1
[8]
Also, for the two dimensional process where the influence of pressure on the heat
of reaction is neglected is given by the following global heat transfer model. Here the
solution is approached by using an iterative technique of two sub models.
0=∂∂−⎟⎟
⎠
⎞⎜⎜⎝
⎛∂∂
∂∂−⎟
⎠⎞
⎜⎝⎛
∂∂
∂∂−
∂∂
tmH
yTk
yxTk
xxTcu mryx
αρρ [9]
where T is the temperature of the material; k is the thermal conductivity of the material; c
is the heat capacity of the material; u is the line speed; Hr is ultimate heat of reaction; mm
is the mass fraction of matrix; α is degree of cure; and ρ is density of the material
Sunil et al. [47] investigated the cure optimization of thermoset pultrusion process
by varying preheating and cooling die temperatures to minimize overshooting of the
temperature in the heating die which could cause degradation of the material system. The
work carried out in [48-50] reported that within the heating die, the temperature of the
composite goes beyond its melting temperature, therefore degrading the composite and
affecting the desired degree of cure. Thus the maximum permissible temperature within
the composite is a limiting factor during optimization, and once the permissible
temperature is achieved, further optimization cannot be achieved without causing
degradation. This can be minimized by choosing a proper pre heat as well as cooling die
temperature for the composite.
Sunil et al [47] also employed a three dimensional finite elements/nodal control
volume approach and analyzed different cases by changing temperature of a glass/epoxy

36
system at the preheat die inlet and cooling die. The results showed that if the preheating
and cooling die temperature is carefully chosen the overshooting of the temperature can
be minimized, and the polymer prevented from degradation. They also stated that the
cooling die temperature has more influence on the curing than the preheat temperature of
the die. Sunil et al [47] showed the effect of preheat and cooling temperatures on the
material, and in the same way Michaeli et al [22] extended the work by conducting post
analysis of the material of the cooling section and suggested optimal temperature of the
material when it exits the cooling die. They stated that the material exiting the cooling
die is below its melting temperature. In this scenario there is a possibility of the material
developing tensile forces due to the action of alternating pullers. These tensile forces can
be minimized by maintaining the temperature of the pultruded part below the glass
transition temperature of the polymer.
2.8 Pulling Force Measurement
The prediction of pulling force of the material generated inside the die is of
utmost importance in designing the die as well as in determining the process conditions
[51]. The measurement of pulling force is necessary because there is resistance to the
flow of material mainly due to the frictional forces arising due to the friction between the
passing material and the die walls. To minimize these frictional forces, the inside cavity
of the die is chrome plated [13, 24]. The heated die cavity is tapered at the entrance to
facilitate the fiber supply and to build up pressure which is caused from backward resin
flow [14, 51]. This back flow of resin causes obstacle for the material to pass freely
through the die cavity and hence increases the pulling force required to pull the material.

37
Yun et al. [51] carried out an analysis to predict the pulling force during the
pultrusion of phenolic foam composites with methylene chloride (CH2Cl2) as the blowing
agent. They developed a model to explain the interaction between the pulling force and
the process variables such as die temperature, amount of blowing agent and pulling
speed. They found that the pulling force in pultrusion of foamed composites is
significantly higher than composites with no foam due to pressure exerted by expanding
bubbles. In their modeling approach to predict the pulling force, they studied the
pressure built in the die by applying an one-dimensional porous medium flow for both
tapered and flat regions of the heated die wall and this was validated using load cells.
They reported that the pulling force is generated inside the pultrusion die when the fiber
bundles pass through the tapered entrance after impregnation. This causes excess resin to
squeeze out in the opposite direction of material movement. The excess resin gets
squeezed out in the opposite direction of the pulling speed. These fiber bundles cause
resistance to flow, hence cause the pressure in the resin to increase towards the taper end,
hence increasing pulling force in this region. After passing the tapered region, the
pressure decreases due to viscous shearing of the resin along the die wall. Once the
composite is introduced into the straight section of the die after passing the tapered
region, viscous shear takes place between the die wall and the fiber bundle which causes
loss of pressure, and hence decrease in pulling force.
Srinivasagupta et al [5] reported steady state and dynamic analysis of a bench
scale injected pultrusion process using a DERAKANE 441-400 epoxy vinyl ester resin
system. The main objective of their research was to set up a cost-effective process that
helps in achieving maximum production without breaching the process parameters such

38
as the pulling speed, temperature and pressure. According to them, maintaining
temperature profiles in the die at different points guarantees melting of polymer, but
adequate impregnation and consolidation depends on the operating variables such as
polymer/fiber properties, pressure and pull speed.
They developed a pulling force model on the assumption that the resin back flow
and the viscous drag of the material on the die wall are the contributing factors for the
pulling force. In their pulling force model they divided the die into two sections i.e. the
tapered section and the heating section. According to them, the tapered section of the die
is the chief contributing factor for the force acting in the die. This force is due to the
compaction force from viscous drag of resin, the taper angle and the fiber elastic forces.
In the heating section, the primary contributing factor for the pulling force is the viscous
drag arising when a thin layer of resin is sheared between the fibers and the die wall.
Carlsson et al [4] reported that the pulling force is mainly influenced by only one
process variable i.e. pulling speed. With increase in the pulling speed higher pulling
force is achieved. Their results showed a concave upward dependency of pulling force
with variation in the pulling speed and a large standard deviation for the maximum
pulling speed of 6 mm/s. They reported that at this speed the process was interrupted for
some process variables and in these cases the pulling force constantly increased until the
fibers failed. To evaluate the pulling force at the time of failure, so that fiber failure can
be avoided, they established a mechanism that aided them in measuring pulling force.
They designed a die assembly that was free to move in the pulling direction. The die
assembly was equipped with two round headed screws at the exit. When the material was
pulled through the die assembly, the assembly moved towards a vertical lever, which was
39
hinged at one end and contacted a load cell at the other end. As the vertical lever comes
into contact with load cell, it exerts pressure on the cell, which is recorded using a data
acquisition software.
Sala et al. [23] explained that in a steady state process the resin flow inside the die
is entirely directed along the fibers and the matrix powder fills the total space between
the fibers. The resin back flows in the die due to the fiber motion in the forward
direction. This back flow is opposite to the pulling direction and also opposite to the
pressure gradient which is caused due to the tapering of the die, and also because of the
high viscosity and low velocity.
Sala et al. [23] attempted to evaluate the pressure in the die to calculate the
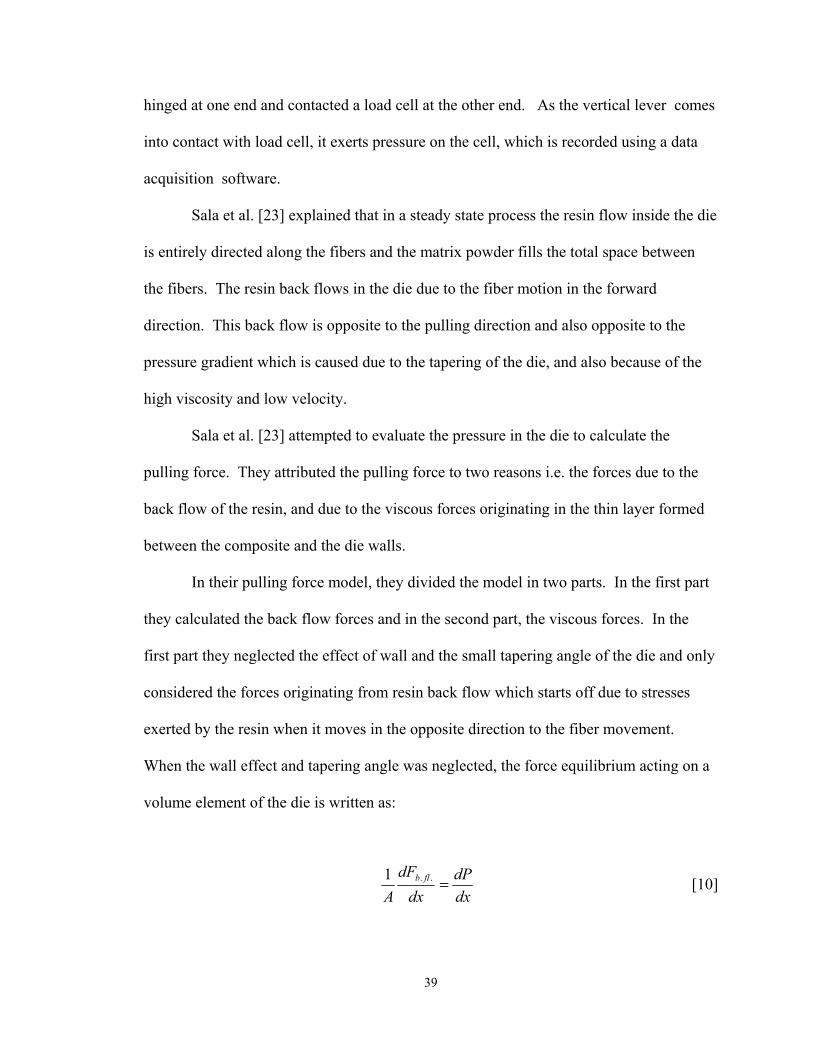
pulling force. They attributed the pulling force to two reasons i.e. the forces due to the
back flow of the resin, and due to the viscous forces originating in the thin layer formed
between the composite and the die walls.
In their pulling force model, they divided the model in two parts. In the first part
they calculated the back flow forces and in the second part, the viscous forces. In the
first part they neglected the effect of wall and the small tapering angle of the die and only
considered the forces originating from resin back flow which starts off due to stresses
exerted by the resin when it moves in the opposite direction to the fiber movement.
When the wall effect and tapering angle was neglected, the force equilibrium acting on a
volume element of the die is written as:
dxdP
dxdF
Aflb =..1 [10]

40
Therefore the back force along the length of the die is given by:
dxdxdPAF
l
flb ∫=0
.. [11]
where A is the cross sectional area of the die, Fb.fl. are the forces due to the back flow. In
the second part of model development viscous forces were measured by considering
parameters including moving velocity, thickness of the resin layer etc, since these forces
are created by shear stresses acting between the thin resin layer of the composite and die
wall moving at velocity U.
Both Newtonian and power-law models are employed to describe the resin
viscosity. In the case of the Newtonian model, the resin viscosity is given by:
dxUhbFL
vis ∫ ⎟⎠⎞
⎜⎝⎛+=
0. )(2
δη [12]
where b and h are the width and height of the composite, L the length, η is resin
viscosity, U the composite velocity and δ is thickness between thin resin layer and die
wall evaluated experimentally.
In the power law model, the equation for stress distribution is expressed as:
⎟⎟⎠
⎞⎜⎜⎝
⎛−=
rRr
dZdP
rz
2
21τ [13]
where rzτ is stress distribution in the thin layer of resin, r is fiber radius and R is external
radius of the annulus.

41
Equation 13 describes the shear stress distribution in the thin layer of resin. The
integration between R and thickness of thin layer along the die length gives the value of
pulling force required to overcome the viscous friction.

42
CHAPTER 3 OBJECTIVES
The major objectives of this research are:
(1) To develop a thermoplastic pultrusion process using commingled fibers.
(2) To study the effect of different processing variables in thermoplastic pultrusion.
(3) To evaluate mechanical and physical properties of pultruded thermoplastic
composite and compare them with relevant published work.
(4) To develop a finite element analysis model to describe the heat transfer of the
composite material in the die.

43
CHAPTER 4 MATERIALS AND METHODS
4.1 Material
Glass/PP Twintex® [6] RPP75, shown in Fig. 17 was used in the present work.
The Twintex® material was provided by Saint-Gobain Vetrotex. Vetrotex has patented
the procedure of manufacturing commingled tows with a uniform distribution of glass
and PP fiber bundles, with different glass fiber volume fractions. The commingled tows
manufactured by Vetrotex [7], under the trade name Twintex® [6] comprise 25% matrix
and 75% glass by weight (48% by volume). The diameters of PP and glass fibers are 14
and 20 μm respectively [7]. The PP matrix has a melting temperature, Tm, of around 165
°C (329°F). Twintex® provides many advantages including excellent fatigue, stiffness
and temperature resistance comparable to long fiber thermoplastics, aluminum and/or
steel.

44
Figure 17. RPP75 commingled tows provided by Vetrotex [7]
Figure 18. Set up of thermoplastic pultrusion line

45
4.2 Experimental Method
The experimental set of thermoplastic pultrusion process used in the present
research is shown in Fig. 18. The material was fed to the preheater through four separate
square slots of approximately 1 cm2 each. These slots provide some level of pre-tension
to the tows as they are fed into the pre heater, in order to minimize their tangling and
sagging. The slots help in maintaining constant thickness of the resulting composite.
The number of tows varied between 80 to 90 counts. The commingled tows were guided
and pulled through the preheating chamber with the help of a pneumatic pulling device
placed at the end of the pultrusion line at a speed varying from 0.38 m/min to 1.4 m/min.
The pre heater was maintained at 149 °C (300ºF) which was slightly lower than
the melting temperature of the polymer (165 °C) to avoid dripping of the polymer while it
entered into the heating die. After preheating, the commingled tows were automatically
pulled through the heated die. The PP melted in the heated die causing its flow and
impregnation of the glass fibers. The die temperature ranged from 177 °C to 220 °C (350
ºF to 429 ºF) to evaluate an optimum processing window for pultrusion, such that the
material would not decompose, and at the same time melting is achieved. The optimum
temperature window was established between 199 °C to 216 °C (390 ºF to 420 ºF). The
temperature of the die was controlled by a thermocouple placed near the die cavity. To
avoid heat loss and maintain constant temperature, the heating die was insulated with
refractory material. Once the material passed through the heating die, it entered the
cooling die for consolidation. Heat was extracted from the material instantaneously by
chillers containing anti - freeze liquid circulating through the pipes in the chiller.

46
The effect of processing variables and their interrelationships were investigated.
The parameters investigated were:
1. Effect of die temperature on pulling force
In these experiments, the pulling force was measured for a die temperature of 199,
204, 210 and 216 °C (390, 400, 410 and 420 ºF). The line speed was kept constant at
0.38 m/min.
2. Effect of die temperature on line speed
In these experiments, the die temperature was varied as 199, 204, 210 and 216 °C
(390, 400, 410 and 420 ºF) and variations in the line speed were measured manually
using a measuring tape after 1 min travel. In this manner three readings were taken and
averaged. The initial line speed was maintained at 0.38 m/min for a temperature of 199
°C (390 ºF) and then the change in line speed was measured as temperature increased.
3. Effect of number of tows on pulling force
In this experiment pulling force was measured with respect to the increased
number of tows from 80 to 90. Here, the pulling speed and die temperature were kept
constant at 0.38 m/min and 204 ºC (400 ºF) respectively.
4. Effect of line speed on pulling force

47
In this experiment the pulling force was measured by varying the line speed. The
line speeds were 0.38, 0.58 and 0.77 m/min. The die temperature was kept constant at
204 ºC (400 ºF).
4.3 Pulling force measurement
The pultrusion line is equipped with a pulling mechanism that consists of two
pairs of polyurethane coated metal plates. In each pair, the plates are driven by a variable
speed DC motor through a pneumatic transmission. The machine has been designed for a
maximum pulling force of 2000N and a maximum linear speed of 1.7 m/s. To enable
measurement of the pulling force, a floating die mechanism was adapted from Carlsson et
al [4] as illustrated in Fig. 19.
Figure 19. Floating die mechanism for measuring force
P
Tool
Pultruded bar
Fixed FrameLoad cells x 2
Self centered
Floating frame
Rovings

48
The floating die assembly mounted on a rectangular bar is free to move in the
pulling direction. The other rectangular frame is fixed to which two load cells are
attached on either side of the tool. When the pullers pull the material, the floating die
moves in the pulling direction until it comes into contact with the load cells and stops.
This exerts pressure on the load cells whose readings are acquired using Personal
DaqViewXL software. The load cells used have sensitivity of 2mV/V and supply voltage
of 10V DC.
4.4 Mechanical Testing
Flexural testing was carried out in accordance with ASTM D 790M [26]. The
flexural tests were conducted to evaluate mechanical properties of the pultruded part with
respect to varying die temperature, line speed and number of tows. The flexural
properties were determined by performing a three point bending test. The test was
performed on 4 samples of each varying parameter and an average was taken of the four
flexural strength values in order to eliminate any error and to make sure the readings are
correct. The span length used was 75 mm, and the loading rate was 2 mm/min. The test
specimens used were 95 mm long 22.75 mm wide and on average 4.5 mm thick.
4.5 Microscopy and Void Content Measurement
Digital microscopic analysis was performed to evaluate the void content in the
pultruded part. Microscopy was performed along the transverse cross section of the
composite manufactured using different number of tows.
The percentage of void content was measured using a point fraction method. The
test method is based on stereologic principle in which a 9 point grid over a two

49
dimensional microstructure was placed. Six different placements of the grid on different
fields of microstructure were made. Mean and standard deviation of the measurement
series was computed. The confidence interval was compared and the results were
obtained using a point fraction formula.
4.6 FEM Modeling
Thermal analysis was carried out using a computational scheme to simulate the
pultrusion process by implementing suitable boundary conditions. Considering heat
transfer from upper and lower platens of the die, convective heat transfer as boundary
condition was assumed. The cooling die and composite anisotropy was also taken into
account. The model was build using Pro/Engineer Wildifire 3.0 software and was
imported to the ANSYS 10.0 software for finite element analysis.

50
CHAPTER 5 RESULTS AND DISCUSSIONS
5.1 Objective # 1. To develop a thermoplastic pultrusion process using commingled
fibers.
The goal of this component was to develop a thermoplastic pultrusion process by
using commingled fibers to understand the effectiveness of fiber wetting and
consolidation.
Section 2 outlined a typical experimental set up for a pultrusion process. The
pultrusion line at UAB was developed along similar lines and Fig. 1 provides a schematic
of the components of the pultrusion line. The experiments in the present work were
carried out with respect to the following processing variables, namely (a) die temperature
(b) line speed (c) number of tows and (d) pulling force.
In the present experimental study, the commingled tows were guided into the
preheating chamber at a line speed varying from 0.38 – 1.38 in/min, where they were
heated near the melt temperature of 149 ºC (300 ºF) in order to facilitate fast processing.
The numbers of tows were varied from 80 to 90 and were pulled through an electrically
heated die with the help of a pulling device placed at the end of the pultrusion line. In the
heating die, the material was heated above its melting point between the processing
temperature of 199 - 216 ºC (390 - 420 ºF) [25] where the PP melted and impregnated the
glass fibers, before being consolidated in the cooling die.

51
Figure 20. Processing cycle for thermoplastic PP/glass fibers
Figure 20 shows the processing cycle for thermoplastic PP/glass commingled
fibers. The figure shows that the temperature increases in the preheating zone with
increasing time and reaches the melting point of PP, while the pressure remains constant.
In the impregnation zone as the temperature reaches the melt temperature, the pressure
increases up to certain point along the length of the heating die and remains constant
thereafter. The material enters the cooling die; its temperature decreases gradually with
time but the pressure remains the same as is in heating die. The pressure decreases
rapidly as it nears the exit of the die, hence cooling and consolidating material.
The heating and cooling die used in the experiment is made from tool steel having
highly polished cavities. The die cavities are chrome plated in order to reduce friction
between the moving material and the cavity walls. Three cartridge heaters are inserted
into the die ensuring heating of the material and one thermocouple is placed close to the
Preheating Melting and Impregnation
T\ = 199 – 216 ºC
Tm = 149ºC
Consolidation
Te
mpe
ratu
re
Pr
essu
re
Time

52
die cavity to monitor the temperature. The cooling die is attached separately to the
heating die and is perfectly assembled using four steel strips placed at top and bottom of
the dies holding them together, ensuring alignment. The cooling die could be detached
from the heating die to permit a change in length of the constant cross section of the die.
The dimensions of the heating die measures 101.6 x 25.4 x 324 mm and the cooling die
measures 101.6 x 25.4 x 324 mm respectively. The cavity of the cooled die has a
constant cross section of 4.5 x 22.75 mm. The cooling die is cooled by chillers made
from aluminum alloy.
5.2 Objective # 2. To study the effect of different processing variables in thermoplastic pultrusion.
The second objective of the research was to study the processing variables with
respect to each other. The processing variables play an important role in the outcome of
the product and optimizing these is critical.
The interdependency of the variables which result in optimizing the process are:
1. Effect of die temperature on pulling force: It is necessary to study the pulling
force with respect to the die temperature. The pulling force-temperature
relationship is necessary to establish the optimum pressure inside the die, which
aids in proper wetting and impregnation of the fibers.
2. Effect of die temperature on line speed: It is necessary to study the
interdependency of die temperature on line speed because optimum line speed
must be maintained during the process to properly consolidate the material, and

53
also avoid burning of polymer if the line speed happens to slow down with
decrease in temperature.
3. Effect of number of tows on pulling force: This interdependency establishes the
limits of the die geometry and material strength. High pulling force causes high
pressure to build up in the die slot with increased material flow. The die slot area
limited to certain square inches, offers high resistance resulting in snapping of the
material. Material breakage causes discontinuity in the process, which is not
desirable in a manufacturing scenario.
4. Effect of line speed on pulling force: This is necessary to maintain a line speed so
that the pulling force does not increase to an undesirable value whereby material
breakage inside the die can occur, and bring the process to a halt.
5.2.1 Effect of die temperature on pulling force
Effect of die temperature on pulling force was studied by varying temperature
between 199 ºC to 216 ºC (390 ºF to 420 ºF) and keeping number of tows and line speed
constant. In this case 90 tows were used and line speed was kept at 0.38 m/min. Figure
21 illustrates that the pulling force increased gradually and then gradually decreased with
increase in die temperature over a range of 199 ºC to 216 ºC (390 ºF to 420 ºF). It can be
seen that the pulling force tends to increase between 199 ºC to 216 ºC (390 ºF to 420 ºF).
In this temperature range the material is not yet in a flow state and has maximum density
because the voids are less, and hence requires high force for pulling. Eventually, the
material melts and tends to flow back towards the entrance inducing resistance to the
material pull resulting in increased pulling force. Once this condition is overcome by
increasing the temperature beyond 204 ºC (400 ºF), the material reaches an easy flow

54
state, the resin viscosity starts lowering initiating free resin flow in the die and providing
less resistance to the pulling of material which results in decreased pulling force [24].
Also, with the increase in temperature, pulling forces becomes less dominant as the resin
starts to flow freely and also there is no limitation on the polymerization rate [24], and
the line is only limited by frictional forces. The major contribution to the pull force is the
viscous drag arising when a thin layer of polymer is sheared between the fibers and the
die wall. With increase in temperature, the viscous drag with the wall decreases, hence
decreasing the pulling force [5]. This is in agreement with the study conducted by Sala et
al [23].
1340
1360
1380
1400
1420
1440
1460
1480
1500
196 198 200 202 204 206 208 210 212 214 216 218
Temperature (degree C)
Forc
e (N
)
Figure 21. Effect of die temperature on pulling force for commingled PP/glass fiber composite

55
5.2.2 Effect of die temperature on line speed
This study was carried out by changing die temperature and keeping number of
tows constant i.e. 90 in this case. For the die temperature of 199, 204, 210 and 216 ºC
(390, 400, 410 and 420 ºF) for the 90 tow configuration, the values of line speed obtained
were 0.381, 0.386, 0.441 and 0.456 m/min respectively. This suggests that the line speed
increases as the die temperature increases, which is illustrated in Fig. 22. At low
temperatures, the polymer viscosity is high compared to that at higher temperatures. At
low temperature there is increased resistance within the die for material flow, while the
material flows readily at higher temperatures [6, 11]. This suggests that the effect of
temperature on resin viscosity overcomes the effect of polymerization due to decrease in
viscosity in the impregnation zone, hence increasing the line speed. At low temperatures
the line speed is limited by the polymerization time, hence at low temperatures, line
speed is low [24]. This data is comparable to the study conducted by Luisier et al [24] in
which they defined processing in terms of pultrusion line speed and die temperature.

56
0.37
0.38
0.39
0.4
0.41
0.42
0.43
0.44
0.45
0.46
196 198 200 202 204 206 208 210 212 214 216 218
Temperature (degree C)
Line
spe
ed (m
/min
)
Figure 22. Effect of die temperature on line speed for commingled PP/ glass fiber composite
5.2.3 Effect of number of tows on pulling force
The effect of number of tows on pulling force was evaluated for 80, 85 and 90
tows respectively. During this study, die temperature and line speed were maintained
constant. The die temperature and line speed were maintained at 204 ºC (400 ºF) and
0.38 m/min respectively. From Fig. 23, it can be seen that the pulling force increases
with an increase in the number of tows. With increase in number of tows, resistance to
pulling increases as the die fills out. The density of the material increases since the
compaction pressure increases with each tow resulting in filling of the gaps between the
tows. The other reason for the increased pulling force is the resin back flow which resists
the further movement of the material through the die. This resin back flow is increased
with gradual increase in the number of tows fed to the die. With gradual increase in the
number of tows, the resin back flow increases and the pulling mechanism needs to

57
generate more power to overcome this resin back flow pressure. This increases the
pulling force. Higher pulling force is required to overcome the resin back flow so that
the material can move in the pulling direction. However, preliminary data shows that the
pulling force is similar for 85 and 90 tows. With 85 tows the back flow of the resin is
higher due to increased heat transfer through the fiber bed because less dense material
passes through the die. However in case of 90 tows, the density of the material inside the
die is higher. Hence, the heat flow in the material near the die walls is lesser. This
causes less resin back flow as compared to the 85 tows and the pulling force is limited by
increased frictional resistance between the material and the die wall. It might appears
that the pulling force reaches a limiting value for 85 to 90 tows and they exhibit similar
pulling force.
540
560
580
600
620
640
660
78 80 82 84 86 88 90 92
Number of tows
Forc
e (N
)
Figure 23. Effect of number of tows on pulling force for commingled PP/ glass fiber
composite

58
5.2.4 Effect of line speed on pulling force
The study of effect of line speed on pulling force was carried out by keeping die
temperature and number of tows constant. For this study, die temperature was
maintained at 204 ºC (400 ºF) and the number of tows used were 90. Figure 24 shows
that the pulling force increases with the line speed. Line speed was varied as 0.381,
0.584, 0.774 m/min which resulted in a pulling force of 779.48, 827.23, 941.93 N
respectively. With the increase in line speed, shear stresses acting in the thin layer
between the material flowing through the die cavity and the die wall generates viscous
forces. These viscous forces act in the direction opposite to the pulling direction, hence
providing obstacle for material flow. This gives rise to the increased pulling force
because the obstacle to pull the material forward in the pulling direction has to be
overcome. Hence with increase in line speed, the pulling force is increased. This data
agrees with the study conducted by Sala et al [23]. With increase in line speed, the
frictional forces between the material and die wall increase, which resists flow of material
through the die [24]. The back flow increases, resulting in pressure increase inside the
die.

59
700
750
800
850
900
950
1000
0.2 0.3 0.4 0.5 0.6 0.7 0.8 0.9
Line speed (m/min)
Forc
e (N
)
Figure 24. Effect of line speed on pulling force for commingled PP/ glass fiber composite
5.3 Objective # 3. To evaluate mechanical and physical properties of pultruded thermoplastic composite and compare them with relevant published work.
Flexural testing was carried out in accordance with ASTM D 790M [25].
The flexural tests were conducted to evaluate mechanical properties of the pultruded part.
The flexural properties were determined by performing a three point bending test. The
span length used was 75 mm, and the loading rate was 2 mm/min. The test specimens
were 95 mm long 22.75 mm wide and on average 4.5 mm thick.
5.3.1 Effect of line speed on flexural strength
Figures 25 and 26 illustrate the effect of line speed on flexural strength and
modulus for 90 tows. Figure 8 shows that the flexural strength reduced by 57 % as a
function of increase in line speed from 0.38 to 1.38 m/min. This is attributed to the
reduction in consolidation time and an increase in void content due to improper

60
impregnation at higher line speeds. At higher line speeds the tows do not attain heat fully
at the center of the composite, which results in insufficient melting of the polymer at the
center, hence resulting in decreased impregnation time. This causes improper fiber wet-
out resulting in void formation affecting mechanical properties adversely. The study
conducted by Miller et al [11] shows a similar trend for commingled fibers.
89.96
192.14
210.59
0
50
100
150
200
250
300
0 0.2 0.4 0.6 0.8 1 1.2 1.4 1.6
Line speed (m/min)
Flex
ural
Stre
ngth
(MPa
)
Figure 25. Effect of line speed on flexural strength for commingled PP/ glass fiber composite

61
0
50
100
150
200
250
0 0.005 0.01 0.015 0.02 0.025 0.03 0.035 0.04
Strain
Stre
ss (M
Pa)
Figure 26. Flexural stress versus strain curve showing maximum modulus at minimum line speed 0.38 m/min
5.3.2 Effect of die temperature on flexural strength
The effect of die temperature on flexural strength was studied for temperatures of
199, 204, 210 and 216 ºC (390, 400, 410 and 420 ºF) respectively, by using 90 tows in
each scenario. The results show the flexural strength varying from 200 to 230 MPa for
the above temperatures. A maximum value of flexural strength is attained for material
processed at a temperature of 204 and 216 ºC (400 and 420 ºF). Considering that the
material is in a non-flow state till 204 ºC (400 ºF), the result is valid because the density
of the material is high due to fewer voids in the composite. The material shows decrease
in flexural strength at 210 ºC (410 ºF). At this temperature the molten resin is in its initial
flow state or not dispersed uniformly in the reinforcing fibers leading to fiber
agglomeration and formation of voids causing deterioration of flexural properties. When
temperature increased to 216 ºC (420 ºF) the flexural strength showed the highest value .
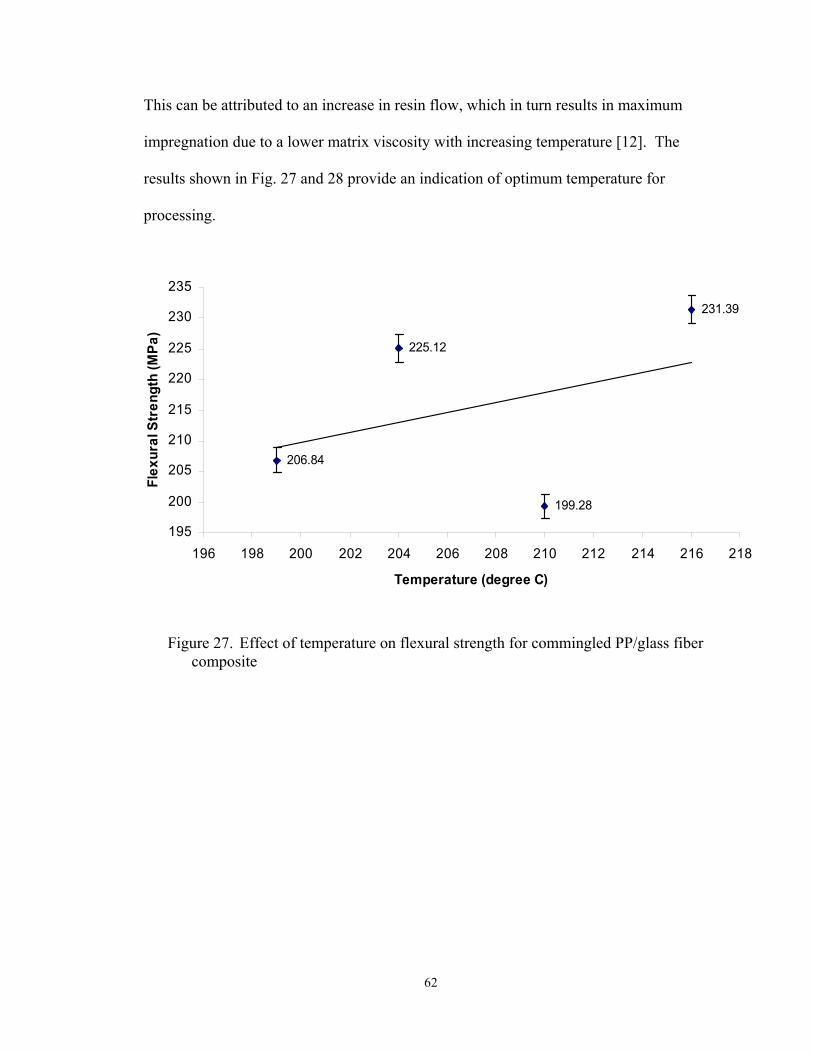
62
This can be attributed to an increase in resin flow, which in turn results in maximum
impregnation due to a lower matrix viscosity with increasing temperature [12]. The
results shown in Fig. 27 and 28 provide an indication of optimum temperature for
processing.
206.84
225.12
199.28
231.39
195
200
205
210
215
220
225
230
235
196 198 200 202 204 206 208 210 212 214 216 218
Temperature (degree C)
Flex
ural
Str
engt
h (M
Pa)
Figure 27. Effect of temperature on flexural strength for commingled PP/glass fiber composite

63
Figure 28. Effect of temperature on flexural modulus
5.3.3 Effect of number of tows on flexural strength
Figures 29 and 30 illustrate the effects of number of tows (80, 85 and 90
respectively) on flexural strength and flexural modulus respectively, with die temperature
and line speed being constant at 204 ºC (400 ºF) and 0.38 m/min respectively. The
flexural strength is observed to increase with increasing number of tows as illustrated in
Fig. 29 and it increases by 17% when increased from 80 to 90 tows. This is attributed to
an increase in volume fraction of the fibers. As the fibers are the primary load bearing
0
50
100
150
200
250
300
0 0.005 0.01 0.015 0.02 0.025
Strain
Stre
ss (M
Pa) 390 degree F
400 degree F410 degree F420 degree F
199 degree C
204 degree C
210 degree C
216 degree C
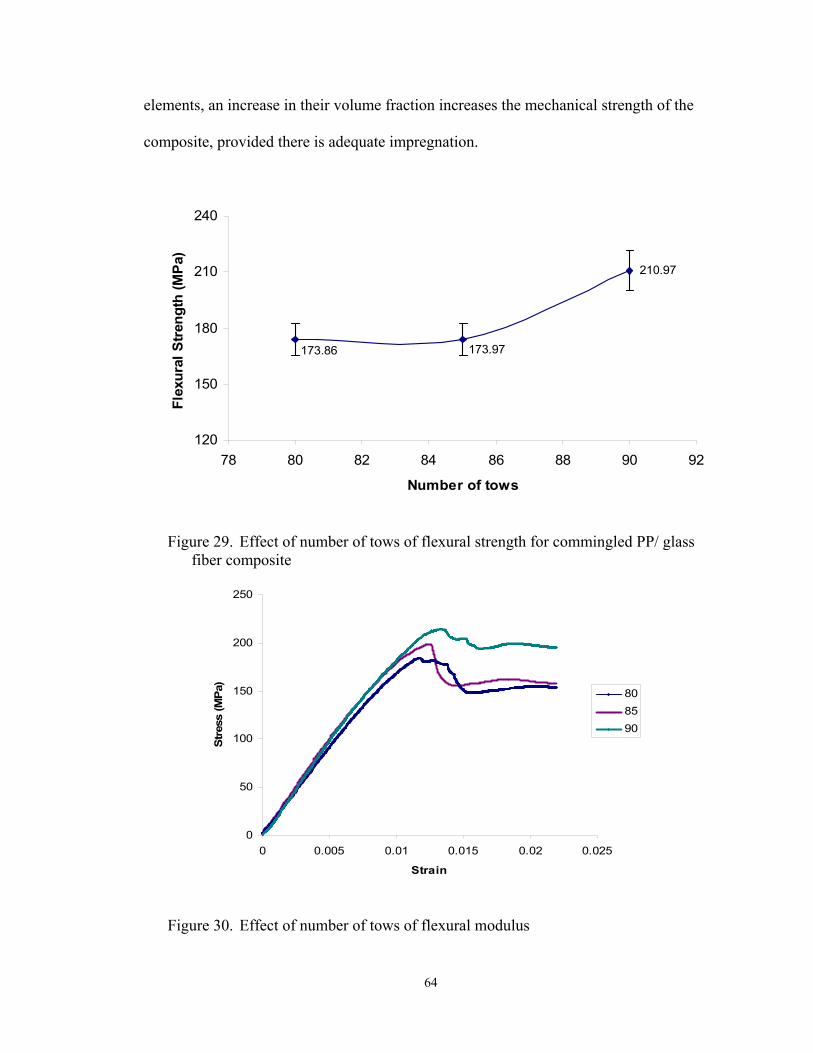
64
elements, an increase in their volume fraction increases the mechanical strength of the
composite, provided there is adequate impregnation.
210.97
173.97173.86
120
150
180
210
240
78 80 82 84 86 88 90 92
Number of tows
Flex
ural
Stre
ngth
(MPa
)
Figure 29. Effect of number of tows of flexural strength for commingled PP/ glass fiber composite
0
50
100
150
200
250
0 0.005 0.01 0.015 0.02 0.025
Strain
Stre
ss (M
Pa)
808590
Figure 30. Effect of number of tows of flexural modulus

65
5.3.4 Microstructural analysis
Figure 31 shows typical microphotographs of the cross section of pultruded
glass/PP bars for 80, 85 and 90 tows respectively. The effect of fiber agglomeration on
the impregnation state was evaluated. As seen from the figure, there are several voids
due to incomplete impregnation. As the number of tows are increased from 80 to 90
counts, the void content reduces. This is because the increase in number of tows fills the
free spaces in the mold. This leads to increase in compaction pressure required for
impregnation, and allows resin to flow readily that enables increased wet-out of the tows.
A study conducted by Kim et al [14] shows similar trends of impregnation on pultruded
composites manufactured using commingled tows. According to their study, the fiber
agglomeration size is the most important parameter in enhancing the degree of
impregnation. Smaller agglomerates enable faster processing with proper impregnation,
because they induce high pressure. The taper geometry also affects degree of
impregnation. In general, it has been found that a smaller taper angle and a longer taper
zone, the part attains better impregnation. The other reason for improper impregnation is
the resin back flow from the die which causes void formation due to lack of sufficient
resin to wet the fibers [5].
Since the main problem with a thermoplastic matrix is the difficulty of
impregnation due to its high viscosity, it becomes imperative to study wetting of the
fibers by measuring void volume fraction. The void volume fraction is given by [5, 26]:
1=++ Vmf VVV [7]

66
where, Vf is the fiber volume fraction; Vm is the matrix volume fraction; and Vv is the
void volume fraction.
(a) (b) (c)
Figure 31. Microphotographs of impregnated pultruded product using RPP75 (a) with 80 number of tows (b) with 85 number of tows (c) with 90 number of tows
The volume void fraction was calculated using a point fraction method as
described in Chapter 3. The point fraction method provides a range of percentage of
voids in the microstructure and gives information about the degree of impregnation.
With increase in number of tows from 80 to 90, the void content decreased from 54% to
21% for the upper limit, and 24% to 12% for the lower limit as listed in Table 1.
The void results indicate that additional tows pulled through the die may further
reduce the air pockets; and hence voids in the composite. However, the present process
offers limitations in terms of die geometry. A tapered die enables packing of additional
tows to minimize void content.
The density for the pultruded profile made from 80, 85 and 90 tows respectively
was calculated to estimate the void content in the composite. The samples used for this
were 95 mm long 22.75 mm wide and on average 4.5 mm thick.

67
The density values as stated in Table 2 show that there is increase in density as the
number of tows are increased from 80 to 90. When the density of the composite made of
80 tows was compared to the density of composite made of 90 tows, it was found that
there is increase in the density of 90 tows by 10.23 %. This increase in the density can be
attributed to the decrease in void content due to increased packing factor of the material
inside the die. This is also clear from the microphotographs shown in Fig. 31 and void
content results stated in Table 1.
Table 1. Void fraction values
Quantities 80 85 90
Mean, X 3.6 2.5 1.5
Standard Deviation, S 1.63 1.04 0.54
Standard Error, S.E 0.66 0.42 0.22
95% C.I of P.F 3.6 ± 1.32 2.5 ± 0.84 1.5 ± 0.44
95% C.I for void fraction 0.25 – 0.54 0.18 – 0.36 0.11 – 0.21
% Void volume fraction 25 – 54 18 – 36 11 – 21
Table 2. Density Measurement
Number of tows Weight
(gm)
Volume
(mm3)
Density
(g/mm3)
80 10.98 9725.6 0.001128

68
Number of tows Weight
(gm)
Volume
(mm3)
Density
(g/mm3)
85 11.56 9725.6 0.001188
90 12.20 9725.6 0.001254
5.4 Objective # 4. To develop finite element analysis model to describe the heat transfer of the material in the die.
Computer modeling was carried out for evaluating the one dimensional
temperature distribution and to validate the experimental process by comparing the
output temperature of the composite. This also provides an insight to the optimum
processing window in terms of temperature.
The modeling work for commingled fibers reported in many papers [6, 9, 27, and
28] has emphasized on the numerical modeling pertaining to impregnation and
consolidation of the material. There is not much focus in the heat transfer modeling of
commingled fibers using FEM. Several modeling studies of pultruded profiles have
focused on thermoset resins, but not much work has been done using thermoplastic
resins, particularly commingled fibers [33, 34, 38, 39].
In this study, three dimensional FEM based steady state heat transfer modeling
using ANSYS 10.0 has been conducted. This model helped in predicting the temperature
profiles of various zones of the die and the final pultruded part.
The geometry of the die is constructed using Pro/Engineer Wildfire 3.0. The solid
model is imported to ANSYS 10.0 for further analysis. The dimension of the heating die
measures 101.6 x 25.4 x 324 mm and of the cooling die measures 101.6 x 25.4 x 171.5

69
mm and both dies are fastened together by four metal strips. The die is equipped with
two rectangular slots for material passage having a width of 23 mm and thickness of 4.5
mm approximately which runs throughout the length of the die on either side of the
center line of the die. The die also shows four rounded slots for the heaters of diameter
6.35 mm and length of 76.2 mm as shown in Fig. 32. During the experimental study the
die was equipped with a graphite gasket between the upper and lower die which was
approximately 1 mm thick in order to eliminate any pressure loss and to avoid material
squeezing out from the side walls of the die. However, the model does not take the
gasket into account. The die was considered as whole (perfect seal) since it was assumed
that the gasket does not have much influence on the resulting product.
Figure 32. Finite element model of the die

70
The die is assigned with properties of thermal conductivity of 25.57 W/m-k
(177.3 BTU-in/hr-ft2-ºF), density of 7750.37 Kg/m3 (0.280 lb/in3) and specific heat of
461.8 J/kg-k (0.1103 BTU/lb ºF). The material is assigned a thermal conductivity of
0.346 W/m-k (2.4 BTU-in/hr-ft2-ºF) and density of 1107.19 Kg/m3 (0.04 lb/in3) [52].
A fine mesh was adopted comprising 240373 nodes and 92330 elements as shown
in Fig. 33. The heating die was meshed considering SOLID 87 elements. The SOLID 87
is a 10 noded element and rounded edges and curved geometry can be accounted for in
the model. The cooling die and the material are meshed using SOLID 90 elements. The
SOLID 90 element is a 20 noded element with mid edge node. It has 3-D thermal
conduction capability and provides compatible temperature shapes that are well suited to
model curved boundaries. For simulating contact surfaces between the material and die
walls, an 8 noded CONTA 175 element has been used.
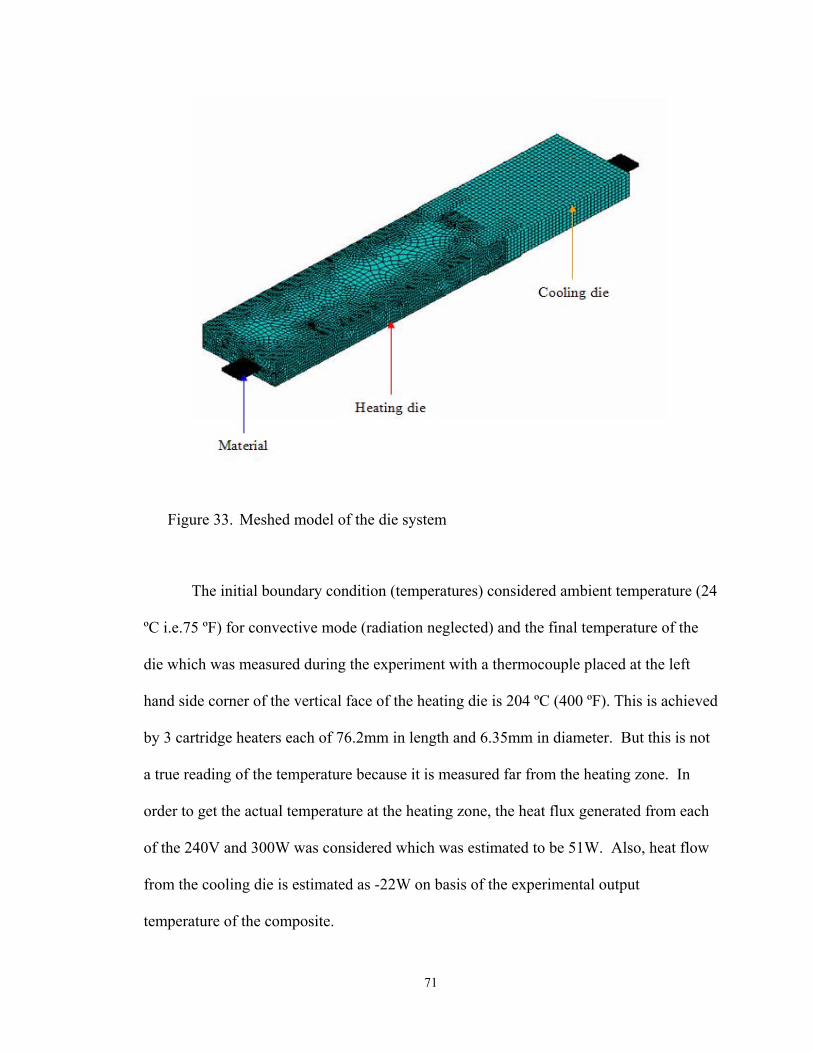
71
Figure 33. Meshed model of the die system
The initial boundary condition (temperatures) considered ambient temperature (24
ºC i.e.75 ºF) for convective mode (radiation neglected) and the final temperature of the
die which was measured during the experiment with a thermocouple placed at the left
hand side corner of the vertical face of the heating die is 204 ºC (400 ºF). This is achieved
by 3 cartridge heaters each of 76.2mm in length and 6.35mm in diameter. But this is not
a true reading of the temperature because it is measured far from the heating zone. In
order to get the actual temperature at the heating zone, the heat flux generated from each
of the 240V and 300W was considered which was estimated to be 51W. Also, heat flow
from the cooling die is estimated as -22W on basis of the experimental output
temperature of the composite.

72
The initial boundary condition for the material is taken to be 149 ºC (300 ºF)
because the material is preheating, and enters directly into the die through preheater.
Figure 34 shows heat distribution along the length of the die. The analysis shows
that the actual temperature at the entrance is 212 ºC (414 ºF) as compared to the set
temperature of 204 ºF (400 ºF) measured at left vertical face of the die. Hence, it can be
ascertained that the actual processing has been occurred at 212 ºC (414 ºF). So the actual
length of heating zone temperature of 212 ºC (414 ºF) through which the material passes
is only 81mm for a period of 12 s with a line speed of 0.38 m/min. This suggests that the
material spends less time in the actual processing zone temperature. After it enters the
temperature zone which is below the minimum temperature required for processing
which is 199 ºC (390 ºF) and continues to travel till it reaches cooling zone.
The longitudinal core section of the composite is as shown in Fig. 35. Figure 35
shows that the material when traveling through different sections of the die is conducting
heat adequately through its core. However, the actual problem lies in the heat loss
through the die which is unable to maintain the required processing temperature through
its length. The die could maintain the processing temperature up to 1/4th of its length.
For adequate melt and impregnation, the processing zone has to be at least 3/4th of the die
length, which is not the case. So the material when enters the die melts, but fails to
impregnate properly throughout the length of the die hence creating voids in the core.

73
Figure 34. Heat transfer distribution through the die

74
Figure 35. Longitudinal section of the die through the material
Figure 36 shows the distribution of heat along the length of the material. It shows
the material entering the die at 168 ºC (335 ºF), while the preheating temperature was 149
ºC (300 ºF). This increase in the material temperature before entering the die may be due
to the reverse heat transfer taking place from heating die to the material as is seen in Fig.
34 thereby increasing the temperature of the material. The output temperature of the
composite is 14 ºC (58 ºF) as compared to the experimental temperature range of 15 ºC to
23 ºC (59 ºF to 73 ºF).
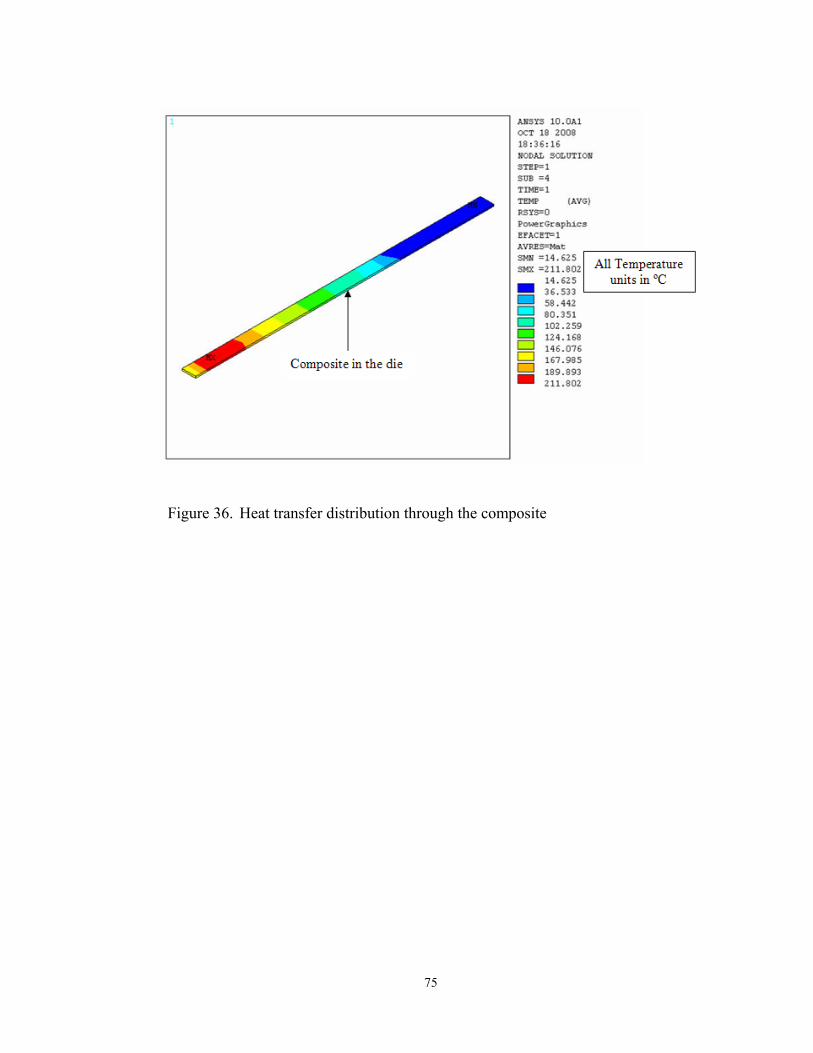
75
Figure 36. Heat transfer distribution through the composite

76
CHAPTER 6 SUMMARY
1. The present research on thermoplastic pultrusion has focused on finding major
processing parameters and appropriate process windows for PP/glass
thermoplastic commingled fibers.
2. The effect of line speed on flexural strength and modulus accounted for 57%
reduction with increased line speed from 0.38 to 1.38 m/min. However, to
achieve high flexural strength the speed has to be maintained at 0.38 m/min,
which is too slow for commercial manufacturing.
3. The process parameter relationship was studied to understand the interdependency
of variables on each other. Effect on pulling force was studied by varying die
temperature, pulling speed and number of tows respectively. It was found out that
the pulling force increased with increase in line speed and number of tows and
decreased with increase in temperature. With increase in line speed from 0.381 to
0.774 m/min pulling force increased from 779.48N to 941.93N. It shows that
there is increase of 18% which is attributed to increase in frictional forces
between die wall and material. With increase in number of tows from 80 to 90,
the pulling force increased due to increase in compaction pressure with each
introducing tow resulting in filling the gaps. When temperature was increased
from 199 to 216 ºC (390 to 420 ºF), the pulling force increased between 199 to
216 ºC (390 to 400 ºF) and then decreased. This is attributed to the maximum

77
density of the material in the heating zone in the undecomposed state, before
reaching 216 ºC (420 ºF). It was found out that the line speed increased from
0.381 to 0.456 m/min with increase in temperature from 199 to 216 ºC (390 to
420 ºF) because of the high viscosity of the polymer at low temperature, as
compared to high temperature.
4. A 13% increase in flexural properties between the lower and upper limits of the
temperatures, with regard to the die temperature.
5. When the number of tows increased from 80 to 90, the flexural strength increases
by 17%. The increase in fiber content contributes effectively in increasing
mechanical properties.
6. Three dimensional FEM modeling has been carried out to predict the melting and
impregnation of the fibers simulating heat distribution along the length of the die
and composite. It simulates temperature distribution along the length of the die
and composite as it travels through the pultrusion line. The model takes into
account the prescribed boundary conditions. The model helped in analyzing
temperature distributions and illustrates how the composite temperature varies at
any location in the die.
7. Very little efforts have been made in designing the die. By optimizing the die that
higher pulling speeds and packing of more tows could be possible. The present
die has limitations in terms of higher pulling speeds, and fractures the material if
the pulling speed is increased beyond 1.38 m/min.

78
CHAPTER 7 CONCLUSIONS
1. The pultrusion process for RPP75 PP/glass commingled fibers was successfully
optimized.
2. Die design was not modified, but with a modified design, higher speeds can be
obtained. Modifications can be made at the taper entrance and along the taper
length. Smaller taper entrance and longer taper length could bring about
improved impregnation. On the other hand, it may obstruct feeding of the
material as it will create high shear rate flow in the direction opposite to pulling.
3. The presence of void content can be linked to lack of proper impregnation due to
fiber agglomeration size. RPP60 provides better impregnation and ease of
processing due to small agglomeration size as compared to RPP75. In addition to
voids, sloughing is often observed.
4. Changes in flexural strength values show that the flexural properties are very
susceptible to variations in the process parameters within the investigated ranges.
A suitable combination of all these process parameters can provide a desirable
result.
5. The comparison between the experimental work and simulation shows that the
process shows similar output temperature that of the part. Hence, it can be
concluded that the FEM modeling achieved a reliable quantitative estimate of
temperature distribution in both the die and the pultruded part.

79
6. The FEM modeling can be of use to minimize experiments, thus saving time and
money while optimizing the thermoplastic pultrusion process for ultimate
performance. It could be helpful in providing essential information on tooling
and process design for the pultrusion.
7. The FEM modeling could be further used for investigating the transient phase,
which will be helpful in studying variable void content during manufacturing.

80
LIST OF REFERENCES
1. S.M. Haffner, K. Friedrich, P.J. Hogg, Finite element assisted modelling of a thermoplastic pultrusion process for impregnated yarn, Composites Science and Technology 58 1998 1371-1380.
2. J. Mackerle, FEA and simulations of manufacturing processes of composites and their mechanical properties, Computational Materials Science 31 2004 187-219.
3. X.L. Liu, W. Hillier, Heat transfer and cure analysis for the pultrusion of a fiber glass vinyl ester I beam, Composite Structures 47 1999 581-588.
4. A. Carlsson and B. Tomas Astrom, Experimental investigation of pultrusion of glass fiber reinforced polypropylene composites, Composites: Part A 29A 1998 585-593.
5. D. Srinivasagupta, S. Potaraju, J. Kardos, B. Joseph, Steady state and dynamic analysis of a bench scale injected pultrusion process, Composites: Part A 34 2003 835-846.
6. S.R. Iyer, L.T. Drzal, Manufacture of powder impregnated thermoplastic composites, Journal of Thermoplastic Composite Materials 3 1990 325-255.
7. A. Pantaleao, C. DeAndrade and E. Zaparoli, The effect of Anisotropic thermal conductivity of the pultrusion process simulation, Int. Comm, Heat mass Transfer 29 No. 5 2002 611-621.
8. A report on, Pultrusion industry grows steadily in US, 0034-3617/02/- Elsevier Science Ltd.
9. Y.Chachad, J. Roux and J. Vaughan, Manufacturing model for three dimensional irregular pultruded graphite/epoxy composites, Composites: Part A 27A 1996 201-210.
10. K. Friedrich, Polypropylene, Ed. J.K. Kocsis, Kluwer Academic Publishers, Boston, P 81-88.
11. A. Miller, N. Dodds, J. Hale and A. Gibson, High speed pultrusion of thermoplastic matrix composites, Composites: Part A 29 1998 773-782.
12. D.T Boucher and J. Denault, Continuous consolidation of polypropylene/ glass fiber commingled fabric, Industrial Materials Institute National Research Council of Canada Boucherville, Canada J4B 6Y4.
13. I. Angelov, S. Weidmer, M. Evstatiev, K. Friedrich, G. Mennig, Pultrusion of a flax/polypropylene yarn, Composites: Part A 38 2007 1431-1438.

81
14. D.H. Kim, W.I. Lee, K. Friedrich, A model for a thermoplastic pultrusion process using commingled tows, Composites Science and Technology 61 2001 1065-1077.
15. A.R. Madenjian, N.J. Tessier, N.R. Schott, Effect of significant processing variables on thermoplastic matrix pultruded composites, SPI Composites Institute Annual Conference, 1985 40 11F.
16. G. Coven, U. Measuria, R.M. Turner, Section pultrusion of continuous fiber reinforced thermoplastics, C22/86, Institution for Mechanical Engineers, London, 1986.
17. H. Ishida, G. Rotter, RIM pultrusion of thermoplastic matrix composites, SPI Composites Institute Annual Conference, 1988 43 6.
18. J.A. Larock, H.T. Hahn, D.J. Evans, Pultrusion process of thermoplastic composites, SPI Composites Institute Annual Conference, 1989 44 8A.
19. M.L. Wilson, J.D. Buckley, G.E. Dickerson, G.S. Johnson, E.C. Taylor, E.W. Covington, Pultrusion process development of graphite reinforced polyetherimide thermoplastic composite, Thermoplastic Composite Materials, 1989 2 230.
20. N. Bernet, V. Michaud, P.E. Bourban, J.A.E. Manson, An impregnation model for the consolidation of thermoplastic composites made from commingled yarns, Journal of Composite Materials, 1999 33 751.
21. R. Philips, D.A. Akyuz, J.A.E. Manson, Prediction of the consolidation of woven fiber reinforced thermoplastic composites, Part I, Isothermal case, Composites, Part A: Applied Science and Manufacturing, 29A(4) 395-402.
22. W. Michaeli and D. Jurss, Thermoplastic pull braiding: pultrusion of profiles with braided fiber lay up and thermoplastic matrix system, Composites Part A 27 A 1996 3-7.
23. G. Sala and D. Cutolo, The pultrusion of powder impregnated thermoplastic composites, Composites PartA 28A 1997 637-646.
24. A. Luisier, P.E. Bourban, J.E. Manson, Reaction injection pultrusion of PA12 composites: process and modeling, Composites: Part A 34 2003 583-595.
25. C.J. Creighton and T.W. Clyne, The compressive strength of highly aligned carbon fiber/epoxy composites produced by pultrusion, Composites Science and Technology 60 2000 525-533.
26. X.L. Lui, I.G. Crouch, Y.C. Lam, Simulation of heat transfer and cure in pultrusion with general purpose finite element package, Composites Science and Technology 60 2000 857-864.
27. B.R. Suratno, L. Ye and Y.W. Mai, Simulation of temperature and curing profiles in pultruded composite rods, Composites Science and Technology 58 1998 191-197.
28. C.D. Han, O.S. Lee, H.B. Chin, Development of a mathematical model for the pultrusion process, Polymer Engineering and Science, 1984 26 393-404.

82
29. C.Y. Lo, D.W. Lamb and A.G. Gibson, Understanding the factors controlling pultrusion: Characterizing the process by die interfacial shear stresss measurement and thermal modeling, flow and cure of polymers-measurement and control, Rapra Technologies.
30. M.A. Ribbo and I. G. Gutowsky, An analysis of the pulling force in pultrusion, Society of Plastics Engineers Technical Papers, ANTEC 1986 1430-1432.
31. W.I. Lee and G.S. Springer, A model of manufacturing process of thermoplastic matrix composites, Journal of Composite Materials, 21 1017-1055.
32. V. Klinkmuller, R. Kastel, L.Ye, K. Freidrich, On impregnation Quality and resulting mechanical properties of compression moulded commingled yarns based thermoplastic composites, IUATM Synopsis on Microsttucture Property Interactions in Composite Materials, 189-201.
33. V. Klinkmuller, M.K. Um, M. Steffens, K. Friedrich, B.S. Kim, 1995, A new model for impregnation mechanisms in different GF/PP commingled yarns, Applied Composite Materials, 1 351-371.
34. L. Ye, K. Friedrich, J. Kastel, Consolidation of GF/PP commingled yarn composites, Applied Composite Materials, 1 415-429.
35. L. Ye, K. Friedrich, J. Kastel, Y.W. Mai, Consolidation of unidirectional CF/PEEK composites from commingled yarn prepeg, Composites Science and Technology, 54 349-358.
36. T. A. Cain, M.D. Wakeman, R. Brooks, A.C. Long, C.D. Rudd, Towards an integrated processing model for a commingled thermoplastic composite, Proceedings of the Eleventh International Conference on Composite Materials, 1997, Gold Coast, Australia, V 366-376.
37. N. Svensson, R. Shishoo, M. Gilchrist, Manufacturing of thermoplastics composites from commingled yarns - A review, Journal of Thermoplastic Composite Materials, 11 22-56.
38. A.G. Gibson and J.A.E. Manson, Impregnation technology for thermoplastic matrix composites, Journal of Composites Manufacturing 1992 3(4) 223-233.
39. B.P. Van West, R.B. Pipes and S.G. Advani, Consolidation of commingled thermoplastic fabrics, Journal of Polymeric Composites 1991 12(6) 417-427.
40. A.E. Scheidegger, The physics of flow through porous media, University of Toronto Press, Toronto, 1957.
41. T.G. Gutowski, Z. Cai, S. Bauer and D. Boucher, Consolidation experiments for laminate composites, Journal of Composites Materials 1987 21 650.
42. J.W. Seo and W.I. Lee, A model of the resin impregnation in thermoplastics composites, Journal of Composite Materials 25 1991 1127-1142.
43. B.T. Astrom, A modeling approach to thermoplastic pultrusion. I: Formulation of models, Journal of Polymer Composites 14 1993 173-183.
44. S.V. Patankar, Numerical heat transfer and fluid flow, McGraw-Hill, New York,

83
1980.
45. X.L. Lui, Numerical modeling on pultrusion of composite I beam, Composites: Part A 32 2001 663-681.
46. S.U. Gadam, J.A. Roux, T.A. McCarty, J.G. Vaughan, The impact of pultrusion processing parameters on resin pressure rise inside a tapered cylindrical die for glass-fiber/epoxy composites, Composites Science and Technology 68 2000 945-958.
47. Sunil C. Joshi, Y.C. Lam, Three dimensional finite element/nodal control volume simulation of the pultrusion process with temperature dependent material properties including resin shrinkage, Composites Science and Technology 61 2001 1539-1547.
48. Y.C. Lam, S.C. Joshi, X.L. Lui, Numerical simulation of mould filling process in resin transfer moulding, Composites Science and Technology 1998 60(6) 845-855.
49. S.C. Joshi, Y.C. Lam, X.L. Lui, Mass conservation in numerical simulation of resin flow, Composites A: Applied Science and Manufacturing 2000 31(10) 1061-1068.
50. S.C. Joshi, X.L. Lui, Y.C. Lam, J. Sheridan, Simulation of resin film infusion process using finite element/nodal control volume approach, Advanced Composites Letters 1999 8(3) 101-104.
51. M.S. Yun, W. I. Lee, Analysis of pulling force during pultrusion process of phenolic foam composites, Composites Science and Technology xxx 2007 xxx-xxx.
52. www.matweb.com.