Embed Size (px)
Citation preview

ISRN UTH-INGUTB-EX- E-2015/14-SE
Examensarbete 15 hpDecember 2015
Optimization of the hull shape of a specialized vessel used to deploy wave energy converters
Simon Karl Larsson
Teknisk- naturvetenskaplig fakultet UTH-enheten Besöksadress: Ångströmlaboratoriet Lägerhyddsvägen 1 Hus 4, Plan 0 Postadress: Box 536 751 21 Uppsala Telefon: 018 – 471 30 03 Telefax: 018 – 471 30 00 Hemsida: http://www.teknat.uu.se/student
Abstract
Optimization of the hull shape of a specialized vesselused to deploy wave energy converters
Simon Karl Larsson
In this study, the initial hydrostatic stability, the hydrostatic stability and the structurerealibility of three different barge-shaped vessels is simulated and evaluated in orderto see which of the vessels would be the most optimal to use for deployment of waveenergy converters, WECs. The vessels differ in their hull type: Bulbous-bow hullvessel, Barge hull vessel and Modified-barge hull vessel. In order to do the evaluation,the hull of each vessel is designed in DELFTship and further design is proceeded inSolidWorks 2014. Structural strength analysis is performed in SolidWorks 2014 andhydrostatic properties are simualted in Ansys Aqwa 16.0. The collected results arepointing at that the Modified-barge hull vessel is slightly superior to the others interms of hydrostatic stability, while the structure stability is equal.The results of this study will provide a foundation for further evaluation of vesselscapable of deploying wave energy converters.
ISRN UTH-INGUTB-EX- E-2015/14-SEExaminator: Nora MassziÄmnesgranskare: Andrej SavinHandledare: Irina Dolguntseva & Maria Chatzigiannakou

1
Table of Contents
1 Introduction ......................................................................................................................... 2
1.1 Background .................................................................................................................. 2
1.2 Aim of the study............................................................................................................ 3
2 Theory ................................................................................................................................ 4
2.1 Hull types ..................................................................................................................... 4
2.2 Hull thickness ............................................................................................................... 5
2.3.1 Beam structures ..................................................................................................... 6
2.4 Motion in fluid ............................................................................................................... 6
2.5 Stability ........................................................................................................................ 7
2.5.1 Center of Gravity (CoG) and Center of Buoyancy (CoB) ........................................ 8
2.5.2 Initial metacentre - initial hydrostatic stability .......................................................... 9
2.5.3 The metacentric height ........................................................................................ 11
2.5.4 Rolling Period ...................................................................................................... 12
2.5.5 Righting moment and Righting arm ...................................................................... 12
3. Method ............................................................................................................................ 14
3.1 Design and construction ............................................................................................. 16
3.1.1 Hull design and construction ................................................................................ 16
3.1.2 Constructing the inner structure ........................................................................... 17
3.1.3 Constructing the connection segments ................................................................ 17
3.1.4 Constructing the beam structures ........................................................................ 18
3.2 Simulations ................................................................................................................. 19
4. Results ............................................................................................................................ 21
4.1 Simulations and calculations ...................................................................................... 21
4.1.1 Solidworks Simulations ........................................................................................ 21
4.1.2 Ansys Aqwa simulations ...................................................................................... 23
4.2 Deployment strategy for maximum stability ................................................................ 24
5. Discussion and conclusion ............................................................................................... 27
5.1 Displacement and stress analysis .............................................................................. 27
5.2 Hydrostatic stability .................................................................................................... 28
5.3 Deployment strategies ................................................................................................ 28
5.4 Future work ................................................................................................................ 29
6. References ...................................................................................................................... 30
7. Appendix ......................................................................................................................... 32

2
1 Introduction
1.1 Background
Since the demand for clean and environmentally friendly energy has increased, more and
more companies seek to develop new and efficient methods to make use of the energy that
lies within the elements of the earth.
There are numerous ways of harvesting the energy of wind, water and sun. Most of these
ways are in many cases at the very edge of their development, where big steps towards a
higher efficiency are more and more unlikely to occur due to the fact that they are restricted
by material properties as in the case of solar panels [1] where much of the time is spent to
develop and investigate new or alternative materials.
The wind power harvesting in form of wind turbines is, despite the fact that it is the quickest
growing source of energy in the EU [2], also having its limitations - such as the land area
simply is not unlimited and that the wind turbines has to be put in areas where the wind is
reliable.
The energy being harvested from water is the biggest source of renewable energy in the EU.
This energy comes at the moment almost exclusively from hydro-power [3], where huge
dams are used to store water in order to direct the water into turbines where electricity is
generated. This way of storing the water in dams or artificial lakes has an enormous impact
on the environment and the aquatic life in these waters. There is however another way of
harvesting the energy which lies within water, more specifically wave power, which is a
subcategory to ocean energy. The technology which is being developed is targeting not only
the waves, but currents and tides as well [4]. Thanks to its relatively unexplored potential it
has got a good chance of greatly improving its efficiency and extent in the near future [5].
This has lead, amongst others, the company Seabased Industry AB1 to develop and deploy
wave energy converters (WECs) targeting to build a wave power park offshore the western
coast of Sweden [6]. In order to perform the deployment, they are currently forced to rent
vessels suitable for such tasks. This process of constant renting and relying on other
companies in order to carry out their work is to them unsustainable in the long term. At the
moment, there are no specialized vessels used solely for this purpose, only vessels which
are expensive to rent and not very time efficient to use since they are not built for these
types of operations. The solution to this could be to construct a customized vessel used for
these kinds of operations [7]. This solution would provide the company with a wider
foundation to work from. Instead of having to schedule their work with respect to how long
they are able to rent a vessel, they can use their specialized vessel at any time and for how
long it may be needed. This vessel would be constructed in such a way that it can carry out
the desired operations in harsh conditions in a safe and efficient way. In addition to
accessibility, the cost over time will - with respect to renting vessels - be considerably lower
if such an investment is made. Constructing such a vessel would give the company a more
competitive role on the market if they are able to provide both the construction and the
deployment of the products.
1 http://www.seabased.com/en/

3
1.2 Aim of the study
The aim of this study is to investigate different hull shapes of a barge-shaped vessel [8]
which is designed for WEC’s immersion, emersion, and transportation to the deployment site
taking into account issues of vessel’s stability. For this, hydrostatic simulations on different
hull forms will be performed. As a simulation tool, we will use DELFTship for hull shape
modifications and an initial hydrostatic analysis, SolidWorks 2014 for structural analysis and
more advanced development of the hull form together with inner- and super-structures, and
Ansys Aqwa 16.0 for hydrodstatic analysis of a hull. The hull design should meet
fundamental design criteria: simultaneous transfer of eight WECs to the deployment site,
sufficient stability during transfer and submersion [9].

4
2 Theory
2.1 Hull types
Every shape of hull has got its advantages as well as disadvantages according to Lamb,
Thomas [10]. Depending on the environment it is meant to operate in, different shapes are
often combined in order to make it as ideal for its use as possible.
Below there are some hull shapes listed with some of the advantages and disadvantages of
some specific designs:
+
Catamaran or Multi hull
Stable and requires little power to
move at high speeds. Low water
resistance compared to other hull
types.
- Hard to maneuver, long turn radius,
not efficient to load compared to the
other hull structures due to the low
displaced water volume, as well as
the mid section of the ship not
connecting to the water, leading to
there being no uplifting buoyancy
force to help the structure to not
bend in the mid section.
Round hull.
+ Cuts easily through water at any speed.
- Limited in speed by its shape, has to
push huge amounts of water in front
of it. Not stable to load on the sides;
if one load is taken off, the hull is
severely inclined.

5
V-shaped/displacement hull. Typical motorboat hull.
+ Cuts easily through water at moderate speed and with high stability. This done with less power than the Round hull.
- May overturn in sharp turns. Not
stable to load on the sides; if one
load is taken off, the hull is severely
inclined.
Flat hull. Typical barge hull. Can often be the most efficient hull form for a Floating Production, Storage and Offloading unit (FPSO).
+ Ideal for shallow waters such as rivers and lakes. Can be heavily loaded due to the large water displacement.
- Rough ride in waves; does not
deflect the water like the other hulls
do. Bad handling while moving due
to its inequality to rudders. Not very
stable while inclined (struck by
waves).
2.2 Hull thickness
The hull thickness is an important part of the safety and weight of the ship. It was calculated
according to the following formula for minimum hull thickness [11]:
t = 0,044L + 4.6 (mm) (1)
where t is the hull thickness and L is the length of the barge.
The hull is in SolidWorks given the material properties of Plain Carbon Steel which has the
properties displayed in Table 1.
Table 1. The properties of Plain Carbon Steel
Elastic Modulus 2.1e+011 N/m^2
Poisson’s Ratio 0.28 N/A
Shear Modulus 7.9e+010 N/m^2
Mass Density 7800 kg/m^3
Tensile Strength 399826000 N/m^2
Yield Strength 220594000 N/m^2
6
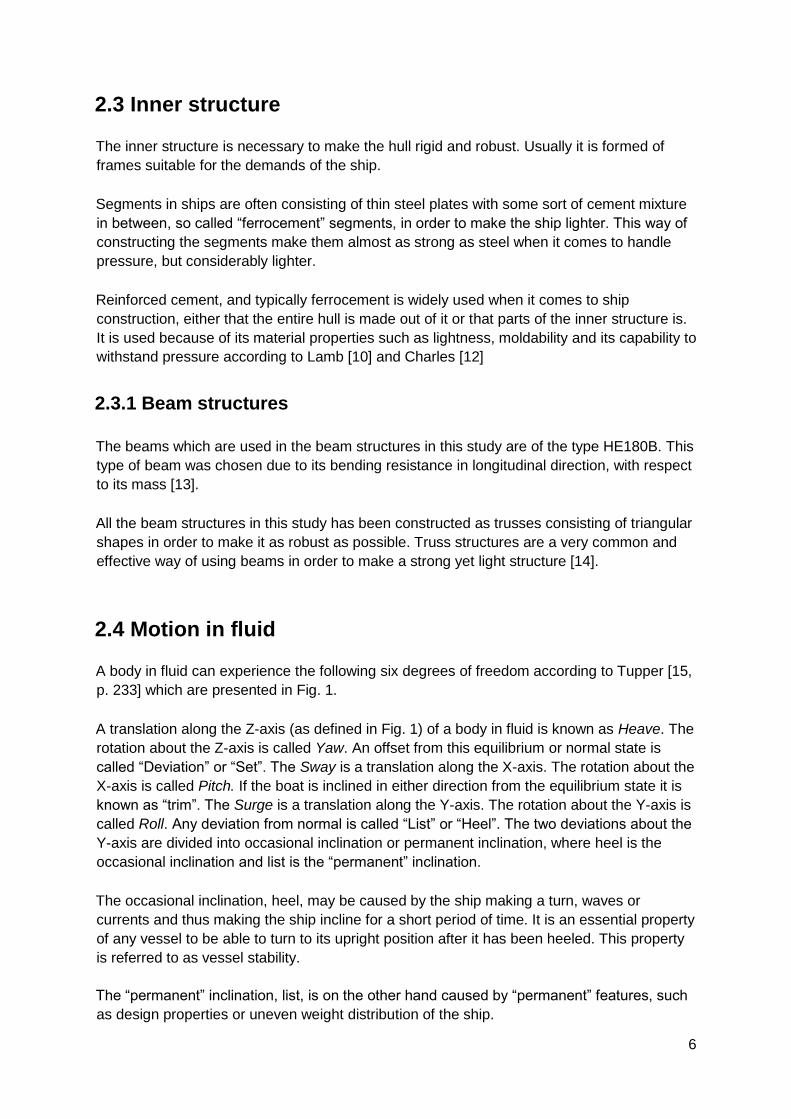
2.3 Inner structure
The inner structure is necessary to make the hull rigid and robust. Usually it is formed of
frames suitable for the demands of the ship.
Segments in ships are often consisting of thin steel plates with some sort of cement mixture
in between, so called “ferrocement” segments, in order to make the ship lighter. This way of
constructing the segments make them almost as strong as steel when it comes to handle
pressure, but considerably lighter.
Reinforced cement, and typically ferrocement is widely used when it comes to ship
construction, either that the entire hull is made out of it or that parts of the inner structure is.
It is used because of its material properties such as lightness, moldability and its capability to
withstand pressure according to Lamb [10] and Charles [12]
2.3.1 Beam structures
The beams which are used in the beam structures in this study are of the type HE180B. This
type of beam was chosen due to its bending resistance in longitudinal direction, with respect
to its mass [13].
All the beam structures in this study has been constructed as trusses consisting of triangular
shapes in order to make it as robust as possible. Truss structures are a very common and
effective way of using beams in order to make a strong yet light structure [14].
2.4 Motion in fluid
A body in fluid can experience the following six degrees of freedom according to Tupper [15,
p. 233] which are presented in Fig. 1.
A translation along the Z-axis (as defined in Fig. 1) of a body in fluid is known as Heave. The
rotation about the Z-axis is called Yaw. An offset from this equilibrium or normal state is
called “Deviation” or “Set”. The Sway is a translation along the X-axis. The rotation about the
X-axis is called Pitch. If the boat is inclined in either direction from the equilibrium state it is
known as “trim”. The Surge is a translation along the Y-axis. The rotation about the Y-axis is
called Roll. Any deviation from normal is called “List” or “Heel”. The two deviations about the
Y-axis are divided into occasional inclination or permanent inclination, where heel is the
occasional inclination and list is the “permanent” inclination.
The occasional inclination, heel, may be caused by the ship making a turn, waves or
currents and thus making the ship incline for a short period of time. It is an essential property
of any vessel to be able to turn to its upright position after it has been heeled. This property
is referred to as vessel stability.
The “permanent” inclination, list, is on the other hand caused by “permanent” features, such
as design properties or uneven weight distribution of the ship.

7
Figure 1. The six degrees of freedom of a body in a fluid.
2.5 Stability
Stability is according to Aqwa Theory Manual [18] divided into two different types of stability,
hydrostatic stability and hydrodynamic stability. Hydrostatic stability refers to a body being
affected by nothing more but the buoyancy force and the gravitational force in still water.
Hydrodynamic stability gives a more detailed look of the stability; it considers the waves that
interacts with the body, the forces acting on the body while the body is in motion and similar
dynamic effects.
In this study, only the hydrostatic stability will be used in order to evaluate the stability.

8
2.5.1 Center of Gravity (CoG) and Center of Buoyancy (CoB)
Figure 2. Location of CoG and CoB on a tilted body; the buoyancy force and the
gravitational force acting on the body
The center of gravity (often abbreviated as CoG), which is in the Fig. 2 displayed as the point
G, is where the gravitational force Y acts on the body. The CoG is a point in which all the
weights constituting a body are assumed to act through. It is the same point as the centre of
mass, provided that the body is situated in an evenly distributed gravitational field according
to Law and Rennie [17].
The center of buoyancy (often abbreviated as CoB), is in the Fig. 2 displayed as the point B.
The CoB of a body is the centroid of the displaced volume of the fluid it is immersed in. It is
at this point that the buoyancy force Z acts on the body, as stated by the Archimedes’
principle [17].
In this paper, the Center of Buoyancy is calculated in the simulations program Ansys Aqwa
according to equation (2) [18]:

9
(2)
where is the Center of Buoyancy, ⍴ the water density, g the gravitational acceleration
(the gravitational force Y in Fig.2), the location of a point on the submerged body surface
in the fixed reference axis (FRA), S0 the wetted surface of the body in still water, Z the
vertical coordinate of the wetted surface point (with reference to the FRA), n3 the unit normal
vector pointing out of the surface and FB the vertical upthrust due to the displacement of
water (the buoyancy force Z in Fig.2).
2.5.2 Initial metacentre - initial hydrostatic stability
Figure 3. The Center of Gravity (G), the Center of Buoyancy (B) and the Metacentre (M).
The metacentre M is the point where the vertical line through the center of buoyancy B of a
ship at the equilibrium intersects with the vertical line through the center of buoyancy when
the ship is tilted by a small angle α according to Fig. 3.
In this report, both the initial metacentre and the metacentre will be used in order to
evaluate the hydrostatic stability of the hulls. The metacentre itself is not used to determine
the stability but rather the metacentric height according to Tupper [15]. This is the distance in
between the metacentre and the CoG.
The inclination angle which occurs due to the ship rolling will change the location of the
metacentre, but for small angles the difference is very small and are in many cases
negligible. The initial metacentre is therefore assumed to only exist and to be fixed for
smaller angles of heel according to Journée and Massie [19]. For greater angles of heel, the
10
metacentre will be moving rapidly along with the ship moving, and is then no longer used to
calculate a ship’s initial stability.
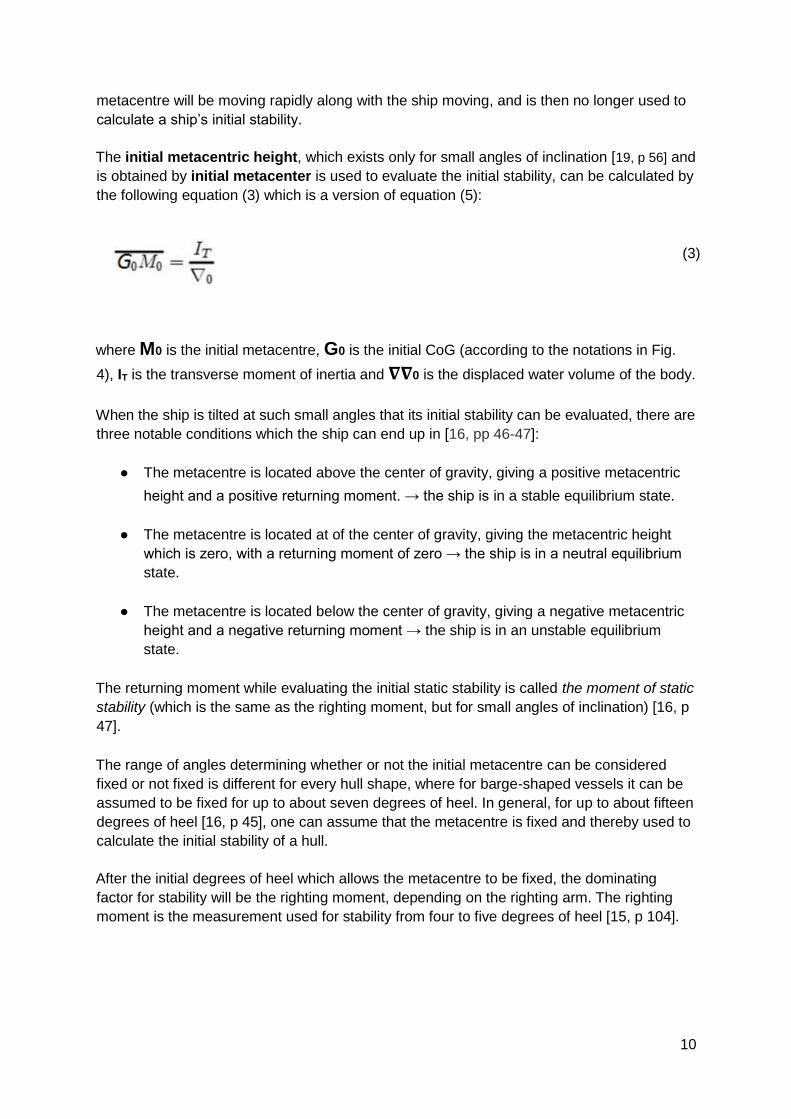
The initial metacentric height, which exists only for small angles of inclination [19, p 56] and
is obtained by initial metacenter is used to evaluate the initial stability, can be calculated by
the following equation (3) which is a version of equation (5):
(3)
where M0 is the initial metacentre, G0 is the initial CoG (according to the notations in Fig.
4), IT is the transverse moment of inertia and 𝛁𝛁0 is the displaced water volume of the body.
When the ship is tilted at such small angles that its initial stability can be evaluated, there are
three notable conditions which the ship can end up in [16, pp 46-47]:
● The metacentre is located above the center of gravity, giving a positive metacentric
height and a positive returning moment. → the ship is in a stable equilibrium state.
● The metacentre is located at of the center of gravity, giving the metacentric height
which is zero, with a returning moment of zero → the ship is in a neutral equilibrium
state.
● The metacentre is located below the center of gravity, giving a negative metacentric
height and a negative returning moment → the ship is in an unstable equilibrium
state.
The returning moment while evaluating the initial static stability is called the moment of static
stability (which is the same as the righting moment, but for small angles of inclination) [16, p
47].
The range of angles determining whether or not the initial metacentre can be considered
fixed or not fixed is different for every hull shape, where for barge-shaped vessels it can be
assumed to be fixed for up to about seven degrees of heel. In general, for up to about fifteen
degrees of heel [16, p 45], one can assume that the metacentre is fixed and thereby used to
calculate the initial stability of a hull.
After the initial degrees of heel which allows the metacentre to be fixed, the dominating
factor for stability will be the righting moment, depending on the righting arm. The righting
moment is the measurement used for stability from four to five degrees of heel [15, p 104].

11
2.5.3 The metacentric height
The initial metacentric height is calculated according to equation (3) as the distance between
the CoG G0 and the initial metacentre M0 as displayed in Fig. 4.
The longitudinal and transverse metacentric heights are calculated with the following
equations (4) and (5) [18]:
(4)
(5)
where the subscript L in (4) indicates that it is used to calculate the metacentric height in
longitudinal direction, and the subscript T in (5) indicates that it is used to calculate the
transverse metacentric height. These equations gives the initial metacentric height if the
vessel is placed in upright position while running the calculations according to equation (3).
For different types of vessels, different metacentric heights are desired. For fully loaded
“General cargo ships”, the typical metacentric height is 0.3 - 0.5 meters, for “Container ships”
the value is 1.5 - 2 meters and for “Double-hull supertankers”, the metacentric height is 2 - 5
meters. The metacentric height should never be less than 0.15 meters for any type of vessel
[16, p 50].
Figure 4. The metacentric height.
12
2.5.4 Rolling Period
The metacentric height is affecting the rolling period of a ship, where a large distance, or a
large metacentric height, is causing a short period of rolling, and a short distance causes a
longer period of rolling. A short period of rolling or a high metacentric height also means that
the restoring forces will be greater than those for a longer period of rolling. The greater
restoring forces are due to that the righting arm will be longer and thus the righting moment
will be higher [16, p 49].
The forces which occur due to the metacentric height will affect whatever goods the ship is
carrying, possibly making the attachments holding the cargo it is transporting in place, to
break. An excessive metacentric height will cause the ship to rotate more than what is
needed in order to return to its equilibrium state, putting the ship into excessive rocking. This
is a source of seasickness since more motion will per definition cause more motion sickness
[20].
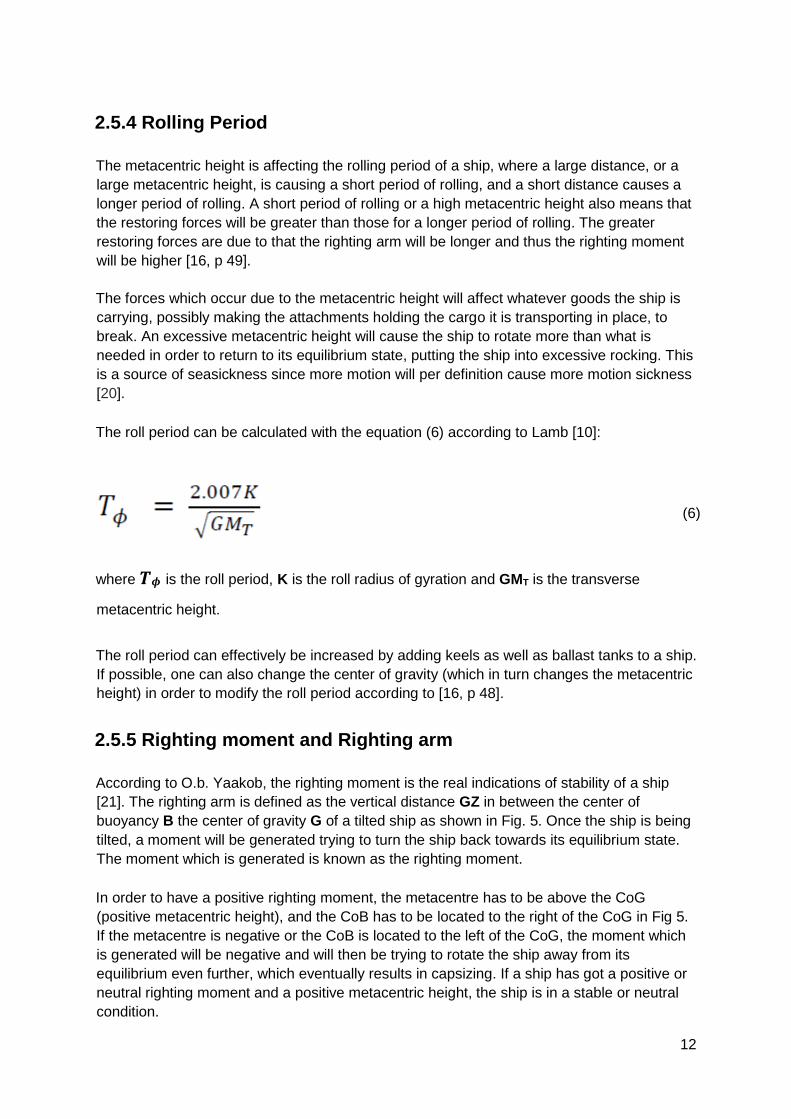
The roll period can be calculated with the equation (6) according to Lamb [10]:
(6)
where 𝑻𝝓 is the roll period, K is the roll radius of gyration and GMT is the transverse
metacentric height.
The roll period can effectively be increased by adding keels as well as ballast tanks to a ship.
If possible, one can also change the center of gravity (which in turn changes the metacentric
height) in order to modify the roll period according to [16, p 48].
2.5.5 Righting moment and Righting arm
According to O.b. Yaakob, the righting moment is the real indications of stability of a ship
[21]. The righting arm is defined as the vertical distance GZ in between the center of
buoyancy B the center of gravity G of a tilted ship as shown in Fig. 5. Once the ship is being
tilted, a moment will be generated trying to turn the ship back towards its equilibrium state.
The moment which is generated is known as the righting moment.
In order to have a positive righting moment, the metacentre has to be above the CoG
(positive metacentric height), and the CoB has to be located to the right of the CoG in Fig 5.
If the metacentre is negative or the CoB is located to the left of the CoG, the moment which
is generated will be negative and will then be trying to rotate the ship away from its
equilibrium even further, which eventually results in capsizing. If a ship has got a positive or
neutral righting moment and a positive metacentric height, the ship is in a stable or neutral
condition.

13
Figure 5. The righting arm GZ between the CoG (G) and CoB (B).
The righting arm 𝐺Z in Fig. 5 can be calculated according to equation (7) [16, p 47]:
(7)
where 𝐺Z is the righting arm, 𝐺M is the metacentric height and sin 𝛼 is the horizontal
distance in between the CoG and CoB for an angle 𝛼 of inclination.
If a ship is tilted beyond the initial stability range, there are three different conditions that
could be encountered [16, p 179]. These conditions are:
● The maximum righting moment or maximum righting arm, which is the maximum
torque that the ship can experience without keeling over. After this point, the righting
moment will not be able to turn the ship back towards its equilibrium.
● The point of vanishing stability, which is the state where the ship is tilted to an angle
where any additional downward force would result in the ship to capsize.
● The point of deck immersion (or the angle of deck point immersion), that is when the
ship is tilted at an angle enough to make the main deck to touch the water.
From the maximum righting moment, one can also obtain “the range of stability” which is a
measurement in degrees for how much the ship can be inclined before the righting moment
is unable to return the ship to its equilibrium state. Since the righting arm is depending on the
angle of inclination and vice versa, they are both obtainable once one of them is evaluated.

14
3. Method
In order to optimize a hull shape for a vessel, it is considered wise to design and evaluate
different shapes of hulls in order to see which shapes are desirable. The vessel is supposed
to be designed like some type of barge/ship which is going to have the capability of both
transporting the WECs as well as deploying them safely and effectively in rough sea.
To narrow the study, it is determined that at least three types of hulls would need to be
evaluated in order to get a useful result. Too see how different hull shapes behave, it was
decided that there should be one hull constructed as a square shape, one hull constructed
as a round shape and one hull constructed as a mixture of the two. Square, flat shapes
handles very well in calm water while rounded shapes handles waves and movement better.
The three following hull shapes were chosen to be evaluated.
1. A rounded body with a bulbous bow at the front as seen in Fig. 6. This vessel measures
51.5 meters long at its longest, 20 meters wide at its widest and 8 meters high at its highest.
The deck of the vessel is located 6 meters above the lowest point of the vessel. This vessel
is referred to as the Bulbous-bow hull vessel and the unloaded weight of the Bulbous-bow
hull vessel is 465 tonnes, whilst the fully loaded weight of the Bulbous-bow hull vessel is 865
tonnes. This shape is going to be the shape which is the most similar to an actual ship. The
bulbous bow shape affects the water as it flows around the bow, improving its performance.
It affects parameters such as drag, speed range and fuel efficiency [22].
Figure 6. The Bulbous-bow hull
In Fig. 6 the top view is the vessel as seen from starboard (right) side, the middle-life picture
is as seen from the aft, the middle-right picture is as seen from the front and the bottom
picture is the vessel seen from below.

15
2. A body which would be similar to other barges but with a modified front and aft, displayed
in Fig. 7. This shape is considered because of its stability and capability of heavy loading
(since it still has much similarities with a barge). This vessel is referred to as the
Modifiedbarge hull vessel. This vessel has got the same measurements as the one above,
but has got slightly higher walls, making it reach 8.4 meters at its highest and adding a little
extra weight from the sides of the ship. This is needed in order to make it reach 51.5 meters
in length, which in turn is needed in order to have the vessels in similar dimensions. The
deck of this vessel is located 6 meters above the lowest point of the vessel. The unloaded
weight of the Modified-barge hull vessel is 482 tonnes whilst the fully loaded weight of the
Modifiedbarge hull vessel is 882 tonnes.
Barges are normally built to operate in calm, shallow waters such as canals or rivers and not
in open, rough sea which in this case was a necessity (there are barges that are used on
open sea, they are however very limited by sea conditions). Therefore some modifications
has to be done in order to make it more suitable for use in various sea states and for long
periods of time.
Figure 7. The Modified-barge hull. From DELFTship.
3. A body as similar to a rectangular barge as possible, as seen in Fig. 8, without any
modifications for rougher sea state. Simulating this model would give an idea about how an
actual barge is behaving and what its limitations are. It has got the same dimensions as
previous shapes, 8 meters high, 51.5 meters long and 20 meters wide. This vessel is
referred to as the Barge-hull vessel and the unloaded weight of the Barge-hull vessel is 516
tonnes whilst the fully loaded weight of the Barge-hull vessel is 916 tonnes.

16
Figure 8. The rectangular Barge-hull vessel. From DELFTship.
3.1 Design and construction
3.1.1 Hull design and construction
The initial hull designs which are displayed in Fig. 6-8 are made in DELFTship which is a
free modeling program specifically used for designing hulls in general [23]. This program
provides an excellent foundation to stand on for a first time hull designer since the models
easily can be modified with advanced shapes and features. In addition to the user friendly
setup, some hydrostatic calculations, displaced water volumes for different water levels (for
different drafts) as well as hull resistance can be calculated by the program.
After the vessel has been designed in DELFTship it has however to be transferred to
SolidWorks [24] and reconstructed with the guidelines which were imported from
DELFTship. SolidWorks has got the necessary tools to determine the mass properties of the
vessel. With a special evaluation tool in SolidWorks, the moment of inertia and mass of
every part of the vessel is obtained. These values are in turn needed in order to carry on
with the simulations in Ansys which requires these inputs to produce accurate results.
The minimal hull thickness for a vessel of this length is calculated to be 6.866 mm, according
to equation (1), but the hull is created with a thickness of 8 mm as a safety measure, as well
as the deck of the vessel. All steel in this study has been chosen to be Plain Carbon Steel,
which properties are displayed in Table 1.

17
3.1.2 Constructing the inner structure
The inner structure of the vessels consists of several connector segments as well as
different beam structures as displayed in Fig. 9. The connector segments are used to
connect the beam structures to the hull itself, making it as robust as possible as well as to
distribute the weight over as large area as possible.
The weakest links in the inner structure are the connector segments, since they are not
entirely made out of steel, which the beam structures are. And the rounder the vessel hull
shape is, the more of the inner structure has to be made out of connector segments due to
the fact that the beam structures are constructed as squares, where a rounded hull leaves
less space to fit these square shapes into.
Figure 9. The cross section of the Bulbous-bow hull with the inner structure.
3.1.3 Constructing the connection segments
The connector segments which are used in this study are each different and constructed as
solids in order to ease the simulations. They are all made directly onto the hull, in order to
minimize calculation time (since bondings in between every part has to be defined for the
simulations and the more connections, the heavier the burden is when running the
simulations.)
These connector segments are made out of ferrocement in between thin layers of steel
plates which make them almost as resistant to pressure as the steel which it is reinforced
with is. The total thickness of the segments are 180 mm and it is dimensioned as such in
order to be equally thick as the HE180-beams which are used in the beam structures. The
dimensions are considered to be good enough to make the pieces strong enough to
withstand the forces that the structure is experiencing from the loads, as well from the
water pressure. One of the connector segments is displayed in Fig. 11.
When placed inside the hull, they are placed with a distance of 4.82 meters apart from each
other. This is done so that the beam structures, which are five meters long, would be able to
fit with half of their beams widths onto to connector segments.

18
The HE180B beams which are used in the beam structures are, as said above, 180 mm
wide, hence half of their width is 90 mm. This allows the beam structures to join on top of the
connector segments, as displayed in Fig. 10.
Figure 10. Beam structures joining on top of a connector segment.
Figure 11. A connector segment.
3.1.4 Constructing the beam structures
The beam structures which are used in this study, are made out of HE180B beam and are
made out of the material Plain Carbon Steel which is displayed in Table 1 in the theory
section. This specific type of beam is chosen due to its bending resistance in longitudinal
direction being very good in comparison to other beams with the same mass, as stated in
the theory section.
All the beam structures in this study has been constructed as trusses, consisting of triangular
shapes in order to make it as robust and strong as possible.

19
The different sizes of the beam structures are determined by where they are meant to be
placed within the hull. For example, the bigger beam structure in Fig. 14 is being used to fill
up most of the central part of the vessel, as vaguely displayed in Fig. 9.
Since most of the deck is a potential loading area for WECs, the inner structure supporting
the deck has to be strong and therefore every beam structure is designed to endure these
forces.
Figure 14. 5x5x5 meter beam structure
3.2 Simulations
Simulations are mainly done in SolidWorks and Ansys, with some properties obtained from
the models in DELFTship.
The strength of the structure is tested with static simulations in SolidWorks which show the
weak points of the structure and how the vessel as a whole handles the weight placed upon
it.
Figure 12. 3x3.7x5 meter beam structure Figure 13. 2x3x5 meter beam structure

20
The stability is tested in Ansys. To obtain the initial metacentric height in order to evaluate
the initial hydrostatic stability for each vessel, they are all set up in Ansys, loaded with eight
WECs and a crane. The inputs to Ansys in this case are from SolidWorks a thin, watertight
hull, the total weight of the vessel, the moment of inertias about every axis and the center of
gravity for the total structure (including the beam structures, the WECs, the crane, the deck
and the hull for every model). From DELFTship, the input is the displaced water volume
which matches the weight of the vessel for the fully loaded case.
Initial hydrostatic stability is evaluated for some unloading cases by looking at how the center
of gravity changes while offloading the WECs in a certain combination. When a WEC is
removed, the total center of gravity of the vessels is changed, thus affecting the angles of
heel and trim. In order to evaluate more than just the initial hydrostatic stability, the vessels
are tested for different angles of heel (7.5, 15 and 22.5 degrees) in order to see how they
handle the inclination.
By inclining the vessels to a certain degree and then submerging it with the step of one
meter, until the vessel is completely submerged, would show how the vessel handle these
degrees of inclination. What is meant to be obtained by doing this inclination test is to be
able to calculate the righting arm at each point of submersion, hence being able to evaluate
if the vessel is capable of righting itself at these points of submersion and inclination. These
tests are meant to mimic the inclination of a vessel when affected by waves at various sea
state. The rougher the sea state, the higher the waves and the more the vessel is tilted.
In the simulations in SolidWorks, the mass of the WECs and the mass of the crane are the
same ones that was used in previous study [8]. Both the crane and the WECs have got a
mass of 50 tonnes each which is determined to be good values for this study as well.
In order to see how the vessels behave during deployment, hydrostatic stability tests and
calculations are done for certain unloading strategies of the vessels. There are two
unloading strategies which are assumed to be the most realistic unloading patterns due to
the vessels being symmetrically loaded. The stability is obtained by calculating the righting
arms according to equation (7) for each WEC deployment. By removing a WEC, the CoG,
the CoB, the metacentric height and the displaced volume of the vessels change. By
simulating the vessels in Ansys and thereby obtaining the displaced volume and metacentric
height for every WEC removal, the hydrostatic stability can be calculated. If the righting arm
is positive, the vessel is stable, if the righting arm is negative, the vessel is unstable, and if
the righting arm is zero, the vessel is at neutral equilibrium.

21
4. Results
The three hull shapes have been designed and simulated in SolidWorks as well as in Ansys
Aqwa. Due to lack of time, only the bulbous-bow hull (displayed in Fig.9) with inner structure
has been evaluated by static simulations in SolidWorks. This was however regarded as the
weakest structure, due to it being the hull with the roundest shape, thus making it have more
of its inner structure made out of the connector segments (which are stated to be the
weakest structures when it comes to material properties). Making strength evaluation
simulations on the weakest structure would assure that the other, more robust structures,
would be well dimensioned for this specific load.
The simulations in SolidWorks were set up with the beam structures, the connector
segments and the hull (as displayed in Fig. 15) since it was these parts which were
dimensioned to take the most of the load. It was assumed that if the structure would give
good results with this setup, which do not include the deck connecting all the beam
structures and thus spreading the load more evenly, it would give even better results with the
deck included.
Initial hydrostatic stability as well as hydrostatic stability has been evaluated through
simulations in Ansys Aqwa and calculations done on the results obtained by these
simulations.
4.1 Simulations and calculations
4.1.1 Solidworks Simulations
In SolidWorks, a displacement analysis and a stress analysis was done too see how the
structure handled the loads that it was constructed to carry.
In the displacement analysis and the stress analysis, the outer face of the hull was fixed and
forces which represents the loads, 8 WECs and a crane, was applied as displayed in Fig. 15.
The arrows in Fig. 15 labeled “25x2 tonnes each” represent the crane and are as written in
the figure, of a magnitude of 25 tonnes each. The remaining eight arrows represent the
WECs and are each of a magnitude of 50 tonnes.
The maximum displacement is the in the Fig. 15 represented with the color red, with a
maximum displacement of 8.32 mm. This is a good result since 8.32 mm is a displacement
of 0.2773% in vertical direction of the specific beam structure. This is not a permanent
displacement, the beams it will go back to their normal state once the weights are removed.

22
Figure 15. Displacement analysis
The stress analysis shown in Fig. 16, displays that the maximum stress is in a specific point
which is 4.617 × 10⁸ (𝑁/𝑚𝑚2) and is denoted with a label on the down left side in Fig. 16
(this area is colored red, but it is however such a small area that it cannot be seen in Fig.16).
The maximum value within the red circle is displayed by the red arrow pointing to the color
scheme, appearing to be close to 2.309 × 10⁸ (𝑁/𝑚𝑚2). Since the yield strength of the
material in these simulations, Plain Carbon Steel, is 2.206 × 10⁸ (𝑁/𝑚𝑚2) (which is
displayed below the color scheme in Fig. 16 and also in Table 1) there will be some minor,
permanent deformation in the areas which exceeds this value. These areas should be
reinforced with extra material in order to prevent this permanent deformation.
Figure 16. Stress analysis

23
4.1.2 Ansys Aqwa simulations
The simulations in Ansys Aqwa have showed that the fully loaded vessels are all considered
to be stable from the point of view of the initial hydrostatic stability and that they are also
stable for some angles of inclination.
From the Ansys simulations, the metacentric heights in transverse as well as longitudinal
direction were obtained. The results from inclining the vessels with 7.5, 15 and 22.5 degrees
respectively and submerging them with the step of one meter will give the center of gravities
and the metacentric heights for every meter the vessels have been submerged. These
results are used to evaluate for which angles and which meters of submersion the vessels
are hydrostatically stable. This is based on the righting arm which is calculated according to
equation (7).
The Table 2 and 3 displays for which meters of submersion the criteria of positive righting
arm is not fulfilled.
The initial metacentric heights and the following rolling periods of the vessels for the fully
loaded cases in upright position are shown in Table 4 and 5. Since the metacentric heights
in transverse direction are positive and the righting arm is zero, the initial moment of
hydrostatic stability is neutral, and thereby are the vessels at stable equilibrium for small
angles of rotation. The rolling periods of the vessels are relatively short, and hence are the
returning forces relatively large.
Table 2. Submersion when the CoG is further out from the center than the CoB.
Angle of inclination (deg) Type of Hull
Bulbous-bow hull Modified-barge hull Barge-hull
7.5 5 m 7 m 4 m
15 3 m 4 m 4 m
22.5 4 m 5 m 4 m
Table 3. Submersion when the metacentric height becomes negative
Angle of inclination (deg) Type of Hull
Bulbous-bow hull Modified-barge hull Barge-hull
7.5 Always positive Always positive Always positive
15 9+ m 10+ m 10+ m
22.5 9+ m 10+ m 3+ m

24
Table 4. The initial transverse and longitudinal metacentric heights for the vessels
Type of hull Metacentric height in
transverse direction (m)
Metacentric height in
longitudinal direction (m)
Bulbous-bow hull 11.53 79.7
Modified-barge hull 18.48 81.4
Barge-hull 27.87 156
Table 5. The rolling period for the vessels while fully loaded and in upright position
Roll time 𝑇𝜙 (s)
Bulbous-bow hull 8,925
Modified-barge hull 3.558
Barge-hull 2.703
4.2 Deployment strategy for maximum stability
Calculations and simulations of the vessels are done for different deployment strategies in
order to obtain the hydrostatic stability of the vessels for each WEC deployment. The WECs
have been numerated from 1-8 according to Fig. 17. The two unloading strategies that are
chosen, Deploy 1 and Deploy 2, have got the following unloading combinations:
Deploy 1: 6-3-4-5-7-2-8-1
Deploy 2: 7-2-8-1-6-3-4-5
Figure 17. The layout of the WECs

25
The vessels initial roll and trim for the unloaded case with all WECs still on is displayed in
Table 6. The sign of the rotation tells in which direction the vessels rotate with respect to the
coordinate system in Ansys. Positive direction of roll is towards starboard side of the vessel
and positive direction of trim is towards the fore of the vessel. A notable feature of the
vessels are their Drafts, which is the distance from the water line to the bottom of the hull.
The drafts for the fully loaded vessels in initial equilibrium state is displayed in Table 6.
Using the deployment strategy in Deploy 1 and Deploy 2 gives the roll and trim of the
vessels as displayed in Fig. 21-24 in the Appendix. The maximum and average roll and trim
of the deployment strategies are displayed in Table 7 and 8.
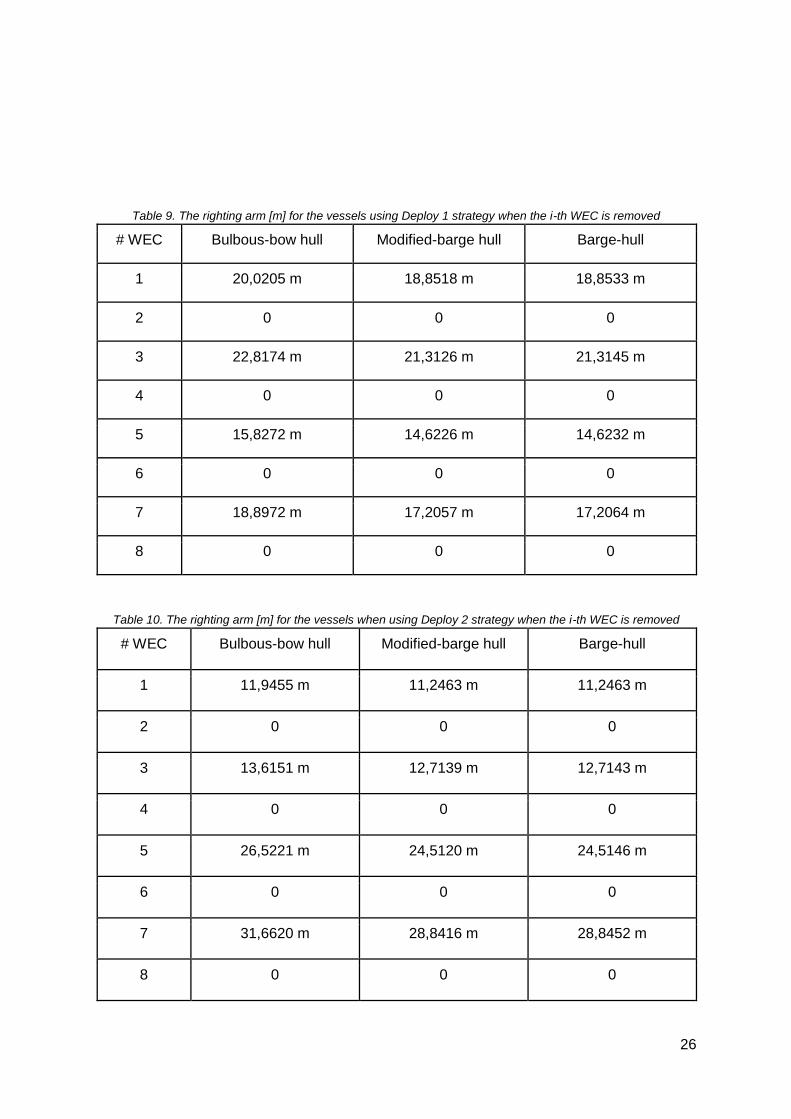
For both of the deployment strategies, the righting arm is positive or neutral for the vessels,
and thereby are the vessels stable for every WEC deploy. The righting arms are displayed in
Table 9 and 10. The righting arm is calculated as the distance GZ according to Fig. 5.
Table 6. The initial roll, trim and draft for the loaded vessels.
Degree of freedom
and initial draft
Bulbous-bow hull Modified-barge hull Barge-hull
Roll(deg) 0 0 0
Trim(deg) – 0,2939 – 1,3317 – 0,2462
Draft (m) 1,977 1,506 1,065
Table 7. The maximum and average roll and trim for the vessels when using “Deploy 1” strategy
Type of hull Bulbous-bow hull Modified-barge hull Barge-hull
Maximum roll (deg.) – 1.8819 – 0.9653 – 0.6068
Maximum trim (deg.) 0.4729 0.4627 0.2227
Average roll (deg.) 0.789375 0.3950875 0.2314125
Average trim (deg.) 0.2374875 0.1661375 0.0963875
Table 8. The maximum and average roll and trim for the vessels when using Deploy 2 strategy
Type of hull Bulbous-bow hull Modified-barge hull Barge-hull
Maximum roll (deg.) – 2.4501 – 1.0730 – 0.5738
Maximum trim (deg.) 0.4322 0.4839 0.2249
Average roll (deg.) 0.8386625 0.40265 0.2497625
Average trim (deg.) 0.2657 0.1692625 0.0971875
26
Table 9. The righting arm [m] for the vessels using Deploy 1 strategy when the i-th WEC is removed
# WEC Bulbous-bow hull Modified-barge hull Barge-hull
1 20,0205 m 18,8518 m 18,8533 m
2 0 0 0
3 22,8174 m 21,3126 m 21,3145 m
4 0 0 0
5 15,8272 m 14,6226 m 14,6232 m
6 0 0 0
7 18,8972 m 17,2057 m 17,2064 m
8 0 0 0
Table 10. The righting arm [m] for the vessels when using Deploy 2 strategy when the i-th WEC is removed
# WEC Bulbous-bow hull Modified-barge hull Barge-hull
1 11,9455 m 11,2463 m 11,2463 m
2 0 0 0
3 13,6151 m 12,7139 m 12,7143 m
4 0 0 0
5 26,5221 m 24,5120 m 24,5146 m
6 0 0 0
7 31,6620 m 28,8416 m 28,8452 m
8 0 0 0

27
5. Discussion and conclusion
5.1 Displacement and stress analysis
The fact that only one inner structure was tested due to lack of time leaves some holes in
this study, the results are however pointing to that the inner structure is robust enough for
the task. The assumption that the roundest hull is the weakest hull due to the material
properties of the connector segments, and thereby the other two vessels would handle the
loads even better is not a too unrealistic assumption since the beam structure is theoretically
stronger than the connector segments. It is however recommended to construct the inner
structures of the remaining hulls in order to see where they might need an enhancement.
The displacement and stress analyses which were made in SolidWorks showed that the
structural strength of the inner structure would need to be enhanced in some specific
locations as stated in the results. However, the displacement which occurred was
surprisingly not even on both sides, even though the forces and layout was even. In Fig. 16
which displays the displacement analysis, the results were therefore a bit odd. Since the
load is evenly displaced with respect to the middle of the vessel, the two sides should have
behaved in a more similar way than they did in Fig.16.
The reason that the sides did not behave similar could be because of misplaced fixed faces,
invalid bonding in between the elements or undefined parts. Due to the hull not being
perfectly smooth (a design fault in DELFTship), the meshing was a bit of a trouble. The
model could not be meshed unless the faces of the hull and the faces of the connector
segments were defined as surfaces and then given an individual thickness. This could have
resulted in some surfaces not being defined properly, and thereby giving the odd result. The
same goes for the stress analysis, the maximum stress occurred in an area which had to be
magnified several times in order to be seen. This small area of high deformation should have
been spread out over a larger area (hence reducing the deformation) if the bondings in
between the elements would have been defined properly. The load placed on the vessel
makes it very unlikely to have a single spot being deformed as displayed in Fig. 17. This is
as mentioned probably due to non-defined surfaces or parts which then act on their own
when the simulations were ran.
The recommendations are to make more simulations on the structure, to improve the quality
of the mesh as well as to make the hull smoother to be able to mesh it without defining its
faces as surfaces and thereby risk leaving small areas undefined.

28
5.2 Hydrostatic stability
By simulating and calculating the initial hydrostatic stability and the hydrostatic stability for
the inclined vessels, it can be concluded that the vessels are all stable for the initial
hydrostatic states, as well as for some of the degrees of inclination. In the case of the
inclined vessels it would be recommended to make the steps shorter than the 1 meter used
in this study, in order to obtain more values and thereby give a clearer picture of how the
vessels behave while being submerged. The meshing in these simulations could as well be
improved. This type of inclination test is touching the hydrodynamic stability sphere and
some authors would even claim that these types of tests are evaluating the hydrodynamics
of a vessel. Ansys Aqwa would however not recognize this, and thereby are all the stability
tests done in this study labeled “hydrostatic”.
The initial metacentric heights for all the vessels were relatively high, and thereby the rolling
period relatively short. It was stated that “Container ships” normally had a metacentric height
of 1.5 - 2 meters and that the “Double-hull supertankers” had a metacentric height of 2-5
meters. Since both these ships also are carrying heavy loads, and since the three vessels in
this study also carries heavy loads, the conclusion would be to have a shorter metacentric
height, and thereby a longer period of rolling. Seasickness and large restoring forces is also
an issue for this short period of rolling. This short period of rolling could be increased by
adding keels. It would also be recommended to try change the metacentric height in order to
avoid seasickness and to avoid large restoring forces which could damage the goods. The
metacentric height could be changed by modifying the center of gravity and the shape of the
hull. One can also load the vessels with more weight and thus lowering the metacentric
height.
Out of the three vessels, the Modified-barge hull vessel is the one which can handle the
inclination angles the best. Since they are all initially stable and equal in that sense, the
conclusion would be that the Modified-barge hull vessel has got the most desirable
properties for the events which are mimicked with these types of simulations. More extensive
simulations would however be needed in order to draw any conclusion about which type of
hull is more suitable for the task specific in the aim of the study.
5.3 Deployment strategies
Both the deployment strategies are stable while being performed. The vessels are all
inclining within reasonable levels for both strategies. The highest inclination angle when it
comes to trim only 0.4839 degrees and the highest for roll is 2.4501 degrees. Since all the
vessels are averagely quite stable (the average movement is not very high for either of the
vessels), it would be wise to consider the peak values. In this case, the Deploy 1 strategy
has got the lowest peaks. Therefore is the Deploy 1 strategy recommended due to it being
the strategy which causes the lowest peak values.
The Bulbous-bow hull vessel has got the largest movement of all the three hulls, meaning
that it is the most unstable out of the three when it comes to these two deployment
strategies. The second most stable hull is the Modified-barge hull vessel, and the most
stable type of vessel for these two deployment strategies is the Barge-hull vessel.

29
5.4 Future work
Out of the discussion and conclusions, the Modified-barge hull vessel is the recommended
vessel to continue to evaluate. This is due to it being the most stable vessel when it comes
to evaluating the vessels hydrostatic properties while inclined further than the initial
hydrostatic stability evaluations stretches. It is also the second best vessel when it comes to
stability while deploying the load in a certain combination. Combined with all the hulls being
stable in the initial hydrostatic stability state, this is the vessel out of the three which has the
most promising results.
To further evaluate the vessel it is recommended to do more hydrodynamic stability tests as
well as to test for several other loading cases as well as deployment strategies. The stability
and time efficiency could perhaps be increased by adding another crane to simultaneously
unload the vessel in order to obtain the stability while doing so. Ballast tanks, rudders and
other stability features should be tested in order to see how the vessel handles with the
increased stability from these features. By adding keels, one can reduce the rolling period of
the vessel significantly, and thus also reducing the forces acting on the cargo. This would
require some testing in order to see how much it would affect the vessel stability.
Simulations of how the hull handles the water while moving and how it handles waves in
motion (hydrodynamics) should be done in order to give further indications on how the
vessel would behave in the real world.
30
6. References
1. Future of solar energy, Vattenfall AB, 2013. [Online] Availabile on:
http://corporate.vattenfall.com/about-energy/renewable-
energysources/solar/future002Dof-solar/ [Last accessed 30th November 2015]
2. Balat, M. 2010;2009;. Sustainable developments of wind power in europe. part 1:
Utilization and future prospects. Energy Sources, Part B: Economics, Planning, and
Policy 5 (4): 409-23.
3. Paish, O. 2002, "Small hydro power: technology and current status", Renewable and
Sustainable Energy Reviews, vol. 6, no. 6, pp. 537-556.
4. Westwood, A. 2004, "Ocean power", Refocus, vol. 5, no. 5, pp. 50-55.
5. Langhammer, O., Haikonen, K., Sundberg, J., Zooekologi,
Teknisknaturvetenskapliga vetenskapsområdet, Elektricitetslära, Uppsala universitet,
Institutionen för ekologi och evolution, Biologiska sektionen, Tekniska sektionen &
Institutionen för teknikvetenskaper 2010, "Wave power—Sustainable energy or
environmentally costly? A review with special emphasis on linear wave energy
converters", Renewable and Sustainable Energy Reviews, vol. 14, no. 4, pp.
13291335
6. About Seabased, Seabased AB. [Online] Available on:
http://www.seabased.com/en/about-seabased [10th of September 2015]
7. Maria A. Chatzigiannakou, Irina Dolguntseva and Mats Leijon, “Offshore Deployment
of Point Absorbing Wave Energy Converters With a Direct Driven Linear Generator
Power Take-Off at the Lysekil Test Site”, ASME 2014 33rd International Conference
on Ocean, Offshore and Arctic Engineering, Volume 9A: Ocean Renewable Energy,
San Francisco, California, USA, June 8–13, 2014. ISBN: 978-0-7918-4553-0.
8. Oskar Flink & Tommy Holmberg, “Structural and Hydrostatic Analysis of Deployment
Vessel”, Report on project work TVE 15 063, Uppsala University, Uppsala, 2015.
9. “Modelling and Analysis of Marine Operations”, DNV-RP-H103, 2011.
10. Lamb, Thomas. (2003 - 2004). Ship Design and Construction, Volumes 1-2. Society
of Naval Architects and Marine Engineers (SNAME).
11. K. Register 2010, Rules and Guidance for the Classification of Steel Barges, Korean
register of shipping.
12. Charles, J.A., Crane, F.A.A. & Furness, J.A.G. 1997,Selection and use of
engineering materials, 3rd; edn, Butterworth Heinemann, Oxford;Boston;.
13. Björk, K., 1919 2007, Formler och tabeller för mekanisk konstruktion: mekanik och
hållfasthetslära, 6. uppl. edn, Karl Björks förlag, Märsta.

31
14. Analysis of trusses, Wikipedia, 8 Dec, 2015. [Online] Available on:
https://en.wikipedia.org/wiki/Truss#Analysis_of_trusses [Last accessed 12th
December 2015]
15. Tupper, Eric C. (2004). Introduction to Naval Architecture (4th Edition)
16. Derrett, D.R. & Barrass, C.B. 2006;2011;, Ship stability for masters and mates, 7th /
revis by C.B. Barrass.;6; edn, Butterworth-Heinemann, Burlington, Mass.
17. Law, J. & Rennie, R. 2015, “Centre of mass”, in A dictionary of physics, 7th edn,
Oxford University Press, Oxford.
18. Aqwa Theory Manual, Ansys inc, November, 2013.[Online] Available on:
http://148.204.81.206/Ansys/150/Aqwa%20Theory%20Manual.pdf [Last accessed
12th December 2015]
19. J.M.J Journée and W.W. Massie. (January 2001). Offshore Hydromechanics. [Online]
Available on:
http://www.shipmotions.nl/DUT/LectureNotes/OffshoreHydromechanics.pdf. [Last
accessed 12th December 2015.]
20. Bos, J.E., Damala, D., Lewis, C., Ganguly, A. & Turan, O. 2007, "Susceptibility to
seasickness", Ergonomics, vol. 50, no. 6, pp. 890-901.
21. Omar bin Yaakob, July 2008. Naval Architecture. Notes on shipping. [Online]
Available on :http://www.fkm.utm.my/~koh/skmo2333/NOTES-SKMO2333.pdf.
22. Shahid Mahmood Debo Huang 2012, "Computational Fluid Dynamics Based Bulbous
Bow Optimization Using a Genetic Algorithm", 船舶与海洋工程学报:英文版(Naval
Architecture and Ocean Engineering), vol. 11, no. 3, pp. 286-294.
23. http://delftship.net/DELFTship [Online]
24. http://www.solidworks.com [Online]

32
7. Appendix
Figure 18. Data for table 3.
Figure 19. Data for table 3

33
Figure 20. Data for table 3.
Figure 21. How the vessels angle of trim change when WEC combination 6-3-4-5-7-2-8-1 is removed.

34
Figure 22. How the vessels angle of roll change when WEC combination 6-3-4-5-7-2-8-1 is removed
Figure 23. How the vessels angle of trim change when WEC combination 7-2-8-1-6-3-4-5 is removed

35
Figure 24. How the vessels angle of roll change when WEC combination 7-2-8-1-6-3-4-5 is removed.