Embed Size (px)
Citation preview

Optimization of Screw Cap Process for E & J Gallo Winery
By
Robert Trent Latimer
A Senior Project submitted In partial fulfillment
of the requirements for the degree of Bachelor of Science in Industrial Engineering
California Polytechnic State University San Luis Obispo, CA
Graded by:________________________ Date of Submission:_______________________

1
Executive Summary
This project takes a microscopic look at all raw material, machinery, and practices that effect
the screw cap process of wine products in order to highlight and eliminate the causes of defects. The
approach for this project involves the analysis of process capability for raw material to achieve its
required dimensions. This project also displays methods of attaining appropriate machinery settings,
and provides a basis for operating standards. Many quality engineering applications are used
throughout this study, revealing the decision process for analyzing said applications.
The studies in this project found uncontrolled dimensions in the suppliers’ caps and bottles
and a present need for adjusted operational standards and machinery settings. A variance of nearly
21% was witnessed during operator setup on the machinery and a method for operator
improvement was implemented. This project provides methods to eliminate defects in order to
better meet Six Sigma quality standards.
2
Contents Executive Summary ....................................................................................................................................... 1
List of Figures ................................................................................................................................................ 3
Introduction .................................................................................................................................................. 4
Project Objectives ......................................................................................................................................... 6
Background ................................................................................................................................................... 7
Overview of Theoretical and Experimental Literature ............................................................................... 13
Design and Methods ................................................................................................................................... 19
Results and Discussion ................................................................................................................................ 26
Conclusion ................................................................................................................................................... 39
Bibliography ................................................................................................................................................ 41
Appendix ..................................................................................................................................................... 42
Appendix A- Project Schedule ................................................................................................................. 43
Appendix B- Glass Requirements ............................................................................................................ 44
Appendix C- G3 Cap Drawing .................................................................................................................. 45
Appendix D- Erben Cap Drawing ............................................................................................................. 46
Appendix E- 7255 Bottle Drawing ........................................................................................................... 47
Appendix F- 7345 Bottle Drawing ........................................................................................................... 48
Appendix G- Gage R&R Output for All Operators ................................................................................... 49
Appendix H- Gage R&R Output for Experienced Operators ................................................................... 50
Appendix I- Gage R&R Output for Novice Operators.............................................................................. 51

3
List of Figures
Figure 1: Cap Measurement Locations............................................................................................................ 8
Figure 2: Locations of Bottle Measurements ................................................................................................. 11
Figure 3: A Zoomed in View of the Capping Process ................................................................................... 12
Figure 4: The DMAIC Process ..................................................................................................................... 15
Figure 5: Side Pressure Setting ...................................................................................................................... 23
Figure 6: Locations of Cap Dimensions ....................................................................................................... 27
Figure 7: Locations of Bottle Measurements ................................................................................................. 31
Figure 8: Operator Measuring Roller Pressure .............................................................................................. 37

4
Introduction
This project takes a microscopic look at the process of screw cap bottling of wine products.
This undertaking sheds light on various, commonly found issues throughout the joining of cap to
bottle. Recently E&J Gallo winery has experienced many screw cap issues such as cut caps, broken
and/or collapsed bridges, and other various defects.
These issues can be attributed to many different sources: caps, glass bottles, the capper, or a
combination of the aforementioned sources. E&J Gallo aspires to determine a specific setting on the
capper that will suit all screw cap products among all bottling lines with the capability of applying
said caps. This project aims to ensure that all cap measurements, glass bottle measurements, and
capper settings will produce a quality product, free from defects.
To resolve capping issues, many studies must first be conducted. One must take a precise
look at the materials (caps and bottles) to ensure all measurements meet the necessary specifications.
If they are not, corrective actions must be taken to obtain materials that are suitable for the capping
process. Once all material issues are solved, capper operator ability must be analyzed. A statistical
test must be conducted to ensure that capper setup by a trained operator is repeatable and
reproducible. If the setup procedure is not concluded to be repeatable and reproducible, a new
method for setup must be established to guarantee proper capper setup.
Subsequent to the operator capability study, a new study must be conducted to determine
the proper settings and tolerances that are suitable for the capper to produce a flawless product.
Once ideal settings and tolerances are established, these settings must be studied to determine
whether they will fit a large array of various caps and bottles designed for screw cap application.

5
Upon completion of this study, E&J Gallo will be tendered a document and analysis
recommending changes to materials, setup procedures and techniques, and capper settings. Plans for
an operator training routine will also be developed. Lastly, a report analyzing common defects and
usual solutions will be delivered.
6
Project Objectives
As previously stated, this project aims to optimize the screw cap process at E & J Gallo
Winery. Because many defects have been witnessed, this project aims to highlight all potential causes
of these defects. All sources that factor into the screw capping process will be critically analyzed to
determine if any process outliers exist.
This project will peer into all raw material characteristics, machinery, supplementary sub
assemblies, and line operators that can have an impact in the screw capping process. The ultimate
goal of this project is to determine all causes of defects, and recommend appropriate methods of
correction. To do this, samples of caps and bottles will be taken and each dimension will be
measured to see if it meets the specified standards and tolerance. Next, an assessment of capper
settings will be conducted to determine if the current running settings are appropriate. Finally, a
study measuring the repeatability of the capper setup is to be conducted.
Findings of this project will be taken to management for their consideration. This project
will conclude with a detailed explanation of each cause of defect, and a recommendation on how to
correct the situation. A defect-free process is extremely difficult to create, but by eliminating all
causes of defects, the process will be much closer to perfection aside from natural variation.

7
Background
Before the technicalities of this project are discussed, one must first understand the materials
and machinery involved and all significant measurements and attributes of each. The key materials
involved in the screw cap process are aluminum caps and glass bottles. The piece of machinery that
mates the screw caps to the bottle is a Zalkin Capper.
Screw Cap Functionality
Screw caps must be strong and enduring enough to last for decades, and easy enough to be
quickly and effortlessly removed. The screw cap must present the liner in a correct position for
sealing. It must also mold to the bottle while holding the liner in place. Finally the cap must provide
threads that enfold the bottle while providing adequate space for removal.
The standard cap that is studied in this project is 30 millimeters in diameter and 60
millimeters in height (30x60). The cap must seal at three different places: cap liner to bottle top, cap
sides to bottle thread, and cap skirt to the bottle tuck (normally referred to as the “pilfer”).
The caps used in this project consist of 8011 Aluminum Alloy, and range from 0.20 to 0.23
millimeters in thickness. Prior to bottling, the caps are typically stored in a warehouse that ranges in
temperature from 32° F to 104°F with humidity ranging from 30% to 75%.

8
Figure 1: Cap Measurement Locations
Screw Cap Liner
A cap liner is a non-permeable entity that functions to prevent liquid leakage and oxygen
ingression. The presence of the liner adds a complicated part into the capping process. An average
liner is about 2 millimeters thick and must be compressed to about half its original size to ensure a
proper seal with the bottle. Characteristics of density largely come into play when compressibility is
concerned. If the liner is not dense enough, it may be more prone to permeation. Needless to say,
the liner plays a vital role in bottling.
Bottle
If the bottle is not made within an extremely detailed specification, it would be nearly
impossible to create a quality product. Flaws in caps are rare and can easily be corrected however
bottles leave much room for imperfections. Flaws found in bottles are extremely complex to fix.
The screw cap process needs a bottle of a higher quality standard than a typical cork mouth bottle.

9
Screw cap and cork mouth bottles only differ from the neck area to the top (or the upper quarter of
the bottle). Both bottles are made under a complex process. A blob of a molten combination of
sand and glass is continuously pushed out of a furnace onto a slide. This blog follows a path into a
mold. Once in the mold, the blobs of the molten mixture are hydraulically secured. Air is then
pumped into the mold to expand the glass to the walls of the mold. Another clamp then comes
down and shapes the neck in specified detail. The bottle’s shape is finalized and then released from
the mold, allowed to cool and then pushed onto a conveyor belt with the other bottles. Each bottle
is sprayed with a coating before it comes to rest in storage.
Many significant measurements on the bottles come into play when aiming for a flawless
product. This project focuses on two specific bottle shapes: 7345 and 7255 (See Appendices 5 and
6). This project closely scrutinizes measurements in the bottles that are likely to cause common
defects if they are out of the predetermined tolerance range. The three main defects that occur in the
caps are collapsed bridges, broken bridges, and cut caps. Each defect can be attributed to specific
measurements in the glass. Collapsed bridges can be caused by inaccuracies in the K Dimension,
Neck Taper, or Bottle Height (See Appendix B). Broken bridges can be attributed to inaccuracies in
the K Dimension, Neck Taper, T Dimension, or E Dimension (See Appendix B). Cut caps can be
caused by many different sources, primarily by inaccuracies in the A1 Dimension, N Dimension, D
Dimension, D Angle, and Bottle Height (See Appendix B). If any of the aforementioned dimensions
are found to be out of their appropriate tolerance range, then recommendations seeking correction
will aptly be made.
Another significant aspect of the bottle is the thread. Thread commonly varies in location,
protrusion, and roundness. Proper thread structure is crucial for accurate cap location and
functionality. Bottle thread inconsistency cannot be tolerated during the bottling process due to its

10
critical impact. In addition the rim above the thread is significant in providing an area for the liner to
rest and cause a sufficient seal along the bottle’s surface.
Bead angle is vital in preventing the entire cap from slipping off breaking any bridges upon
removal. The bead is located just below the thread. Typically cap manufacturers aim for a tucked
angle to be anywhere from 12° to 15°. Anything more than 12° to 15° may lead to loose caps. If the
cap is not secured tightly enough at this position many other issues may occur as well. On the other
hand, if the cap is secured too tightly at this position, cuts in the cap may appear during application.
The neck diameter of the bottle must be extremely precise to allow the cap to sit at an
appropriate height on the bottle. The neck diameter is measured at 60 millimeters from the top of
the bottle. It should be about the same diameter as the cap inner diameter. If it is too large, the cap
may sit too high on the bottle for accurate application. If it is too small however, the cap may sit
askew on top of the bottle and may be subjected to a misaligned finish.
Lastly, bottle concentricity and height must be carefully controlled to ensure that the cap
meets the bottle at the desired location. Concentricity correlates with the vertical digression or
perpendicularity of the bottle. If a bottle does not sit straight, there may be cuts in the sleeve and
improper liner seals. Height is not likely to cause a huge issue unless it is grossly out of control.
Typically the capper can adjust to accommodate different heights to a certain extent.

11
Figure 2: Locations of Bottle Measurements
Capping Process
The critical last step of capping is the application of the cap to the bottle. Once the cap is
aligned on top of the bottle, a capper head grasps the bottle head and completes a four-step process.
First, the liner is compressed to the bottle surface by a pressure block. Second, the pressure block
continues to travel down the bottle, drawing the outer edge closer to the bottle (known as the
redraw). Next, a set of rollers spin down the side of the bottle, forming the aluminum sides in
between the threads of the bottle. Lastly, another set of rollers create a tuck underneath the thread
of the bottle to prepare the bottom skirt for eventual removal. This is commonly referred to as the
pilfer.
The amount the liner is compressed to the top surface is mainly attributed to the head
pressure setting. An average liner is about 2 millimeters thick and should be compressed to about 1
millimeter. The manufacturer of the capper used by Gallo (Zalkin) suggests a head pressure setting
of 160 ± 20 kilograms.
12
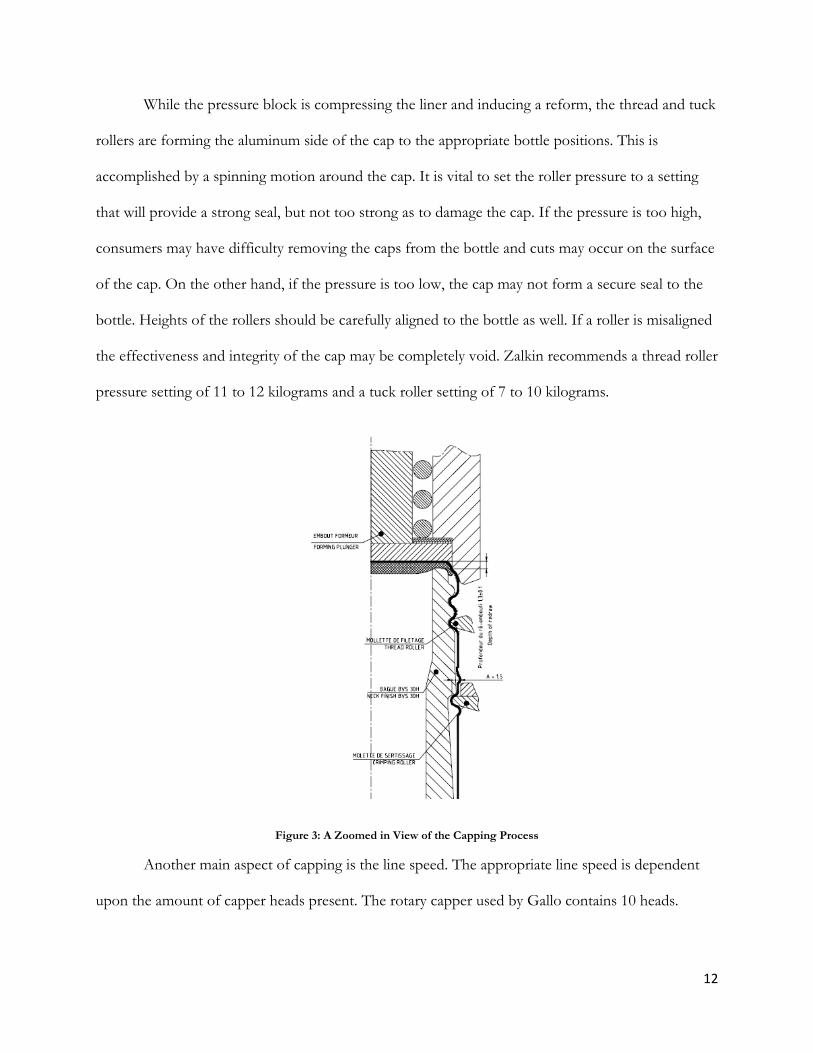
While the pressure block is compressing the liner and inducing a reform, the thread and tuck
rollers are forming the aluminum side of the cap to the appropriate bottle positions. This is
accomplished by a spinning motion around the cap. It is vital to set the roller pressure to a setting
that will provide a strong seal, but not too strong as to damage the cap. If the pressure is too high,
consumers may have difficulty removing the caps from the bottle and cuts may occur on the surface
of the cap. On the other hand, if the pressure is too low, the cap may not form a secure seal to the
bottle. Heights of the rollers should be carefully aligned to the bottle as well. If a roller is misaligned
the effectiveness and integrity of the cap may be completely void. Zalkin recommends a thread roller
pressure setting of 11 to 12 kilograms and a tuck roller setting of 7 to 10 kilograms.
Figure 3: A Zoomed in View of the Capping Process
Another main aspect of capping is the line speed. The appropriate line speed is dependent
upon the amount of capper heads present. The rotary capper used by Gallo contains 10 heads.

13
Zalkin suggests a speed of 1500 caps per head per hour. If the speed is too high, defects are likely to
occur.
Overview of Theoretical and Experimental Literature
For this portion of the project, research was primarily divided between text references.
Valuable information can be attained in numerous texts. One such text is entirely focused on the
process of screw capping, as it covers the process from top to bottom. This project has also been
influenced by the many studies of statistical quality control in a manufacturing setting.
Additional research will be conducted in literature measuring statistical quality control
impact on industrial costs and economics associated with engineering change orders along with
inventory control systems. These sources may highlight barriers hindering a most effective solution.
Furthermore, focus will be spent on facets of Manufacturing Organizations because of its
significance to the manufacturing field.
Screw Capping Process
The screw capping process is discussed in more detail in the ‘Background’ section of this
report. Screw caps must be strong and enduring enough to last for decades, and easy enough to be
quickly and effortlessly removed. The critical step of capping is the application of the cap to the
bottle. When the cap is positioned on top of the bottle, a capper head seizes the bottle head and
follows a four-step process. The liner is compressed to the bottle surface by a pressure block then
the pressure block continues to travel down the bottle, forming the upper edge of the cap to the
bottle. Next, a set of rollers rotate down the side of the bottle, forming the aluminum sides in
between the threads of the bottle. Lastly, another set of rollers create a tuck underneath the thread
of the bottle to prepare the bottom skirt for eventual removal.

14
As the pressure block is compressing the liner and causing a reform, the thread and tuck
rollers are forming the aluminum side of the cap to the appropriate bottle positions. This is
accomplished by a spinning motion around the cap. It is vital to set the roller pressure to a setting
that will provide a strong seal, but not too strong as to damage the cap. If the pressure is too high,
consumers may have difficulty removing the caps from the bottle and cuts may occur on the surface
of the cap. On the other hand, if the pressure is too low, the cap may not form a secure seal to the
bottle. Heights of the rollers should be carefully aligned to the bottle as well. If a roller is misaligned
the effectiveness and integrity of the cap may be completely void.
To effectively troubleshoot the screw capping process, a detailed understanding of the
process itself is crucial. Not only did this project set out to maximize the process efficiency, it seeks
to work in conjunction with capper operators and stakeholders in this project.
Quality Engineering
A diverse amount of statistical quality practices are witnessed among manufacturing
environments. Recently, a surging trend called Six-Sigma has entered into the manufacturing world.
Six-Sigma is a business management strategy developed in 1986 by Motorola. It aims to improve the
quality of process outputs by detecting and eliminating the sources of the defects and reducing
process variation. Under six-sigma quality, the probability that any specific process output unit is
non-defective is 0.9999998, or equivalent to 0.2 defective parts per million. However, if a process
reaches the six-sigma quality level, a process mean can witness disturbances that could potentially
shift it 1.5 standard deviations off target. Assuming the aforementioned scenario is true, a six-sigma
process would produce 3.4 defective parts per million produced (Montgomery, 2009). These are the
quality standards used by E&J Gallo Winery.

15
This project uses a five step problem solving process known as Define, Measure, Analyze,
Improve, and Control (DMAIC). The DMAIC process methodologies were heavily influence by
statistician, Charles Deming’s Plan-Do-Check-Act cycle. DMAIC utilizes control charts, designed
experiments, process capability analysis, and many other statistical tools.
Figure 4: The DMAIC Process
To understand the current performance of the capping process, a sampling of finished
output was conducted. Sampling is the procedure involving the selection of a group of individual
observations within a population of individuals with the goal to reveal data about the population as a
whole. It is generally used to make a statistical assumption of the population.
In this project, the understanding of the quality of a population was done through a Two
Sample T-Test. A Two Sample T-Test statistically compares the responses between two populations.
The null hypothesis states that the two population means are equal to each other, whereas the
alternative hypothesis states otherwise. This is a focus of concern for this project because two types
of material sources that are assumed functionally identical are compared to determine if they are
interchangeable in the capping process.

16
Each sample measurement is also compared to its control chart, to determine whether or not
the output is statistically in control according to its control limits. This project intends to remove all
assignable variability from the screw cap process, or variability caused by a change in the process by
operators, defective raw material, environment, machinery, or other assignable causes.
An analysis of process capability (Cp) for each measurement can determine whether or not a
dimension of a cap or bottle is in its required functional range. A process capability determines the
ability of the process to produce output within its specification limits. A process capability index
(Cpk) is also analyzed to view how capable the process is of producing the process target within the
specification limits.
The last statistical tool used in the project is a Gage R&R. A Gage R&R is a test that reveals
the repeatability and reproducibility (R&R) of a process. One is able to determine the percentage of
variation that is caused by a particular measurement system. A Gage R&R study also reveals
measurements within and between operators as well as evaluates the reliability of the measurement
device. Traditionally 10% variation is acceptable, 10-30% variation is marginable based on the
environment, and variation greater than 30% must be corrected (Harding & Ketron, 2009).
Engineering for statistical quality plays a crucial role in this project. A true sense of
understanding of the process at hand would be impossible without the use of statistical quality
control.
Engineering Economic Analysis
Engineering economic analysis focuses on costs, revenues, and benefits that occur under
different scenarios. Engineering economics is the division of economics that deals with solving
complex problems which are a mixture of economic, political, and humanistic elements (Newman

17
and Eschenbach 2009). Possible benefits in this project come from many vast sources. If the
variation in the process of screw capping is greatly reduced, significant savings will be found in
wasted material reductions, operational efficiency, and customer satisfaction.
The most apparent savings possibility in this project will be that of lowering the process’s
scrap rate. Fixed costs are constant or unchanging regardless of the level of output or activity.
Variable costs are costs that depend on the level of output. A marginal cost is the variable cost for
one additional unit, while the average cost is the total cost divided by the number of units (Newman
and Eschenbach 2009). This project aims to reduce the average cost by ultimately seeking out the
lowest possible variable cost while still meeting the customer’s demand.
An opportunity cost is associated with using a resource in one activity instead of another. E
& J Gallo Winery could have accepted the current running performance of their screw capping
process; however it was determined to be financially justified to use resources to reduce process
variation and waste. Financial savings will be witness through the limitation of nonrecurring costs of
operational output defects. Nonrecurring costs are one-of-a-kind expenses that occur at irregular
intervals and this are sometimes difficult to plan for or anticipate from a budgeting perspective
(Newman and Eschenbach 2009).
The engineering economic literature also touches on ethics in engineering. Ethics in this
situation pertain to how data was collected and how honestly the decision-making process was
performed. An engineering change can have many effects on a company’s well being, both good and
bad. A new technique can revolutionize a manufacturing process, but if it is not carefully and
effectively intertwined with the employees of the company, detrimental results can be found in the
workplace overall demeanor. The overall goal of this project is to ultimately alleviate operational
issues in the screw capping process, and in doing so, positively effect all those involved with it.
Manufacturing Organizations

18
A large part of this project deals with interacting with and alongside other company
members. These members include bottling line operators, quality assurance members, engineering
staff, as well as management. It is vital to work alongside every member to ensure a common goal
and to prevent the disruption of standard practices. Team members must agree on strategic and
tactical decisions to successfully accomplish the goal at hand. Strategic decisions are defined as
decisions that set the direction for the entire company (Reid and Sanders, 2009). These decisions are
generally broad in scope and long-term in nature. Tactical decisions are those that are generally short
term and specific in nature (Reid and Sanders, 2009). Typically, these are bound by the strategic
decisions.
When conducting experiments that include human subjects, it is always essential to follow a
strict code of ethics. It is essential for each subject to be knowledgeable of the study’s purposes, as
well as consenting to the study’s requirements. Understanding testing guidelines for using humans as
test subjects is important to the effectiveness of the study.

19
Design and Methods
The design section of this project aims to define the problem at hand, objective, existing
condition of the problem, alternatives, and the determined path for a solution. The design section
will also contain practices of quality engineering and its constraints. This section is extremely
significant to the report because it takes the reader through the thought process of tackling various
issues that were witnessed in the capping process due to its intricacy. Methods of testing are also
discussed in this section. A deeper understanding of the testing design and practices will be had
when the thought process and experimental procedure are viewed in the same context.
Objective
E & J Gallo Winery has experienced many screw cap issues such as cut caps, broken and/or
collapsed bridges, and other various defects. The objective of this project is to highlight the causes
of these defects from a material standpoint as well as an organizational standpoint. This project aims
to ensure that all cap measurements, glass bottle measurements, and capper settings will produce a
quality product, free from defects. Most importantly this project will shed light into why such
problems occur and how they can be prevented in the future.
Before concluding a final solution to screw cap defects, many steps must first be taken.
Firstly, all materials (caps and glass bottles) must be scrutinized and deemed suitable for application.
The caps and bottles must contain precise correlating dimensions in order to be effectively formed
to one another. Once it is known that the cap and bottle specifications correctly correlate to each
other, samples of the caps and bottles must be taken to determine the variation and process
capability of each dimension. Next, the machine center that joins a cap to a bottle (capper) must be
carefully set to ensure a proper finish. Lastly, any outside forces that may have an impact on this

20
process, such as upstream subassemblies and line speed, must be identified and deemed appropriate
for the process as a whole.
Material Dimensions and Correlation
Before sample measurements of caps and bottles are taken to ensure accuracy, the technical
drawings of the associated caps and bottles must be analyzed to verify that the dimensions are
appropriate for application. Once the specifications are accepted, a Failure Mode and Effects
Analysis (FMEA) is to be conducted on caps, bottles, and the capper. An FMEA document
highlights all possible causes of defects, moreover emphasizing their severity to the process,
probability of occurring, and likelihood of detection. The document will then weigh the effect of
each defect and rank it based on its impact to the process as a whole.
Caps
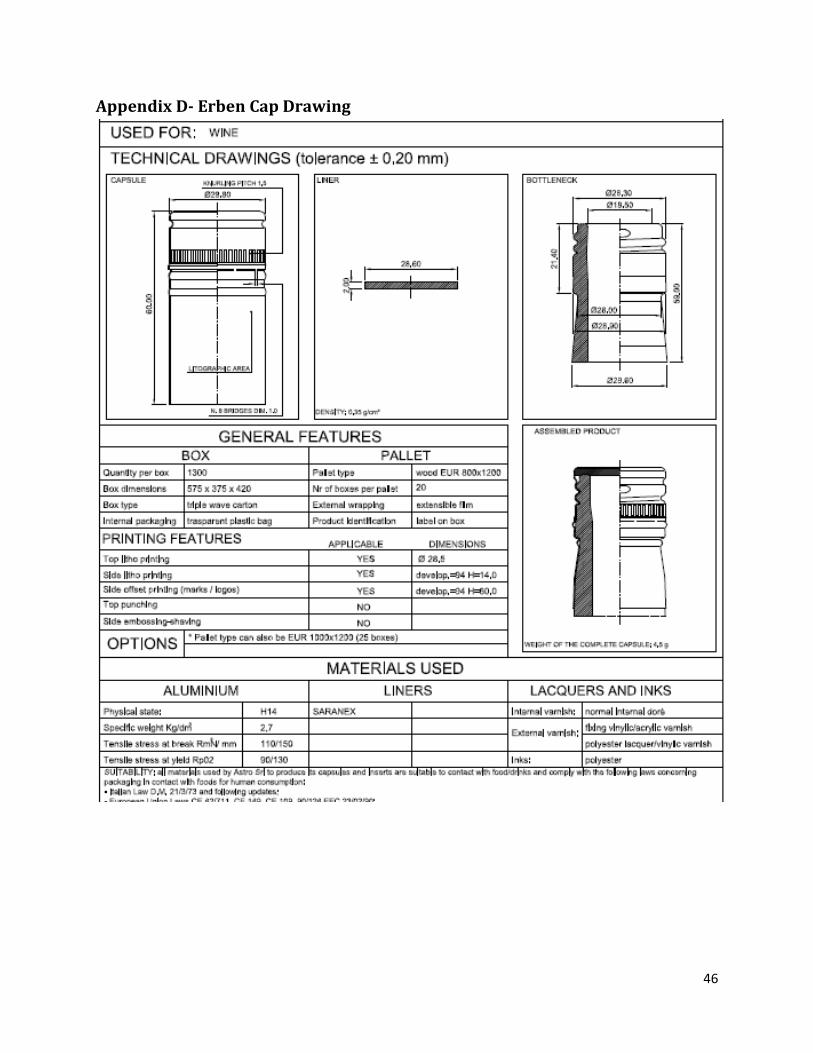
Two different suppliers’ caps are used in this study, G3 30x60 caps and Erben 30x60 caps.
The dimensions of these caps vary slightly, but are still appropriate for application to the bottles (See
Appendices C & D). The potential dimensions of each cap that may cause defects of concern are:
inner diameter of cap bottom, inner diameter at cap serration, serration height, cap height, bridge
width, serration cut quality, hardness, liner thickness, liner density, specification differences by
suppliers, and material tensile strength.
Samples of each cap were taken, and each dimension was measured to see how it compares
to the specified dimension. Each measured dimension was compared to the specified dimension
through a Two-Sample T-Test and its desired confidence interval. A process capability (Cp) of each
measurement was also conducted to determine the ability of the process to produce output within
its specification limits. Lastly, the process capability index (Cpk) was analyzed to view how capable
the process is of producing the process target within the specification limits.
Bottles

21
The method of analyzing the bottle dimensions is extremely similar to the method of
analyzing the caps. Two different bottles are used in the screw cap process, 7255-Series and 7345-
Series (See Appendices C & D). The bottles’ dimensions greatly vary, as they are suited for different
types of wine, however they both have appropriate dimensions to interact with a cap. The potential
dimensions of each bottle that may cause defects of concern are: K dimension, neck taper angle,
bottle height, angle of bottle skew, A1 dimension, N dimension, A1-N, D dimension, radius at D, D
angle, A-1 ovality, T dimension, and E dimension.
Samples of each bottle were taken, and each dimension was measured to see how it
compares to the specified dimension. Similar to caps, each measured dimension was compared to
the specified dimension through a Two-Sample T-Test and its desired confidence interval. Lastly, a
process capability and the corresponding process capability index of each measurement were
recorded.
Capper Settings
Assuming all dimensions of the caps and bottles are appropriate, much variation can be had
due to the settings on the capper. To produce a quality cap to bottle seal, the capper must be closely
aligned to the caps and bottles, and must maintained frequently. Each capper can have up to ten
rolling heads that apply the cap to the bottle. The correct measurements the capper must contain
are: thread and pilfer roller height, thread and pilfer roller pressure, clean pilfer rollers, overall capper
height, head pressure, and an aligned pressure block.
The user manual from the capper provided suitable ranges for each capper setting; however
there is room for variation based on the dimensions of the caps and bottles. In the case of this
project, the capper manufacturer suggestions were deemed to be broad, thus a more detailed
experiment had to be conducted to develop appropriate ranges of each capper setting when dealing
with the previously mentioned caps and bottles.

22
A test using each cap-bottle combination (Erben Cap with 7255 Bottle, Erben Cap with
7345 Bottle, G3 Cap with 7255 Bottle, and G3 Cap with 7345 Bottle) was conducted on the capper
to develop suitable ranges for each setting. All of the capper settings were dialed in to the current
running settings except for one setting that was set below its recommended range. Three of each
bottle combinations were sent through the capping process with the belief that the lowered setting
would cause a defect. This experiment was repeated over and over again, each time raising the
lowered setting until it was above the maximum recommended setting. Ultimately a range was
determined for this particular setting that displayed the lowest acceptable setting to the highest
acceptable setting that did not create a defect. A different range was computed for each cap-bottle
combination then each range was overlapped to determine an overall suitable range.
For example, the capper manufacturer’s recommended range for the pilfer roller height is
.841” to .861” from the top of the bottle. The height was then set to .835” and each cap-bottle
combination was sent through the capping process, revealing defects. It was now known that if the
pilfer roller height was set to .835”, defects on all combinations would occur. The height was then
raised from .835” to .837” and the test was repeated. The pilfer roller was altered by increments of
.002” increments until the height reached .867”. It was determined that the appropriate range for the
pilfer roller height for the Erben Cap- 7255 Bottle combination was .843” to .865”, but this was not
the range for all of the combinations. Finally, each range was overlapped to determine the setting
that would work for all combinations; in this case, .845” to .859” was deemed to be the suitable
range for all combinations.
This test was repeated with each previously noted capper setting, and a list of ranges was
determined. After this testing was completed, some concern over how some settings affect others
was brought up. A new test was conducted using all of the newly developed ranges. For example,
the pilfer roller height was set to maximum acceptable setting, while the head pressure was set to its

23
lowest acceptable setting. This test was repeated over and over again using variation of the pilfer
roller height, thread roller height, pilfer roller pressure, thread roller pressure, and head pressure.
After this testing was completed, no additional findings were made. The capper settings from the
previous test were not altered by the second test.
Capper Setup Consistency
Appropriate capper settings for all of the cap-bottle combinations were determined, but how
robust was the setup process? An operator could be ordered to set the capper to the specified
settings, but the process of dialing in one capper roller head to the proposed settings is extremely
fastidious, let alone ten capper roller heads. It was determined that a test measuring the repeatability
of the capper setup must be conducted.
The goal of this experiment was to determine whether or not operators are able to accurately
reproduce desired set up measurements on a capper roller head. Specifically, the test encompassed
side pressure settings. Essentially, if side pressure is set to a specific weight unbeknownst to the
operator, by the use of a spring scale, what reading will the operator conclude for that specific
weight? This test will measure the deviation in the average users’ measurements.
Capper Setup Background Understanding:
To adjust the pressure setting, one must first loosen
the lock nut ( ). Once this is done, the pressure screw
( ) must be turned clockwise to increase pressure or
counterclockwise to decrease pressure (see Figure 5).
Method:
• Task: The subject will use a spring scale to
Figure 5: Side Pressure Setting

24
measure the force applied by a pressure roller. Keeping the spring scale in a horizontal
position, the subject will place their left hand on the roller and use their right hand to pull
the spring scale. Once the subject feels the roller subdue to the spring scale force, the
measured force will be recorded. This same measurement will be conducted in trials of 3, at
10 different pressure settings.
• Test Subjects: Maintenance members, or anyone who would normally adjust pressure
settings on a capper.
Variables:
• Control Variables:
o Consistent body position will be maintained during measurement.
o Subjects will stand upright and place their left hand on the roller.
o With their right hand, subject will pull the spring scale until the roller’s position is
altered.
o Subjects are not to look at the scale in order to prevent biases.
• Dependent Variable:
o The recorded force on the spring scale once the roller’s position is altered.
• Independent Variable:
o Pre-test Pressure Setting
� 12-30 pounds in 10 equal intervals
Capper Setup Analysis
The test measured the variation among four capper operators. The results were determined
through the use of a Gage R&R study. This type of study reveals the repeatability and reproducibility
of the setup process. Moreover, one is able to determine the measurements within and between

25
operators as well as evaluate the reliability of the measurement device. Traditionally 10% variation is
acceptable, 10-30% variation is marginable based on the environment, and variation greater than
30% must be corrected.
Other Sources of Variation
Many other causes of defects in the manufacturing process can easily arise. Cap defects can
result from running the machinery too fast, warehouse storage policies, pressures and viscosity of
the wine, as well as upstream or downstream subassemblies. None of these aforementioned sources
were concluded to have an effect in the capping process.
Design Summary
The greatest challenge of this project was to identify the great number of sources that may
cause a defect. Numerous studies can be had, and much focus can be costly spent elsewhere. This
project took a bottom to top look of the entire process of screw capping. The main focus of this
study was to identify the causes of the defects and prevent them in hope of consistently creating a
quality product and ultimately satisfying the customers’ expectations.

26
Results and Discussion
This section will provide an in depth look at the findings of the project testing. Segments will
cover raw material functionality, capper settings, and capper setup procedures. This section will
discuss what the results reveal about the process and future possibilities of further testing.
Raw Material Results
As previously discussed in the “Design” section, the technical drawings of the associated
caps and bottles must be analyzed to verify that the dimensions are appropriate for application (See
Appendix B). Comparing these drawings to the manufacturer’s requirements, everything seems to
line up appropriately. The two types of caps and bottles do vary slightly, but should still provide the
basis for a quality product. The next step of testing involves ensuring that sample measurements of
cap and bottle dimensions are statistically identical to the provided drawing dimensions.
Caps
Two different suppliers’ caps are used in this study, G3 30x60 caps and Erben 30x60 caps.
As previously stated, there are many cap dimensions that, if not in control, can cause major defects
to the process output products. These highlighted dimensions are: inner diameter of cap bottom,
inner diameter at cap serration, serration height, cap height, bridge width, serration cut quality,
hardness, liner thickness, liner density, specification differences by suppliers, and material tensile
strength.

27
Figure 6: Locations of Cap Dimensions
The first measurement was done on the bottom inner diameter of the caps. The bottom
inner diameter of the cap must be strictly controlled to guarantee that the cap will sit at the proper
height on the bottle. If the bottom inner diameter is too narrow, the cap will sit too high on the
bottle, which could cause many defects during application. If it is too wide, the cap may be too loose
along the side of the bottle, which could cause a skewed finish during application.
The G3 and Erben cap drawings suggest that the bottom inner diameter should be 29.2 ±
0.1 millimeters and 29.3 ± 0.1 millimeters, respectively. After taking thirty sample measurements of
each cap, the average G3 diameter was 29.41 millimeters and the average Erben diameter was 29.53
millimeters. The process capability values were in suitable ranges, however both process capability
index values were below suitable values. Both cap measurements are outside of the process’s control
limits and must be corrected by both cap suppliers.

28
The next measurement was on the cap height. The height of the cap has similar process
effects as the cap bottom inner diameter. It must be strictly controlled to guarantee that the cap will
sit at the proper height on the bottle.
The G3 and Erben cap drawings suggest that the cap heights should be 59.97 ± 0.36
millimeters and 60 ± 0.2 millimeters, respectively. After taking thirty sample measurements of each
cap, the average G3 cap height was 60.18 millimeters and the average Erben cap height was 60.02
millimeters. All measurements fell within process control limits. The Erben caps revealed a process
capability value of only 0.97, suggesting a wider variation of the measured value within its control
limits. The G3 process capability was within a suitable range. Through statistical analysis, the cap
heights were not determined to be a cause of concern.
The subsequent measurement was done on the quality of each cap’s serration. The cap
serration is a cut around the cap that separates the top of the cap from the bottom. A uniform cut is
made around the cap, leaving small sections of material, or bridges, as the connectors from the top
of the cap to the bottom. If a serration is of poor quality, the upper portion of the cap will either be
too difficult or too easily removed from the bottom portion. The results of these measurements are
binomial, either satisfactory quality or unsatisfactory quality. All of the sampled caps were found to
meet satisfactory quality standards.
The next measurement was done on the cap serration height. If the serration is at the wrong
location of a cap, pilfer and thread rollers may elongate or compress the serration bridges. The G3
and Erben cap drawings suggest that the serration heights from the top of the cap should be 17.4 ±
0.2 millimeters and 18.0 ± 0.2 millimeters, respectively. After taking thirty sample measurements of
each cap, the average G3 serration height was 17.53 millimeters and the average Erben serration
height was 18.22 millimeters. The G3 serration height met its specifications and revealed a process

29
capability of 1.40. The Erben serration height straddled its upper control limit, and only showed a
process capability of 1.09. The Erben serration height is out of control, thus corrective action is
needed from the supplier.
Bridge width on each cap was the next focus. Each cap generally has around twenty to thirty
bridges. As previously stated, a bridge is the small piece of material connecting the bottom of the
cap to the top. If a bridge is not an appropriate size, the cap will either be too difficultly or too easily
removed from the bottom portion. The G3 and Erben cap drawings suggest that the bridge width
should be 1.4 ± 0.1 millimeters for both. After taking thirty sample measurements of each cap, the
average G3 bridge width was 1.35 millimeters and the average Erben bridge width was 1.37
millimeters. All measurements were within the process control limits. Neither cap’s bridge width
revealed any cause for concern.
The thickness of the liner was the next measurement. A cap liner is a non-permeable entity
that functions to prevent liquid leakage and oxygen ingression. The thickness of the liner is generally
compressed to half its original height. If the liner is too thick, the cap will not be compressed to a
low enough level and the cap pilfer and threads may be applied at incorrect positions. If the liner is
not thick enough, the cap may be compressed to far, or the liner may be pierced which may cause
leakage. The G3 and Erben cap drawings suggest that the liner thickness should be 2.0 ± 0.2
millimeters for both. After taking thirty sample measurements of each cap, the average G3 liner
thickness was 1.97 millimeters and the average Erben liner thickness was 2.05 millimeters. Both
processes displayed high process capability values. Both liners are statistically in control and do not
require corrective action.
The last cap measurement was the material compression strength. The compression strength
is vital because cases of wine are stacked on top of one another in a warehouse. Each cap must be

30
able to withstand a decent amount of force before collapsing under pressure. Each specification
sheet requires that the cap must be able to withstand 50 pounds of vertical force. After taking thirty
sample measurements of each cap, the average G3 compressive strength was 72.73 pounds and the
average Erben compressive strength was 107.95 pounds. Both processes displayed high process
capability values. Both caps perform far greater than their requirements and do not require
corrective action.
Cap measurements for the most part were in control, however a few blaring issues were
revealed. Both caps’ bottom inner diameters did not meet their specification standards and need to
be corrected by the cap suppliers. The Erben cap serration height was also out of control. From a
cap standpoint, these two issues may be the largest contributing factors to defects.
Bottles
Flaws in caps are rare and can easily be corrected however bottles leave much room for
imperfections. Flaws found in bottles are extremely complex to fix. The screw cap process needs a
bottle of a higher quality standard than a typical cork mouth bottle. Two different bottles are used in
the screw cap process, 7255-Series and 7345-Series (See Appendices E & F). The bottles’
dimensions greatly vary, as they are suited for different types of wine, however they both have
appropriate dimensions to interact with a cap.
The three main defects that are occurring in the caps are collapsed bridges, broken bridges,
and cut caps. Each defect can be attributed to specific measurements in the glass. Collapsed bridges
can be caused by inaccuracies in the K Dimension, Neck Taper, or Bottle Height (See Appendix B).
Broken bridges can be attributed to inaccuracies in the K Dimension, Neck Taper, T Dimension, or
E Dimension (See Appendix B). Cut caps can be caused by many different sources, primarily by
inaccuracies in the A1 Dimension, N Dimension, D Dimension, D Angle, and Bottle Height (See

31
Appendix B). If any of the aforementioned dimensions are found to be out of their appropriate
tolerance range, then recommendations seeking correction will aptly be made.
Figure 7: Locations of Bottle Measurements
The first measurement was done on the K dimension of the bottle. An out of control K
dimension could be a leading factor in broken or collapsed bridges. The 7255 and 7345 bottle
drawings suggest that the diameter at the K dimension should be 1.165±.028 inches for both bottles.
After taking thirty sample measurements of each bottle, the average 7255 K dimension was 1.174
inches and the average 7345 K dimension was 1.164 inches. Both bottles met their specifications

32
however the 7255 K dimension only revealed a process capability of 0.88. Most samples of the 7255
bottle were above the target goal, but still within the process control limits. The 7345 bottle
provided a process capability 1.77 and was very much in control. Neither K dimension needs
corrective action, however the 7255 bottle should continue to be monitored.
The next measurement was done on the neck taper angle. An out of control neck taper angle
could be a leading factor in broken bridges. Neither bottle drawing provides defined specifications
for a neck taper angle, however the capper manufacturer suggests an angle between 5º to 7º. After
testing thirty samples of each bottle, the 7255 bottle had an average neck taper angle of 3.6 º and the
7345 bottle had an average of 4.1 º. Neither measurement had significant process capability values;
therefore it is essential that corrective action be taken.
Bottle height was the following measurement. An incorrect bottle height could be a leading
cause for collapsed bridges. The 7255 and 7345 bottle drawings suggest that the bottle heights
should be 11.875±.062 inches for both bottles. After taking thirty sample measurements of each
bottle, the average 7255 height was 11.868 inches and the average 7345 height was 11.860 inches. All
measurements were within the specification limits and both processes provided an extremely high
process capability value. No corrective action is needed for bottle heights.
The next measurement was done on the A-1 dimension. A poor A-1 dimension could be a
leading factor for cuts in the cap. The 7255 and 7345 bottle drawings suggest that the A-1
dimensions should be 1.138±.012 inches for both bottles. After taking thirty sample measurements
of each bottle, the average 7255 A-1 dimension was 1.131 inches and the average 7345 A-1
dimension was 1.133 inches. The A-1 process is out of control. Neither A-1 dimension matched its
specifications, therefore corrective action is needed.

33
D dimension was the next measurement. An uncontrolled D dimension may cause cuts in
the cap. The 7255 and 7345 bottle drawings suggest that the D dimensions should be 0.851±.010
inches for both bottles. After taking thirty sample measurements of each bottle, the average 7255 D
dimension was .853 inches and the average 7345 D dimension was .855 inches. All measurements on
the 7255 bottle were within the specification limits and the process provided an extremely high
process capability value. A few measurements on the 7345 bottle were out of control, and there
appeared to be a heightened shift in the mean. Corrective action is needed for the D dimension in
the 7345 bottle only.
The next measurement was done on the D angle. An uncontrolled D angle could be a cause
for cuts in the cap. The 7255 and 7345 bottle drawings suggest that the D angle should be a
maximum of 15° for both bottles. After taking thirty sample measurements of each bottle, the
average 7255 D angle was 15.3° and the average 7345 D angle was 13.0°. Neither bottle contained a
high process capability value and many measurements fell outside of the specification limits,
therefore corrective action is needed.
Another dimension that could cause defects is the T dimension. An uncontrolled T
dimension may be another factor in broken bridges. The 7255 and 7345 bottle drawings suggest that
the T dimensions should be 1.114±.012 inches for both bottles. After taking thirty sample
measurements of each bottle, the average T dimension was 1.110 inches for both bottles. Both sets
of measurements had high process capability values, suggesting that the T dimension is in control
and does not require further action.
The final glass measurement was done on the E dimension. The 7255 and 7345 bottle
drawings suggest that the E dimensions should be 1.028±.012 inches for both bottles. After taking
thirty sample measurements of each bottle, the average E dimension was 1.025 inches for both

34
bottles. All measurements were within the specification limits and both processes provided an
extremely high process capability value. No corrective action is needed for the E dimension.
There were quite a few uncontrolled dimensions in the bottles. Much corrective action is
required by the bottle supplier. The dimensions that need to be amended are the neck taper angles in
both bottles, A-1 dimension in both bottles, D dimension in the 7345 bottle, and the D angle in
both bottles. These solutions can be accomplished by the purchasing of new bottle molds by the
glass manufacturer.
Results of Capper Settings
The next phase of testing was on the settings of the capper. This testing was accomplished
using caps and bottles in their current, uncorrected state. If corrections are made in the cap and
bottle dimensions, these results of this test should be recalculated using the new materials. Different
capper settings can cause a great deal of variation in the process. The correct measurements the
capper must contain are: thread and pilfer roller height, thread and pilfer roller pressure, clean pilfer
rollers, overall capper height, head pressure, and an aligned pressure block.
The user manual from the capper manufacturer (Zalkin) provided suitable ranges for each
capper setting, however each setting’s range was extremely broad. A test using each cap-bottle
combination (Erben Cap with 7255 Bottle, Erben Cap with 7345 Bottle, G3 Cap with 7255 Bottle,
and G3 Cap with 7345 Bottle) was conducted on the capper to develop suitable ranges for each
setting.
All of the capper settings were dialed in to the current running settings except for one setting
that was set below its recommended range. Three of each cap-bottle combination was sent through
the capping process with the belief that the lowered setting would cause a defect. This experiment
was repeated over and over again, each time raising the lowered setting until it was above the

35
maximum recommended setting. Ultimately a range was determined for this particular setting that
displayed the lowest acceptable setting to the highest acceptable setting that did not create a defect.
A different range was computed for each cap-bottle combination, and then each range was
overlapped to determine an overall suitable range.
The first test was done on the pilfer roller height. The purpose of the pilfer is to prepare the
bottom skirt of the cap for eventual removal. If the pilfer indentation is at an incorrect location, the
cap may not be secured to the bottle and cuts in the cap may appear. The Zalkin user manual’s
recommended range for the pilfer roller height is .841” to .861” from the top of the bottle. After
testing was completed, it was determined that the appropriate range was .843” to .865” for the
Erben Cap- 7255 Bottle combination, .845” to .865” for the Erben Cap-7345 Bottle combination,
.843” to .859” for the G3 Cap-7255 Bottle combination, and .843” to .859” for the G3 Cap- 7345
Bottle combination. The suitable range for all combinations was deemed to be .845” to .859”.
The next test was done on the thread roller height. Thread structure is crucial for accurate
cap location, functionality, and eventual cap removal. The Zalkin user manual’s recommended range
for the thread roller height is .399” to .419” from the top of the bottle. After testing was completed,
it was determined that the appropriate range was .397” to .417” for the Erben Cap- 7255 Bottle
combination, .399” to .417” for the Erben Cap-7345 Bottle combination, .405” to .419” for the G3
Cap-7255 Bottle combination, and .405” to .417” for the G3 Cap- 7345 Bottle combination. The
suitable range for all combinations was deemed to be .405” to .417”.
Pilfer roller pressure was tested next. The pressure on the pilfer determines how strongly the
cap material hugs the bottle at the pilfer tuck. The Zalkin user manual’s recommended range for the
pilfer roller pressure is 7 to 10 kilograms. After testing was completed, it was determined that the
appropriate range was 7 to 10 kilograms for the Erben Cap- 7255 Bottle combination and the Erben
Cap-7345 Bottle combination, 7 to 11 kilograms for the G3 Cap-7255 Bottle combination, and 7 to

36
12 kilograms for the G3 Cap- 7345 Bottle combination. The suitable range for all combinations was
deemed to be 7 to 10 kilograms, same as the manufacturer’s recommendation.
Thread roller pressure was the next phase of testing. The pressure on the thread determines
how strongly the cap material hugs the bottle at the thread locations. The Zalkin user manual’s
recommended range for the thread roller pressure is 11 to 12 kilograms. After testing was
completed, it was determined that the appropriate range was 7 to 10 kilograms for the Erben Cap-
7255 Bottle combination, 8 to 10 kilograms for Erben Cap-7345 Bottle combination, 11 to 13
kilograms for the G3 Cap-7255 Bottle combination, and 10 to 13 kilograms for the G3 Cap- 7345
Bottle combination. There was not a range that would suit all combinations, thus the thread pressure
must be set between 8 and 10 kilograms for Erben caps and 11 to 13 kilograms for G3 caps.
The last measurement was done on the head pressure. The strength of head pressure
determines how much of a redraw is present and how much the liner is compressed. If it is too high,
the liner may be pierced and leakage can occur. On the other hand, if it is too low, the liner may not
be compressed enough to prevent leakage through the top of the bottle. The Zalkin user manual’s
recommended range for the head pressure is 140 to 180 kilograms. After testing was completed, it
was determined that the appropriate range was 145 to 185 kilograms for the Erben Cap- 7255 Bottle
combination and Erben Cap-7345 Bottle combination, and 150 to 175 kilograms for the G3 Cap-
7255 Bottle combination and the G3 Cap- 7345 Bottle combination. The suitable range for all
combinations was decided to be 150 to 175 kilograms.
According to the results of the test, each setting except for the thread roller pressure
contains a range suitable for all cap-bottle combinations. These settings do slightly vary from the
current running settings and can prevent possible future defects if implemented. One of the greatest
discoveries is the fact that the Erben caps cannot handle as much thread pressure as the G3 caps
require.

37
Capper Setup Consistency Results
The purpose of the next phase of testing was to determine whether or not operators are able
to accurately reproduce desired set up measurements on a capper roller head. The capper involved
in this project contains ten cappers heads. Essentially the capper is capable of capping ten bottles in
one rotation. When operators are performing the task of calibrating the capper settings, it can often
be extremely timely and require great attention to detail. Because the only setting that must be
changed repeatedly is the thread roller pressure, a test was devised to measure operators’ deviation
when adjusting this setting.
It was determined that the best method for analyzing accuracy of measurement was through
a Gage R&R. A Gage R&R is a test that reveals the repeatability and reproducibility (R&R) of a
process. One is able to determine the percentage of variation that is caused by a particular
measurement system. The data points are the gauge readings by each operator at each pressure
setting. A total of four operators participated in the test.
Figure 8: Operator Measuring Roller Pressure
This test required operators to use a spring scale to measure the force applied by the roller. Once the
operator felt the roller subdue to the spring scale force, the measured force was be recorded. This

38
same measurement was conducted in trials of 3, at 10 different pressure settings. The pressure
settings ranged from 12 pounds to 30 pounds in increments of 2 pounds. The operators are not
knowledgeable of the pressure setting during a given trial run. This test measures the difference of
the operator’s pressure reading from the preset pressure setting.
From listening to the operators, two of them appeared to be quite experienced with this type
of measurement, whereas the other two were novice. The results revealed a variance of 20.99%
among all operators accuracy to determine the correct setting. The experienced operators varied by
only 18.32% as opposed to the novice operators who varied by 28.17%. Using general guidelines for
interpreting Gage R&R variance, 20.99% would be classified as marginally acceptable based on the
setting.
Viewing the results of the test, three options for correction were apparent. One could accept
the 20.99% variance and allow time for a learning curve to take place, a training regimen could be
created to help operators practice their skill, or the measuring system must mechanically corrected.
Because the process could allow a small amount of variation, management took to the idea of
creating a training regimen for the operators to practice their accuracy.
Summary of Results
Overall, the results made more issues apparent than previously anticipated. To reach Six-
Sigma standards, extreme measures must be taken. The design theory held well and provided much
information into potential causes of defects. It is crucial for management to correct the outlying
issues and repeat the testing to ensure a more stable process. Because many issues were highlighted,
the future should hold some positive changes in the quality of screw cap products. Similar testing
should be done on all screw cap products to prevent any further or similar defects.

39
Conclusion
This project set out to optimize the screw capping process for E&J Gallo Winery. Many
issues were witnessed such as cuts in the caps, broken bridges, and collapsed bridges. A wide variety
of factors can cause major defects in the screw capping process. Uncontrolled raw material
dimensions, improper capper settings, and an inexperienced work force among other issues can have
a detrimental effect on the quality of finished process outputs.
Many notable potential causes of defects were uncovered in this project:
• Uncontrolled dimensions in the raw material were discovered
• More appropriate setting ranges were determined for the capper
• There was a variation of nearly 21% in capper setup procedures
Analysis of cap dimensional analysis revealed two blaring issues. Both caps’ bottom inner
diameters did not meet their specification standards and needed correction, and Erben cap serration
height was out of control. Both cap suppliers have altered their process since news of these issues
arose.
The defects found in the glass were more prevalent. The dimensions that need to be
corrected are the neck taper angles in both bottles, A-1 dimension in both bottles, D dimension in
the 7345 bottle, and the D angle in both bottles. Since news of these issues, new glass molds have
been made by the bottle manufacturer in hopes of correcting these dimensions.
Appropriate capper settings were determined for each cap-bottle combination. The process
of calibrating these settings by operators witnessed a variance of 20.99%. Through implementation

40
of a bi-monthly training regimen, it is believed that each operator will be more apt to apply the
correct setting to the machinery.
It is difficult to predict if all screw cap defects will be eliminated based on this study, but
many potential causes have been brought to attention. Based on the experimental results, insight in
the screw capping process has been vastly heightened. By taking action to eliminate all causes of
defects, fewer problems should arise in the future.
The objective of this project was to optimize the screw capping process. If all of the tests
lead to the elimination of defect-causing attributes, it appears that the process is well on its way to
meeting Six-Sigma quality levels. It is hoped that this project will serve as a foundation for others to
continue seeking ultimate quality levels.

41
Bibliography
• Newnan, D, Lavelle, J, and Eschenbach, T. 2009. Engineering Economic Analysis, Tenth Addition, Oxford University Press, New York.
• Chopra, S. and Meindl, P. 2007. Supply Chain Management Strategy, Planning, and Operation, Fourth Edition, Prentice Hall, New Jersey.
• Bowman, M. 2003. Applied economic analysis for technologists, engineers, and managers, Second Edition, Prentice Hall, New Jersey.
• Stelzer, Tyson, Jeffrey Grosset, Michael Brajkovich, and John Forrest. Taming the Screw: a
Manual for Winemaking with Screw Caps. Brisbane: Wine, 2005. Print.
• Gordon Becker, Sallie E., Lee, John D., Liu, Y., Wickens, Christopher D. (2004). An Introduction to Human Factors Engineering: Second Edition. Upper Saddle River, New Jersey: Pearson Prentice Hall.
• Ryan, Thomas P. (2007). Modern Engineering Statistics. Hoboken, NJ: John Wiley & Sons, Inc.
• Henderson, J. Patrick., and Dellie Rex. About Wine. [Cifton Park, NY]: Thompson Delmar
Learning, 2007. Print.
• Jackisch, Philip. Modern Winemaking. Ithaca, NY: Cornell UP, 1986. Print.
• Reid, Robert D., and Nada R. Sanders. Operations Management: an Integrated Approach.
Hoboken, NJ: John Wiley, 2007. Print.

42
Appendix
Appendix A- Project Schedule ................................................................................................................. 43
Appendix B- Glass Requirements ............................................................................................................ 44
Appendix C- G3 Cap Drawing .................................................................................................................. 45
Appendix D- Erben Cap Drawing ............................................................................................................. 46
Appendix E- 7255 Bottle Drawing ........................................................................................................... 47
Appendix F- 7345 Bottle Drawing ........................................................................................................... 48
Appendix G- Gage R&R Output for All Operators ................................................................................... 49
Appendix H- Gage R&R Output for Experienced Operators ................................................................... 50
Appendix I- Gage R&R Output for Novice Operators.............................................................................. 51

43
Appendix A- Project Schedule

Appendix B- Glass Requirements
Glass Requirements
44

45
Appendix C- G3 Cap Drawing
46
Appendix D- Erben Cap Drawing

47
Appendix E- 7255 Bottle Drawing

48
Appendix F- 7345 Bottle Drawing

49
Appendix G- Gage R&R Output for All Operators

50
Appendix H- Gage R&R Output for Experienced Operators

51
Appendix I- Gage R&R Output for Novice Operators