Embed Size (px)
Citation preview
OPTIMIZATION OF ROUND SHAPE FLOATING LNG SUPPLY CHAIN EFFICIENCY
WITH SIMULATION MODELING
SANUSI
A project report submitted in partial fulfillment of the
requirements for the award of the degree of
Master of Engineering (Industrial Engineering)
Faculty of Mechanical Engineering
Universiti Teknologi Malaysia
JANUARY 2013

ABSTRACT
Supply chain management plays very pivotal role in business operation of
LNG due to increase of gas demand and need of optimization of supply chain
process to achieve high profitability and customer satisfaction. Optimum LNG
supply chain is obtained through the integration among states in supply chain and
high utilization of facilities in every single stage. Integration of those stages should
be considered in early stages before actual operation is performed. An effort to
integrate LNG supply chain to get optimum performance requires simulation
modeling. Critical factors impact the performance metrics were identified by using
statistical design of experiment principles, subsequently simulation modeling was
used to evaluate various what if (experiments) for determining the interaction among
the factors and significance of the factors in LNG supply chain. In the simulation, the
critical factors such as storage capacity, offloading rate, transportation capacity and
number of LNG carrier were identified. The results of this study indicate that
transportation capacity and number of LNG carrier are the most significant factors in
achieving optimal amount of LNG in receiving terminal and high performance of
LNG carrier. Then, the obtained result was used to design LNG supply chain of
Round Shape FLNG using Visual Basic (VB). From the simulation, it is concluded
that the optimal balancing of LNG supply chain with 997 tonnage per hour for
production capacity requires seven LNG carriers with capacity 93,900 tonnage,
storage capacity 288,530 tonnage and offloading rate 7940 tonnage per hour. This
combination resulted the amount of received LNG in receiving about 8,013 million
tonnage per year and performance of LNG Carrier is about 99,85 %.
vi
ABSTRAK
Pengurusan rantaian bekalan dalam operasi LNG ini memainkan
peranan yang sangat penting dengan peningkatan jumlah permintaan gas dan
keperluan dalam mengoptimumkan proses ini untuk mencapai keuntungan yang
tinggi dan dapat memberi kepuasan kepada pelanggan. Pengoptimuman rantaian
bekalan LNG dapat diperolehi melalui integrasi di setiap negara dalam membentuk
rantaian bekalan dengan jumlah penggunaan yang tinggi di setiap peringkat. Dalam
setiap peringkat tersebut perlu dipertimbangkan pada peringkat awal sebelum
pendedahan sebenar dilaksanakan. Satu usaha untuk mengintegrasikan rantaian
bekalan LNG untuk mendapatkan prestasi yang optimum dengan memerlukan
model simulasi. Kritikal faktor telah dikenal pasti dengan menggunakan reka bentuk
statistic dengan menggunakan prinsip percubaan, kemudian model simulasi telah
digunakan untuk menilai pelbagai eksperimen bagi menentukan antara faktor dan
kepentingan faktor dalam rantaian bekalan LNG. Dalam simulasi, faktor kritikal
seperti kapasiti penyimpanan, pemunggahan LNG, pengangkutan kapasiti dan
bilangan pengangkut LNG telah dikenal pasti. Keputusan simulasi menunjukkan
kapasiti pengangkutan serta nombor pengangkut LNG adalah faktor yang paling
penting dalam mencapai jumlah optimum LNG yang diterima dan pengangkut LNG
yang tinggi. Kemudian, hasil yang diperolehi telah digunakan untuk mereka bentuk
rantaian bekalan LNG dalam bentuk bulat FLNG dengan menggunakan Visual Basic
(VB). Dari simulasi yang dilakukan, disimpulkan bahawa keseimbangan optimum
dalam rantaian bekalan LNG dengan 997 tan sejam bagi kapasiti pengeluaran
memerlukan tujuh pembawa LNG dengan kapasiti muatan 93,900 tan, 288530 tan
kapasiti penyimpanan dan kadar pemunggahan 7,940 tan sejam. Gabungan ini
diterima dalam menghasilkan jumlah LNG kira-kira 8,013,000 tan setahun dan
prestasi pengangkut LNG adalah 99,85%.
vii
TABLE OF CONTENTS
CHAPTER TITLE PAGE
DECLARATION ii
DEDICATION iii
ACKNOWLEDGEMENT iv
ABSTRACT v
ABSTRAK vi
TABLE OF CONTENTS vii
LIST OF TABLES xi
LIST OF FIGURES xii
LIST OF ABBREVIATION xiv
LIST OF SYMBOLS xv
LIST OF APPENDICES xvi
1 INTRODUCTION 1
1.1 Introduction 1
1.2 Background of Project 7
1.3 Problem Statement 10
1.4 Project Objectives 11
1.5 Project Questions 11
1.6 Expected Constribution of Project 12
1.7 Scope of Project 13
1.8 Structure of Project 13
1.9 Conclution 14

viii
2 STUDY LITERATURE 15
2.1 Introduction 15
2.2 Definitions of Supply Chain and Supply Chain Management 16
2.3 Decision Phases in a Supply Chain 17 17
2.4 Components of SCM 18
2.5 Supply Chain Optimization 19
2.6 Strategic Supply Chain Optimization 20
2.7 Upstream and Downstream Activities 20
2.8 Push and Pull Type of Supply Chain 20
2.9 Design of supply chain 21
2.10 Integration of Supply Chain 22
2.11 Benefits of Supply Chain Integration And Coordination 23
2.12 Supply Chain in Oil and Gas Industry 25
2.12.1 Definition of upstream, midstream and downstream 25
activities in oil and gas industry 25
2.12.2 Oil and Gas Supply Chain 26 26
2.13 LNG Supply Chain 27 27
2.14 Supply Chain Strategies in Oil and Gas 27
2.14.1 Leveraging the Connections between Pricing and
Supply Chain. 28 28
2.14.2 Integrating Supply Chain and Trading. 28
2.14.3 Linking supply chain and channel management strategy. 29
2.15 LNG Supply Chain Evolution 30 30
2.15.1 Pipelines as a Part Of Supply Chain 30
2.15.2 Floating LNG Supply Chain 31 31
2.16 FLNG Process 33 33
2.17 Simulation 40 40
2.17.1 Verification 41 41
2.17.3 Validation 41 41
2.17.4 Number of Replications 42 42
2.17.5 Simulation Software 43 43
2.18 Process Optimization using Design of Experiment 44
2.19 Conclusions 45

ix
3 PROJECT METHODOLOGY 46
3.1 Introduction 46
3.2 Project Methodology 46
3.2.1 Understanding Business Process and Problem analysis 49
3.2.2 Modeling and Programming 40 51
3.2.3 Report and Documentation 58 55
3.3 Conclusion 59
4 SIMULATION MODELING AND DESIGN OF EXPERIMENT 60
4.1 Introduction 60
4.2 Conceptual Model 61
4.2.1 LNG Supply Chain Flow of Round-Shape FLNG 62
4.2.2 Simulation Process of LNG Supply Chain
of FLNG Using Witness Simulation 63
4.2.2.1 Production and storage on Round Shape 63
FLNG agent
4.2.2.2 Transportation Agent 64
4.2.2.3 Receiving Terminal Agent 66
4.3 Decision Variables 67
4.4 Design of Experiment 68
4.5 Simulation model for LNG Supply Chain of Round Shape FLNG 69
4.6 Conclusion 71
5 RESULT AND DISCUSSION 72
5.1 Introduction 72
5.2 Optimum Supply Chain Parameter Evaluation 73
5.2.1 DoE Analysis of LNG Supply Chain 73
of Round Shape FLNG (Response 1) 74
5.2.1.1 Total Received LNG in Receiving Terminal
(Half Normal Probability Plot) 74

x
5.2.1.2 ANOVA of Total Received LNG in Receiving 75
Terminal analysis
5.2.1.3 Normal Probability Plot and Residual vs predicted 76
5.2.1.4 Main Effect and Interaction Analysis 78
5.2.2 DoE Analysis for Supply chain Balancing (Response 2) 80
5.2.2.1 Percentage of LNG Carrier (Half Normal 80
Probability Plot)
5.2.2.2 ANOVA of percentage of LNG Carrier is busy 81
5.2.2.3 Main Effect and Interaction Analysis 81
5.3 Optimal Setting of LNG Supply Chain of Round Shape of FLNG 83
5.4 Design of LNG Supply Chain of FLNG Using Visual Basic 85
5.4.1 Input Data of LNG supply chain using Simulation Modeling 86
5.5 Conclusion 88
6 CONCLUSION AND RECOMMENDATION 89
6.1 Conclusion 89
6.2 Recommendation 90
REFERENCES 91
APPENDIX A 95
APPENDIX B 104
APPENDIX C 111
APPENDIX D 116
APPENDIX E 117

xi
LIST OF TABLES
TABLE NO. TITLE PAGE
1.1 Typical Gas Compositions 4
3.1 Experimental conditions for the described experiment. 56
3.2 Calculation of mean and standard deviation estimate 57
4.1 Production Process Rate 64
4.2 Levels of Factors 65
4.3 Experimental Metric 68
5.1 Experimental Response 73
5.2 Analysis of Variances (ANOVA) output from Design Expert. 75
5.3 Setting of LNG Supply chain 83
5.4 Selected setting of LNG Supply chain 84

xii
LIST OF FIGURES
FIGURE NO. TITLE PAGE
1.1 World Market Energy Use 2
1.2 World Energy Consumption by Fuel. 3
1.3 LNG Exporters by Country 5
1.4 LNG Importer by Country 5
1.5 Conventional LNG Supply Chain -from Upstream to Distribution 8
1.6 Floating LNG supply chain process: from Upstream to Distribution 8
2.1 Components in the SCM concept 18
2.2 Entire Supply Chain in Oil and Gas Industry 26
2.3 Fully integrated (traditional) model 29
2.4 Conventional LNG supply chain 30
2.5 Floating LNG supply chain 31
2.6 LNG Process Overview 33
2.7 Liquefaction Process 36
2.8 Storage Type 39
3.1 Flow Chart of Research Methodology and Simulation Modeling 48
3.2 Display of Witness 2004 software 52
4.1 Full Integrated of LNG Supply Chain of Round Shape FLNG 62
4.2 LNG Supply Chain of FLNG from Production to Power 62
Generation
4.3 Round Shape FLNG Production Process and Storage 63
4.4 A typical Supply Chain of LNG 65
4.5 Location of Round Shape FLNG Project in Indonesia 66
4.6 Schematic diagram of LNG Terminal 67

xiii
4.7 Process Flow of LNG Supply Chain of Round Shape FLNG 70
4.8 LNG Supply Chain Simulation Process 71
5.1 Total Received LNG in Receiving Terminal (Half Normal 74
Probability Plot)
5.2 Normal Probability Plot of VOC emission by mode operational 77
5.3 Residual vs Predicted 77
5.4 Main Effects A (No of Vessel) 78
5.5 Interaction Graph for number of vessel and storage capacity 80
5.6 Main Effects A (No of Vessel) 82
5.7 Desirability Graph 85
5.8 Input data of LNG Supply chain simulation 86
5.9 Simulation process of LNG supply chain 87
5.10 Output of LNG Supply chain 87
xiv
LIST OF ABBREVIATION
EIA - Energy Information Administration
CO2 - Carbon Dioxides
LNG - Liquefied Natural Gas
FLNG - Floating Liquid Natural Gas
LPG - Liquefied Petroleum Gas
SCM - Supply Chain Management
FEED - Front End Engineenering Design
DoE - Design of Experiment
NGL - Natural Gas Liqued
km - Kilometer
km2 - kilometer square
m - Meter
m/s - Meter per second
NO - Nitric oxide
N2O2 - Dinitrogen dioxide
N2O3 - Dinitrogen trioxide
NO2 - Nitrogen Dioxides
NOx - Nitric Oxides
O2 - Oxygen
PM - Particulate matter
SO2 - Sulphur Dioxides
SO3 - Sulphur Trioxides
SOx - Sulphur Oxides
NM - Nautical Mile

xv
LIST OF SYMBOL
% - Percent
α - level of confidence
S - Standard deviation
x - Mean estimate
n - Number of Replication
xvi
LIST OF APPENDICES
APPENDIX TITLE PAGE
A Programing Code of Visual Basic 2010 96
B Design of Experiment Output (DoE) 104
C LNG Carrier Specification 111
D Gantt Chart of Project 116
E Production Process Flow Rate 117

CHAPTER I
INTRODUCTION
1. Introduction
Demand of liquid natural gas (LNG) is increased significantly due to demand
of natural resources from oil cannot meet the demand requirement. Natural gas as an
energy source is increasing importance as the world’s demand is expected to increase
by 53% between 2008 and 2035 (EIA, 2011). As a consequence of the increasing
market for LNG and uncertainty demand, the supply chain management has become
more complex and the need for decision support has become even more evident.
Consideration of real supply chain optimization issues for LNG including the
production volumes, liquefaction, transportation, storage, regasification and sales
volumes plays a very important rule for the decision making before the actual
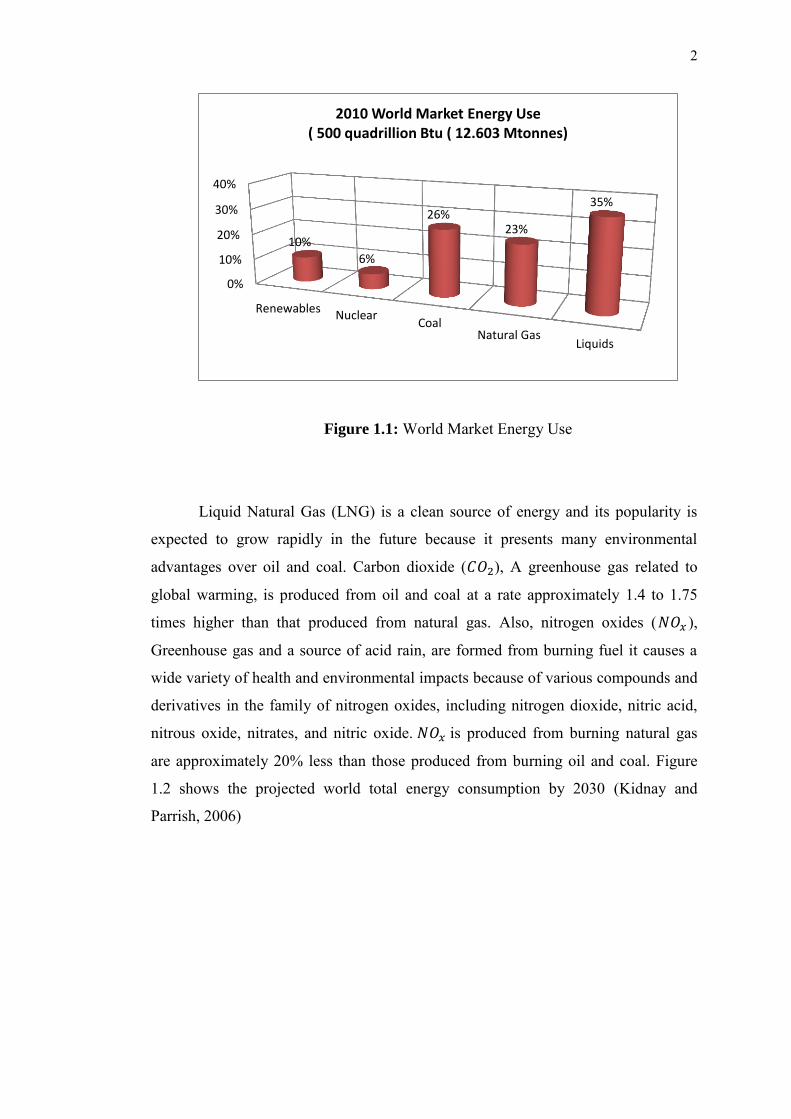
execution. In the world, Natural gas is a vital commodity in the global energy
market. It is summarized in Figure 1.1 Clearly; oil is the leading energy source, next
in importance, come coal and natural gas contributing almost 50% of the energy
sources (Energy Information Administration, 2010).
2
Figure 1.1: World Market Energy Use
Liquid Natural Gas (LNG) is a clean source of energy and its popularity is
expected to grow rapidly in the future because it presents many environmental
advantages over oil and coal. Carbon dioxide ( ), A greenhouse gas related to
global warming, is produced from oil and coal at a rate approximately 1.4 to 1.75
times higher than that produced from natural gas. Also, nitrogen oxides ( ),
Greenhouse gas and a source of acid rain, are formed from burning fuel it causes a
wide variety of health and environmental impacts because of various compounds and
derivatives in the family of nitrogen oxides, including nitrogen dioxide, nitric acid,
nitrous oxide, nitrates, and nitric oxide. is produced from burning natural gas
are approximately 20% less than those produced from burning oil and coal. Figure
1.2 shows the projected world total energy consumption by 2030 (Kidnay and
Parrish, 2006)
0%
10%
20%
30%
40%
RenewablesNuclear
CoalNatural Gas
Liquids
10%
6%
26% 23%
35%
2010 World Market Energy Use ( 500 quadrillion Btu ( 12.603 Mtonnes)

3
Figure 1.2: World Energy Consumption by Fuel. (EIA, 2007).
1.1 Overview of Liquefied Natural Gas (LNG) Market and Processing
The production of LNG has been practiced since the 1960’s. The core
concept in producing LNG is the condensation of natural gas. Other processing steps
involve the elimination of undesirable impurities and separation of byproducts. A
typical composition of natural gas is given in Table 1.1
0
50
100
150
200
250
300
1980 1990 2000 2010 2020 2030 2040
Oil
Natual Gas
Coal
Nuclear
Others
Year
World Total Energy Consumtion (Quadrillion
4
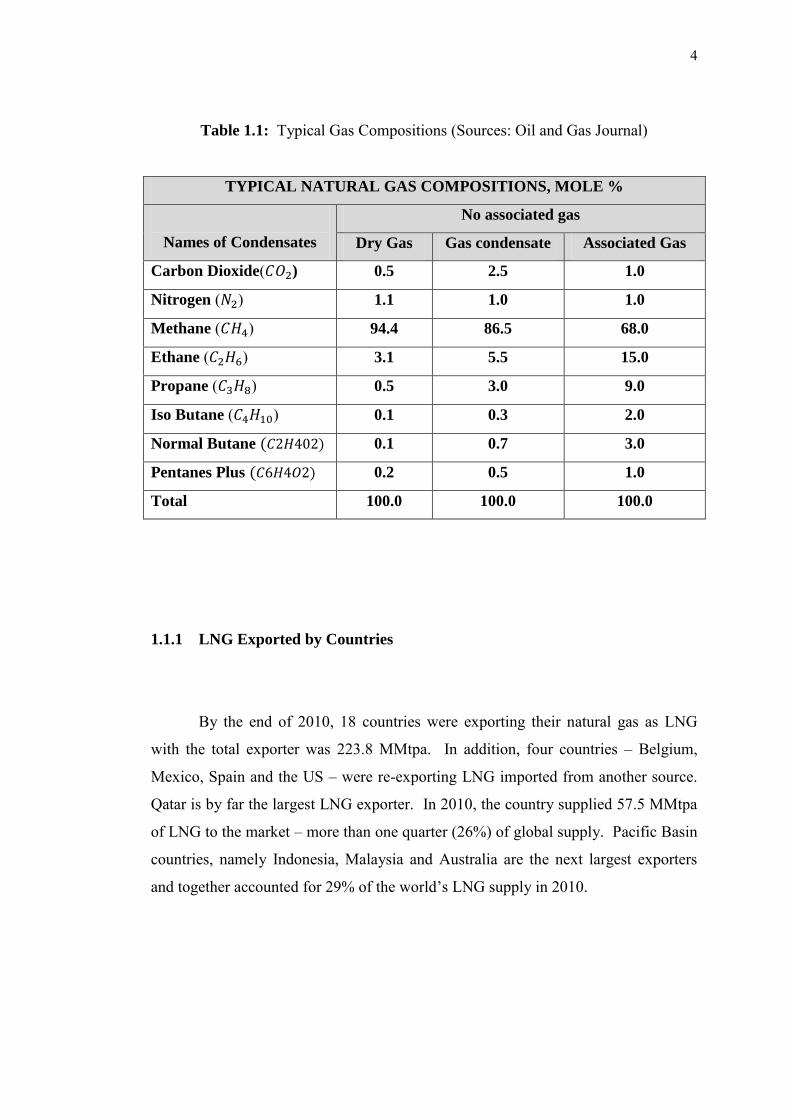
Table 1.1: Typical Gas Compositions (Sources: Oil and Gas Journal)
TYPICAL NATURAL GAS COMPOSITIONS, MOLE %
Names of Condensates
No associated gas
Dry Gas Gas condensate Associated Gas
Carbon Dioxide( ) 0.5 2.5 1.0
Nitrogen ( ) 1.1 1.0 1.0
Methane ( ) 94.4 86.5 68.0
Ethane ( ) 3.1 5.5 15.0
Propane ( ) 0.5 3.0 9.0
Iso Butane ( ) 0.1 0.3 2.0
Normal Butane 0.1 0.7 3.0
Pentanes Plus 0.2 0.5 1.0
Total 100.0 100.0 100.0
1.1.1 LNG Exported by Countries
By the end of 2010, 18 countries were exporting their natural gas as LNG
with the total exporter was 223.8 MMtpa. In addition, four countries – Belgium,
Mexico, Spain and the US – were re-exporting LNG imported from another source.
Qatar is by far the largest LNG exporter. In 2010, the country supplied 57.5 MMtpa
of LNG to the market – more than one quarter (26%) of global supply. Pacific Basin
countries, namely Indonesia, Malaysia and Australia are the next largest exporters
and together accounted for 29% of the world’s LNG supply in 2010.
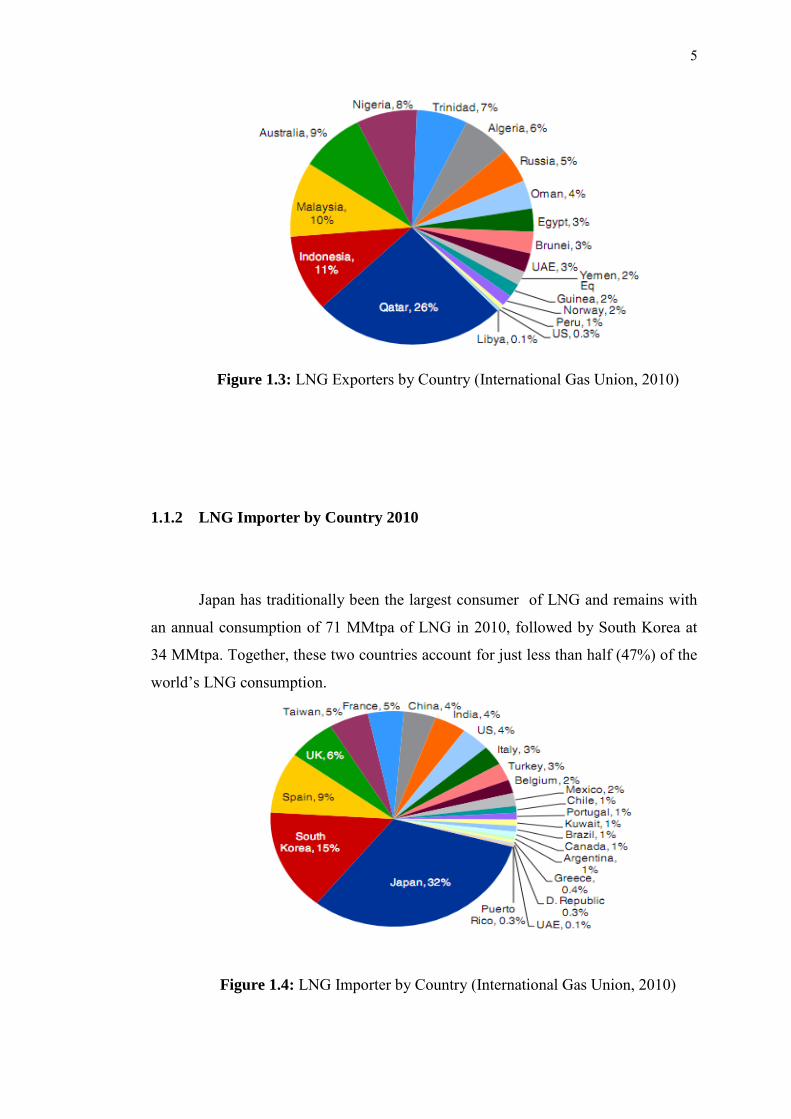
5
Figure 1.3: LNG Exporters by Country (International Gas Union, 2010)
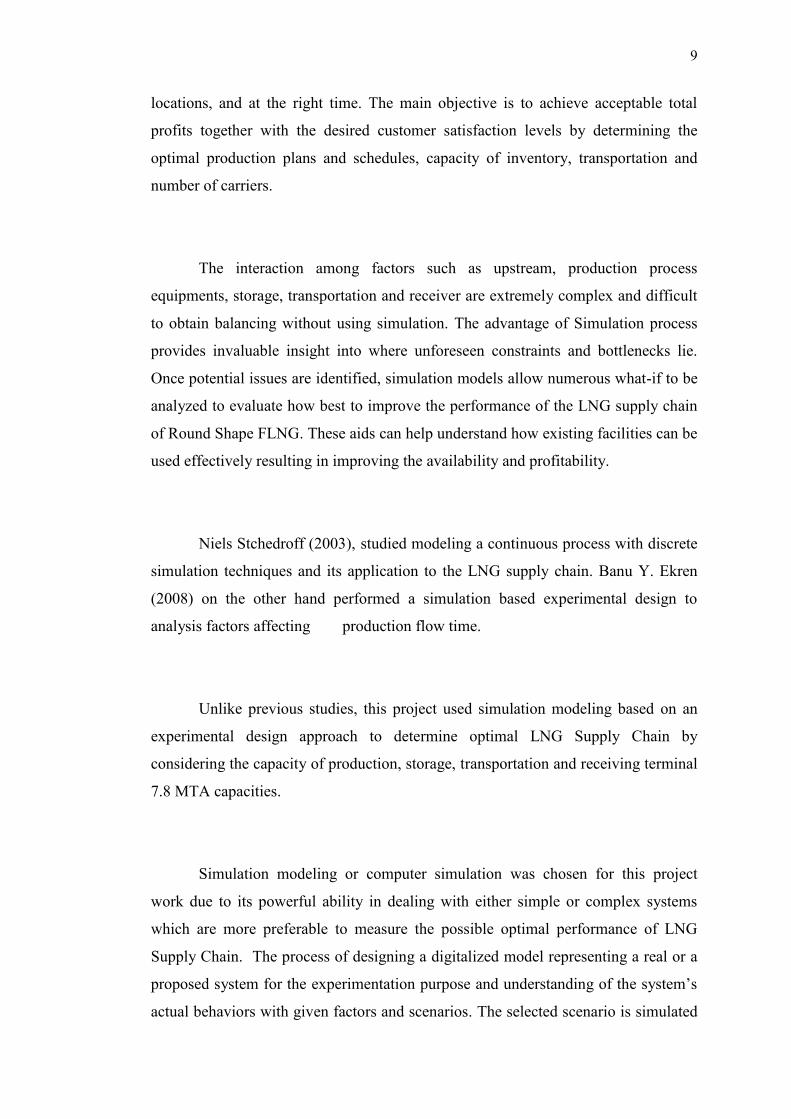
1.1.2 LNG Importer by Country 2010
Japan has traditionally been the largest consumer of LNG and remains with
an annual consumption of 71 MMtpa of LNG in 2010, followed by South Korea at
34 MMtpa. Together, these two countries account for just less than half (47%) of the
world’s LNG consumption.
Figure 1.4: LNG Importer by Country (International Gas Union, 2010)

6
1.1.3 Processing of LNG
The attention is turning to the potential of exploiting stranded offshore gas
field using floating production, liquefaction, storage and offloading vessels – floating
LNG is increased due to high demand and plenty of new small potential Natural
resources available in deep sea. Round shape FLNG represents a fast-track route to
obtain remote gas reserves which will help to bridge the expected supply shortfall in
worldwide LNG production, it causes the interest in the FLNG sector is growing
because of a lack of suitable onshore sites and pipeline infrastructure to offer
economic access to the large number of offshore mid-tier stranded gas reserves.
FLNG projects also offer reduced cost and schedule risk for operations in remote
onshore locations. It is also a mobile asset that can quickly be operated at other
locations.
Round shape FLNG concepts have a number of advantages over conventional
liquefaction plants for offshore resources, not only the ability to station the vessel
directly over distant fields, but also the ability to move the production facility to a
new location once the existing field is depleted.
Therefore, In the round shape FLNG concept, planning and operational
decision play a vital role in the success or failure of firm in determining the supply
chain capacity and design of storage. The challenge to achieving these objectives is
complicated because there are inextricably related and often conflicting. Therefore,
simulation modeling was used to quantify the true performance of a facility, enabling
alternative proposals to be evaluated to ascertain their true worth. This makes
decision-makers easy to identify and address unforeseen issues and exploit
commercial opportunities. The ability to “run the plant before it is built” through
simulation modeling ensures that the world’s leading manufacturers “get it right first
time.”

7
1.2 Background of Project
Any companies are linked to and interacted with other organizations, whether
it is suppliers, customers, third party logistics providers, or intermediaries. The
performance of a firm is dependent on the strengths and weaknesses of its partners in
the supply chain. The competition has moved from competition between firms at the
same level in the production process to competition between supply chains, from raw
materials to end customers. A company’s ability to create trust-based and long-term
business relationships with customers, suppliers, and other strategic partners
becomes an important competitive indicators. Therefore, Tendency towards
increased integration and cooperation between the enterprises in the supply chain
results in greater complexity in the management and control technology, which
requires increased coordination of resources and activities (Birgit and Tage, 2005).
Viewed from company’s activity, LNG can be considered a single product.
The process starts from under water production, liquefaction, storage, transportation
and regasification is shown in Figure.1.5 for conventional and Figure 1.6 for Floating
LNG supply chain process. A brief overview of each step along the chain is provided
below.
1) Extracting the natural gas from the geological strata
2) Transporting the gas via a pipeline(s) to a treatment and liquefaction
plant;
3) Conditioning and dehydrating the raw gas to remove impurities such as
carbon dioxide and water and the heavier hydrocarbons, which form
natural gas liquids such as liquid petroleum gas (LPG)
4) Liquefying the conditioned gas, through cooling, and storing it in
cryogenic tanks;
5) Loading the LNG into purpose built carrier vessels and transporting it to
international markets;
6) Unloading and storage at LNG receiving terminals;
7) Converting the LNG back to gaseous form by heat exchange; and
8) Distributing the natural gas to the consumer via gas transmission lines.

8
Upstream pilelineTreatment,
Liquefaction and
Export
Transportation Regasification
TerminalDistribution
Figure 1.5: Conventional LNG Supply Chain - from Upstream to Distribution
Receiving
Terminal
Transportation
Transportation
Regasification
Terminal
Distribution
Transportation
Distribution
FEED
Receiving
Terminal
Figure 1.6: Floating LNG supply chain process: from Upstream to Distribution
There are significant differences between conventional supply chain and
FLNG supply chain as mentioned above. For round shaped FLNG, The facility is
moored directly above the natural gas field. It routes Natural Gas from the field to
the facility via riser. When the gas reaches the facility, it is processed to produce
LNG, LPG, and condensate. The processed feed gas is treated to remove impurities,
and liquefied through freezing, before being stored in the hull. Ocean-going carriers
will offload the LNG, as well as the other liquid by-products, for delivery to markets
worldwide.
Supply chain management (SCM) is required to coordinate all input or output
flows so that products are produced and distributed in the right quantities, to the right
9
locations, and at the right time. The main objective is to achieve acceptable total
profits together with the desired customer satisfaction levels by determining the
optimal production plans and schedules, capacity of inventory, transportation and
number of carriers.
The interaction among factors such as upstream, production process
equipments, storage, transportation and receiver are extremely complex and difficult
to obtain balancing without using simulation. The advantage of Simulation process
provides invaluable insight into where unforeseen constraints and bottlenecks lie.
Once potential issues are identified, simulation models allow numerous what-if to be
analyzed to evaluate how best to improve the performance of the LNG supply chain
of Round Shape FLNG. These aids can help understand how existing facilities can be
used effectively resulting in improving the availability and profitability.
Niels Stchedroff (2003), studied modeling a continuous process with discrete
simulation techniques and its application to the LNG supply chain. Banu Y. Ekren
(2008) on the other hand performed a simulation based experimental design to
analysis factors affecting production flow time.
Unlike previous studies, this project used simulation modeling based on an
experimental design approach to determine optimal LNG Supply Chain by
considering the capacity of production, storage, transportation and receiving terminal
7.8 MTA capacities.
Simulation modeling or computer simulation was chosen for this project
work due to its powerful ability in dealing with either simple or complex systems
which are more preferable to measure the possible optimal performance of LNG
Supply Chain. The process of designing a digitalized model representing a real or a
proposed system for the experimentation purpose and understanding of the system’s
actual behaviors with given factors and scenarios. The selected scenario is simulated

10
using Visual Basic for the proposed strategies by considering the balancing of the
LNG supply chain.
1.3 Problem Statement
In the operation of a large LNG processing plant there are uncertainties
related to planning and realization of an optimal operation strategy. Demand of LNG
throughout the world has been increased significantly and followed by the increment
of LNG exploration to meet the requirement. Operating optimal production process
and utilization of equipments to meet the requirement are one of important thing that
must be considered before running the project to avoid losing money due to
inefficiency of related resources and over production. However, the importance of
including the whole production chain (upstream, treatment, liquefaction, storage,
transportation and regasification) in the optimization of the LNG supply chain can
impact to the profit of the project. The whole value needs to be maximized and
balanced to meet optimal utilization of facilities.
There are many possible operational issues will be faced in LNG supply
chain using round shape FLNG. Namely, determining the capacity of storage, LNG
carrier scheduling and terminal storage capacity. The optimal operation cannot be
obtained if one of those variables is not balanced and integrated.
Generally, the problem statement of this Project is how the optimal LNG
supply chain of Round-Shape FLNG project is built by integrating the supply chain
process started from FEED, production process, storage, transportation and receiving
terminal?
11
1.4 Project Objectives
The main objectives of this project are:
i. To identify the problem of Round-Shape FLNG supply chain.
ii. To develop maximal balancing capacity of the LNG supply chain starting from
FEED gas at upstream state, production, rounded-shape FLNG storage,
transportation and receiving terminal using simulation to meet optimal
production.
1.5 Project Questions
In order to achieve the rproject objectives mentioned above, the following
questions should be answered systematically.
How is Round Shape FLNG supply chain starting from FEED until
receiving terminal?
How to achieve optimal production output, capacity of round-shape FLNG
storage, transportation capacity and number of vessels needed by
considering Supply chain integration process?
What are alternative solutions to obtain an optimal capacity of FLNG
output, storage and carrier to meet demands?
What is the recommended solution to achieve optimal FLNG supply chain
from FEED to receiving terminal?
12
1.6 Expected Contributions of Research
This research will give contributions to FLNG companies to do planning,
operation and scheduling due to the changes of the LNG operation system.
For planning
Due to the increase of LNG demand and the global market competition
throughout the world, the demand will be fluctuated (uncertainty demand) it can
cause the company get difficulties in making decision on business investment.
However by using the designed simulation the company will be easier to see
various alternatives in decision making by modifying the existing simulation
before implementing it.
For operation
Efficient operation of LNG production is very important to get higher profit in
running the LNG business. In order to maximize the utilization of existing
facilities and find out the alternative improvements, using simulation is one of
the simplest ways, not only can visualize the process, but also show the
performances achieved by the facilities. From the information, the decision
maker can find as many as optimal alternatives as possible in order to get the
targeted profit. .
For Scheduling
Integration of every activity in the LNG supply chain of Round Shape FLNG is
very important. This project can help organizations or companies involved in
LNG supply chain operation.

13
1.7 Scope of Research
1. This project focuses on a LNG supply chain (SC) of Round Shape FLNG
starting from FEED, treatment process until receiving terminal that is from
Arapura Sea (Indonesia) to Osaka Receiving Terminal (Japan).
2. Only LNG product that was simulated in this project.
3. The receiving terminal was assumed in normal operation where the capacity
of the terminal can store all the delivered products.
1.8 Structure of Project
This report consists of six chapters, as summarized below:
Chapter 1 Introduction
Chapter 1 is the introduction of the study. This chapter explains about the research
statement, problem statement, objective of study, scope of study and matters that
have relate to the introduction of the project.
Chapter 2 Literature Review
Chapter 2 is the literature review of the project and contains on several topics related
to this study, describe definition, principle and approach used in conducting this
project. Topics reviewed include supply chain management optimization, strategic
supply chain optimization, design of supply chain, integration of supply chain,
supply chain in oil and gas, Floating LNG, Design of Experiment and Simulation
Modeling.
Chapter 3 Research Methodology
Chapter 3 which presents a feasible approach for achieving project’s goals.

14
Chapter 4 Case Study and Data Collection
This chapter is about the collected information related to the LNG Supply Chain
Chapter 5 Results and Discussion
Chapter 5 displays the result and data analysis using statistical analysis
Chapter 6 Conclusion
Chapter 6 consists of a summary of the whole study. Then, Findings of the research
are presented in brief. Finally, some future research is suggested.
1.9 Conclusion
This chapter highlighted a general introduction about the entire study. At the
beginning of this chapter, the introductions of supply chain management and supply
chain for LNG were briefly discussed. It was followed by the research statement and
the problems that this area is faced with. The objectives and scopes of the project
were stated to address the boundaries of the study. The significance of the study was
discussed. Lastly, the arrangement of the entire report was explained.

91
REFERENCES
Anderson. (2010). Transportation planning and inventory management in the LNG supply
chain. In E. Bj_rndal et al., (ed.), Energy, Natural resources and Environmental
Economics (pp.427-439). Springer, Berlin.
Anderson, E. (2003). Supply chain strategy in the oil and gas sector. Exploration
&Production: The Oil & Gas Review. Downloaded
Birgit D.J. and Tage S-L. (2005). Supply chain management – In theory and practice.
Copenhagen Business School Press.
Berger, B.D. and Anderson, K. E. (1992). Modern petroleum: A basic primer of the industry.
3rd ed. Tulsa, Okla: Pen Well Books
Cope Dayana et al (2007). Supply chain Simulation Modeling Made Easy : An Innovative
Approach. Proceeding Winter Simulation Conference. Orlando USA
Chopra, S., & Meindl, P. (2010). Supply chain management: Strategy, planning, and
operations (4rd ed.). New York: Prentice Hall
Collis, J. and Hussey, R. (2003). Business research. A practical guide for undergraduate
and postgraduate students. Palgrave Macmillan: New York, 2nd ed.
Cho, J. H., H. Kotzot, F. de la Vega, C. Durr. (2005). Large LNG carrier poses economic
advantages, technical challenges. LNG Observer 2. October
Christiansen, M., K. Fagerholt, D. Ronen. (2004). Ship routing and scheduling: Status and
perspectives. Transportation Science.
92
Draft Environmental Impact Statement. Downloaded from www.shell.com.au/prelude.
Durrer, E.J., G.E. Slater. (1977). Optimization of petroleum and natural gas production - A
survey. Management Science.
EIA. (2003). The global liquid natural gas market: Status and outlook. U.S. Energy
Information Administration.
Fisher, M.L. (1997). What is the right supply chain for your product? Harvard Business
Review, March-April, 105-116.
Foti, D.A. (2006). Study spots downstream supply chain improvements. Oil and Gas
Journal, 104(21), 49-53
Foss and I. J. Halvorsen (2009). Dynamic optimization of the LNG value chain. In
Proceedings of the 1st annual gas processing symposium, Doha, Qatar.
Grnhaug, R., M. Christiansen, G. Desaulniers, J. Desrosiers. (2010). A branch-and-price
method for a liquid natural gas inventory routing problem. Transportation Science.
Halvorsen-Weare, E.E., K. Fagerholt. (2010). Routing and scheduling in a liquid natural gas
shipping problem with inventory and berth constraints. Annuls of Operations
Research. Print ISSN 1381-1231 Springer US
Heever, J. (2004). The oil and gas supply chain Problems but also potential: manufactures
best practices. http://www.mmsmag.co.za/articledetail.aspx?id=104
Hugos, Michael. (2003) "Chapter 1 - Basic Concepts of Supply chain Management".
Essentials of Supply chain Management. John Wiley & Sons. ©.
Ilmars Kerbers, Graham Hartnell, A Breakthrough for Floating LNG ?, Poten & Partners.
New York. Downloaded from internet.
Jaswar (2010). Study on Process Facility of Floating Liquefied Natural Gas. Asia-Pacific
Offshore Conference-APOC2010. Kuala Lumpur.
93
Jaswar..el. (2011). Fluid Simulation of Generation Acid Gas Removal Process In Floating
LNG Production Vessel. The 11th Asian International conference on Fluid Machinery.
India
Kleijnen, J. P. C., S. M. Sanchez, T.W. Lucas, and T. M. Cioppa. (2005)., State-of-the-Art
Review: A User’s Guide to the Brave New World of Designing Simulation
Experiments. Journal on Computing 17(3) : 263–289.
Klatch Wally. (2005). Supply chain for Liquids. Olami, Inc., New York
Kuwaharal ( 2000). Liquefied natural gas supply optimization. Energy Conversion &
management 41, 153-161. Paragon
Law, A. M., and W. D. Kelton (2000). Simulation Modeling and Analysis, 3rd ed. McGraw-
Hill, New York
Lasschuit, W., Thijssen, N ( 2004). Supporting supply chain planning and scheduling
decisions in the oil and chemical industry. Comput. Chem. Eng. J.
Min H & Zhou G (2002) Supply chain modelling: past, present and future. Computers &
Industrial Engineering 43: 231-249.
Montgomery, D. C. (2001). Design and Analysis of Experiments, 5th edition, John Wiley &
Sons, Inc.
Mentzer, J.T. et al. (2001): Defining Supply chain Management, in: Journal of Business
Logistics, Vol. 22, No. 2, 2001, pp. 1–25
Nayani, N., and M. Mollaghasemi (1998). Validation and verification of the simulation
model of a photolithography process in semiconductor manufacturing. Proceedings of
the 1998 Winter Simulation Conference Piscataway, New Jersey: Institute of Electrical
and Electronics Engineers, Inc.
Ozelkan Ertunga, D’Ambrosio Alfred, Teng Gary. (2008). Optimizing liquid natural gas
terminal design for effective supply chain operation. International Journal of
production economics, 529-542. Elsevier
94
Shell Development (Australia) Proprietary. (2009). Prelude Floating LNG Project.
Shutz, P., A. Tomasgard, S. Ahmed.( 2009). Supply chain design under uncertainty using
sample average approximation and dual decomposition. European Journal of
Operational Research
Simchi-Levi, et al (2002). "Introduction to Supply chain Management." pp. 1-21. ISBN:
007249256
Smith, E. N., J. W.et al (2004). Liquid natural gas imports and their impact on the state,
regional, and national economies. Entergy-Tulane Energy Institute.
Simchi-Levi, D., Kaminsky, P., & Simchi-Levi, E. (1999). Designing and Managing the
Supply chain; Concepts, Strategies, and Case Studies, Irwin/McGraw-Hill,
Solutions for the Oil & Gas Industry. (2006). Optimizing the LNG Value Chain
www.siemens.com/oil-gas Sadler, I. (2007). Logistics and supply chain integration.
SAGE Publications Ltd, LA, London, ND, Singapore.
Tomasgard, A., Rømo, F., Fodstad, M., Midthun, K., (2007). Optimization Models for the
Natural Gas Value Chain. Geometric Modeling, Numerical Simulation, and
Optimization. Springer, pp. 521–558.
Waters, D. (2003). Logistics: An introduction to supply chain management. Palgrave
Macmillan, China.