Embed Size (px)
Citation preview
1 Journal of Agricultural Machinery Vol. 10, No. 1, Spring - Summer 2020
های کشاورزیماشین نشریه
59-72ص ،1399نیمسال اول ، 1شماره ، 10جلد
Journal of Agricultural Machinery
Vol. 10, No. 1, Spring- Summer 2020, p. 59-72
Optimization of Refinement Operations of Sugarcane Harvester Hydraulic Oil
H. Nematpour Malek Abad1, M. J. Sheikhdavoodi
2*, I. Hazbavi
3, A. Marzban
4
Received: 11-10-2018
Accepted: 02-01-2019
Abstract
The purpose of this study was to model and optimize the offline refinement operations of sugarcane harvester hydraulic oil using RSM. For this purpose, the effects of independent variables of operating hours (250, 500 and 750 hours), Twin Dip Filter Mesh (7, 9 and 11 microns) and hydraulic oil refining times (0, 1 and 2) on variables of water contamination, uncleanness level (NAS), silicon (Si), viscosity (Vis) and oil acid number (TAN) were evaluated. The results indicated that all models were suitable for water contamination, uncleanness level (NAS), silicon (Si), viscosity (Vis) and oil acid number (TAN) for describing experimental data. In addition, the desirability function showed that the optimum conditions for the offline refinement operations of the hydraulic oil of the sugar cane harvester included 728.61 operating hours, the 7-micron filter mesh, and the two refining times of the oil. Under this condition, the amount of water contamination, the uncleanness level (particles 5 to 15 micrometers), Vis, Si, and TAN were equal to 187.63 ppm, 234000, 5.91 ppm, 66.34 centistokes and 0.65 (mg KOH g
-1), respectively.
Keywords: Offline Refinement of Hydraulic Oil, Optimization, Response Surface Method, Sugarcane harvester
Introduction1
One of the important items in mechanical equipment and in general agricultural machines is the entry of contaminations including water, fuel, silica, chips, soot particles, etc. into hydraulic systems and engine oils. All mechanical equipment that uses oil for lubrication or power transmission, are always affected by the quality of the oil. In fact, Contamination is the enemy of hydraulic systems and other mechanical systems under lubrication which passes through sensitive parts or the environment via lubricant and causes damage to them. Oil contamination in mechanical systems causes major problems such as machine failure, undesired repairs, loss of oil life, etc., which directly affects the
1- PhD Graduate of agricultural mechanization, Department of Biosystems Engineering, Shahid Chamran University of Ahvaz, Iran 2- Professor, Department of Biosystems Engineering, Shahid Chamran University of Ahvaz, Iran 3- Assistant Professor, Department of Biosystems Engineering, Lorestan University, Khorramabad, Iran 4- Associate Professor, Agricultural Sciences and Natural Resources University of Khuzestan, Mollasani, Iran (*- Corresponding Author Email: [email protected])
DOI: 10.22067/jam.v10i1.75912
efficiency of the equipment and consequently the efficiency of the production and causes unforeseen costs. Using clean oils, removing and controlling contaminants will have many benefits including minimizing equipment failure, reducing operational and repair costs, increasing the operational efficiency of the equipment and increasing the lifespan of the oil. Types of contamination of oils include physical and chemical contaminants. The physical contaminant is the same as solid particles with oil, the most important consequence of which is mechanical erosion. Chemical contaminants generally include water, some metals such as copper and materials produced via oil usage. Therefore, there are two solutions to prevent such problems. First, evacuate all oil from the system and substitute with fresh oil or by filtration, separate particles from contaminated oil (Masoudi, 2011; Ranjbar et al., 2003; Saghafi, 2008). Cargol (2005) identified most of the internal problems of machines by analyzing oil, and mentioned that doing these tests is effective for initial troubleshooting and performance enhancement. Macnian et al. (2006) in a study determined the time of detection and the degree of failure using oil analysis on diesel engines and the fuzzy logic.
60 Journal of Agricultural Machinery Vol. 10, No. 1, Spring - Summer 2020
This would prevent the car from breaking down, failure and suspension. Macinan et al. (2003) stated that if the erosion rate is 100 ppm, an increase of 50% is a significant warning sign to increase erosion of the devices. Qingfei He (2009) reported that the condition monitoring of machines helps prevent the destruction of machines via analyzing oils, corrosive particles, and oil contaminants. Li Jie (2010) considered the use of oil analysis programs for compressors to predict and prevent early failure of the compressors, as well as the optimal use of oil in compressors. Unfortunately, although the use of suitable oils in machinery is very necessary, there is no definite research in this regard and only parts have been mentioned in different books. One of the most important sources of sugar production is sugarcane. Sugar is one of the eight human food sources (wheat, rice, corn, sugar, cattle, sorghum, millet and cassava). Also, sugarcane is mainly used for livestock feed, electricity generation, fiber and fertilizer and in many countries sugarcane is accounted as a renewable source for biofuel (Haroni et al., 2018). Therefore, the present research was conducted with the aim of optimizing the offline refinement operations of hydraulic oil of sugar cane harvester by examining the effects of independent variables of the operating hours (250, 500 and 750 hours), twin spin filter mesh (7, 9 and 11 microns), and the hydraulic oil refining times (0, 1 and 2) on dependent variables of water contamination, uncleanness level, Si, Vis and TAN (Masoudi, 2011).
Materials and Methods
Materials
The main raw materials used in the present study were hydraulic oil samples taken from cane harvesters (Austoft, 7000). The reason for choosing this model was due to its common use in cultivating the sugarcane industry in Khuzestan province). Equipment and Appliances
For every oil-tested experiment, an example representative of the entire system was needed. Sampling is the easiest stage to run an oil analysis program, but it is very important and
if the sampling is not correct, the results of the oil tests will not be valid. The main items in the oil sampling are the selection of tools, determination of sampling frequencies for different components, determination of oil sampling points in different components and oil sampling method. Some equipment was used for sampling such as 1- Sampling pump (Manual suction pump), 2- Polyethylene tube (hoses with an external diameter of one quarter or five sixteen inches), 3- Sample carrying case (Masoudi, 2003). All of the oil samples, after encoding and labeling, with a fresh and unused oil sample, were sent to the Alborz Tadbir Khuzestan Technical & Engineering Co. Laboratory (Address: 127 Azadi, km 5, Asia Road, Mashhad, IRAN) from the sample of the hydraulic oils tested. Determination of the Exact Amount of Water in the Oil (water contamination)
The amount of water in the oil was measured by the Karl Fischer test. The result of the test reports the exact amount of water in ppm. This test, known as Crackle Test, used to identify the approximate level of water contamination in the oil. In this way, a few drops of oil are poured on a hot plate (approximately 150 ˚C). If water is present in the oil, it will be bubbled out and removed from the oil. The amount of water in hydraulic oil should not exceed 500 ppm (ISO 760, 1978). Determination of the Uncleanness Level of Oil
Uncleanness level of oil is one of the important parameters that is mainly studied in the evaluation of hydraulic equipment and systems. The presence of impurities in the environment indicates how the filters and vents operate. Counting the solid particles in hydraulic oil was accomplished using an automatic laser method. In this method, the number of corn oil particles can be counted by the resulted shadow of laser waves. Typical uncleanness levels are usually considered for a hydraulic oil sugarcane harvester; the number of particles from 5 to 15 micrometers in oil should not exceed 256000 (ISO 4406, 1999). Determination of the Si Amount
Silicon (Si), an anti-foaming agent in oil, if exceeds the standard limit, is considered as an
Optimization of Refinement Operations of Sugarcane Harvester Hydraulic Oil 61
oil contaminant. In order to specify the available amount of Si in hydraulic oil, an elemental analyzer device was used. The amount of Si in hydraulic oil should not exceed 15 ppm (ASTM D6595, 2011). Viscosity measurement of oil
Viscosity is the most important feature of lubricating oils. The viscosity test shows the internal resistance of the lubricant to the oozing. The viscosity test is normally done at temperature of 40 ˚C and 100 ˚C. Viscosity affected by factors such as the amount of oil function, oil content, contamination, composition, and other abnormalities affecting the service life of the oil. A capillary tube viscometer was used to measure viscosity in the laboratory. In this method, the oil sample is placed into the glassy U-shaped capillary tube and using a suction pump, the sample moves towards the starting point which has been specified on the tube. The suction pump is stopped and then, it is allowed that the sample moves in the opposite direction to the suction due to the gravity. The thin part of the capillary tube controls the velocity of oil flow. The oils with high viscosity take more time than the oils with low viscosity because the flow velocity inside the capillary tube is determined by yielding stress of the oil which is influenced by gravity. In fact, this test measures the kinematic viscosity of the oil. The standard guides for this method are ASTM D445 and ISO 3104. The viscosity of the hydraulic oil should not be changed from ±10% of fresh oil. The viscosity of fresh and used oil is determined in Cst (ASTM D 2270, 2010). Measurement of the Total Acid Number (TAN)
The total acid number of oil indicates the acidity of the oil. TAN of the oil usually increases gradually with a slight slope. Oils have undergone a qualitative change over time due to various factors such as heat and contamination, where the acid number represents one of the indicators of these changes. The total acid number of hydraulic oil should not be increased by more than 0.2% toward the acid number of the fresh oil. The total acid number of hydraulic oil is measured
by the titration method and is determined in (mg KOH g
-1) (ISO 6619, 1988).
Experimental Design and Statistical Analysis
The purpose of the present study was to optimize the refinement operations of the hydraulic oil of sugarcane harvester using the RSM method. For this purpose, the effects of independent numerical variables (operating hours, twin suction filter mesh) and categorical (hydraulic oil refinement times) on dependent variables of water contamination, uncleanness level, Vis, Si, and TAN were evaluated. For this purpose, the central composite design used in the Design Expert software included independent variables of work hours (250, 500 and 750 hours), twin suction filter mesh (7, 9 and 11 microns), and the number of hydraulic oil refinements (0, 1 and 2) with 33 treatments and 3 replications at the central point. Table (1) shows the encoded values and different levels of independent variables used for offline hydraulic oil refinement. Table (2) presents the test conditions and the response values obtained for the central composite design used to refine the offline hydraulic oil.
Data analysis was conducted using Design expert 7 software. Experimental data were also tested using the quadratic polynomial equation (Singh et al., 2010).
(1)
Where : Regression coefficients for constant factor coefficients ( ), Linear effect coefficient ( , and ), second-degree effect coefficients ( , and ) and interaction effect coefficient ( , and ). Y: The dependent variables or the desired responses include water contamination, uncleanness level, Vis, Si, and TAN. In analysis of a process, one qualitative factor is not considered, but multipurpose optimization is sought. The purposes are in contradiction with each other and have an inverse relationship. One of the problems solving methods of multipurpose issues is combining the response surfaces or the mentioned graphical solution.
62 Journal of Agricultural Machinery Vol. 10, No. 1, Spring - Summer 2020
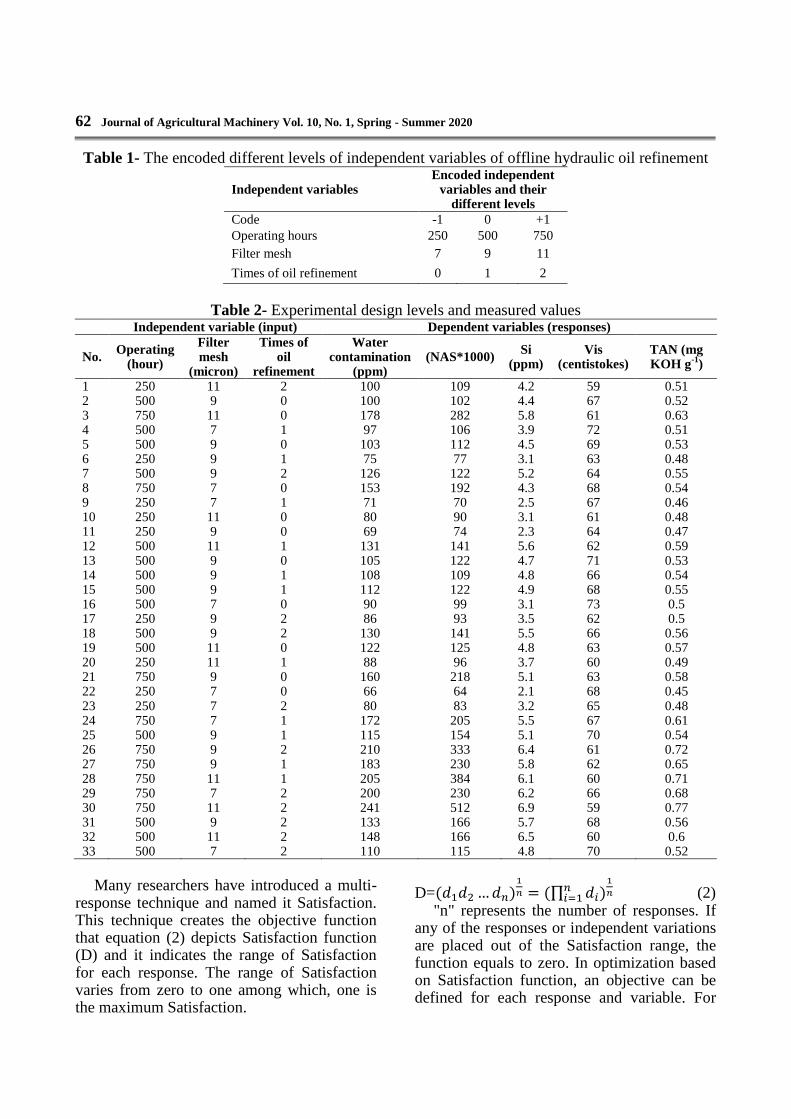
Table 1- The encoded different levels of independent variables of offline hydraulic oil refinement
Independent variables Encoded independent
variables and their different levels
Code -1 0 +1
Operating hours 250 500 750
Filter mesh 7 9 11
Times of oil refinement 0 1 2
Table 2- Experimental design levels and measured values
Independent variable (input) Dependent variables (responses)
No. Operating
(hour)
Filter mesh
(micron)
Times of oil
refinement
Water contamination
(ppm) (NAS*1000)
Si (ppm)
Vis (centistokes)
TAN (mg KOH g
-1)
1 250 11 2 100 109 4.2 59 0.51 2 500 9 0 100 102 4.4 67 0.52 3 750 11 0 178 282 5.8 61 0.63 4 500 7 1 97 106 3.9 72 0.51 5 500 9 0 103 112 4.5 69 0.53 6 250 9 1 75 77 3.1 63 0.48 7 500 9 2 126 122 5.2 64 0.55 8 750 7 0 153 192 4.3 68 0.54 9 250 7 1 71 70 2.5 67 0.46 10 250 11 0 80 90 3.1 61 0.48 11 250 9 0 69 74 2.3 64 0.47 12 500 11 1 131 141 5.6 62 0.59 13 500 9 0 105 122 4.7 71 0.53 14 500 9 1 108 109 4.8 66 0.54 15 500 9 1 112 122 4.9 68 0.55 16 500 7 0 90 99 3.1 73 0.5 17 250 9 2 86 93 3.5 62 0.5 18 500 9 2 130 141 5.5 66 0.56 19 500 11 0 122 125 4.8 63 0.57 20 250 11 1 88 96 3.7 60 0.49 21 750 9 0 160 218 5.1 63 0.58 22 250 7 0 66 64 2.1 68 0.45 23 250 7 2 80 83 3.2 65 0.48 24 750 7 1 172 205 5.5 67 0.61 25 500 9 1 115 154 5.1 70 0.54 26 750 9 2 210 333 6.4 61 0.72 27 750 9 1 183 230 5.8 62 0.65 28 750 11 1 205 384 6.1 60 0.71 29 750 7 2 200 230 6.2 66 0.68 30 750 11 2 241 512 6.9 59 0.77 31 500 9 2 133 166 5.7 68 0.56 32 500 11 2 148 166 6.5 60 0.6 33 500 7 2 110 115 4.8 70 0.52
Many researchers have introduced a multi-
response technique and named it Satisfaction. This technique creates the objective function that equation (2) depicts Satisfaction function (D) and it indicates the range of Satisfaction for each response. The range of Satisfaction varies from zero to one among which, one is the maximum Satisfaction.
D=
∏
(2) "n" represents the number of responses. If
any of the responses or independent variations are placed out of the Satisfaction range, the function equals to zero. In optimization based on Satisfaction function, an objective can be defined for each response and variable. For
Optimization of Refinement Operations of Sugarcane Harvester Hydraulic Oil 63
instance, there are some favorable interventions in which the response of y1 and y2 would be maximum and minimum respectively, provided that X1 would be in the specific range, X2 exactly equal to the specific number and X3 would be maximum (Qasemi et al., 2015).
Results and Discussion
Water contamination modeling
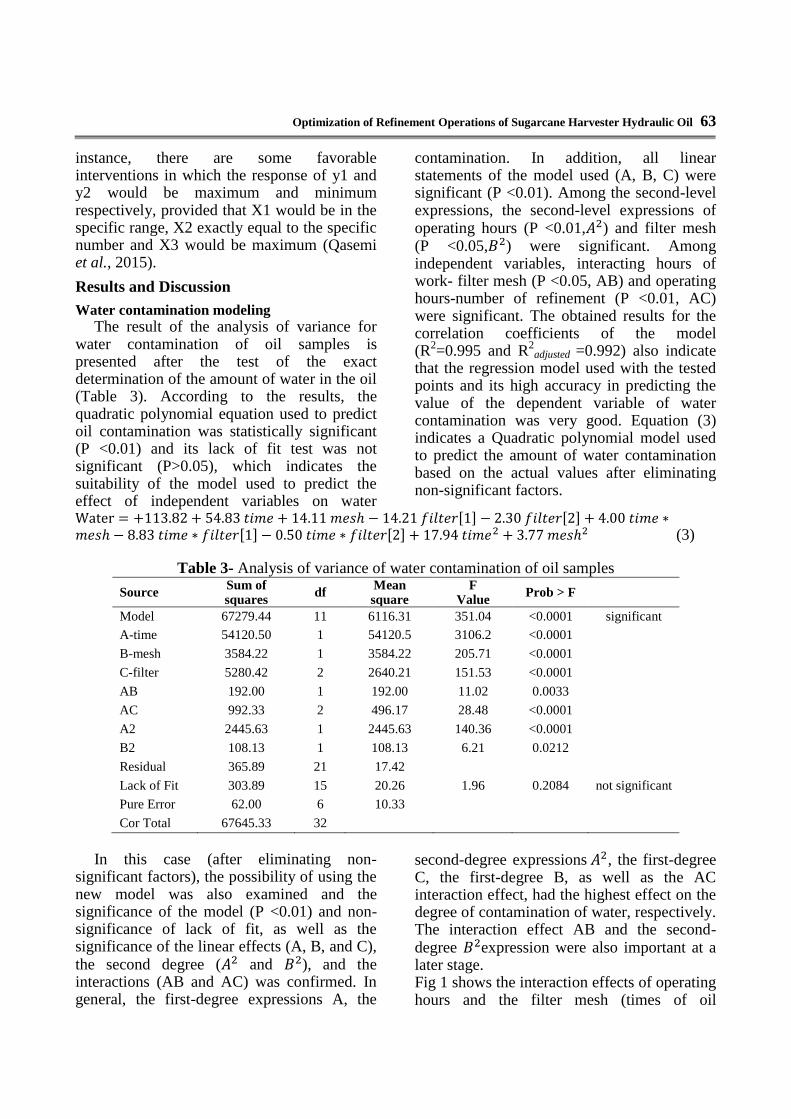
The result of the analysis of variance for water contamination of oil samples is presented after the test of the exact determination of the amount of water in the oil (Table 3). According to the results, the quadratic polynomial equation used to predict oil contamination was statistically significant (P <0.01) and its lack of fit test was not significant (P>0.05), which indicates the suitability of the model used to predict the effect of independent variables on water
contamination. In addition, all linear statements of the model used (A, B, C) were significant (P <0.01). Among the second-level expressions, the second-level expressions of operating hours (P <0.01, ) and filter mesh (P <0.05, ) were significant. Among independent variables, interacting hours of work- filter mesh (P <0.05, AB) and operating hours-number of refinement (P <0.01, AC) were significant. The obtained results for the correlation coefficients of the model (R
2=0.995 and R
2adjusted =0.992) also indicate
that the regression model used with the tested points and its high accuracy in predicting the value of the dependent variable of water contamination was very good. Equation (3) indicates a Quadratic polynomial model used to predict the amount of water contamination based on the actual values after eliminating non-significant factors.
[ ] [ ] [ ] [ ] (3)
Table 3- Analysis of variance of water contamination of oil samples
Source Sum of squares
df Mean square
F Value
Prob > F
Model 67279.44 11 6116.31 351.04 <0.0001 significant
A-time 54120.50 1 54120.5 3106.2 <0.0001
B-mesh 3584.22 1 3584.22 205.71 <0.0001
C-filter 5280.42 2 2640.21 151.53 <0.0001
AB 192.00 1 192.00 11.02 0.0033
AC 992.33 2 496.17 28.48 <0.0001
A2 2445.63 1 2445.63 140.36 <0.0001
B2 108.13 1 108.13 6.21 0.0212
Residual 365.89 21 17.42
Lack of Fit 303.89 15 20.26 1.96 0.2084 not significant
Pure Error 62.00 6 10.33
Cor Total 67645.33 32
In this case (after eliminating non-
significant factors), the possibility of using the new model was also examined and the significance of the model (P <0.01) and non-significance of lack of fit, as well as the significance of the linear effects (A, B, and C), the second degree ( and ), and the interactions (AB and AC) was confirmed. In general, the first-degree expressions A, the
second-degree expressions , the first-degree C, the first-degree B, as well as the AC interaction effect, had the highest effect on the degree of contamination of water, respectively. The interaction effect AB and the second-degree expression were also important at a later stage. Fig 1 shows the interaction effects of operating hours and the filter mesh (times of oil
64 Journal of Agricultural Machinery Vol. 10, No. 1, Spring - Summer 2020
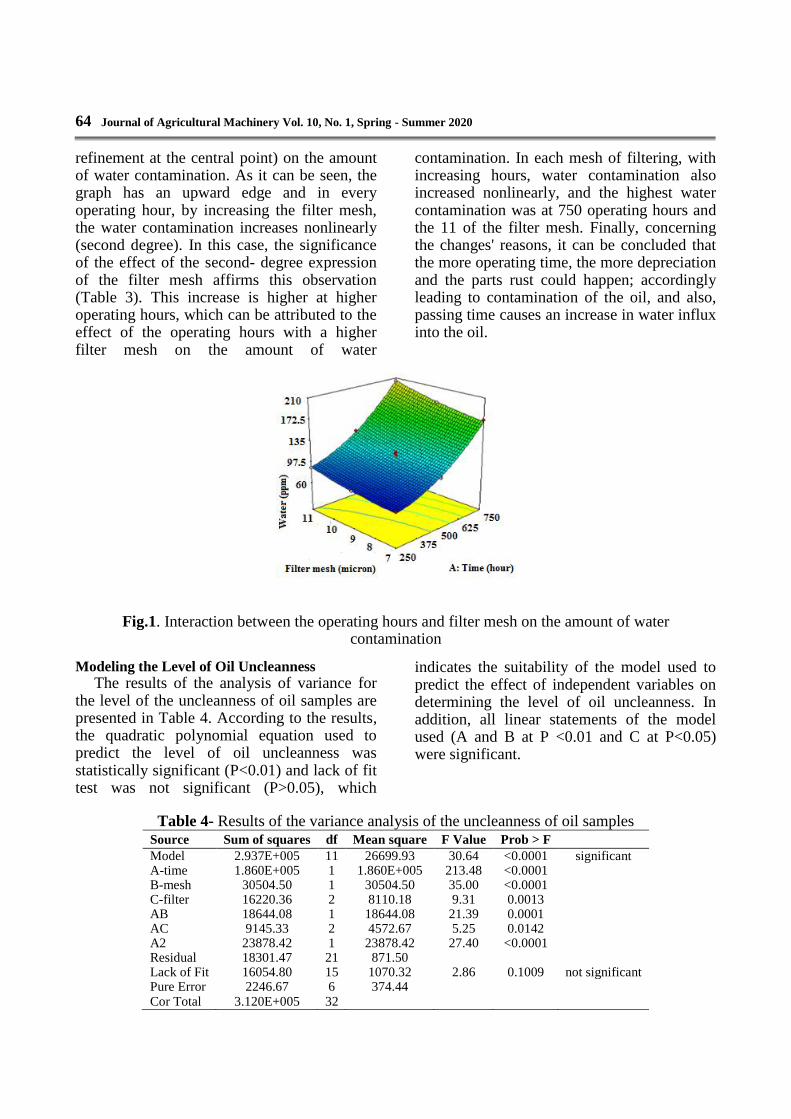
refinement at the central point) on the amount of water contamination. As it can be seen, the graph has an upward edge and in every operating hour, by increasing the filter mesh, the water contamination increases nonlinearly (second degree). In this case, the significance of the effect of the second- degree expression of the filter mesh affirms this observation (Table 3). This increase is higher at higher operating hours, which can be attributed to the effect of the operating hours with a higher filter mesh on the amount of water
contamination. In each mesh of filtering, with increasing hours, water contamination also increased nonlinearly, and the highest water contamination was at 750 operating hours and the 11 of the filter mesh. Finally, concerning the changes' reasons, it can be concluded that the more operating time, the more depreciation and the parts rust could happen; accordingly leading to contamination of the oil, and also, passing time causes an increase in water influx into the oil.
Fig.1. Interaction between the operating hours and filter mesh on the amount of water
contamination
Modeling the Level of Oil Uncleanness
The results of the analysis of variance for the level of the uncleanness of oil samples are presented in Table 4. According to the results, the quadratic polynomial equation used to predict the level of oil uncleanness was statistically significant (P<0.01) and lack of fit test was not significant (P>0.05), which
indicates the suitability of the model used to predict the effect of independent variables on determining the level of oil uncleanness. In addition, all linear statements of the model used (A and B at P <0.01 and C at P<0.05) were significant.
Table 4- Results of the variance analysis of the uncleanness of oil samples Source Sum of squares df Mean square F Value Prob > F Model 2.937E+005 11 26699.93 30.64 <0.0001 significant A-time 1.860E+005 1 1.860E+005 213.48 <0.0001 B-mesh 30504.50 1 30504.50 35.00 <0.0001 C-filter 16220.36 2 8110.18 9.31 0.0013 AB 18644.08 1 18644.08 21.39 0.0001 AC 9145.33 2 4572.67 5.25 0.0142 A2 23878.42 1 23878.42 27.40 <0.0001 Residual 18301.47 21 871.50 Lack of Fit 16054.80 15 1070.32 2.86 0.1009 not significant Pure Error 2246.67 6 374.44 Cor Total 3.120E+005 32
Optimization of Refinement Operations of Sugarcane Harvester Hydraulic Oil 65
Among the second-degree expressions, the only second-degree expression operating hours (A
2 at P <0.01) was significant. Among the
independent variables, the interaction of operating hours-filter mesh (AB at P <0.01) and operating hours-frequency of refinement (AC at P <0.05) were significant. The obtained results for the correlation coefficients of the model (R
2=0.941, R
2adjusted= 0.911) also
indicate a very good correlation between the regression model used with the tested points and its high accuracy in predicting the value of the dependent variable on the level of oil uncleanness. Equation (4) shows a quadratic polynomial model used to predict the level of the uncleanness of oil based on the actual values after eliminating non-significant factors.
[ ] [ ] [ ] [ ]
(4)
In this case (after eliminating non-significant factors), it was also possible to use the new model and the significance of the model (P<0.01) and non-significance of the lack of fit and also the significance of linear effects (A, B, And C), second degree ( ) and interactions (AB and AC) was confirmed. Generally, the first-degree expressions A, the
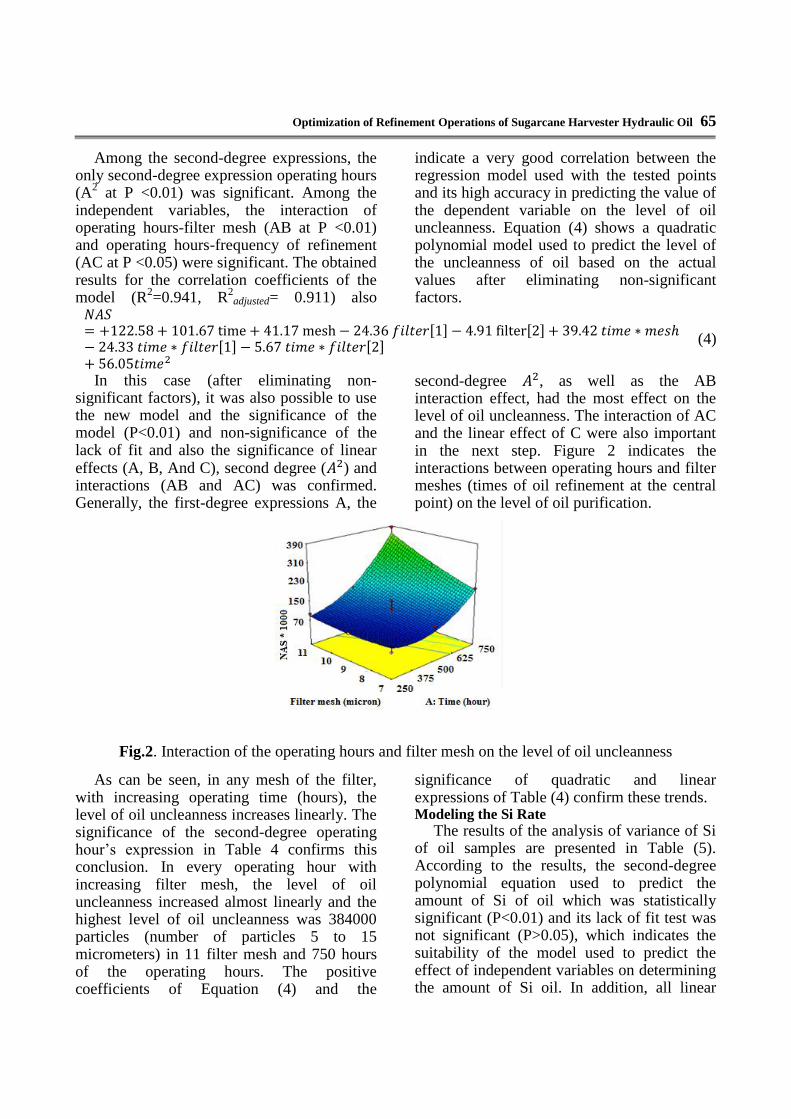
second-degree , as well as the AB interaction effect, had the most effect on the level of oil uncleanness. The interaction of AC and the linear effect of C were also important in the next step. Figure 2 indicates the interactions between operating hours and filter meshes (times of oil refinement at the central point) on the level of oil purification.
Fig.2. Interaction of the operating hours and filter mesh on the level of oil uncleanness
As can be seen, in any mesh of the filter, with increasing operating time (hours), the level of oil uncleanness increases linearly. The significance of the second-degree operating hour’s expression in Table 4 confirms this conclusion. In every operating hour with increasing filter mesh, the level of oil uncleanness increased almost linearly and the highest level of oil uncleanness was 384000 particles (number of particles 5 to 15 micrometers) in 11 filter mesh and 750 hours of the operating hours. The positive coefficients of Equation (4) and the
significance of quadratic and linear expressions of Table (4) confirm these trends. Modeling the Si Rate
The results of the analysis of variance of Si of oil samples are presented in Table (5). According to the results, the second-degree polynomial equation used to predict the amount of Si of oil which was statistically significant (P<0.01) and its lack of fit test was not significant (P>0.05), which indicates the suitability of the model used to predict the effect of independent variables on determining the amount of Si oil. In addition, all linear
66 Journal of Agricultural Machinery Vol. 10, No. 1, Spring - Summer 2020
statements of the model used (A, B, and C) were significant (P<0.01).
Among the second-degree expressions, the only second-degree expression the operating hours (A
2 at P <0.01) was significant. The
obtained results for the correlation coefficients
of the model (R2= 0.971, R
2adjusted= 0.956) also
indicate a very good correlation of the regression model used with the tested points and its high precision in predicting the value of the dependent variable of the amount of Si of oil.
Table 5- Analysis of variance of Si in samples of oil Source Sub of squares df Mean square FValue Prob > F
Model 50.64 11 4.60 64.47 <0.0001 significant A-time 33.08 1 33.08 463.21 <0.0001 B-mesh 6.84 1 6.84 95.86 <0.0001 C-filter 8.78 2 4.39 61.51 <0.0001 A2 1.58 1 1.58 22.15 0.0001 Residual 1.50 21 0.071 Lack of Fit 1.28 15 0.085 2.33 0.1523 not significant Pure Error 0.22 6 0.037 Cor Total 52.14 32
Equation (5) shows a second-degree
polynomial model used to predict the amount of Si of oil based on the actual values after eliminating non-significant factors. [ ] [ ] (5)
In this case (after eliminating non-significant factors), the possibility of using the new model was also examined and the significance of the model (P<0.01) and non-significance of the lack of fit and also the significance of linear effects (A, B, and C) and the second degree ( ) were confirmed. In general, the first-degree expression of the model (A, B and C) and the second-degree expression had the most effect on the amount of Si of oil. Modeling the Viscosity Rate of Oil
The results of the variance analysis of Vis of oil samples are presented in Table 6. According to the results, the second-degree polynomial equation used to predict the viscosity of oil was statistically significant (P<0.01) and its lack of fit test was not significant (P>0.05), which indicates the suitability of the model used to predict the effect of independent variables on Vis of oil; in addition, linear statements of the model used, B (P<0.01) and C (P<0.05) were significant. Among the second-degree expressions, the only second-degree expression of the operating hours (A
2 at
P<0.01) was significant. The results obtained for the correlation coefficients of the model (R
2= 0.913, R
2adjusted=0.867) also indicate a
very good fit of the regression model used with the tested points and its high accuracy in predicting the value of the dependent variable of the viscosity of the oil. Equation (6), the second-degree polynomial model used to predict the viscosity of oil based on the actual values after eliminating non-significant factors. [ ] [ ] (6)
In this case (after eliminating non-significant factors), the possibility of using the new model was also examined and the significance of the model (P<0.01) and the non- significance of lack of fit, as well as the significance of the linear effects (B, C) and the second degree ( ), was confirmed. In general, the second-degree expressions A
2 and first-
degree B had the greatest effect on Vis. The first-degree expression C was also important in the next step. Modeling of the Acid Number (TAN) of Oil
The results of the analysis of variance for the TAN of the oil samples are presented in Table 7. According to the results, the second-degree polynomial equation used to predict oil TAN was statistically significant (p<0.01) and the lack of fit test was not significant (P>0.05), which indicates that the model was used to
Optimization of Refinement Operations of Sugarcane Harvester Hydraulic Oil 67
predict the effect of independent variables on the acid number of oil. In addition, all linear
statements of the model used (A, B, and C) were significant (P<0.01).
Table 6- The results of the variance analysis of Vis in oil samples Source Sum of squares df Mean square F Value Prob > F
Model 458.05 11 41.64 19.90 <0.0001 significant B-mesh 280.06 1 280.06 133.83 <0.0001 C-filter 36.18 2 18.09 8.65 0.0018 A2 131.39 1 131.39 62.79 <0.0001 Residual 43.95 21 2.09 Lack of Fit 19.95 15 1.33 0.33 0.9610 not significant Pure Error 24.00 6 4.00 Cor Total 502.00 32
Among the second-degree expressions, only the second-degree of operating hours (A
2 at
P<0.05) was significant. Among the independent variables, interacting with operating hours- filter mesh (AB at P<0.05) and operating hours-times of refinement (AC at P<0.01) were significant. The results for the correlation coefficients of the model (R
2=
0.974, R2adjusted= 0.961) also indicate that the
regression model used with the tested points is very appropriate and its high accuracy in predicting the value of the dependent variable of the acid number of the oil. Equation (7) shows a second-degree polynomial model used to predict the acid number of oil based on the actual values after eliminating non-significant factors.
[ ] [ ] [ ] [ ] (7)
In this case (after eliminating non-significant factors), the use of the new model was also examined and the significance of the model (P<0.01) and the non- significance of lack of fit and also the significance of linear effects (A, B and C), second degree ( ) and interactions (AB and AC) were confirmed. In general, the first-degree expressions of the model and the interaction effect (AC), respectively, had the most effect on the acid number of the oil. The second-degree expression and the interaction effect of AB were also important in the next step.
Table 7- results of variance Analysis for determining the TAN of oil samples Source
Sum of squares
df Mean square F
Value Prob > F
Model 0.19 11 0.018 71.82 <0.0001 significant A-time 0.14 1 0.14 561.78 <0.0001 B-mesh 0.020 1 0.020 82.05 <0.0001 C-filter 0.019 2 9.603E-003 39.40 <0.0001 AB 3.008E-003 1 3.008E-003 12.34 0.0021 AC 9.144E-003 2 4.572E-003 18.76 <0.0001 A2 3.568E-003 1 3.568E-003 14.64 0.0010 Residual 5.119E-003 21 2.438E-004 Lack of Fit 4.919E-003 15 3.279E-004 9.84 0.50 not significant Pure Error 2.000E-004 6 3.333E-005 Cor Total 0.20 32
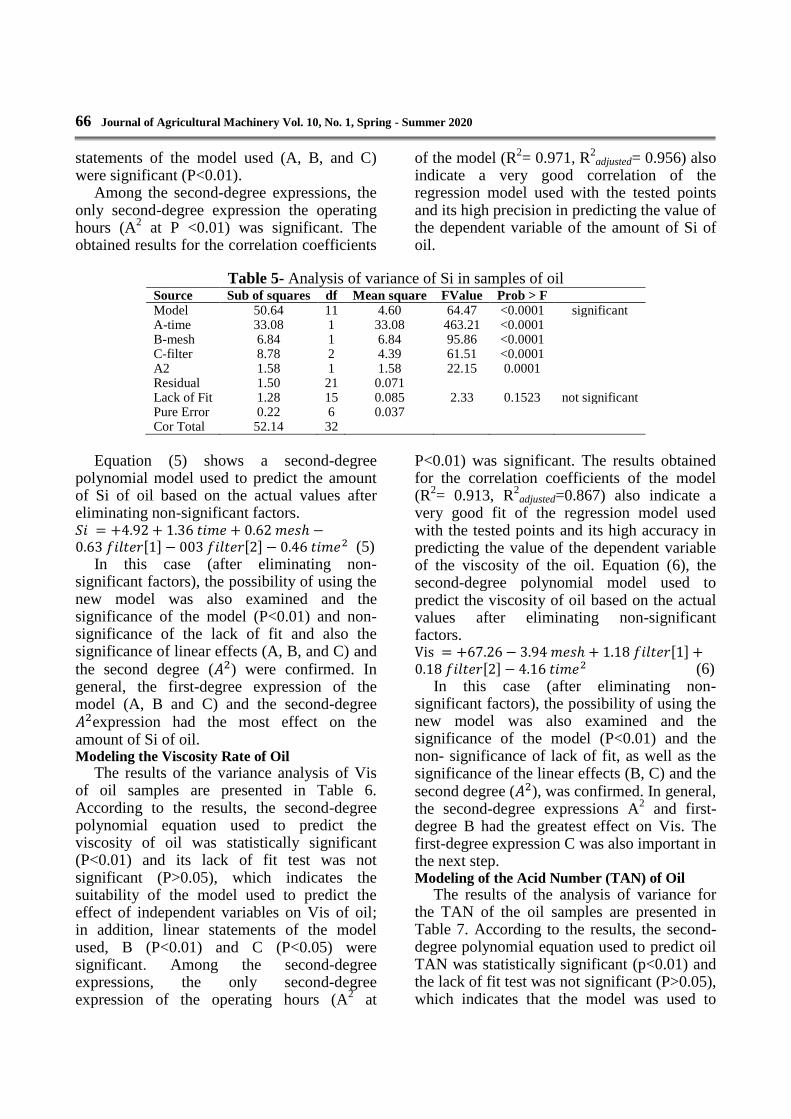
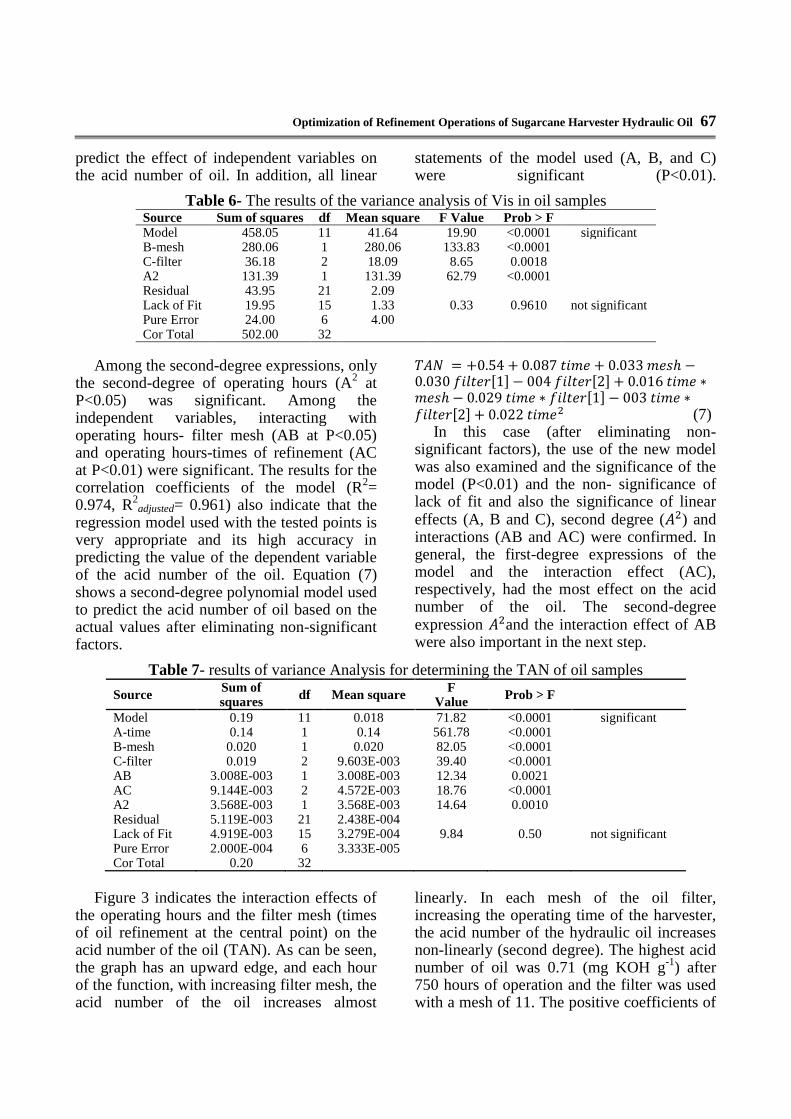
Figure 3 indicates the interaction effects of
the operating hours and the filter mesh (times of oil refinement at the central point) on the acid number of the oil (TAN). As can be seen, the graph has an upward edge, and each hour of the function, with increasing filter mesh, the acid number of the oil increases almost
linearly. In each mesh of the oil filter, increasing the operating time of the harvester, the acid number of the hydraulic oil increases non-linearly (second degree). The highest acid number of oil was 0.71 (mg KOH g
-1) after
750 hours of operation and the filter was used with a mesh of 11. The positive coefficients of
68 Journal of Agricultural Machinery Vol. 10, No. 1, Spring - Summer 2020
equation (7) and the significance of second-degree and linear expressions of Table (7) confirm these trends. Finally, with regard to the changes' reasons, it can be concluded that influx of suspended particles in the oil is increased as the filter mesh (diameter of filter grids) rises, and also it brings about some increases in the depreciation, rust, and contamination which can change the chemical properties of the oil and the times of filtration of the remaining suspended particles in the oil are increased due to overuse of the oil before the oil change which could bring about more depreciation and the parts rust and consequently, causing an increase in the oil contamination and the chemical changes of the oil. In order to confirm the achieved results, it can be stated that Blouki (2009) in research titled "determination of the best time to change engine oil of transtainer crane (RTG) using oil condition monitoring techniques" analyzed the oil condition monitoring techniques to decrease the cost and environmental damages. Therefore, it was concluded that a precise viewpoint concerning the future status of the machine can be achieved. Reducing the engine oil consumption as a result of rising its operating time can help the national economy by reducing the currency exchange costs arising from the importing inputs of petrochemical industries. This research was focused on the mentioned machines and equipment which are being worked in Imam Khomeini port. In order to test the oil degradation, the specified amount of the oil samples was prepared at regular intervals (110, 130, 150 and 170 hours) during the operating time of the crane. In this research, two operational and predictive criteria were utilized to analyze the oil condition in which the two criteria evaluate the existing rust in the oil so that the normal amount of various rusting elements is up to 100 ppm. A 50% increase in these elements could be a proper warning. It should be noted that for further rusting, this percentage should be declined while this value should be considered more for the slow rusting condition. Therefore, it was
observed in the study that engine oil of the studied cranes can work for 170 hours without any problem and the oil change is not economical in 125 hours. The percentage of changes in rusting elements of the oil was less than 50 % for all elements, however, several elements such as Iron and Chromium are in warning threshold. Finally, evaluating five categories of oil index achieved by oil analysis concluded that the engine oil can work for 170 hours and the oil change in 125 hours has brought a decline in efficiency. Furthermore, Masoudi (2001) stated that the maintenance group of the locomotive condition of Iran railways has reported 123 cases of oil change in the first ten months of 2000 which were due to diagnosing unfavorable condition like water contamination, excessive increase or decrease of viscosity and unusual increase of rusting elements. Hence, the damages to 67 cylinders, 58 pistons, 281 rings and 40 sets of bearings have been prevented which can result in saving more than 309,000 dollars. Moreover, by increasing the oil function from 65000 Km to 96000 Km and preventing the unnecessary oil change, this unit has been able to save 734,000,000 rials in oil consumption. Masoudi (2001) stated that during the implementation of a Base-Line aiming to determine the rusting effect of erosive particles for a steam turbine of Arak petrochemical complex with a volume of 18000 liters, the unusual amount (17 ppm) of Silica element was identified. The amount of Tin and Aluminum rose simultaneously which implies an uncommon erosion of the device. The following graph returns to a normal situation after eliminating the contamination, and the device continues to function normally. Thus, identifying and controlling the amplifier erosion elements of expensive petrochemical and power plant equipment, using the maintenance condition of the machines lead to enormous economic savings. It should be mentioned that the financial loss due to the unplanned stoppage of the mentioned turbine was 200 million rials per hour and its major maintenance is estimated hundreds of thousands of dollars.
Optimization of Refinement Operations of Sugarcane Harvester Hydraulic Oil 69
Fig.3. Interaction of the operating hours and filter mesh on the acid number of the oil
Optimization In order to achieve optimum conditions for
the offline hydraulic oil refinement operation, the numerical optimization technique was used. In general, the final decision on the choice of optimal conditions depends on taking into account some economic factors (costs), industrial, etc. However, it should be noted that since regression models are valid only in the area and conditions under consideration, limited economic and qualitative constraints are considered for determining operating conditions. In the present study, operating hours (250, 500 and 750 hours), twin suction filter mesh (7, 9 and 11 microns), and the number of hydraulic oil refinements (0, 1 and 2) were selected in the range. In this study, the aim was to optimize the operation, maximize the operating hours and the frequency of filtering of the oil according to the permitted range of dependent factors. According to the stated contents and results, the permissible range for water contamination was less than 500 ppm; the level of uncleanness or NAS (the number of particles 5 to 15 microns was less than 256 thousand), Si was less than 15 ppm; Vis was between 62.8 and 76.8 Centistokes and TNA was less than 0.65 mg KOH g
-1. This goal was
chosen to increase the efficiency of offline hydraulic oil refinement operations. Finally, using the desirability function method, the optimal conditions for the offline refinement
of hydraulic oil included 728.61 hours, 7-micron filter mesh and oil refinement frequency was two. Under these conditions, the amount of water contamination parameters, the level of uncleanness (NAS), Vis, Si and TAN of hydraulic oil was 187.63 ppm, 234000, 5.91 ppm, 66.34 centistokes and 0.65 mg KOH g
-1, respectively. The desirability
obtained in optimal conditions for the variables and responses analyzed was 0.957. In sum, the results of this study showed that the offline oil refinement operation of the hydraulic oil could do the trick at high operating hours (728.61) with good performance (water contamination, level of uncleanness, Vis, Si and TAN within the permitted range). In order to confirm the model's prediction, the dependent variables were evaluated in optimal conditions and were determined with a difference of less than 5%, which confirmed the accuracy of the model.
Conclusions
In order to increase the operating hours of sugarcane harvester hydraulic oil, determination of the optimum conditions for performing offline refinement of hydraulic oil can be beneficial and economically feasible. In this research, the effect of independent variables of operating hours, filter mesh and the frequency of hydraulic oil purification were evaluated on the responses studied and optimal operating conditions were also
70 Journal of Agricultural Machinery Vol. 10, No. 1, Spring - Summer 2020
determined. The results of the optimization of the offline hydraulic oil refinement operation indicated that under operating conditions 728.61 hours, 7-micron filter mesh and oil filtration rate of two, water contamination level, uncleanness level (5 to 15 micrometers), Vis, Si and TAN of hydraulic oil was 187.63 ppm, 234000, 5.91 ppm, 66.34 centistokes and 0.65 mg KOH g
-1, respectively. The
desirability obtained in optimal conditions for
the variables and responses analyzed was 0.957. In sum, a second-degree polynomial model was used to predict the extent of the dependent variables concerning the effect of independent variables used. Therefore, the data obtained from the above model can be used to obtain offline refinement hydraulic oil with a degree of water contamination, level of uncleanness, Vis, Si and TAN in the permitted range.
References
1. Ahmadi, H., and M. S. Blouki. 2009. Comparison and selection of the best time of oil change of transtainer crane (RTG) using oil condition monitoring method. Third technical conference of condition monitoring and diagnosis, Tehran, Sharif University of technology, committee of repair and maintenance. (In Farsi).
2. ASTM D 2270: 2010. Standard Practice for Calculating Viscosity Index from Kinematic Viscosity at 40 and 100°C.
3. ASTM D6595: 2011. Standard Test Method for Determination of Wear Metals and Contaminants in Used Lubricating Oils or Used Hydraulic Fluids by Rotating Disc Electrode Atomic Emission Spectrometry.
4. Cargol, T. 2005. An overview of online oil monitoring technologies. In Fourth Annual Weidmann-ACTI Technical Conference pp. 1-6.
5. Haroni, S., M. J. Sheykhdavodi, and M. Kiani Deh Kiani. 2018. Application of Artificial Neural Networks for Predicting the Yield and GHG Emissions of Sugarcane Production. Journal of Agricultural Machinery 8: 389-401. (In Farsi).
6. He, Q., G. Chen, X. Chen, and C. Yao. 2009. Application of oil analysis to the condition monitoring of large engineering machinery. In Reliability, Maintainability and Safety, 2009. ICRMS 2009. 8
th International Conference on (pp. 1100-1103). IEEE.
7. ISO 760: 1978, Determination of water - Karl Fischer method (General method). 8. ISO 6619: 1988, Petroleum products and lubricants - Neutralization number - Potentiometric
titration method. 9. ISO 4406: 1999. Hydraulic fluid Power- Fluids- Method for coding the level of Contamination
by solid Particles. 10. Li, J. 2010. Oil Analysis Cost-Effective Compressor Condition Monitoring Technique. In
Computational Intelligence and Software Engineering (CiSE), 2010 International Conference on (pp. 1-3). IEEE.
11. Macian, V., B. Tormos, P. Olmeda, and L. Montoro. 2003. Analytical approach to wear rate determination for internal combustion engine condition monitoring based on oil analysis. Tribology International 36 (10): 771-776.
12. Macian, V., B. Tormos, A. Sala, and J. Ramirez. 2006. Fuzzy logic-based expert system for diesel engine oil analysis diagnosis. Insight-Non-Destructive Testing and Condition Monitoring 48 (8): 462-469.
13. Masoudi, A. R. 2001. Silica particles in engine oils, Proceedings of technology. The paper No. 10. (In Farsi).
14. Masoudi, A. R. 2001. Study of economic aspects of CM program using oil analysis, Proceedings of technology. Research group of Alborz Tadbir laboratory of Khouzestan Co. the paper No. 15. (In Farsi).
15. Masoudi, A. R. 2003. Care of mechanical systems, sampling techniques, technology series. Laboratory Research Group of AlborzTadbir Khuzestan Co. Article number 12. (In Farsi).
Optimization of Refinement Operations of Sugarcane Harvester Hydraulic Oil 71
16. Masoudi, A. R. 2011. Introduction to Oil Analysis (translation), Technical and Engineering Company of Alborz Tadbirkaran, Tehran. (In Farsi).
17. Qasemi, Y., M. H. Kianmehr, and B. Azadegan. 2015. Investigation of the effect of granulate compost parameters using response surface method. Journal of Agricultural Machinery 5 (1): 191-198. (In Farsi).
18. Ranjbar, A., H. R. Ghasemzadeh, and Sh. Davoudi. 2003. Engine power and tractor (translation), Printing and Publishing of Tabriz University, pages 601 to 612. (In Farsi).
19. Saghafi, M. 2008. Tractor and its mechanism (translation), Center for Academic Publishing, Ministry of Culture and Islamic Guidance, Tehran. Pages 186 to 199. (In Farsi).
20. Singh, B., P. S. Panesar, V. Nanda, and J. F. Kennedy. 2010. Optimisation of osmotic dehydration process of carrot cubes in mixtures of sucrose and sodium chloride solutions. Food Chemistry 123 (3): 590-600.
72 Journal of Agricultural Machinery Vol. 10, No. 1, Spring - Summer 2020
های کشاورزیماشین نشریه
59-72ص ،1399نیمسال اول ، 1شماره ، 10جلد
Journal of Agricultural Machinery
Vol. 10, No. 1, Spring- Summer 2020, p. 59-72
سازیعملیاتپالایشآفلاینروغنهیدرولیکدروگرنیشکربهینه
4افشینمرزبان،3عیسیحزباوی،*2داودیمحمدجوادشیخ،1آبادپورملکحدیثنعمت
91/70/9910تاریخ دریافت:
91/97/9910تاریخ پذیرش:
چکیده
سوازی فرآینودها سازی، بهبوود داد و بهینوه ها، مدل های آماری و ریاضی برای طراحی آزمایش ای از تکنیک (، مجموعهRSMروش سطح پاسخ )منظور، اثرات بود. بدین RSMسازی عملیات پالایش آفلاین روغن هیدرولیک دروگر نیشکر به روش سازی و بهینه باشد. هدف از مطالعه حاضر مدل می
( 1و 9، 7میکرو ( و دفعات تصفیه روغن هیدرولیک ) 99و 1، 0ساعت(، مش فیلتر مکشی دوقلو ) 057و 577، 157کارکرد ) متغیرهای مستقل ساعات( ارزیوابی شود. نتوای TAN( و عدد اسویدی روغون ) Vis(، ویسکوزیته )Si(، سیلیسیوم )NASروی متغیرهای وابسته آلودگی آب، سطح عدم تمیزی )
( و عودد اسویدی روغون Vis(، ویسوکوزیته ) Si(، سیلیسویوم ) NASدست آمده برای آلودگی آب، سطح عدم تمیوزی ) ای بهه ی مدل نشا داد که همه(TANبرای توصیف داده ) بر این تابع مطلوبیت نشا داد که شرایط بهینه عملیات پالایش آفلاین روغن هیودرولیک های آزمایشی مناسب بودند. علاوه
بود. تحت این شرایط، مقدار پارامترهای آلوودگی آب، 1میکرو و دفعات تصفیه روغن 0ساعت، مش فیلتر 19/017رکرد دروگر نیشکر شامل ساعت کاسانتی استوک و ppm 19/970 ،190777 ،ppm 19/5 ،90/11ترتیب برابر با به TANو Si ،Visمیکرومتر(، 95تا 5سطح عدم تمیزی )تعداد ذرات
mg KOH/g 15/7 دست آمد به.
پاسخروش سطح ،دروگر نیشکرپالایش آفلاین روغن هیدرولیک، سازی، بهینه هایکلیدی:واژه
دانشگاه شهید چمرا اهوازآموخته دکتری مکانیزاسیو کشاورزی، گروه مهندسی بیوسیستم، دانش -9
استاد گروه مهندسی بیوسیستم، دانشگاه شهید چمرا اهواز -1
استادیار گروه مهندسی بیوسیستم، دانشگاه لرستا -9
های کشاورزی و مکانیزاسیو ، دانشگاه علوم کشاورزی و منابع طبیعی خوزستا دانشیار گروه ماشین -0 (Email: [email protected] نویسنده مسئول: -)*
DOI: 10.22067/jam.v10i1.75912