Embed Size (px)
Citation preview

International Journal of Mechanical Engineering Research.
ISSN 2249-0019 Volume 7, Number 2 (2017), pp. 83-97
© Research India Publications
http://www.ripublication.com
Optimization of Process Parameters in Induction
Hardening of 41Cr4 Steel by Response Surface
Methodology
S. P. Metage1 and J. S. Sidhu2 1P.G. Scholar, MGM’s College of Engineering, Nanded
2 Associate Professor & Head, Department of Mechanical Engg., MGM’s College of Engineering, Nanded
Abstract
The analysis of an induction hardening process is a complex process because
induction hardening is a combination of heat transfer, electromagnetic and
metallurgical phenomenon. Now a days, steel parts are induction hardened for
better mechanical properties in case of automobile and aerospace applications.
This paper deals with the optimization of process parameters in induction
hardening process for 41Cr4 steel material. The selected process parameters
are Power (Kw), Feed rate (mm/sec), Dwell time (sec), Quench flow rate
(litre/min). The responses selected are Case Hardness (HRC) and Effective
Case depth (mm). Response surface methodology was used to determine
optimum values of process parameters and that were - Case Hardness
59.83HRc and Effective Case Depth (ECD) 2.7mm. Analysis of variance is
conducted to investigate the influence of each parameter on responses. Also
microstructure analysis is done for justification of hardening.
Keywords: induction hardening, process parameters, optimization, RSM,
Analysis of Variance, microstructure analysis.
INTRODUCTION
Induction heating is a method of heating electrically conductive materials by the
application of a varying magnetic field whose lines of force enter the work-piece. In
this process, the varying magnetic field induces an electric potential (voltage),
which can then create an electric current depending on the shape and the electrical

84 S.P. Metage and J.S. Sidhu
characteristics of the work-piece. These so-called eddy currents dissipate energy
and produce heat by owing against the resistance of an imperfect conductor.
Because all metals are fair electrical conductors, induction heating is applicable to
several types of metal processing operations such as melting, welding, brazing, heat
treating, and heating prior to hot working. Generally, Induction heating process is
used to surface harden crankshaft, camshaft, gears, crank pins and axles.
Amit Kohli et. al. (2010) studied the effect of process parameters on mean effective
case depth of induction hardened AISI 1040 steel and studied optimization of
process parameters of AISI 1040 steel using RSM. Experimental investigation
shown that for making shafts, axles or automobile components from medium carbon
steel, raw material should be first normalized and then induction hardened so that
uniform hardness of material can be obtained [1, 2]. Mert Onan et. al. (2012)
discussed experimental investigation on AISI 1040 steel and analyzed the
optimization of process conditions for induction hardened steel. The selection of
higher power ratio and lower scan rate affected micro structural transformation
during hardening process. As a result of applying higher power ratio or lower scan
rate induction hardening allowed high surface hardness [3]. Kochure et al. (2012)
studied hardening of EN8D steel by Taguchi method wherein effects of process
parameters such as power, heating time on hardness and case depth were expressed
[4]. Sandeep et al. performed parametric optimization of sintered iron alloy by using
intelligent techniques and concluded that the mechanical and metallurgical
properties fully depend on heat treatment process. The properties like tensile
strength, ductility and toughness would be improved by adding alloying elements
like Cr, Mo, P and Ni etc. [5]. Mishra et al. (2014) has performed investigation to
find out optimization of input process parameters such as medium frequency power,
feed rate, quench pressure and temperature for induction hardening of AISI 1045
steel component based on desirability function to enhance quality responses like
effective case depth and hardness. Selection of both heating and quenching
parameters proved significant for quality characteristics evaluation proved as a
useful strategy [6]. Mugendiran et. al. (2014) investigated optimization of surface
roughness and wall thickness on AA5052 Aluminium alloy by incremental forming
using response surface methodology. A second order quadratic model has been
obtained to predict the surface roughness and wall thickness as function of spindle
speed, tool feed and step size variables [7]. Gajanana et. al. (2015) investigated
effect of input parameters such as scan speed, voltage and rotation speed of
induction hardening process and microstructure analysis of micro-alloyed steel
roller shaft of an undercarriage and concluded that smaller inductor coil produces
higher case depth in hardening of shafts [8].
In this paper, Case Hardness and ECD of induction hardened parts have been
optimized using RSM, as it is mostly preferred method to solve the optimization

Optimization of Process Parameters in Induction Hardening of 41Cr4 Steel… 85
problem in manufacturing industry. Since time and money are involved while
performing experimentation, it is pertinent to reduce the number of runs while not
compromising the desired goals.
MATERIALS AND METHODS
Material
Cylindrical samples of 41Cr4 steel were selected as material for investigation. This
material is used for the manufacture of front vehicle axle, crankshafts and steering
components. The chemical composition of 41Cr4 Steel was 0.40% Carbon, 0.27%
Silicon, 0.82% Manganese, 1.11% Chromium, 0.026% Sulphur and 0.017%
Phosphorus.
Experimental Setup
All experiments were performed on Inductotherm make induction hardening
machine (30 KHz, 50 Kw) with major components (i) Imported ball screw, (ii) A.C.
servo drive and motor for scanning, (iii) Siemens CNC system, (iv) Top and bottom
tooling, (v) Job rotation. A source of high frequency electricity is used to drive a
large alternating current through a copper coil. The passage of current through this
coil generates a very intense and rapidly changing magnetic field in the space within
the work coil. The work piece to be heated was placed within this intense
alternating magnetic field. Induction temperature was maintained between 850oC
and 900oC. The core of the component remained unaffected. It was controlled by
setting various process parameters.
Experimental Plan
Based on preliminary investigation and review of literature, range of input
parameters were selected after performing pilot runs. These were power supplied,
feed rate, dwell time and quench flow rate. Rotatable central composite design
(CCD) has been used to carry out the experiments. The design plan is shown in
Table 1.
Table 1. Levels of process parameters
Sr.
No. Input Parameters Units
Levels
-1 0 1
1 Power (P) kw 10 12.5 15
2 Feed rate ( F) mm/sec 200 300 400
3 Dwell Time (D) sec 0.1 0.2 0.3
4 Quench Flow rate (Q) litre/min 10 12 14

86 S.P. Metage and J.S. Sidhu
Experimental Technique
Based on the foregoing inputs, the complete experimental run layout (Table 2) was
produced using MINITAB software. Those performance tests involved 30 runs of
the material. After induction hardening process, surface hardness was measured by
Rockwell hardness tester for C scale at 150 Kg load, having diamond indenter at
120 degree. Additionally cylindrical samples were cut from the middle of material
for investigation of case depth.
Table 2. Experimental Data for Case hardness and Effective case depth
Sr.
No.
Power
[Kw]
Feed rate
[mm/sec]
Dwell
Time [sec]
Quench Flow
rate [litre/min]
Case Hardness
[HRC]
Case Depth
[mm]
1 12.5 300 0.1 12 55 1.8
2 12.5 400 0.2 12 53 1.7
3 12.5 300 0.3 12 56 2.1
4 12.5 200 0.2 12 54 1.9
5 12.5 300 0.2 12 53 1.6
6 12.5 300 0.2 10 54 2.2
7 15 300 0.2 12 58 2.5
8 12.5 300 0.2 14 55 2.0
9 10 300 0.2 12 50 1.4
10 12.5 300 0.2 12 55 1.6
11 10 400 0.3 14 51 1.3
12 12.5 300 0.2 12 54 1.7
13 15 400 0.3 14 58 2.3
14 10 200 0.3 10 49 2.0
15 12.5 300 0.2 12 53 1.6
16 10 200 0.1 10 48 1.3
17 15 200 0.1 14 59 2.2
18 15 200 0.1 10 58 2.4
19 12.5 300 0.2 12 55 1.8
20 10 400 0.1 14 50 1.1
21 15 200 0.3 14 60 2.9
22 15 400 0.1 14 59 2.3
23 10 200 0.1 14 51 1.3
24 12.5 300 0.2 12 55 2.1
25 10 400 0.3 10 51 1.7
26 10 200 0.3 14 53 1.9
27 15 200 0.3 10 59 2.7
28 10 400 0.1 10 50 1.0
29 15 400 0.1 10 56 2.3
30 15 400 0.3 10 58 2.5

Optimization of Process Parameters in Induction Hardening of 41Cr4 Steel… 87
RESULTS AND DISSCUSSION
Case hardness was measured thrice for each trial and its average was considered,
whereas Effective case depth was measured on Vickers micro hardness tester and
both the responses are plotted in Table 2. Further analysis was done using
MINITAB.
Analysis of Variance (ANOVA)
ANOVA table has been used to summarize the test for significance of regression
model, test for significance for individual model coefficient. It indicates which
parameters are significantly affecting the output parameters. In the analysis the sum
of squares and variance are calculated. F-test values at 95% confidence level are
used to decide the significant factors affecting the process and percentage
contribution. Degrees of freedom (df) mean the number of values that can vary
independently of one another. In Case hardness the p values for power, dwell time
and quench flow rate are less than 0.05 (shown in bold) and larger F values
(88.62) indicates that these factors have statistically significant effects on the
performance. In Effective Case Depth the p values for power, feed rate, and dwell
time are less than 0.05 and larger F value (42.43) indicates that these factors have
statistically significant effects on the performance.
R2 is the percentage of total variation in the response which depends on the factors
in the model. In this case R2 value for case hardness is 93.40% and for ECD is
87.20%. The higher the value of R2, the better the model fits the data. The sequential
sum of squares in the analysis of variance table indicates the relative importance of
each factor. The factor with the biggest sum of squares has the greatest impact; here
power is the most important factor in both responses. The ANOVA results for case
hardness and case depth are shown in table 3 and 4. It revealed that quadratic model
is statistically significant for both case hardness and effective case depth.
Table 3. ANOVA results for Case Hardness
Predicator Coefficient SE Coefficient T P
Constant 29.833 1.883 15.84 0.000
Power [p] 1.6 0.08721 18.35 0.000
Feed rate [F] -0.002778 0.002180 -1.27 0.214
Dwell Time [D] 5.0 2.180 2.29 0.031
Quench Flow rate [Q] 0.3611 0.1090 3.31 0.003
S = 0.924962 R-Sq = 93.4% R-Sq (adj) = 92.4%
Source DF SS MS F P
Regression 4 303.278 75.819 88.62 0.000
Residual error 25 21.389 0.856
Total 29 324.667

88 S.P. Metage and J.S. Sidhu
Source DF Seq. SS
Power 1 288
Feed rate 1 1.389
Dwell Time 1 4.5
Quench Flow
rate
1 9.389
Table 4. ANOVA results for Case Depth
Predicator Coefficient SE Coefficient T P
Constant -0.3656 0.3736 -0.98 0.337
Power [P] 0.2022 0.0173 11.69 0.000
Feed rate [F] -0.00133 0.0004326 -3.08 0.005
Dwell Time
[D]
2.0556 0.4326 4.75 0.000
Quench Flow
rate [Q]
-0.02222 0.02163 -1.03 0.314
S = 0.183521 R-Sq = 87.2% R-Sq (adj) = 85.1%
Analysis of Variance
Source DF SS MS F P
Regression 4 5.7167 1.4292 42.43 0.000
Residual error 25 0.8420 0.0337
Total 29 6.5587
Source DF Seq. SS
Power 1 4.6
Feed rate 1 0.32
Dwell Time 1 0.76
Quench Flow
rate
1 0.0356
Regression Model Equations for Case hardness and ECD
The regression coefficients of the second order equations have been obtained by
using the experimental data (Table 3 & 4). The regression equations for the
responses as a function of four input parameters are given below:
Case Hardness = 29.8 + 1.6 × Power (P) - 0.00278 × Feed rate (F) + 5 × Dwell time
(D) + 0.361 × Quench flow rate (Q)
Effective Case Depth = - 0.366 + 0.202 × Power (P) - 0.00133 × Feed rate (F) +
2.06× Dwell time (D) - 0.0222× Quench flow rate (Q)

Optimization of Process Parameters in Induction Hardening of 41Cr4 Steel… 89
Main Effects Plots
Figure 1 shows the main effects of process parameters on Case Hardness and
Effective Case Depth. It is observed that as power increases, case hardness also
increases conceding direct relation between power and case hardness. Similarly, as
feed rate increases case hardness decreases. Case hardness increases with increase
in dwell time and quench flow rate.
Figure 1. Main effects plot for case hardness and case depth
In ECD graph, as power increases, ECD also increases showing direct relation of
power with ECD. As feed rate increases ECD decreases, hence there is inverse
relation between ECD and feed rate. ECD increases with increase in dwell time.
ECD decreases initially with increase in quench flow rate and then increases.
90 S.P. Metage and J.S. Sidhu
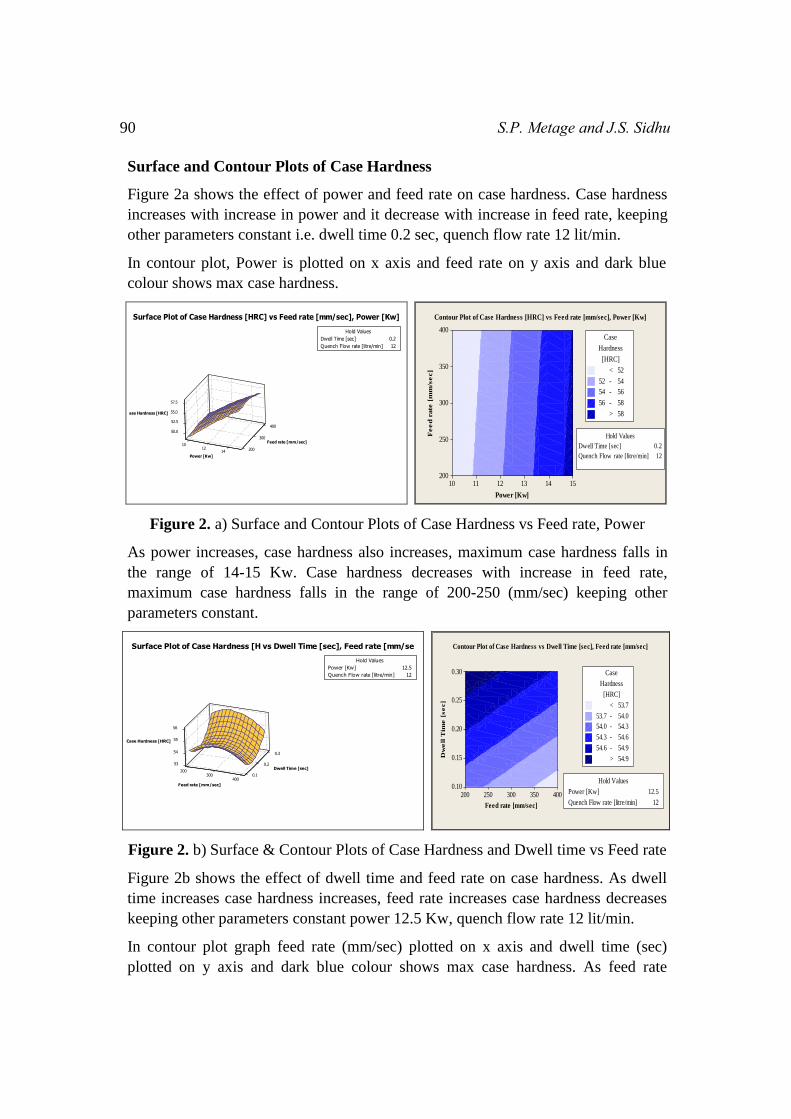
Surface and Contour Plots of Case Hardness
Figure 2a shows the effect of power and feed rate on case hardness. Case hardness
increases with increase in power and it decrease with increase in feed rate, keeping
other parameters constant i.e. dwell time 0.2 sec, quench flow rate 12 lit/min.
In contour plot, Power is plotted on x axis and feed rate on y axis and dark blue
colour shows max case hardness.
3
400
50.0
00
52.5
55.0
10
57.5
12 20014
ase Hardness [HRC]
Feed rate [mm/sec]
Power [Kw]
Dwell Time [sec] 0.2
Quench Flow rate [litre/min] 12
Hold Values
Surface Plot of Case Hardness [HRC] vs Feed rate [mm/sec], Power [Kw]
Power [Kw]
Fe
ed
rate
[m
m/s
ec]
151413121110
400
350
300
250
200
Hold Values
Dwell Time [sec] 0.2
Quench Flow rate [litre/min] 12
Case
54
54 - 56
56 - 58
Hardness
> 58
[HRC]
< 52
52 -
Contour Plot of Case Hardness [HRC] vs Feed rate [mm/sec], Power [Kw]
Figure 2. a) Surface and Contour Plots of Case Hardness vs Feed rate, Power
As power increases, case hardness also increases, maximum case hardness falls in
the range of 14-15 Kw. Case hardness decreases with increase in feed rate,
maximum case hardness falls in the range of 200-250 (mm/sec) keeping other
parameters constant.
0
0.3
53 .2
54
55
200
56
300 0.1400
Case Hardness [HRC]
Dwell Time [sec]
Feed rate [mm/sec]
Power [Kw] 12.5
Quench Flow rate [litre/min] 12
Hold Values
Surface Plot of Case Hardness [H vs Dwell Time [sec], Feed rate [mm/se
Feed rate [mm/sec]
Dw
ell
Tim
e [
se
c]
400350300250200
0.30
0.25
0.20
0.15
0.10Hold Values
Power [Kw] 12.5
Quench Flow rate [litre/min] 12
Case
54.0
54.0 - 54.3
54.3 - 54.6
Hardness
54.6 - 54.9
> 54.9
[HRC]
< 53.7
53.7 -
Contour Plot of Case Hardness vs Dwell Time [sec], Feed rate [mm/sec]
Figure 2. b) Surface & Contour Plots of Case Hardness and Dwell time vs Feed rate
Figure 2b shows the effect of dwell time and feed rate on case hardness. As dwell
time increases case hardness increases, feed rate increases case hardness decreases
keeping other parameters constant power 12.5 Kw, quench flow rate 12 lit/min.
In contour plot graph feed rate (mm/sec) plotted on x axis and dwell time (sec)
plotted on y axis and dark blue colour shows max case hardness. As feed rate

Optimization of Process Parameters in Induction Hardening of 41Cr4 Steel… 91
increases case hardness decreases, maximum case hardness gets in the range of 200-
250 mm/sec whereas dwell time increases case hardness increases, maximum case
hardness gets in the range of 0.25-0.30 sec keeping other parameters constant.
14
1
54
2
55
56
0.1
57
0.2 100.3
Case Hardness [HRC]
Quench Flow rate [litre/mi
Dwell T ime [sec]
Power [Kw] 12.5
Feed rate [mm/sec] 300
Hold Values
Surface Plot of Case Hardness [H vs Quench Flow rate, Dwell Time [sec]
Dwell Time [sec]
Qu
en
ch
Flo
w r
ate
[li
tre
/min
]
0.300.250.200.150.10
14
13
12
11
10
Hold Values
Power [Kw] 12.5
Feed rate [mm/sec] 300
Case
54.0
54.0 - 54.5
54.5 - 55.0
Hardness
55.0 - 55.5
> 55.5
[HRC]
< 53.5
53.5 -
Contour Plot of Case Hardness vs Quench Flow rate and Dwell Time
Figure 2. c) Surface & Contour Plots of Case Hardness and Quench flow rate vs
Dwell time
Figure 2c shows the effect of quench flow rate and dwell time on case hardness. As
dwell time increases case hardness increases, quench flow rate increases case
hardness increases keeping other parameters constant power 12.5 Kw, feed rate 300
mm/sec.
The contour plot represents dwell time (sec) on x axis and quench flow rate (lit/min)
on y axis and dark blue colour shows max case hardness. As dwell time increases
case hardness increases, maximum case hardness falls in the range of 0.25-0.3 sec.
Whereas, as quench flow rate increases, case hardness increases and maximum case
hardness falls in the range of 13-14 lit/min keeping other parameters constant.
Surface and Contour Plots of Effective Case Depth (mm)
Figure 3a shows the effect of power and feed rate on case depth. As power increases
case depth increases it shows direct relation between power and case depth, feed
rate increases case depth decreases keeping other parameters constant dwell time
0.2 sec, quench flow rate 12 lit/min.

92 S.P. Metage and J.S. Sidhu
Power [Kw]
Fe
ed
rate
[m
m/s
ec]
151413121110
400
350
300
250
200
Hold Values
Dwell Time [sec] 0.2
Quench Flow rate [litre/min] 12
Effective
1.75
1.75 - 2.00
2.00 - 2.25
Case Depth
2.25 - 2.50
> 2.50
[mm]
< 1.50
1.50 -
Contour Plot of Effective Case Depth vs Feed rate and Power
Figure 3. a) Surface and Contour Plot for Case Depth vs feed rate, power
In contour plot graph, power (Kw) is plotted on x axis and feed rate (mm/sec) on y
axis and dark blue colour shows max case depth. As power increases case depth
also increases, maximum case depth gets in the range of 14-15 Kw whereas feed
rate increases case depth decreases, maximum case depth gets in the range of 200-
250 (mm/sec) keeping other parameters constant.
Figure 3b shows the effect of dwell time and feed rate on case depth. As dwell time
increases, case depth increases, also as feed rate increases case depth decreases,
keeping other parameters constant i.e. power 12.5Kw, quench flow rate 12 lit/min.
In contour plot graph, feed rate (mm/sec) is plotted on x axis and dwell time (sec)
plotted on y axis. As feed rate increases case depth decreases, maximum case depth
gets in the range of 200 mm/sec whereas dwell time increases case depth increases,
maximum case depth gets in the range of 0.30 sec keeping other parameters
constant.
Feed rate [mm/sec]
Dw
ell
Tim
e [
se
c]
400350300250200
0.30
0.25
0.20
0.15
0.10
Hold Values
Power [Kw] 12.5
Quench Flow rate [litre/min] 12
Effective
- 1.7
1.7 - 1.8
1.8 - 1.9
Case
1.9 - 2.0
2.0 - 2.1
2.1
Depth
- 2.2
> 2.2
[mm]
< 1.6
1.6
Contour Plot of Effective Case Depth vs Dwell Time and Feed rate
Figure 3. b) Surface and contour plot for case depth vs dwell time, feed rate
Figure 3c shows the effect of quench flow rate and dwell time on case depth. As
dwell time increases case depth increases, quench flow rate increases case depth
decreases keeping other parameters constant power 12.5Kw, feed rate 300 mm/sec.
1.0
1.5
2.0
101212
14
2.0
2.5
300
400
20014
Effective Case Depth [mm]
Feed rate [mm/sec]
Power [Kw]
Dwell Time [sec] 0.2
Quench Flow rate [litre/min] 12
Hold Values
Surface Plot of Effective Case D vs Feed rate [mm/se, Power [Kw]
1.50
1.75
2.00
200200300
2.00
2.25
400400
0.2
0.1
0.3
Effective Case Depth [mm]
Dwell Time [sec]
Feed rate [mm/sec]
Power [Kw] 12.5
Quench Flow rate [litre/min] 12
Hold Values
Surface Plot of Effective Case D vs Dwell Time [sec], Feed rate [mm/se

Optimization of Process Parameters in Induction Hardening of 41Cr4 Steel… 93
Dwell Time [sec]
Qu
en
ch
Flo
w r
ate
[li
tre
/min
]
0.300.250.200.150.10
14
13
12
11
10
Hold Values
Power [Kw] 12.5
Feed rate [mm/sec] 300
Effective
- 1.8
1.8 - 1.9
1.9 - 2.0
Case
2.0 - 2.1
> 2.1
Depth
[mm]
< 1.7
1.7
Contour Plot of Effective Case Depth vs Quench Flow rate and Dwell Time
Figure 3. c) Surface & contour plot for case depth vs dwell time, and quench flow
rate
In contour plot graph, dwell time (sec) is plotted on x axis and quench flow rate
(lit/min) plotted on y axis and dark blue colour shows max case depth. As dwell
time increases case depth increases, maximum case depth gets in the range of 0.25-
0.3 sec whereas quench flow rate increases case depth decreases maximum case
depth gets in the range of 10-11 lit/min keeping other parameters constant.
Multiple Response Optimizations
MINITAB software was used for maximizing (achieving target values) hardness
and ECD. The optimum values of process parameters obtained were power 15 Kw,
feed rate 200 mm/sec, dwell time 0.30 sec and quench flow rate 14 lit/min, the
maximum case hardness and ECD obtained 59.83 HRC and 2.70 MM. All the
values were within 95% prediction interval.
Table 5. Multiple response optimizations
Response Goal Lower Target
Case hardness [HRC] Maximum 48 60
E Case depth [MM] Maximum 1.4 2.8
Table 6. Experimental validation
Trial
No.
Optimum
conditions
Case hardness % error Effective Case depth %
error
Experimental Predicted Case
Hardness
Experimental Predicted Case
depth
01 P= 15kw;
F = 200
mm/sec; D=
0.3 sec;
Q=14
litre/min
58.0 59.83 3.05 2.58 2.7 4.44
02 59.0 59.83 1.38 2.6 2.7 3.7

94 S.P. Metage and J.S. Sidhu
MICROSTRUCTURE ANALYSIS
The goal of heat treatment of steel is very often to attain a satisfactory hardness. The
important micro-structural phase is then normally martensite, which is the hardest
constituent in low-alloy steels. The hardness of martensite is primarily dependent on
its carbon content. If the micro-structure is not fully martensitic, its hardness is
lower. In practical heat treatment, it is important to achieve full hardness to a certain
minimum depth after cooling, that is, to obtain a fully martensitic microstructure to
a certain minimum depth, which also represents a critical cooling rate.
A finely distributed structure like tempered martensite is more rapidly transformed
to austenite than, for instance, a ferritic-pearlitic structure. This is particularly true
for alloyed steels with carbide-forming alloying elements such as chromium and
molybdenum
In case of induction hardening process uniform distribution of carbon cannot be
assumed, the time spent at the austenitizing temperature can be so brief that carbon
cannot diffuse to a uniform concentration throughout the microstructure.
Determination of 100% martensite is subjective and difficult to determine optically
(Tartaglia Eldis 1984). The figure shows microstructure image light microscope
photograph at 20X of the surface of sample piece of low hardness at 48 HRc and of
optimum hardness at 60 HRc of induction hardened 41Cr4 steel, polished and
etched at 3% Nital solution. No micro cracks observed in the induction hardened
zone.
Figure 4. Microstructure of sample piece low hardness at 48 HRc a) Micrograph at
interface hardened and unhardened zone b) Micrograph at unhardened zone c)
Micrograph at hardened zone

Optimization of Process Parameters in Induction Hardening of 41Cr4 Steel… 95
Figure 5. Microstructure of sample piece optimum hardness at 60 HRc a)
Micrograph at interface hardened and unhardened zone b) Micrograph at
unhardened zone c) Micrograph at hardened zone
CONCLUSIONS
From this experimentation study it has been concluded that
1. The most influencing parameters for the case hardness (CH) are the power;
quench flow rate and Dwell time, in descending order.
2. The most influencing parameters for the Effective case depth (ECD) are the
power; Dwell time and feed rate, in descending order.
3. The common optimum values of the process parameters for both responses case
hardness (CH) and Effective case depth (ECD) are: Power = 15kw; Feed rate =
200 mm/sec; Dwell time = 0.3 sec; Quench flow rate = 14 litre/min. As the error
between the experimental and predicted values is less than 5%, validates the
experiment.
4. In the hardened region, complete martensitic phase was observed which confirms
the hardening of the material
ACKNOWLEDGEMENTS
Authors express their sincere gratitude towards Mr. P. Hurdale, Pune Heat, Bhosari,
Pune for their resource courtesy.
REFERENCES
[1] Amit Kohli and Hari Singh, Optimizing mean effective case depth of induction
hardened parts (rolled condition) using response surface methodology,
International Journal of Emerging Technologies 1 (1):87-91 (2010)

96 S.P. Metage and J.S. Sidhu
[2] Amit Kohli and Hari Singh, Optimization of processing parameters in induction
hardening using response surface methodology, Sadhana, Vol. 36, Part 2, April
2011, pp. 141–152.© Indian Academy of Sciences
[3] Mert Onan, H. Ibrahim Unal, Kasim Baynal, Furkan Katre, Optimization Of
Induction Hardened Aisi 1040 Steel By Experimental Design Method And
Material Characterization Analysis, Proceedings of the ASME 2012 International Mechanical Engineering Congress & Exposition IMECE2012, November 9-15, 2012, Houston, Texas, USA
[4] P. G. Kochure and K. N. Nandurkar, Mathematical modeling for selection of
process parameters in induction hardening of EN8D steel, IOSR Journal of Mechanical and Civil Engineering (IOSRJMCE), Volume 1, Issue 2 (July-Aug
2012), PP 28-32 (ISSN: 2278-1684)
[5] Sandeep, P. C. Tewari, Dinesh Khanduja, Framework for Induction Hardening
Parameters Optimization of Sintered Iron Alloy by using Intelligent Techniques,
ACEEE Proc. of Int. Conf. on Emerging Trends in Engineering and Technology, DOI:03, AETS.2013.3.207
[6] Mohan K Misra, Bishakh Bhattacharya, Onkar Singh, A Chatterjee, Multi
response Optimization of Induction Hardening Process – A new approach,
Third international conference on advances in control and optimization of dynamical systems, March 13 - 15, 2014, Kanpur, India
[7] V. Mugendiran, A. Gnanavelbabu, R. Ramadoss, Parameter optimization for
surface roughness and wall thickness on AA5052 Aluminum alloy by
incremental forming using response surface methodology, Procedia Engineering, 97 (2014) pp. 1991-2000
[8] Mohit Sharma, Jasjeet Singh Kohli, Shalom Akhai, Metallurgical Analysis of
Cracks Encountered During Induction Hardening of Crankshafts, International Journal of Research in Advent Technology, Vol. 2, Issue 4, April 2014, (ISSN:
2321-9631)
[9] S. Gajanana, B. Suresh Kumar Reddy, T. Shivendra Lohit, K Anil kumar
Reddy, Ankur Jain, Induction Hardening and Microstructure Analysis of Micro
alloyed steel roller shaft of an undercarriage, International Journal of Engineering Research, Volume no. 4, Issue no 7, pp: 358-362
[10] Marius Ardelen, Erika Ardelen, Teodor Heput, Ana Socalici, Establishing the
main technological parameters of induction surface hardening for shaft parts
type, Annals Of Faculty Engineering Hunedoara-International Journal of Engineering, TOME IX (2011), Extra Fascicule (ISSN 1584-2673)

Optimization of Process Parameters in Induction Hardening of 41Cr4 Steel… 97
[11] Amit Kohli, Gurudutt Sahni, Balpreet Singh, Induction hardening process using
AISI 1040 steel material on samples of ASTM a 370-97(E18) and E70-97(E10)
standard and its benefits, IJEIT, Volume 4, Issue 2, August 2014
[12] Annika Vieweg, Gerald Ressel, Petri Prevedel, Peter Raninger, Michael
Panzenbock, Stefan Marsoner and Reinhold Ebner, Induction hardening:
Differences to a conventional heat treatment process and optimization of its
parameters, International Conference on Materials, Processing and Product Engineering 2015 (MPPE 2015) IOP Publishing IOP Conf. Series: Materials Science and Engineering, 119 (2016) 012019 doi:10.1088/1757-
899X/119/1/012019
[13] S. R. Thakare, S. C. Makwana, Optimization of Heat Treatment Process for
Internal Clutch by Using Taguchi Technique, Int. Journal of Engineering Research and Applications, Vol. 4, Issue 1 (Version 2), January 2014, pp.144-
151. (ISSN: 2248-9622)
[14] Wang Xun, Zhou Jie, Liang Qiang, Multi-objective optimization of medium
frequency induction heating process for large diameter pipe bending, Procedia Engineering 81 (2014) 2255 – 2260.
[15] Phuong-Xuan Dang, Improving the energy efficiency by process parameter
optimization approach: a case study for induction heating, International Journal of Renewable Energy and Environmental Engineering, ISSN 2348-0157, Vol.
01, No. 01, October 2013.

98 S.P. Metage and J.S. Sidhu