Embed Size (px)
Citation preview
ORIGINAL ARTICLE
Optimization of melanin production by Brevundimonas sp. SGJusing response surface methodology
Shripad N. Surwase • Shekhar B. Jadhav •
Swapnil S. Phugare • Jyoti P. Jadhav
Received: 3 June 2012 / Accepted: 20 July 2012 / Published online: 7 August 2012
� The Author(s) 2012. This article is published with open access at Springerlink.com
Abstract Melanins are predominantly indolic polymers
which are extensively synthesized in animals, plants and
microorganisms. It has wide applications in cosmetics,
agriculture and medicine. In the present study, optimization
of process parameters influencing melanin production was
attempted using the response surface methodology (RSM)
from Brevundimonas sp. SGJ. A Plackett–Burman design
was used for screening of critical components, while fur-
ther optimization was carried out using the Box–Behnken
design. The optimum conditions observed were pH 5.31,
tryptone 1.440 g l-1, L-tyrosine 1.872 g l-1 and CuSO4
0.0366 g l-1. Statistical analysis revealed that the model is
significant with model F value 29.03 and R2 value 0.9667.
The optimization of process parameters using RSM resul-
ted in a 3.05-fold increase in the yield of melanin. The
intermittent addition of L-tyrosine enhanced the melanin
yield to 6.811 g l-1. The highest tyrosinase activity
observed was 2,471 U mg-1 at the 18th hour of the incu-
bation period with dry cell weight of 0.711 g l-1. The
melanin production was confirmed by UV–Visible
spectroscopy, FTIR and EPR analysis. Thus, Brevundi-
monas sp. SGJ has the potential to be a new source for the
production of melanin.
Keywords Melanin � Response surface methodology
(RSM) � Brevundimonas sp. SGJ � L-Tyrosine � EPR
Introduction
Melanins are indolic polymers that are widely distrib-
uted throughout the animal and plant kingdoms and are
also synthesized by microorganisms (Riley 1997; Plo-
nka and Grabacka 2006). Melanin synthesis has been
reported by various bacteria and fungi, including
Escherichia coli W3110 (Lagunas-Munoz et al. 2006),
Bacillus cereus (Zhang et al. 2007) and Klebsiella sp.
GSK (Shrishailnath et al. 2010). Fungal species that
synthesize melanin include Cryptococcus neoformans,
Aspergillus fumigatus and Pneumocystis carinii (Plonka
and Grabacka 2006).
The synthesis of melanin in microorganisms has several
functions besides UV protection. Melanin synthesis has
been associated with virulence for a variety of pathogenic
microbes such as Cryptococcus neoformans and Burk-
holderia cepacia. Melanin binds with the antibiotics and
confers the emerging resistance of pathogenic bacteria to
the antibiotics. Consequently, melanin and melanin syn-
thesis pathways are potential targets for antimicrobial drug
discovery (Plonka and Grabacka 2006; Nosanchuk and
Casadevall 2006).
Melanins confer resistance to UV light by absorbing a
broad range of the electromagnetic spectrum and pre-
venting photo-induced damage. Consequently, melanins
are widely used in cosmetics, photo protective creams,
Electronic supplementary material The online version of thisarticle (doi:10.1007/s13205-012-0082-4) contains supplementarymaterial, which is available to authorized users.
S. N. Surwase
Department of Microbiology, Shivaji University,
Kolhapur 416004, India
S. B. Jadhav � S. S. Phugare
Department of Biochemistry, Shivaji University,
Kolhapur 416004, India
J. P. Jadhav (&)
Department of Biotechnology, Shivaji University,
Vidyanagar, Kolhapur 416004, India
e-mail: [email protected]
123
3 Biotech (2013) 3:187–194
DOI 10.1007/s13205-012-0082-4
eyeglasses and protective agents in Bacillus thuringenesis
insecticidal crystals (Zhang et al. 2007). The melanin
producing microorganism can also be used for immobi-
lization of radioactive waste such as uranium (Turick
et al. 2008). In addition, melanin synthesis genes from
bacteria have been used as reporter genes to screen
recombinant bacterial strains (Adham et al. 2003). Other
reports have showed the anti-HIV properties of melanin
as well as their usefulness for photo voltage generation
and fluorescence studies (Montefiori and Zhou 1991;
Hanyz and Wrobel 2003). Melanoma poses an increasing
health problem that affects about 40,000 patients each
year in the United States and an estimated 100,000
worldwide. Earlier experiments in mice have concluded
that fungal (Cryptococcus neoformans) melanin can be
used to generate monoclonal antibodies (mAb) for the
treatment of human metastatic melanoma. This antibody
also binds human melanin since both fungal and human
melanins have structural similarities (Dadachova et al.
2008).
The optimization of fermentation conditions, particu-
larly physical and nutritional parameters, are of primary
importance in the development of any fermentation process
owing to their impact on the economy and practicability of
the process. Medium optimization and physical conditions
have been traditionally performed using one-factor-at-a-
time method. The disadvantages of such a classical method
are that it is time consuming, laborious and expensive; in
addition, it fails to determine the combined effect of dif-
ferent factors. Hence, researchers are encouraged to apply
statistical experimental approaches such as response sur-
face methodology (RSM), which provide a great amount of
information based on only a small number of experiments
(Aghaie-Khouzania et al. 2012).
Given the potential uses of melanin and their high
demand, the need for the statistical development of low
cost process exists. The objective of this study was to
screen and optimize the process parameters using Plackett–
Burman design and Box–Behnken design of RSM in order
to increase the production of melanin by the Brevundi-
monas sp. SGJ.
Methods
Chemicals and microorganism
Melanin (synthetic) and L-tyrosine were purchased from
Sigma-Aldrich Co. (St. Louis, MO, USA) whereas other
chemicals were procured from HiMedia (India). The mel-
anin-producing bacterial strain was isolated from garden
soil of Shivaji University, Kolhapur, India, using serial
dilution technique on a nutrient agar (HiMedia, India)
supplemented with 1 g l-1L-tyrosine.
Melanin production
The nutrient broth (HiMedia, India) used for the cultivation
of the isolated bacterium consisted of 5 g l-1 peptone,
1.5 g l-1 beef extract, 1.5 g l-1 yeast extract, and 0.5 g l-1
NaCl, supplemented with 1 g l-1L-tyrosine and with a pH
of 7. The 6-h grown, 2-ml cell suspension was inoculated
in 100 ml of the same medium for melanin production in
250-ml Erlenmeyer flasks. The flasks were kept in an
incubator shaker at 30 �C and 120 rpm; melanin was
assayed after 48 h. Melanin production in the broth was
assayed spectrophotometrically at 475 nm using a cali-
bration curve of standard synthetic melanin (Sigma-
Aldrich, St. Louis, USA) (Hoti and Balaraman 1993).
Experimental design and statistical analysis
Plackett–Burman design
A Plackett–Burman design was used to select the most
critical media components for melanin production by
Brevundimonas sp. SGJ. The factors affecting the yield of
melanin were selected by screening various carbon sources,
nitrogen sources, and mineral salts and physical conditions
such as pH and temperature. In addition, some of these
variables were selected from the primary literature review
(Lagunas-Munoz et al. 2006; Shrishailnath et al. 2010).
A total of 11 process parameters, including pH (X1),
temperature (X2), tryptone (X3), yeast extract (X4), beef
extract (X5), glucose (X6), L-tyrosine (X7), CuSO4 (X8),
MgSO4 (X9), K2HPO4 (X10), and NaCl (X11) were added at
two levels: low (-1) and high (?1). The low and high levels
of these factors were taken as pH (5 and 7), temperature (20
and 40 �C), while levels of media components were tryp-
tone (0.5 and 2.5 g l-1), yeast extract (0.5 and 2.5 g l-1),
beef extract (0.5 and 2.5 g l-1), glucose (0.5 and 2.5 g l-1),
L-tyrosine (0.5 and 2.5 g l-1), CuSO4 (0.01 and 0.05 g l-1),
MgSO4 (0.001 and 0.005 g l-1), K2HPO4 (0.5 and
2.5 g l-1) and NaCl (0.1 and 0.5 g l-1). This design char-
acterizes a model that identifies the significant variables
when no interaction among the factors is expected (Plackett
and Burman 1946; Wang and Lu 2005; Anderson and
Whitcomb 2005). The design matrix created using the
Design Expert software (version 8.0, Stat-Ease Inc., Min-
neapolis, USA) is presented in Table S1. Three replicates at
the center point were also performed to find the curvature
that may exist in the model and the pure experimental error,
which shows lack-of-fit. The statistical significance of the
first-order model was identified using Fisher’s test for
analysis of variance (ANOVA) (Wang and Lu 2005).
188 3 Biotech (2013) 3:187–194
123
Box–Behnken design
Once the critical factors were identified via screening, a
Box–Behnken design for independent variables was used
for further optimization. Four variables at three levels were
used to fit a polynomial model (Box and Behnken 1960;
Anderson and Whitcomb 2005; Wang and Lu 2005). A
second-order model is designed such that the variance of
Y is constant for all points equidistant from the center of the
design. The Design Expert software (version 8.0, Stat-Ease
Inc., Minneapolis, USA) was used in the experimental
design and data analysis. Response surface graphs were
obtained to understand the effect of the variables, indi-
vidually and in combination, and to determine their opti-
mum levels for maximum melanin production. All trials
were performed in triplicate, and the average melanin yield
was used as response Y.
Tyrosinase activity, biomass trend and melanin production
After validation of the experiment using the optimum
process parameters generated by the Design Expert soft-
ware (Stat-Ease Inc., USA), the melanin production was
observed with the process parameters before optimization
(nutrient broth with 1 g l-1L-tyrosine) and after optimi-
zation. The biomass trend, tyrosinase activity, and melanin
production were observed at 6-h time intervals for up to
48 h. The tyrosinase activity was determined by the pre-
viously described method (Kandaswami and Vaidyanathan
1973; Ali et al. 2007). The final assay concentration in the
3.0 ml reaction mixture contained 50 mM potassium
phosphate (pH 7.4), 0.17 mM catechol, 0.070 mM and L-
ascorbic acid equilibrated to 25 �C. The DA265 nm was
monitored until constant, and then 0.1 ml of the cell-free
broth was added. The decrease in the DA265 nm was
recorded for 1 min. The DA265 nm was obtained using the
maximum linear rate for both the test and the control. One
unit of tyrosinase activity was equal to a DA265 nm of 0.001
per min at pH 7.4 at 25 �C in a 3.0-ml reaction mixture
containing L-catechol and L-ascorbic acid. The protein
content in the cell-free broth was determined using Lowry
et al’s (1951) method. The intermittent addition of optimal
L-tyrosine concentration was carried at 6-h time interval
from 24 to 36 h, rather than only an initial concentration
(Lagunas-Munoz et al. 2006).
Purification and analysis of melanin
Melanin was purified from cell-free extract by previously
described methods (Zhang et al. 2007). The chemical
characterization of purified pigment was carried out using
tests described by earlier reports (Zhang et al. 2007;
Shrishailnath et al. 2010). In order to confirm the purified
pigment as melanin, the FTIR (Fourier transform infrared)
analysis was carried out using FTIR spectrometer (Shi-
madzu, Japan) and the EPR analysis was carried out using
method described earlier (Shrishailnath et al. 2010), at the
Department of Biophysics & Center for Imaging Research,
Medical College of Wisconsin, Milwaukee, WI, USA.
Results and discussion
Bacteria have been exploited as a major source of melanin
with potential commercial applications in the fields of
cosmetics, pharmaceuticals and agriculture. However, the
detailed optimization of the process parameters for the
melanin production has not been reported. These factors
may play a vital role in the cost effectiveness of melanin
production, so they were optimized in the current study.
The isolated strain was identified as a novel bacterial
species Brevundimonas sp. SGJ (NCBI Genbank accession
no. HM998899). The phylogenic tree was constructed with
MEGA4 software (AZ, USA) (Tamura et al. 2007; Surwase
and Jadhav 2011) (Fig. S1a). The melanin-producing col-
onies of Brevundimonas sp. SGJ are shown in Fig. S1b
while melanin production in optimized conditions is shown
in Fig. S1c.
Plackett–Burman design for screening of critical factors
Statistical analysis using a Plackett–Burman design indi-
cated that pH (X1), tryptone (X3), L-tyrosine (X7), and
CuSO4 (X8) significantly affected the melanin production,
with p values less than the significance level of 0.05. The
remaining components were found to be insignificant, with
p values above 0.05. The ‘Pareto chart’ (Fig. S2) showed
that the value of L-tyrosine (X7) was above the ‘Bonferroni
Limit’; this indicates it is certainly significant. Also the
values of pH (X1), tryptone (X3) and CuSO4 (X8) were
above the t-value limit that implies that these factors are
possibly significant whereas the remaining factors were
below the t-value limit which indicates their insignificance
(Anderson and Whitcomb 2005). Experimental runs and
their respective melanin yields are presented in Table S1.
Statistical analysis of the responses was performed, as
shown in Table S2. The model F value of 29.73 implies
that the model is significant; there was only a 0.01 %
chance that a model F value this large could occur due to
noise. The ‘‘Adeq Precision’’ ratio of 4.303 obtained in this
study indicates an adequate signal. Thus, this model can be
used to navigate the design space. The R2 value observed
for this model was 0.4549 and the ‘‘Pred R-Squared’’ of
0.2468 is in reasonable agreement with the ‘‘Adj R-
Squared’’ of 0.1823. Regression analysis was done on the
results, and a first-order polynomial equation was derived,
3 Biotech (2013) 3:187–194 189
123
representing melanin production as a function of the
independent variables:
Melanin ¼ 0:35 þ 0:023X1 þ 0:026X3 þ 0:064 X7
þ 0:025X8 ð1Þ
Statistical analysis showed that it is not possible to
evaluate the relationship between significant independent
variables and the response by a first-order equation. Thus,
the first-order model is not appropriate to predict the
response. Indeed, further investigation could be conducted
through a second-order model.
Optimization by response surface methodology
Optimization of process parameters was carried out using
the Box–Behnken design with the parameters found to be
significant from the Plackett–Burman design, including pH
(X1), tryptone (X3), L-tyrosine (X7), and CuSO4 (X8). Table
S3 presents the design matrix and the results of the 29
experiments carried out using the Box–Behnken design.
The results obtained were submitted to ANOVA using the
Design Expert software (version 8.0, Stat-Ease Inc., Min-
neapolis, USA), and the regression model was given as:
MelaninðYÞ ¼ 1:15 � 0:13X1 þ 0:083X3 þ 0:18X7
þ 0:11X8 þ 0:13X1X3�; 0:18X1X7
� 0:11X1X8 þ 0:068X3X7 � 0:081X3X8
þ 0:15X7X8 � 0:23X21 � 0:14X2
2 � 0:39X27
� 0:33X29
ð2Þ
where X1 is pH, X3 is tryptone, X7 is L-tyrosine, and X8 is
CuSO4. The ANOVA of the quadratic regression model
(Table S3) demonstrated that Eq. 2 is a highly significant
model (p = \0.005). The model F value of 29.03 implies
that the model is significant. The goodness of fit of the model
was checked using the determination coefficient (R2). In this
case, the value of the R2 was 0.9667. The value of the
adjusted R2 was 0.9334. It was in reasonable agreement with
the predicted R2 (0.8212). The lack-of-fit value for regression
Eq. 2 was not significant (0.1010), indicating that the model
equation was adequate for predicting the melanin production
under any combination of values of the variables. ‘‘Adeq
Precision’’ measures the signal-to-noise ratio, with a ratio
greater than four considered as desirable (Anderson and
Whitcomb 2005). The ‘‘Adeq Precision’’ ratio of 15.958
obtained in this study indicates an adequate signal. Thus, this
model can be used to navigate the design space (Table S4).
Interaction effects of variables
Statistical analysis using a Plackett–Burman design showed
critical parameters affecting melanin yield and these
parameters were further optimized by Box–Behnken
design. The ANOVA showed the model is significant with
significant statistical values. The graphical representation
provides a method to visualize the relationship between the
response and experimental levels of each variable and the
type of interactions between test variables in order to
deduce the optimum conditions (Wang and Lu 2005).
The interaction effects and optimal levels of the vari-
ables were determined by plotting the three-dimensional
(3D) response surface curves. The response surface curve
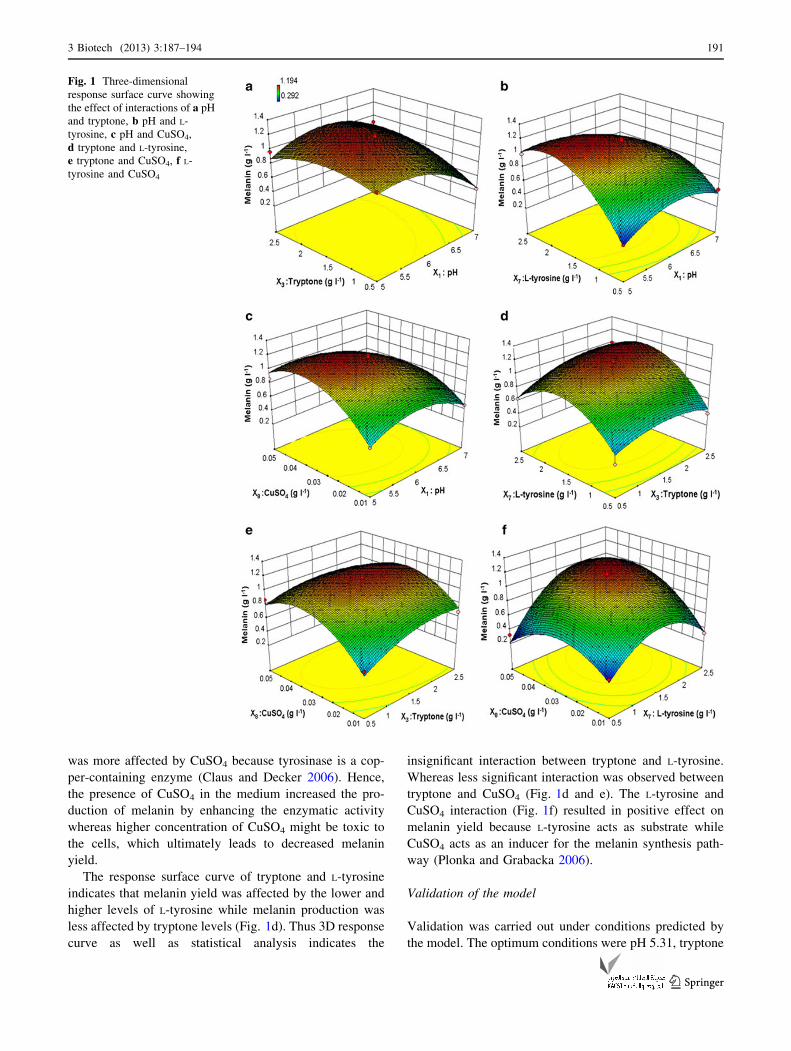
in Fig. 1a represents the interaction between pH and
tryptone, which showed that the maximum melanin yield
was obtained toward acidic pH while melanin yield was
drastically affected with neutral pH. In addition, lower and
higher levels of tryptone resulted in low yields of melanin.
The optimum pH value obtained was slightly acidic while
medium concentrations of the tryptone resulted in maxi-
mum yield. The shape of the response surface curves
showed strong positive interaction between these tested
variables. The interaction among pH and tryptone was
significant, because slightly acidic pH in the present study
might have enhanced the digestion of tryptone, which
released peptides, leading to higher melanin yields. The pH
optima for melanin production from earlier sources were in
the range of 7–7.5. The optimum pH 7.5 have been
reported for melanin production by E. coli (Lagunas-Mu-
noz et al. 2006) while pH 7.2 required by Klebsiella sp.
GSK (Shrishailnath et al. 2010). In previous reports of
melanin production, various organic nitrogen sources have
been used in the medium, including casein for Bacillus
thuringiensis (Chen et al. 2004), wheat flour and yeast
flour, whereas bactotyptone and casein were used with
Bacillus cereus (Zhang et al. 2007).
Figure 1b depicts the interaction of pH and L-tyrosine
where the shape of the response surface curve indicates that
melanin yield was mainly affected by interaction between
these two factors. The slight alteration in concentration of
these components leads to higher difference in the levels of
produced melanin. Melanin production increased with
acidic pH and higher L-tyrosine concentrations. The inter-
action between pH and L-tyrosine was found to be highly
significant because L-tyrosine is the substrate for melanin
production and its solubility decreases at neutral and
alkaline conditions, while L-tyrosine is soluble at acidic
conditions (Surwase and Jadhav 2011; Lagunas-Munoz
et al. 2006). The response surface curve for the interaction
of pH and CuSO4 is represented in Fig. 1c. The shape of
response surface curve shows a less significant interaction
between these two variables. The melanin yield was found
to be increased with higher concentrations of CuSO4 with
slightly acidic pH. The results showed that melanin pro-
duction was most affected by CuSO4 levels than pH. The
pH and CuSO4 interaction showed that melanin production
190 3 Biotech (2013) 3:187–194
123
was more affected by CuSO4 because tyrosinase is a cop-
per-containing enzyme (Claus and Decker 2006). Hence,
the presence of CuSO4 in the medium increased the pro-
duction of melanin by enhancing the enzymatic activity
whereas higher concentration of CuSO4 might be toxic to
the cells, which ultimately leads to decreased melanin
yield.
The response surface curve of tryptone and L-tyrosine
indicates that melanin yield was affected by the lower and
higher levels of L-tyrosine while melanin production was
less affected by tryptone levels (Fig. 1d). Thus 3D response
curve as well as statistical analysis indicates the
insignificant interaction between tryptone and L-tyrosine.
Whereas less significant interaction was observed between
tryptone and CuSO4 (Fig. 1d and e). The L-tyrosine and
CuSO4 interaction (Fig. 1f) resulted in positive effect on
melanin yield because L-tyrosine acts as substrate while
CuSO4 acts as an inducer for the melanin synthesis path-
way (Plonka and Grabacka 2006).
Validation of the model
Validation was carried out under conditions predicted by
the model. The optimum conditions were pH 5.31, tryptone
Fig. 1 Three-dimensional
response surface curve showing
the effect of interactions of a pH
and tryptone, b pH and L-
tyrosine, c pH and CuSO4,
d tryptone and L-tyrosine,
e tryptone and CuSO4, f L-
tyrosine and CuSO4
3 Biotech (2013) 3:187–194 191
123
1.440 g l-1, L-tyrosine 1.872 g l-1 and CuSO4 0.0366
g l-1. The predicted yield of melanin with these values is
1.238 g l-1 and the actual yield obtained was 1.227 g l-1.
The close correlation was seen between the experimental
and predicted values which validate the model. The pre-
dicted yield of melanin by optimal levels of the variable
generated by the model was in close correlation with
experimental value, which signifies the RSM methodology
over traditional optimization approach. In addition, the
increased melanin production was observed with the
parameters optimized using RSM than the initially used
conditions.
Melanin yield, biomass trend and tyrosinase activity
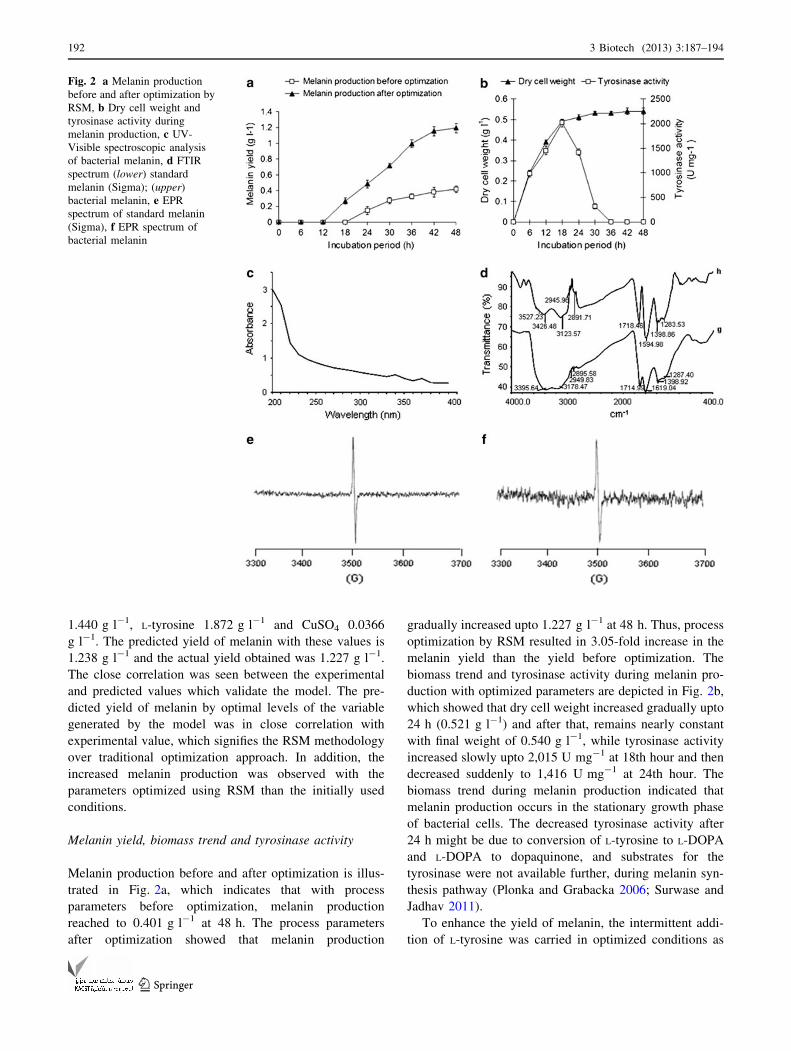
Melanin production before and after optimization is illus-
trated in Fig. 2a, which indicates that with process
parameters before optimization, melanin production
reached to 0.401 g l-1 at 48 h. The process parameters
after optimization showed that melanin production
gradually increased upto 1.227 g l-1 at 48 h. Thus, process
optimization by RSM resulted in 3.05-fold increase in the
melanin yield than the yield before optimization. The
biomass trend and tyrosinase activity during melanin pro-
duction with optimized parameters are depicted in Fig. 2b,
which showed that dry cell weight increased gradually upto
24 h (0.521 g l-1) and after that, remains nearly constant
with final weight of 0.540 g l-1, while tyrosinase activity
increased slowly upto 2,015 U mg-1 at 18th hour and then
decreased suddenly to 1,416 U mg-1 at 24th hour. The
biomass trend during melanin production indicated that
melanin production occurs in the stationary growth phase
of bacterial cells. The decreased tyrosinase activity after
24 h might be due to conversion of L-tyrosine to L-DOPA
and L-DOPA to dopaquinone, and substrates for the
tyrosinase were not available further, during melanin syn-
thesis pathway (Plonka and Grabacka 2006; Surwase and
Jadhav 2011).
To enhance the yield of melanin, the intermittent addi-
tion of L-tyrosine was carried in optimized conditions as
Fig. 2 a Melanin production
before and after optimization by
RSM, b Dry cell weight and
tyrosinase activity during
melanin production, c UV-
Visible spectroscopic analysis
of bacterial melanin, d FTIR
spectrum (lower) standard
melanin (Sigma); (upper)
bacterial melanin, e EPR
spectrum of standard melanin
(Sigma), f EPR spectrum of
bacterial melanin
192 3 Biotech (2013) 3:187–194
123
described previously (Lagunas-Munoz et al. 2006). The
1.872 g l-1L-tyrosine was added intermittently with 6-h
time interval from 24 to 36 h, which resulted in the highest
yield of yield of 6.811 g l-1 melanin after 54 h. A litera-
ture survey revealed that Brevundimonas sp. SGJ used in
this study produced the highest amount of melanin within
the shortest incubation period (54 h). The other studies
have reported isolation and characterization of melanin
includes: Klebsiella sp. GSK which produced 0.540 g l-1
within 84 h of incubation, while melanin synthesis from
Frankia strain Cel5 was about 0.180 g l-1 (Shrishailnath
et al. 2010). On fungal strains, previous work was focused
on the role of melanin synthesis in pathogenesis and vir-
ulence (Plonka and Grabacka 2006). As compared to ear-
lier reports Brevundimonas sp. SGJ has several advantages
over previously studied bacteria and fungi such as a shorter
incubation period, efficient melanin production and simple
and minimum medium components rather than complex
medium requirements.
Analysis of melanin
The chemical characterization results showed that the
purified dark brown powder was insoluble in water, 5 M
HCl, ethanol, benzene, chloroform and acetone, while it
was soluble in 1 M KOH and 1 M NaOH. It was decol-
orized after addition of H2O2; after the addition of KMnO4,
the color of the pigment changed from brown to green,
with further precipitate formation and discoloration. A
brown precipitate was produced when it was reacted with
FeCl3. These results were identical to standard melanin
(Sigma). The identical result for bacterial pigment and
standard melanin obtained by chemical characterization
primarily confirms the melanin nature of the pigment
(Shrishailnath et al. 2010).
The UV absorption spectrum of the melanin produced in
this study was analogous to synthetic melanin (Fig 2c),
which was reported to be monotonic, broad band and
without distinct absorption peaks. It primarily confirmed
that the bacterial pigment produced here was melanin
(Meredith and Sarna 2006). The FTIR spectra of standard
melanin and the produced pigment indicated a high degree
of resemblance in the main absorption peaks (Fig. 2d),
confirming that purified pigment was melanin (Shrishail-
nath et al. 2010). The electron paramagnetic resonance
(EPR) spectra of standard melanin sigma and bacterial
melanin is presented in Fig. 2e and f. The EPR spectrum of
bacterial melanin shows g-value of 2.009 while g-value of
standard melanin (Sigma) is 2.004. The EPR analysis of the
microbial melanin showed a nearly identical g-value
compared to standard synthetic melanin (Sigma), and
showed resemblance, which confirmed that the purified
pigment was melanin (Shrishailnath et al. 2010).
Conclusion
From the results of this study, it is concluded that the use of
this statistical method not only helped in locating the opti-
mum levels of the most significant factors considered with
minimum resources and time but also proved to be useful and
satisfactory in this process-optimizing exercise. Thus, the
optimization of vital nutritional parameters using response
surface methodology significantly enhanced the yield of
melanin as proved its feasibility for large-scale production
by Brevundimonas sp. SGJ. So the Brevundimonas sp. SGJ
can be a potential source for melanin production.
Acknowledgments Shripad N. Surwase is thankful to Dr. James S.
Hyde and Dr. Christopher C. Felix, Department of Biophysics and
Center for Imaging Research Medical College of Wisconsin, Mil-
waukee, WI, USA, for providing EPR analysis facility. Shripad N.
Surwase, one of the authors is thankful to Lady Tata Memorial Trust,
Mumbai, Maharashtra, India for awarding Junior Research Scholar-
ship for his doctoral research. Shekhar B. Jadhav is thankful to
Department of Science and Technolgy, Government of India, for
providing fellowship under DST-PURSE program. Swapnil S.
Phugare is thankful to Jawaharlal Nehru Memorial Fund, India for
awarding Junior Research Scholarship.
Conflict of interest The authors declare that they have no conflict
of interest.
Open Access This article is distributed under the terms of the
Creative Commons Attribution License which permits any use, dis-
tribution, and reproduction in any medium, provided the original
author(s) and the source are credited.
References
Adham S, Rodriguez S, Santamaria A, Gil J (2003) An improved
vectors for transcriptional/translational signal screening in
corynebacteria using the melC operon from Streptomycesglaucescens as reporter. Arch Microbiol 180:53–59
Aghaie-Khouzania M, Forootanfara H, Moshfegha M, Khoshayandc
MR, Faramarzia MA (2012) Decolorization of some synthetic
dyes using optimized culture broth of laccase producing
ascomycete Paraconiothyrium variabile. Biochem Eng 60:9–15
Ali S, Jeffry S, Haq I (2007) High performance microbiological
transformation of L-tyrosine to L-dopa by Yarrowia lipolyticaNRRL-143. BMC Biotechnol 7:50–57
Anderson M, Whitcomb P (2005) RSM simplified-optimizing process
using response surface methods for design of experiments.
Productivity Press, New York
Box GEP, Behnken DW (1960) Some new three level designs for the
study of quantitative variables. Technometrics 2:455–475
Chen Y, Deng Y, Wang J, Cai J, Ren G (2004) Characterization of
melanin produced by a wild-type strain of Bacillus thuringiensis.
J Gen Appl Microbiol 50:183–188
Claus H, Decker H (2006) Bacterial tyrosinases. Syst Appl Microbiol
29:3–14
Dadachova E, Revskaya E, Sesay MA, Damania H, Boucher R,
Sellers RS, Howell RC, Burns L, Thornton GB, Natarajan A,
Mirick GR, DeNardo SJ, DeNardo GL, Casadevall A (2008) Pre-
clinical evaluation and efficacy studies of a melanin-binding IgM
3 Biotech (2013) 3:187–194 193
123
antibody labeled with 188Re against experimental human
metastatic melanoma in nude mice. Cancer Biol Ther 7:1116–
1127
Hanyz I, Wrobel D (2003) Photo voltage generation and fluorescence
of charged tetraphenylporphyrins with dopa melanin. Cryst Res
Technol 38:325–330
Hoti S, Balaraman K (1993) Formation of melanin pigment by a
mutant of Bacillus thuringiensis H-14. J Gen Microbiol
139:2365–2369
Kandaswami C, Vaidyanathan CS (1973) Enzymatic assay of
tyrosinase catechol oxidase activity (EC 1.14.18.1). J Biol Chem
248:4035–4039
Lagunas-Munoz VH, Cabrera-Valladares N, Bolıvar F, Gosset G,
Martınez A (2006) Optimum melanin production using recom-
binant Escherichia coli. J Appl Microbiol 101:1002–1008
Lowry O, Rosbrough N, Farr A, Randall R (1951) Protein measure-
ment with the folin phenol reagent. J Biol Chem 193:265–275
Meredith P, Sarna T (2006) The physical and chemical properties of
eumelanin. Pigment Cell Res 19:572–594
Montefiori D, Zhou J (1991) Selective antiviral activity of synthetic
soluble L-tyrosine and L-DOPA melanins against human immu-
nodeficiency virus in vitro. Antivir Res 15:11–26
Nosanchuk J, Casadevall A (2006) Impact of melanin on microbial
virulence and clinical resistance to antimicrobial compounds.
Antimicrob Agents Chemother 50:3519–3528
Plackett RL, Burman JP (1946) The design of optimum multifactorial
experiments. Biometrika 33:305–325
Plonka P, Grabacka M (2006) Melanin synthesis in microorganisms-
biotechnological and medical aspects. Acta Biochim Pol
53:429–443
Riley P (1997) Molecules in focus Melanin. Int J Biochem Cell Biol
29:1235–1239
Shrishailnath S, Kulkarni G, Yaligara V, Kyoung L, Karegoudar T
(2010) Purification and physiochemical characterization of
melanin pigment from Klebsiella sp. GSK. J Microbiol Biotech-
nol 20:1513–1520
Surwase SN, Jadhav JP (2011) Bioconversion of L-tyrosine to L-
DOPA by a novel bacterium Bacillus sp. JPJ. Amino Acids
41:495–506
Tamura K, Dudley J, Nei M, Kumar S (2007) MEGA4: molecular
evolutionary genetics analysis (MEGA) software version 4.0.
Mol Biol Evol 24:1596–1599
Turick C, Knox A, Leverette C, Kritzas Y (2008) In situ uranium
stabilization by microbial metabolites. J Enviro Radioact
99:890–899
Wang Y, Lu Z (2005) Optimization of processing parameters for the
mycelial growth and extracellular polysaccharide production by
Boletus spp. ACCC 50328. Process Biochem 40:1043–1051
Zhang J, Cai J, Deng Y, Chen Y, Ren G (2007) Characterization of
melanin produced by a wild-type strain of Bacillus cereus. Front
Biol China 2:26–29
194 3 Biotech (2013) 3:187–194
123


![Melanin Translation[1]](https://img.pdfslide.us/doc/110x75/577d22411a28ab4e1e96f1ae/melanin-translation1.jpg)