Embed Size (px)
Citation preview
International Research Journal of Earth Sciences______________________________________ ISSN 2321–2527
Vol. 3(4), 27-35, April (2015) Int. Res.J. Earth Sci.
International Science Congress Association 27
Optimization of Extreme-Weather Forecasting Systems in Developing
Nations Ratnaksha Lele
1*and Arun Lakshmanan
1,2
1School of Mechanical and Building Sciences, VIT University, Vellore, INDIA 2Department of Aerospace Engineering, University of Illinois at Urbana-Champaign, Illinois, USA
Available online at: www.isca.in, www.isca.me Received 27th February 2015, revised 9th March 2015, accepted 11th April 2015
Abstract
Severe weather events torment the developing world each year crippling their already fragile infrastructure – resulting in
innumerable casualties. Advances in numerical modeling have greatly enhanced the capability to accurately forecast weather
using personal computers. The recent Uttarakhand cloud-burst of 2013 in India, prompted us to re-evaluate the entire
framework of the weather alert systems currently in place in developing nations. We propose an efficient forecast-alert system
in developing nations based on advances in mesoscale weather forecasting. With the active involvement of local educational
institutions in weather prediction, faster dissemination of alerts can be achieved. This can be made time-effective by
optimizing parameters within numerical weather prediction models. Such a strategy extended across the developing world can
yield expeditious forecasts ensuring prompt evacuation and thereby saving countless lives
Keywords: Numerical weather prediction, extreme weather, decentralized system, early warning, weather research forecasting
model, microphysics parameterization.
Introduction
Owing to advances in numerical weather prediction, hazardous
weather can be accurately forecast for any region of the world
with sufficient warning time for contingency measures to be put
into place. Numerical Weather Prediction models (NWP)
models have become increasingly popular with meteorological
agencies for issuing not only forecasts 1-2 days in advance, but
also extreme weather forecasts for systems like tropical
cyclones, tornadoes and other heavy precipitation events.
Consequently, these weather systems have also been the focus
of many modeling studies including the developing regions of
the world.
Studies have been conducted on the effect of precipitation
physics of numerical models on hurricane simulations, and the
impact of microphysics and planetary boundary layer schemes
on extreme rainfall associated with typhoons1,2
. Numerous other
researches conducted globally have demonstrated the extreme
weather simulation capabilities of numerical models in different
geographical regions, and have assessed the accuracy of these
simulations and their response to changes in various
parameterizations within these models3,4,5
. Studies over the
Indian region have also tried to detect and monitor severe
thunderstorm and heavy rainfall events especially during pre-
monsoon and monsoon times using the WRF model6.
Although substantial advancement has eventuated in mesoscale
modeling since they first came into being, they still exhibit
uncertainties and often misrepresent the physical processes
occurring due to lack of computational precision, resulting in
inaccurate forecasts. One of the existing difficulties with respect
to regional forecasts is the data insufficiencies and extrapolation
needed due to inadequate and inaccurate observational data.
Improvements in satellite observations have made it possible to
monitor the atmosphere and ocean where in-situ observations
aren’t feasible. Studies have shown that remote sensing has
improved forecasting of mesoscale weather systems7 yet; results
from them are not robust to reach a firm conclusion due to the
lack of forecast samples and statistics.
In the Indian-subcontinent, global warming has led to trends of
increased destructiveness of cyclonic activities and acute
precipitation events8,9
. On the other hand, advances in numerical
modeling have greatly enhanced our capability to accurately
forecast weather using personal computers. Although, an
extensive system for weather forecasting exists, inconsistent
communication between central organizations and the public
necessitates the decentralization of weather prediction by the
dissemination of forecasts over regional scales through
simulations performed at local universities or institutes. It has
been shown10,11
that simulated rainfall patterns are strongly
influenced by the choice of convective scheme. The model
response to changes in grid spacing or soil moisture12
is also
affected by convective schemes chosen for the simulation. Since
no scheme is consistently better than the other13
, accurate
prediction of warm season rainfall is extremely challenging,
with such extreme sensitivities to one parameterization alone.
This report discusses the methodology to optimize these
parameters over the Indo-Himalayan region based on the mid-
June 2013 pre-monsoon catastrophe which had left over 100,000
International Research Journal of Earth Sciences_
Vol. 3(4), 27-35, April (2015)
International Science Congress Association
people stranded and 6,000 dead in the northern
Uttarakhand, as reported by the BBC and The Hindu. The
domain of our study as mentioned above, lies in the primarily
mountainous state of Uttarakhand (figure-1), which is
by numerous tributaries of the Ganges. This is a region very
prone to landslides and floods due to heavy summer rainfall, and
improving weather forecasting for such a region is a vital
challenge.
Despite reasonably good forecasts, most developin
lack a robust system to identify and broadcast alerts for extreme
weather events. The story of the mid June 2013 catastrophe that
struck the state of Uttarakhand in northern India bears an
unfortunate familiarity to this situation. Unusually he
monsoon showers triggered numerous landslides and
widespread floods across the mountainous regions of northern
Domain and topography of Uttarakhand (240km x 240km) and TRMM multisatellite precipitation analysis data
(A) The region of the simulation is in Uttarakhand a state in Northern India. (B) Terrain view of the spec
Actual precipitation (in mm) between 16 June 1200Z to 1500Z (c), 1500Z to 1800Z (d), 1800Z to 2100Z (e), 2100Z to 17 June
C
A
Sciences____________________________________________________
International Science Congress Association
people stranded and 6,000 dead in the northern-Indian state of
as reported by the BBC and The Hindu. The
above, lies in the primarily
1), which is traversed
by numerous tributaries of the Ganges. This is a region very
prone to landslides and floods due to heavy summer rainfall, and
improving weather forecasting for such a region is a vital
Despite reasonably good forecasts, most developing countries
lack a robust system to identify and broadcast alerts for extreme
weather events. The story of the mid June 2013 catastrophe that
struck the state of Uttarakhand in northern India bears an
unfortunate familiarity to this situation. Unusually heavy pre-
monsoon showers triggered numerous landslides and
widespread floods across the mountainous regions of northern
India. Uttarkashi and Rudraprayag districts in Uttarakhand were
among the most severely affected as reported by the Hindustan
Times. Incessant rains of this magnitude not being uncommon in
the months of July and August when the South
system engulfs the entire subcontinent, little precautionary
measures were taken despite the Indian Meteorological
Department (IMD) ‘heavy rainfall’ forecast 48hrs prior to the
disastrous rains. Circumstances were wildly different in June
with substantial amounts of snow still on the ground in the high
Himalayan regions. Rainfall with snow on the ground is tailor
made to trigger landslide activity (D. Petley
events at Kedarnath using data, images and eye
Unpublished Data. A series of events including collapse of a
glacial lake, numerous landslides and unremitting rainfall
induced floods, spawning the biggest envir
in India after the 2004 Tsunami.
Figure-1
Domain and topography of Uttarakhand (240km x 240km) and TRMM multisatellite precipitation analysis data
(A) The region of the simulation is in Uttarakhand a state in Northern India. (B) Terrain view of the spec
Actual precipitation (in mm) between 16 June 1200Z to 1500Z (c), 1500Z to 1800Z (d), 1800Z to 2100Z (e), 2100Z to 17 June
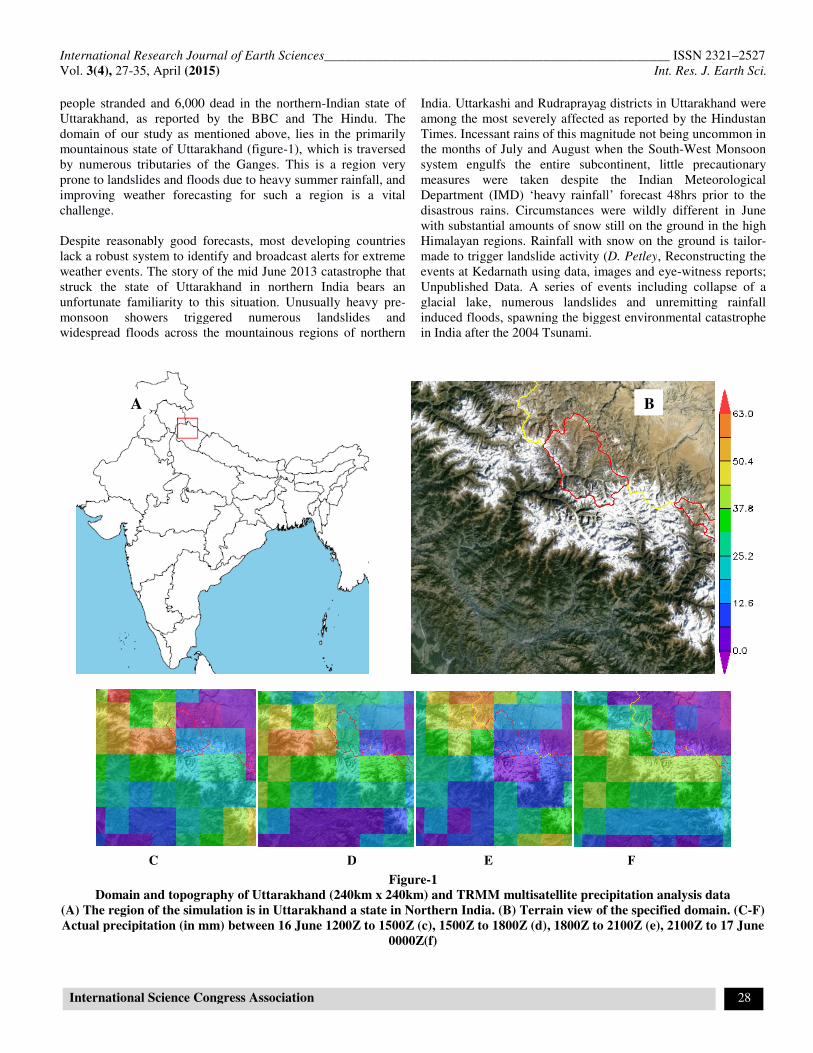
0000Z(f)
D E
____________ ISSN 2321–2527
Int. Res. J. Earth Sci.
28
India. Uttarkashi and Rudraprayag districts in Uttarakhand were
among the most severely affected as reported by the Hindustan
ssant rains of this magnitude not being uncommon in
the months of July and August when the South-West Monsoon
system engulfs the entire subcontinent, little precautionary
measures were taken despite the Indian Meteorological
l’ forecast 48hrs prior to the
disastrous rains. Circumstances were wildly different in June
with substantial amounts of snow still on the ground in the high
Himalayan regions. Rainfall with snow on the ground is tailor-
D. Petley, Reconstructing the
events at Kedarnath using data, images and eye-witness reports;
Unpublished Data. A series of events including collapse of a
glacial lake, numerous landslides and unremitting rainfall
induced floods, spawning the biggest environmental catastrophe
Domain and topography of Uttarakhand (240km x 240km) and TRMM multisatellite precipitation analysis data
(A) The region of the simulation is in Uttarakhand a state in Northern India. (B) Terrain view of the specified domain. (C-F)
Actual precipitation (in mm) between 16 June 1200Z to 1500Z (c), 1500Z to 1800Z (d), 1800Z to 2100Z (e), 2100Z to 17 June
F
B
International Research Journal of Earth Sciences____________________________________________________ ISSN 2321–2527
Vol. 3(4), 27-35, April (2015) Int. Res. J. Earth Sci.
International Science Congress Association 29
Methodology
Background and Objectives: Since global weather forecast
models are expensive to build and maintain and are conducted
only by a few national or multinational governmental
organizations, a localized network of forecast stations capable of
running real-time forecasts at low computational costs over
regional scales need to be developed. Better prediction of
Mesoscale Convective System (MCS) rainfall requires the
understanding of how numerical weather prediction models
respond to changes in physical schemes. MCS consists of
thunderstorms that produce a contiguous precipitation area of
around 100 km or more in at least one direction14
and their
dynamics is more complex than usual cumulonimbus clouds15
.
Prediction techniques of such systems can be classified into two
groups16
, an implicit historical treatment of thunderstorm
extrapolation, and the other being explicitly through the use of
high resolution numerical weather models. Inadequate modeling
capability of sub-grid convection is one of the major
impediments associated with poor performance of numerical
models17
. As discussed earlier, numerous studies have
demonstrated the variability of simulations of numerical models
in response to microphysical schemes, spatial resolutions, and
convective schemes. Planetary boundary layer schemes can
affect the temperature and moisture profiles in the lower
troposphere which could in turn affect other parameterizations
to influence simulation of precipitation18,19
; it is therefore
essential to statistically study the impacts of these physical
parameterizations on extreme weather forecasts20, 21
. Our study
will use the WRF model to explore these issues. The main
objective of this study is to comprehensively investigate the
impact of microphysical parameterization and its interaction on
MCS rainfall forecasts, based on a known extreme precipitation
event, conducted over an area prone to extreme precipitation
events in Northern India.
Model Description: The NWP model used in this study is the
community WRF22
(Weather Research and Forecasting) ARW
(Advanced Research WRF) model, version 3.3.1, developed
primarily at the National Center for Atmospheric Research
(NCAR) in collaboration with different agencies like the
National Oceanic and Atmospheric Administration (NOAA), the
National Center for Environmental Prediction (NCEP), and
many others. The WRF is a limited-area, non-hydrostatic,
primitive-equation model with multiple options for various
physical parameterisation schemes. Use of the WRF model is of
particular merit since WRF will be increasingly used to generate
ensemble forecasts in the near future23
. The model was
initialized using the GFS (Global Forecast System) dataset
(National Centers for Environmental Prediction/National
Weather Service/NOAA/U.S. Department of Commerce, 2000)
initial conditions of 0.5 degree resolution at 1200Z on 16th
June
2013. The boundary conditions were updated on a 3 hourly basis
from the GFS analysis till 0000Z on 17th
June 2013. The WRF
model output was compared to the NASA’s TRMM (Tropical
Rainfall Measuring Mission) Multi Satellite Precipitation
Analysis (TMPA) precipitation dataset providing precipitation
estimates derived from remote sensing calculations for the
domain of our research.
Numerical Experiment: The output data from both the WRF
and TMPA were compared spatially and temporally using
statistical scores for model validation and verification. Scoring
methodology used for statistical validation24
has been
extensively used to assess the performance of a model
simulation relative to the observed (validation), or to compare
the performance of other model simulations (inter-comparison).
The statistical scores were compared using a 2 x 2 contingency
table25
(table-1) where each element (A, B, C, D) holds the
number of combination of model prediction and observation in a
given statistical population
The bias score (BIAS) determines the tendency of the system to
either under predict (BIAS < 1) or over predict (BIAS > 1)
events. It cannot be used as a measure of accuracy since it only
compares the frequencies of observed and forecasted events. It
can be defined as:
���� =�
�=
�
�� (1)
Here F is the number of cases where the event was predicted,
and O pertains to the number of cases where the event was
observed.
The False Alarm Rate (FAR), as the name suggests computes
how inaccurate the system is at predicting correct occurrences.
FAR can be described as a proportion of falsely predicted events
(B) amongst forecasted events (F) ranging between a perfect
score of 0 and 1 indicating no skill.
�� =
�=
� (2)
The frequently used Critical Success Index (CSI) and Heidke
Skill Score (HSS) were computed as:
��� =�
�� (3)
��� =�������
�������������� (4)
Unlike FAR, CSI is adjusted to describe the skill of the system by
accounting for both the false alarms as well as unpredicted events.
The scoring scheme for CSI is similar to that of FAR. HSS pertains
to how good the system forecasts with respect to a randomly
generated forecast. A negative score implies that a forecast
influenced by chance is more accurate than the set of predicted
events, whereas a perfect forecast would entail a HSS score of 1.
Figure-1 shows the domain of this study (31°40’to 30°N and
78°E to 80°E) which is a 180 km x 180 km area in the Indian
state of Uttarakhand. The figure also shows satellite data of
International Research Journal of Earth Sciences____________________________________________________ ISSN 2321–2527
Vol. 3(4), 27-35, April (2015) Int. Res. J. Earth Sci.
International Science Congress Association 30
accumulated rainfall from TMPA with a temporal resolution of
3 hours from 16th
June 2013 1200hrs(Z) to 17th
June 2013
0000hrs(Z). The maximum precipitation of over 63 mm in a 3
hour period occurred in the north-western part of the domain.
We chose to simulate forecasts for short periods of time to
decrease of the magnitude of accumulated errors. They also
result in low computational cost, curbing the restraints due to the
unavailability of high performance computing facilities in most
local institutes in the developing world.
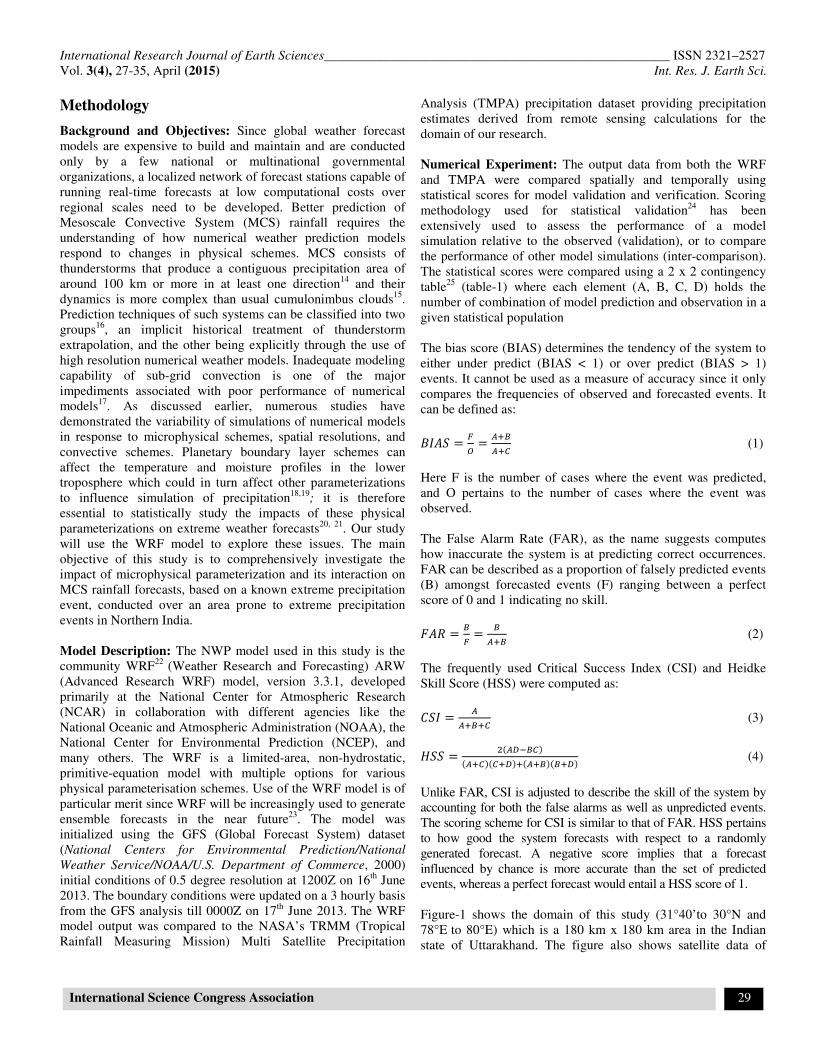
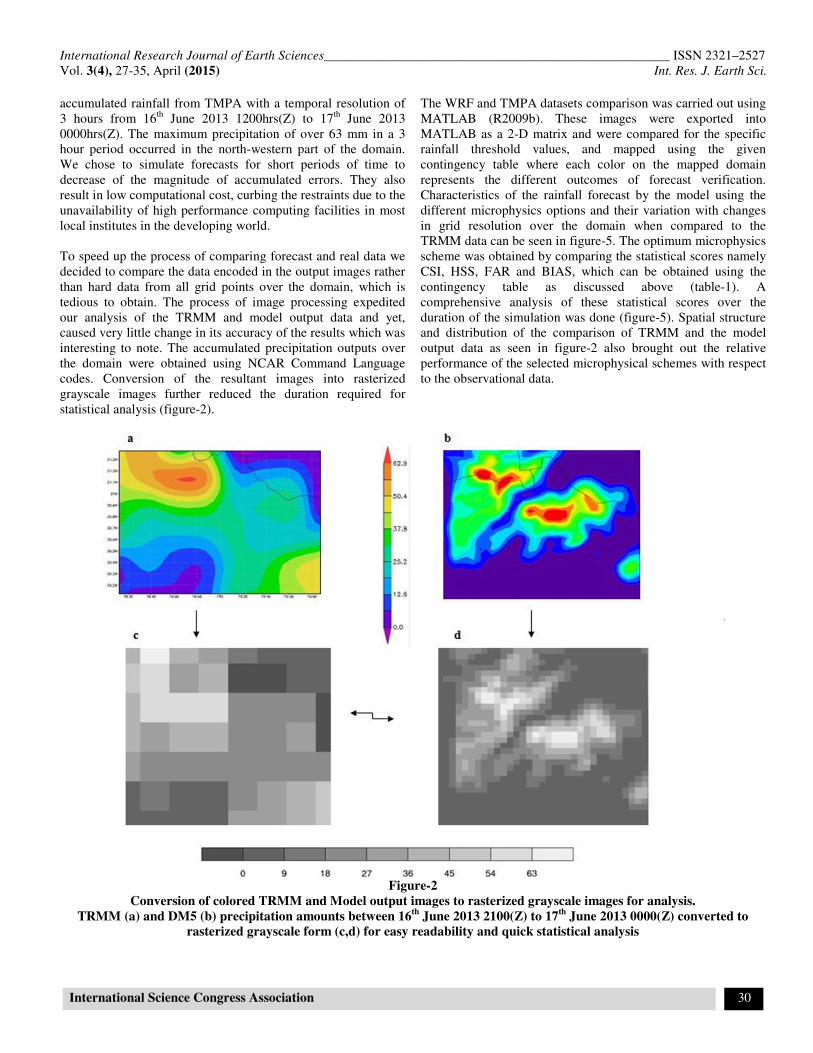
To speed up the process of comparing forecast and real data we
decided to compare the data encoded in the output images rather
than hard data from all grid points over the domain, which is
tedious to obtain. The process of image processing expedited
our analysis of the TRMM and model output data and yet,
caused very little change in its accuracy of the results which was
interesting to note. The accumulated precipitation outputs over
the domain were obtained using NCAR Command Language
codes. Conversion of the resultant images into rasterized
grayscale images further reduced the duration required for
statistical analysis (figure-2).
The WRF and TMPA datasets comparison was carried out using
MATLAB (R2009b). These images were exported into
MATLAB as a 2-D matrix and were compared for the specific
rainfall threshold values, and mapped using the given
contingency table where each color on the mapped domain
represents the different outcomes of forecast verification.
Characteristics of the rainfall forecast by the model using the
different microphysics options and their variation with changes
in grid resolution over the domain when compared to the
TRMM data can be seen in figure-5. The optimum microphysics
scheme was obtained by comparing the statistical scores namely
CSI, HSS, FAR and BIAS, which can be obtained using the
contingency table as discussed above (table-1). A
comprehensive analysis of these statistical scores over the
duration of the simulation was done (figure-5). Spatial structure
and distribution of the comparison of TRMM and the model
output data as seen in figure-2 also brought out the relative
performance of the selected microphysical schemes with respect
to the observational data.
Figure-2
Conversion of colored TRMM and Model output images to rasterized grayscale images for analysis.
TRMM (a) and DM5 (b) precipitation amounts between 16th
June 2013 2100(Z) to 17th
June 2013 0000(Z) converted to
rasterized grayscale form (c,d) for easy readability and quick statistical analysis
International Research Journal of Earth Sciences_
Vol. 3(4), 27-35, April (2015)
International Science Congress Association
Table-1
Contingency Table*
Observation
Event Yes
WRF Yes A
No C
*Frequencies of predicted and observed events. Useful in skill
score calculations in Section 2.
Results and Discussion
Our simulations show a great deal of sensitivity to the chosen
microphysics – this is not unusual owing to the Himalayan terrain
and sustained cold temperatures26
. The WRF simulation over the
domain was executed using input parameters based on mesoscale
convective systems and short forecasts. Spatial resolutions of 6
km and 10 km were considered since simulation periods increased
rapidly with even higher resolutions. We closely examined the
behavior of six different microphysics schemes which included
ice processes for each of the spatial resolutions.
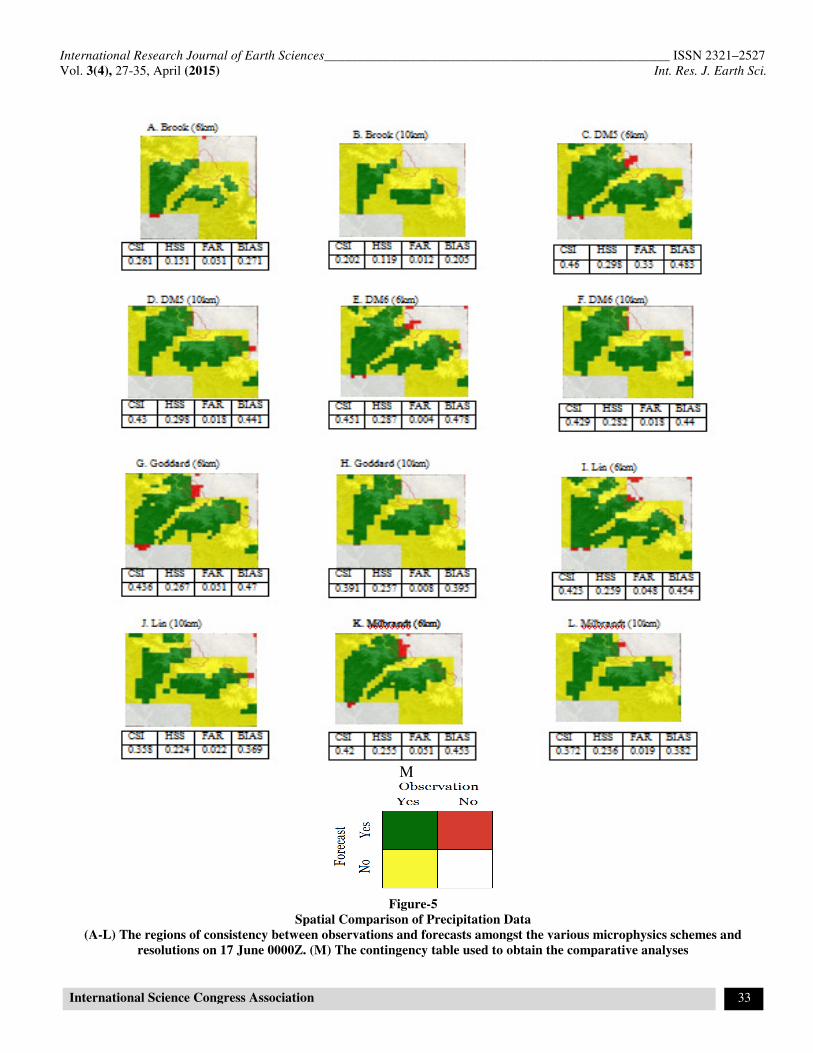
Spatial comparisons (figure-5) between forecast and observed
data were created using a contingency table27
mapped over the domain for a critical rainfall threshold of 6mm
per hour. The patterns of precipitation of model simulations with
observed data were similar in simulating precipitation in the
central regions of the domain whereas huge variation was
observed in the other regions. This variation in the accuracy of the
model with each of the microphysical schemes became apparent
with the various statistical scores used in our analysis, namely
Critical Success Index (CSI), Heidke Skill Score (HSS) and Fa
Alarm Rate (FAR) scores. Our results show that the DM5 scheme
at a spatial resolution of 6kms had the highest CSI and HSS
closely followed by DM6 scheme (Figure
microphysics shows the lowest CSI and HSS scores regardless of
the spatial resolution. The other microphysics schemes Lin,
Goddard and Milbrandt-Yau followed the same fluctuations as the
DM5 and DM6 schemes yet lacked substantially in accuracy. The
model simulations in general under-predicted the rainfall as
shown by the bias score (BIAS). The DM5 and DM6 had the
highest the BIAS scores and the simulated forecasts showed the
best correlation with the TRMM data when these two schemes
were incorporated in model runs.
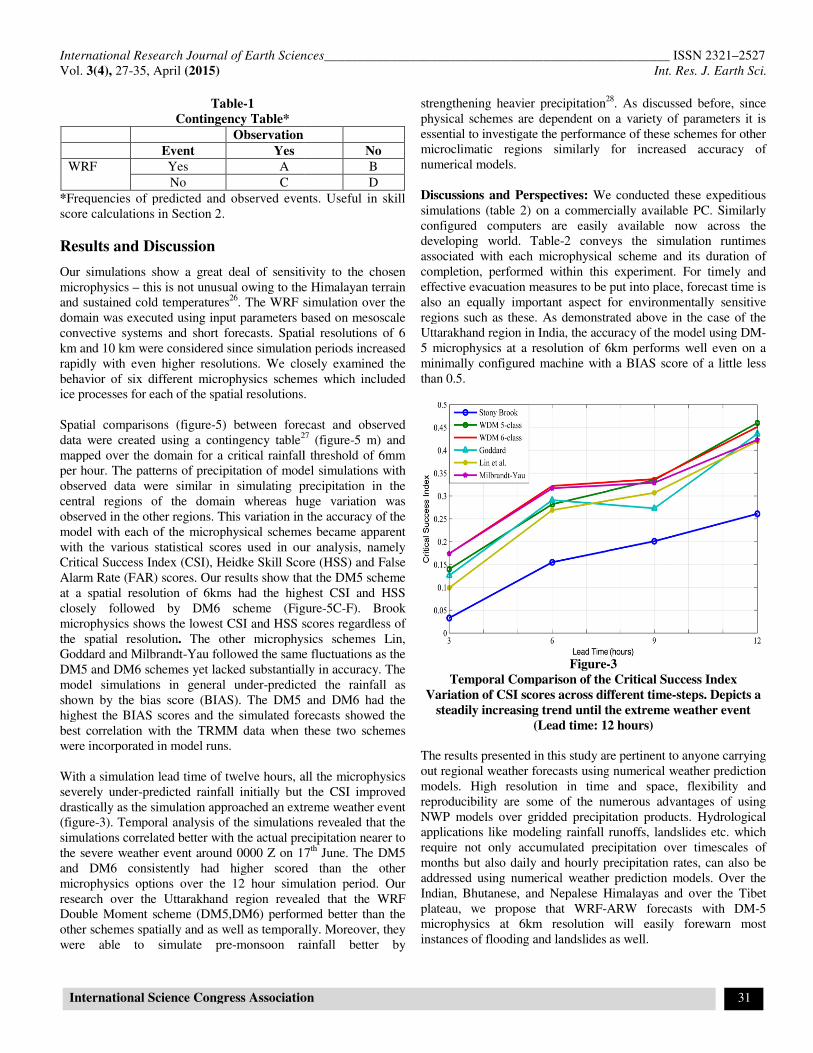
With a simulation lead time of twelve hours, all the microphysics
severely under-predicted rainfall initially but the CSI improved
drastically as the simulation approached an extreme weather event
(figure-3). Temporal analysis of the simulations revealed that the
simulations correlated better with the actual precipitation
the severe weather event around 0000 Z on 17
and DM6 consistently had higher scored than the other
microphysics options over the 12 hour simulation period. Our
research over the Uttarakhand region revealed that the WRF
Double Moment scheme (DM5,DM6) performed better than the
other schemes spatially and as well as temporally. Moreover, they
were able to simulate pre-monsoon rainfall better by
Sciences____________________________________________________
International Science Congress Association
No
B
D
Frequencies of predicted and observed events. Useful in skill
Our simulations show a great deal of sensitivity to the chosen
this is not unusual owing to the Himalayan terrain
The WRF simulation over the
domain was executed using input parameters based on mesoscale
convective systems and short forecasts. Spatial resolutions of 6
km and 10 km were considered since simulation periods increased
We closely examined the
behavior of six different microphysics schemes which included
ice processes for each of the spatial resolutions.
) between forecast and observed 27
(figure-5 m) and
mapped over the domain for a critical rainfall threshold of 6mm
per hour. The patterns of precipitation of model simulations with
observed data were similar in simulating precipitation in the
central regions of the domain whereas huge variation was
observed in the other regions. This variation in the accuracy of the
model with each of the microphysical schemes became apparent
with the various statistical scores used in our analysis, namely
Critical Success Index (CSI), Heidke Skill Score (HSS) and False
Alarm Rate (FAR) scores. Our results show that the DM5 scheme
at a spatial resolution of 6kms had the highest CSI and HSS
followed by DM6 scheme (Figure-5C-F). Brook
microphysics shows the lowest CSI and HSS scores regardless of
The other microphysics schemes Lin,
Yau followed the same fluctuations as the
DM5 and DM6 schemes yet lacked substantially in accuracy. The
predicted the rainfall as
(BIAS). The DM5 and DM6 had the
highest the BIAS scores and the simulated forecasts showed the
best correlation with the TRMM data when these two schemes
With a simulation lead time of twelve hours, all the microphysics
predicted rainfall initially but the CSI improved
drastically as the simulation approached an extreme weather event
3). Temporal analysis of the simulations revealed that the
simulations correlated better with the actual precipitation nearer to
the severe weather event around 0000 Z on 17th June. The DM5
and DM6 consistently had higher scored than the other
microphysics options over the 12 hour simulation period. Our
research over the Uttarakhand region revealed that the WRF
nt scheme (DM5,DM6) performed better than the
other schemes spatially and as well as temporally. Moreover, they
monsoon rainfall better by
strengthening heavier precipitation28
physical schemes are dependent on a variety of parameters it is
essential to investigate the performance of these schemes for other
microclimatic regions similarly for increased accuracy of
numerical models.
Discussions and Perspectives: We conducted these expeditious
simulations (table 2) on a commercially available PC. Similarly
configured computers are easily available now acr
developing world. Table-2 conveys the simulation runtimes
associated with each microphysical scheme and its duration of
completion, performed within this experiment. For timely and
effective evacuation measures to be put into place, forecast time is
also an equally important aspect for environmentally sensitive
regions such as these. As demonstrated above in the case of the
Uttarakhand region in India, the accuracy of the model using DM
5 microphysics at a resolution of 6km performs well even on a
minimally configured machine with a BIAS score of a little less
than 0.5.
Figure-
Temporal Comparison of the Critical Success Index
Variation of CSI scores across different time
steadily increasing trend until the extreme weather event
(Lead time: 12 hours)
The results presented in this study are pertinent to anyone carrying
out regional weather forecasts using numerical weather predi
models. High resolution in time and space, flexibility and
reproducibility are some of the numerous advantages of using
NWP models over gridded precipitation products. Hydrological
applications like modeling rainfall runoffs, landslides etc. which
require not only accumulated precipitation over timescales of
months but also daily and hourly precipitation rates, can also be
addressed using numerical weather prediction models. Over the
Indian, Bhutanese, and Nepalese Himalayas and over the Tibet
plateau, we propose that WRF-ARW forecasts with DM
microphysics at 6km resolution will easily forewarn most
instances of flooding and landslides as well.
____________ ISSN 2321–2527
Int. Res. J. Earth Sci.
31
28. As discussed before, since
ndent on a variety of parameters it is
essential to investigate the performance of these schemes for other
microclimatic regions similarly for increased accuracy of
We conducted these expeditious
2) on a commercially available PC. Similarly
configured computers are easily available now across the
2 conveys the simulation runtimes
associated with each microphysical scheme and its duration of
in this experiment. For timely and
effective evacuation measures to be put into place, forecast time is
also an equally important aspect for environmentally sensitive
regions such as these. As demonstrated above in the case of the
ia, the accuracy of the model using DM-
5 microphysics at a resolution of 6km performs well even on a
minimally configured machine with a BIAS score of a little less
-3
Temporal Comparison of the Critical Success Index
scores across different time-steps. Depicts a
steadily increasing trend until the extreme weather event
(Lead time: 12 hours)
The results presented in this study are pertinent to anyone carrying
out regional weather forecasts using numerical weather prediction
models. High resolution in time and space, flexibility and
reproducibility are some of the numerous advantages of using
NWP models over gridded precipitation products. Hydrological
applications like modeling rainfall runoffs, landslides etc. which
quire not only accumulated precipitation over timescales of
months but also daily and hourly precipitation rates, can also be
addressed using numerical weather prediction models. Over the
Indian, Bhutanese, and Nepalese Himalayas and over the Tibet
ARW forecasts with DM-5
microphysics at 6km resolution will easily forewarn most
instances of flooding and landslides as well.
International Research Journal of Earth Sciences_
Vol. 3(4), 27-35, April (2015)
International Science Congress Association
Table-2
WRF Simulation Period*
Microphysics Resolution (km) Time (minutes)
Stony Brook 6
10
WDM 5-Class 6
10
WDM 6-Class 6
10
Goddard 6
10
Purdue Lin (Lin
et. al, 1983)
6
10
Milbrandt-Yau 6
10
Micro-forecast coverage across South and South
The weather prediction zones would span almost the entirety of Philippines, Malaysia and Sri Lanka
Sciences____________________________________________________
International Science Congress Association
WRF Simulation Period*
Time (minutes)
15
2
20
4
15
4
13
3
22
4
42
9
*Simulations were performed on a Linux Intel PC using a
gfortran serial processor (2.5 GHz)
We suggest that local universities and institutes can
continuously conduct mesoscale weather forecasts using precise
physical parameters associated with their regional climate and
topography. The simulation run times on these machines is also
miniscule even at high resolutions due to the relatively small
size of the domain. As in this case of the Uttarakhand tragedy,
these physical parameters can be acquired for varied regions in
the world to accurately forecast severe weather. Locally
generated weather forecasts will augment the capacity of
governmental forecasting centers to detect and monitor an
extreme weather event. Once specific physical parameters have
been established over every micro
through meticulous process, they can aid
stitching together a more robust weather prediction model.
Subsequently, this will help in issuing timely alerts and increase
disaster preparedness.
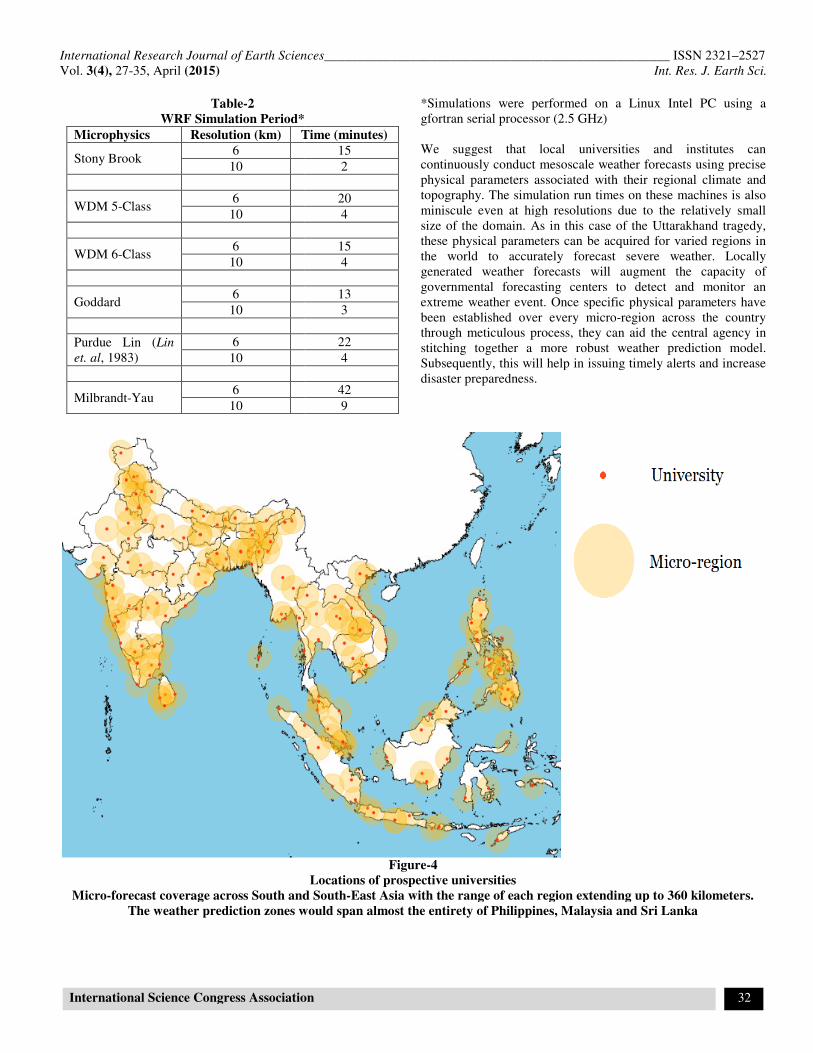
Figure-4
Locations of prospective universities
ast coverage across South and South-East Asia with the range of each region extending up to 360 kilometers.
The weather prediction zones would span almost the entirety of Philippines, Malaysia and Sri Lanka
____________ ISSN 2321–2527
Int. Res. J. Earth Sci.
32
*Simulations were performed on a Linux Intel PC using a
We suggest that local universities and institutes can
continuously conduct mesoscale weather forecasts using precise
physical parameters associated with their regional climate and
topography. The simulation run times on these machines is also
n at high resolutions due to the relatively small
size of the domain. As in this case of the Uttarakhand tragedy,
these physical parameters can be acquired for varied regions in
the world to accurately forecast severe weather. Locally
ecasts will augment the capacity of
governmental forecasting centers to detect and monitor an
extreme weather event. Once specific physical parameters have
been established over every micro-region across the country
through meticulous process, they can aid the central agency in
stitching together a more robust weather prediction model.
Subsequently, this will help in issuing timely alerts and increase
East Asia with the range of each region extending up to 360 kilometers.
The weather prediction zones would span almost the entirety of Philippines, Malaysia and Sri Lanka
International Research Journal of Earth Sciences_
Vol. 3(4), 27-35, April (2015)
International Science Congress Association
Spatial Comparison of
(A-L) The regions of consistency between observations and forecasts amongst the various microphysics schemes and
resolutions on 17 June 0000Z. (M) The contingency table used to obtain the comparative analyses
Sciences____________________________________________________
International Science Congress Association
Figure-5
Spatial Comparison of Precipitation Data
L) The regions of consistency between observations and forecasts amongst the various microphysics schemes and
resolutions on 17 June 0000Z. (M) The contingency table used to obtain the comparative analyses
M
____________ ISSN 2321–2527
Int. Res. J. Earth Sci.
33
L) The regions of consistency between observations and forecasts amongst the various microphysics schemes and
resolutions on 17 June 0000Z. (M) The contingency table used to obtain the comparative analyses
International Research Journal of Earth Sciences____________________________________________________ ISSN 2321–2527
Vol. 3(4), 27-35, April (2015) Int. Res. J. Earth Sci.
International Science Congress Association 34
Much of South and South-East Asia is tormented by extreme
weather. Colleges and Universities in this developing region can
perform the role of generating weather forecasts locally. In the
event these forecasts reveal a potential for hazardous weather,
local institutes would liaise with the central weather forecasting
organization to develop an alerting mechanism. Near real-time
weather data can be obtained from numerous sources and the
central weather agency can also provide the universities with
unhindered access to nearby Doppler radars for quicker
forecasts. Universities and institutions have a stronger reach
within their local community and hence are better enabled to aid
governmental authorities in cautioning the public, by involving
mobile telephony and social media.
Conclusion
We have identified several major technical universities in major
cities in these countries based on their geographical location and
potential to conduct geoscientific research (Figure-4). Regional
forecasts runs at these institutions with optimized physical
parameters could greatly increase the preparedness of these
regions against extreme weather events. The immense untapped
potential of rigorous mesoscale forecasting using personal
computers offline could greatly enhance the capability of
governmental weather forecasting institutes and help save
countless lives.
Acknowledgments
We made use of TRMM data provided by the GSFC DAAC and
MODIS products distributed by the Land Processes Distributed
Active Archive Center (LP DAAC), located at the US
Geological Survey (USGS) Earth Resources Observation and
Science (EROS) Center (lpdaac.usgs.gov).
References
1. Nasrin Nasrollahi, Amir Agha Kouchak, Jialun Li,
Xiaogang Gao, Kuolin Hsu and Soroosh Sorooshian,
Assessing the Impacts of Different WRF Precipitation
Physics in Hurricane Simulations, Wea. Forecasting, 27,
1003–1016 (2012) doi: 10.1175/WAF-D-10-05000.1
2. Wei-Kuo Tao, Jainn Jong Shi, Pay-Liam Lin, Jhihying
Chen, Stephen Lang, Mei-Yu Chang, Ming-Jen Yang,
Chun-Chien Wu, Christa Peters-Lidard, Chung-Hsiung
Sui, and Ben Jong-Dao Jou : High-Resolution Numerical
Simulation of the Extreme Rainfall Associatedwith
Typhoon Morakot. Part I: Comparing the Impact of
Microphysicsand PBL Parameterizations with
Observations, Terr. Atmos. Ocean. Sci., 22(6), 673-696,
(2011), doi: 10.3319/TAO.2011.08.26.01
3. Cardoso R.M., Soares P.M.M., Miranda P.M.A. and Belo-
Pereira M., WRF high resolution simulation of Iberian
mean and extreme precipitation climate, Int. J. Climatol.,
33, 2591–2608, (2013), doi: 10.1002/joc.3616
4. P. Moudi Igri, D.A. Vondou, Roméo S. Tanessong and F.
Kamga Mkankam, Assessing the Improvement of Severe
Weather Prediction Over Western Africa in WRF by
3DVARData Assimilation System using Conventional and
Radiance observational Data, Erad- The Seventh European
Conference On Radar In Meteorology And Hydrology,
(2012)
5. M. Bidegain, R.M.Caffera, B. de los Santos and P.
Castellazzi, Performance of the WRF Regional Model over
Southeast South America During an Extreme Event,
Proceedings of 8 ICHSMO, Fog do Iguag , Brazil , April
24-28, INEP, 1655-1658, (2006)
6. Mohanty U.C, Acharya, N Ankita Singh, Archana Nair,
M.A. Kulkarni, S.K. Dash, S.C. Kar, A.W. Robertson,
A.K. Mitra, L.S. Rathore, K.K. Singh, D.R. Pattanaik,
Dalip Singh , Surajit Chattopadhyay, R.K. Rai, M.M.N
Rao, P. Sinha, A.K. Mishra and R.K. Pal, Real-time
Experimental Extended Range Forecast System (ERFS) for
Indian summer Monsoon Rainfall: A case study for
Monsoon 2011, Current Science, 104(7), 856-870 (2013)
7. V. Rakesh, Randhir Singh, P.K. Pal and P.C. Joshi,
Impacts of Satellite-Observed Winds and Total
Precipitable Water on WRF Short-Range Forecasts over
the Indian Region during the 2006 Summer Monsoon,
Wea. Forecasting, 24, 1706–1731 (2009) doi
10.1175/2009WAF2222242.1
8. Emmanuel K., Increasing destructiveness of tropical
cyclones over the past 30 years, Nature, 436, 686-688
(2005)
9. Evan A.T., Kossin J.P., Chung C.E. and Ramanathan V.,
Arabian Sea tropical cyclones intensified by emissions of
black carbon and other aerosols, Nature, 479, 94–97 (2011)
10. Wang W. and N.L. Seaman, A comparison study of
convective schemes in a mesoscale model, Mon. Wea.
Rev., 125, 252–278 (1997)
11. Gallus W.A., Jr., Eta simulations of three extreme rainfall
events: Impact of resolution and choice of convective
scheme, Wea. Forecasting, 14, 405–426 (1999)
12. Gallus W.A. and M. Segal, Impact of improved
initialization of mesoscale features on convective system
rainfall in 10-km Eta simulations, Wea. Forecasting, 16,
680–696 (2001)
13. Gallus W.A. and M. Segal, Sensitivity of forecast rainfall
in a Texas convective system to soil moisture and
convective scheme, Wea. Forecasting, 15, 509–526 (2000)
14. Houze Jr., R.A., Mesoscale Convective Systems, Rev.
Geophys.,42, 1–43, doi:10.1029/2004RG000150, (2004)
15. Houze Jr., R.A., Cloud Dynamics, 573, Academic, San
Diego, California, (1993)
International Research Journal of Earth Sciences____________________________________________________ ISSN 2321–2527
Vol. 3(4), 27-35, April (2015) Int. Res. J. Earth Sci.
International Science Congress Association 35
16. Wilson J.M., Crook N.A., Mueller C.K., Sun J. and Dixon
M., Nowcasting thunderstorms: A status report, B. Am.
Meteorol.Soc., 79, 2079–2099, (1998)
17. Liu C. and Moncrieff M.W., Sensitivity of cloud-resolving
simulations of warm-season convection to cloud
microphysics parameterizations, Mon. Weather Rev., 135,
2854–2868, (2007)
18. Liu C., Ikeda K., Thompson G., Rasmussen R. and Dudhia
J., High-Resolution Simulations of Wintertime
Precipitation in the Colorado Headwaters Region:
Sensitivity to Physics Parameterizations, Mon. Wea. Rev.,
139, 3533–3553 (2011)
19. Bright D.R. and S.L. Mullen, The sensitivity of the
numerical simulation of the southwest monsoon boundary
layer to the choice of PBL turbulence scheme in MM5,
Wea. Forecasting, 17, 99–114, (2002)
20. Mc Cumber M., Tao W.K., Simspon J., Penc R. and Soong
S.T., Comparison of ice-phase microphysical
parameterization schemes using numerical simulations of
tropical convection, J. Appl. Meteorol., 30, 985–1004,
(1991)
21. Gilmore M.S., Straka S.M. and Rasmussen E.N.,
Precipitation and evolution sensitivity in simulated deep
convective storms: comparisons between liquid-only and
simple ice and liquid phase microphysics, Mon. Weather
Rev., 132, 1897–1916, (2004)
22. Skamarock W., Klemp J., Dudhia J., Gill D., Barker D.,
Duda M., Huang X., Wang W. and Powers J., A
description of the Advanced Research WRF version 3.
NCAR Tech. Note NCAR/TN-4751STR, National Center
For Atmospheric Research Boulder Co Mesoscale and
Microscale Meteorology Div., (2008)
23. Bernardet L.R., L. Nance, H.Y. Chuang, A. Loughe and
S.E. Koch, Verification statistics for the NCEP WRF pre
implementation test. Part 1: Deterministic verification of
ensemble members. Preprints, Fifth Joint WRF/14th MM5
User’s Workshop, Boulder, CO, NCAR Mesoscale and
Microscale Meteorology Division, 229–232 (2004)
24. Livezey R.E., Deterministic Forecasts of Multi-Category
Events, in Forecast Verification: A Practitioner's Guide in
Atmospheric Science, Second Edition (eds I. T. Jolliffe and
D. B. Stephenson), John Wiley & Sons, Ltd, Chichester,
UK. (2011)
25. Wilks D.S., Statistical Methods in the Atmospheric
Sciences – An Introduction, vol. 59 of International
Geophysics Series, AcademicPress, (1995)
26. Jankov, I., Gallus W.A., Segal M., Shaw B. and Koch S.E.,
The Impact of Different WRF Model Physical
Parameterizations and Their Interactions on Warm Season
MCS Rainfall, Weather Forecasting, 20, 1048–1060,
(2005)
27. Maussion, F., Scherer D., Finkelnburg R., Richters J.,
Yang W. and Yao T., WRF simulation of a precipitation
event over the Tibetan Plateau, China – an assessment
using remote sensing and ground observations, Hydrol.
Earth Syst. Sci., 15, 1795–1817, (2010)
28. Hong, S.Y. et al., Evaluation of the WRF Double-Moment
6-Class Microphysics Scheme for Precipitating
Convection, Advances in Meteorology, (2010)
29. (http://www.bbc.co.uk/;http://www.thehindu.com/)
30. (http://www.hindustantimes.com/)
31. blogs.agu.org/landslideblog/, 2013)