Embed Size (px)
Citation preview

Vol.:(0123456789)1 3
Journal of Petroleum Exploration and Production Technology https://doi.org/10.1007/s13202-019-0734-6
ORIGINAL PAPER - PRODUCTION ENGINEERING
Optimization of choke size for two‑phase flow using artificial intelligence
Mohammad Khamis1 · Murtada Elhaj2 · Abdulazeez Abdulraheem3
Received: 13 January 2019 / Accepted: 16 July 2019 © The Author(s) 2019
AbstractCurrently, engineers are using numerical correlations to describe the flow of oil and gas through chokes. These numerical correlations are not 100% accurate, as indicated by other studies, so there is a need to find a better approach to describe and calculate the choke size. Artificial intelligence (AI) can be used for better results. In this study, AI was used to estimate the optimum choke size that is required to meet the desired flow rate. Four techniques are used in this study: artificial neural networks, fuzzy logic (FL), support vector machines, and functional networks. Results obtained using these techniques were compared. After researching each technique, FL was found to give the best predictions.
Keywords Multiphase flow · Artificial intelligence · Modeling · Choke size
Introduction
The value of the production rates of the flowing oil and gas well in Middle Eastern counties is essential for economic revenue. However, there is not enough research being done to vindicate the validity of the current models. Numerical correlations impede the ability for predicting choke size accurately that controls the production rate. Artificial Intel-ligence (AI) can be used to address this problem.
In the wellhead assembly component, the wellhead choke that is used to control the flow of oil and gas can be either adjustable or positive. Because these two types of chokes are essential for controlling the flow in pipelines, we will be focusing on the adjustable choke as it can turn the flow on and off, whereas the positive choke is fixed and cannot, therefore, control the quantity of oil and gas being produced.
Adjustable chokes can be used in the well completion pro-cess, which help to control the flow while cleaning or testing the oil and gas well. During this process, an optimum flow rate can be achieved, and so we can change from adjustable to a positive choke before production.
Since the estimation of multiphase flow is crucial to Mid-dle East economic production, many numerical correlations were developed to optimize the choke size. There are two types of multiphase flow: critical and subcritical. Critical flow occurs when the fluid velocity is equal to or higher than the velocity of sound in that fluid, whereas subcritical is less than the sound velocity in that fluid. The focus of this study will be on subcritical flow as it has gotten less attention on research compared to sonic flow.
To have a vital rate, downstream pressure should be about 0.55 of the upstream pressure. In such a situation, the flow rate depends on the upstream pressure and gas oil ratio (GOR) only; therefore, the change in the down-stream pressure does not influence the flow rate. Damage of surface facilities may occur if the choke breakdown or malfunctioning due to the prevention of the smooth transi-tions between downstream and upstream pressure. For this reason, the correct design of the production well will lead to the accurate prediction of the flow behavior of multiphase mixtures through chokes. Modern techniques, as well as AI, are also used in the design operations over the entire produc-tion system. This process demands accurate models that can describe the performance of each element in the system.
* Mohammad Khamis [email protected]
Murtada Elhaj [email protected]
Abdulazeez Abdulraheem [email protected]
1 King Saud University, Riyadh, Kingdom of Saudi Arabia2 Memorial University of Newfoundland, St. John’s, Canada3 King Fahd University of Petroleum and Minerals, Dhahran,
Kingdom of Saudi Arabia

Journal of Petroleum Exploration and Production Technology
1 3
Many studies (Elhaj et al. 2015, 2017; AlAjmi et al. 2015) proved that the AI gave more accurate results compared to the numerical correlations when it comes to the choke size prediction.
Four techniques of AI will be used to increase the accu-racy of the prediction of the choke size. These techniques are: artificial neural networks (ANN), fuzzy logic (FL), sup-port vector machines (SVM), and functional networks (FN). Each technique will be discussed in detail in the following paragraphs to determine which technique has the best accu-racy for optimizing choke size.
Literature review
As numerical correlations are usually used to examine choke size, the types of multiphase flow chokes will be outlined in this research. There are two types of two-phase flow: criti-cal and subcritical. The developed model for critical flow has gotten most of the attention of researchers compared to subcritical flow, according to the literature. These models were created with inspiration from the Gilbert-type empiri-cal relationship (Gilbert 1954). Several researchers revised and developed Gilbert’s model during the decades, such as Ros, Baxendell, Achong, Pilehvari, Secen, and Osman and Dokla (Sachdeva et al. 1986; Osman and Dokla 1990; Omana et al. 1969a, b; Ros 1960; Abdul-Majeed and Maha 1991; Pilehvari 1981). Most of these models have a linear relationship between the flow rate the upstream pressure.
Another type of correlations of a four-parameter equation was presented by other investigators (Surbey et al. 1989; Al-Attar 2008). These investigators considered a nonlinear relationship between the flow rate and the wellhead pressure (Al-Towailib and Al-Marhoun 1994; Al-Attar and Abdul-Majeed 1988; Al-Towailib and Al-Marhoun 1992; Hosmer et al. 2013; Salah and Rahman 2005). Surbey et al. (1989) developed a four-parameter equation for critical two-phase flow through multi-orifice-valve chokes. They stated that this equation is probably restricted to this type of chokes only. However, Al-Towailib and Al-Marhoun (1992, 1994) obtained consistent results when they applied this equation for Middle East data. Al-Attar and Abdul-Majeed (1988) proposed a similar correlation for East-Baghdad oil wells.
Recently, AI has been successfully applied in many applications in oil businesses. A range of analysis has been disbursed on the utilization of varied computational intelligence (CI) schemes to estimate the two-phase flow through reservoirs and pipes. Many researchers used these schemes in oil and gas industry, such as logistic regression (LR), K-nearest neighbor (KNN), multilayer perceptrons (MLP), radial basis function (RBF), Bayesian belief net-works (BBN), Naïve Bayes (NB), random forests (RF), func-tional networks (FunNets), support vector machines (SVM),
artificial neural networks (ANN), probabilistic networks (PN), adaptive-neuro fuzzy systems (ANFIS) and decision trees (DT) (Hosmer et al. 2013; Salah and Rahman 2005; Duch et al. 1997; Guojie 2004; Lauría and Duchessi 2006).
Although both AI and CI seemed to be similar in trying to search for the same goal, CI deals with fixing issues in which effective computational algorithms are not available. In other words, CI is a branch of AI and every CI process is an AI process, but not the reverse. However, some areas and application can be done by both techniques, such as pat-tern recognition, image analysis, and operations research. CI is based only on soft computing techniques, while AI uses hard computing technique. The only problem when using the hard computing technique is that human language cannot always be translated to binary logic, which is based on only two values (0 and 1). Therefore, using techniques based on fuzzy logic is essential when dealing with this situation. CI relies on different logic algorithms such as fuzzy systems, neural networks, support vector machines, and evolutionary computation. In addition, CI also embraces techniques that use swarm intelligence, fractals and chaos theory, artificial immune systems, wavelets, etc.
For more than five decades, fuzzy sets (FS) are widely used in different sciences, especially in computer science, which is found to give more accurate estimation and simu-lation for a specific scenario compared to others. There are two types of these sets type 1 FS and type 2 FS, which is introduced by Zadeh (1965). The idea behind these sets is to represent uncertainty and vagueness mathematically in addi-tion to give a tool for dealing with the imprecision. The FS consists of grades of membership; each member is a based on logic too (Karnik et al. 1999).
Support vector machines
SVMs are one of the AI techniques that can be used as a learning machine, and they applied for classification and regression. They can be classified under the linear classifi-ers. In addition, the use in the specific scenario of regression, such as the regularization of ill-posed problems (Tikhonov regularization), is also one of the usages of SVMs. SVM models can be represented by either data points or map. Each map constructs a hyperplane or a group of hyperplanes in a high or infinite dimension space. Two parallel hyper-planes are built on each side of the hyperplane that separates the data. The generalization error is directly proportional to the distance between those two parallel hyperplanes, which is assumed by Burges (1998).
Many applications of SVMs are applied in both engineer-ing and science, such as defect prediction (Elish and Elish 2008), surface tension (Wang et al. 2007), geotechnical pro-cess (Goh and Goh 2007) and petroleum engineering (Hou and Wenfen 2006).

Journal of Petroleum Exploration and Production Technology
1 3
Functional networks
Functional networks are different than neural networks in many ways, for example, the functional networks do not have weights that related to neurons, and moreover, the neu-ron functions are adaptable, not steady like in neural net-works. In these networks, a system of functional equations is obtained as a solution to a problem, in which this system has a smaller number of degrees of freedom compared to neural networks.
The concept behind the work of functional networks is by permitting the f functions learning, whereas weights are terminated. Moreover, these functions can be in multidimen-sional, even though these functions can be changed by the functions of single variables. The functional networks con-sist of four main elements (1) input units; (2) output units; (3) one or many layers of computing units; and (4) group of directed links.
A complete explanation of the applications of functional networks in both engineering and statistics are presented in the research done by Castillo et al. (2001). Unfortu-nately, it is scarce to find in the literature that functional networks have that much of application regarding petroleum engineering.
For two-phase flow through chokes prediction using AI, the only research was done by Al-Khalifa and Al-Marhoun (2013). He studied in his master thesis the application of neural network for two-phase flow through chokes. The study used 4031 data points collected from different wells in the Middle East. In his research, he developed an ANN model to predict the choke size utilizing a ratio of 80% for training and 10% for validation and 10% for testing for the data under study. A comparison was made between the results obtained by NN and the existing correlations. It was shown that the ANN gives better results among all the cor-relations and models.
Problem statement
Since the Multiphase flow prediction is highly crucial, as discussed in the introduction, the prediction should be accurate enough. The study of Al-Khalifa and Al-Marhoun (2013) used only a neural network (NN). In this investiga-tion, several techniques of artificial intelligence will be used, and a comparison of the results obtained from the different procedure will be made.
Methodology
This section discusses how models were developed, the methodology, selecting the independent variable, model architecture, and optimization. Models developed based on
these techniques used about 10,440 data points and a ratio of 70% for training, 15% for validation, and 15% for testing.
The artificial intelligence techniques used for prediction are:
1. Artificial neural networks (ANN) (Al-Khalifa and Al-Marhoun 2013)
2. Fuzzy logic (FL) (Castillo, et al. 2001)• Genetic algorithm (GA) as an optimization tool.
3. Support vector machines (SVM) (Hou and Wenfen 2006)
4. Functional networks (FN) (Hosmer et al. 2013)
The models built using the above techniques will be implemented using Matlab software. Statistical analysis will be carried out to compare between results obtained by the different techniques and methods.
Correlation coefficient
It measures the statistical correlation between the predicted and actual values. This method is unique in the sense that it does not change with a scale in values. A higher number means a better model, with a one indicating perfect statisti-cal correlation and a zero meaning there is no correlation at all. This performance measure is only used for numerical input and output (Karnik et al. 1999).
Data collection
Data from several fields in the Middle East were collected to develop artificial intelligent models. A wide range of choke sizes and flow rates were covered in this study. The reported production test data includes: oil and gas flow rates, choke sizes, downstream and upstream wellhead tubing pressures, gas relative density and oil API. Mixture density, ɤm, was calculated as shown below and used as an input parameter. (AlAjmi et al. 2015).
As the parameters setting play a vital role in the out-comes of the results, the same AI techniques were used in the gas reservoir using different setting with almost the same parameters to emphasize the effect on the findings. For more details, see (Elhaj et al. 2015, 2017).
Table 1 summarizes some statistical parameters for the input and output data (6960 data points).
Relations between the input parameters and the output were studied to develop the AI models. Figure 1 shows a
(1)
∑�
x − x���
y − y��
�
∑
(x − x�)2∑
(y − y�)2
(2)�m = �o + 2.18x10⁻⁴x�g

Journal of Petroleum Exploration and Production Technology
1 3
clear relationship between the choke size and the total flow rate and upstream pressure. On the other hand, there is no significant correlation between choke size, gas oil ratio and mixture relative density. Table 2 shows the correlation between the input parameters, the output, and the relation-ship between the parameters themselves, which can help in designing the models. Therefore, the dominant factor affect-ing the choke size is the flow rate rather than the upstream pressure. In Table 2, the negative sign indicates that the parameter is inversely proportional to the output. Table 3 Column (1) shows that taking the log value for all the param-eters did not show any significant difference compared to the raw data. Similarly, the same conclusion was noticed when normalizing the data, as shown in Table 3 Column (2). A visual check of the relation between the choke size and the input parameters was performed by plotting the choke size versus flow rate (Fig. 1), gas oil ratio (Fig. 2), wellhead pres-sure (Fig. 3), and mixture relative density (Fig. 4).
Data screening
The primary purpose of this study is to develop different artificial intelligent models to be used in choke design; therefore, this research deals primarily with data under the critical flow pattern. Subcritical flow data were not included. The critical flow pattern occurs when the downstream tubing pressure is less than 55% of the upstream tubing pressure. The Bernoulli principals and gas law equations were used to select the independent variables for the critical flow. Outlier data were removed, and the raw data was used in this study.
Table 1 Input and output data statistical analysis
Flow rate GOR Pus ɤm Choke Size
Min 312 100 200 0.839763 17Max 20,308 3507 1360 1.326279 159Range 19,996 3407 1160 0.486517 142Mean 8817.51 672.26 605.26 0.89597 80.7SD 3450.83 295.09 238.95 0.05841 25.67
y = 73.83x1.1122
R² = 0.5772
0
5000
10000
15000
20000
25000
30000
0 50 100 150 200
Gros
s Flo
w R
ate
(STB
/D)
Choke Size (1/64)
Fig. 1 Total flow rate versus choke size of the raw data
Table 2 Correlation between the input and the output parameters
Choke size Flow rate GOR Pu ɤm
Choke size 1.0000Flow rate 0.7532 1.0000GOR − 0.1739 − 0.1125 1.0000Pu − 0.4341 − 0.1530 0.5761 1.0000ɤm − 0.2136 − 0.1549 0.6337 0.5778 1.0000
Table 3 Correlation between the log and typical values of the input and the output parameters
Choke size (log values) Choke size (normaliza-tion)
Choke size 1.0000 1.0000Flow rate 0.7597 0.7532GOR − 0.1581 − 0.1739Pu − 0.4244 − 0.4341ɤm − 0.2209 − 0.2136
y = 1375x-0.196
R² = 0.025
0
1000
2000
3000
4000
5000
6000
0 50 100 150 200
GOR
(SCF
/STB
)
Choke Size (1/64)
Fig. 2 Gas oil ratio versus choke size of the raw data
y = -332ln(x) + 2108.7R² = 0.1933
0
200
400
600
800
1000
1200
1400
1600
1800
0 50 100 150 200
UpS
trea
m P
ress
ure
(Psi)
Choke Size (1/64)
Fig. 3 Wellhead pressure versus choke size of the raw data

Journal of Petroleum Exploration and Production Technology
1 3
Because the research covers wide data ranges and each input parameter has a different scale than the others, the data were normalized before feeding it into the network. Two methods of normalization were done.
The first method uses the following formula:
The second method is the same as method one except that the mean was not deducted
Tables 4 and 5 show a statistical analysis of both the input and output data after normalization and taking the logarithm, respectively.
Results and discussion
Artificial neural network
The trial and error technique was used to estimate the num-ber of neurons, layers, and type of function, which proves to be a successful technique when it comes to ANN mod-eling. Several functions were examined during the process of developing the model, and the log-sigmoid gave the best
(3)xnorm
=xi −mean
(
xi)
STD(
xi)
(4)xnorm
=xi
STD(
xi)
result among other functions. In contrast, cascade-forward was the best learning algorithm for the training data. During the process of running the model, some problems occurred due to the local minimum, which caused the training run-ning to stop. To avoid this kind of issue from happening, the validation failure was increased to 300.
Two types of general layer feed were used in the ANN model: feed-forward (type 1) and cascade-forward (type 2). The main feature of these types is the internal feedback of information; one type shall not permit the internal feedback of information (type 1), while the other (type 2) enable this feedback. When it comes to dynamic models, type 2 is pre-ferred. In this model, both types were tested and examined, but type 2 gave the best results and was recommended for this model. The following command and Fig. 5 illustrate the structure of the cascade-forward NN.
net=newcf (IPdata,TRGdata,[5,10,5],{‘logsig’,’purelin’},’trainlm’,’learngd’);
command (1)
In this study, more than one transfer functions were used for both the input and output data like log-sigmoid and purelin. Table 6 summarizes some of the results obtained from the different NN types and the learning techniques. Generally, cascade-forward NN type shows the best results achieved, so it is recommended.
Table 7 proves that three layers with different neurons (5, 10, 5) for cascade-forward NN type gave the best output.
Figures 6 and 7 show some of the results obtained from the ANN. The correlation coefficient (R) was 0.92, 0.79 and 0.82 for training, validation and testing, respectively. It was found to be 0.87 for the whole set of data, as shown in Fig. 6.
y = 1.0546x-0.043
R² = 0.0488
0.8
0.9
1
1.1
1.2
1.3
1.4
0 50 100 150 200
Mix
ture
Rel
a�ve
Den
sity
Choke Size (1/64)
Fig. 4 Mixture relative density versus choke size of the raw data
Table 4 Statistical analysis of the data after normalization
Flow rate GOR Pus ɤm Choke Size
Min − 2.4612 − 1.9383 − 1.6961 − 0.9623 − 2.4916Max 3.3233 9.6140 3.1400 7.3669 3.0531Mean − 3.62E−17 − 6.51E−17 2.05E−16 − 7.49E−14 − 1.99E−16SD 1.0 1.0 1.0 1.0 1.0
Table 5 Statistical analysis of the log data (except mixture relative density, ɤm)
Flow rate GOR Pus ɤm Choke size
2.49415 2.00000 2.30103 0.83976 1.23045Min 4.30767 3.54494 3.13354 1.32628 2.20140Max 3.90336 2.79270 2.74783 0.89597 1.88411Mean 1.81351 1.54494 0.83251 0.48652 0.97095SD 0.21081 0.17432 0.17786 0.05841 0.14810

Journal of Petroleum Exploration and Production Technology
1 3
Fuzzy logic
Along with ANN, fuzzy logic (FL) is also used in this research. As it is known, FL has two types: grid partition and sub-clustering. The difference between these two types is that the grid partition takes a much longer time to accom-plish a specific task compared to sub-clustering. Because of time constraints, sub-clustering was chosen to be used in this study. The range of influence (radii) was changed in the developing model to achieve a quicker and better result. Dif-ferent radius ranges were used, and the range was between 0.01 and 0.2. Table 8 displays the influence of different radii. It was noticed while running the code for the train-ing stage that the smaller the radii, the better the prediction was. For the testing stage, as the radius decreased, the error increased. Therefore, to avoid this kind of awkwardness, two techniques of optimization were used: trial and error and genetic algorithm. The optimum values for both mean square error (MSE) and the correlation coefficient were 0.145 and 0.01, respectively.
Figures 8, 9 and 10 show the results obtained for both training and testing data for a radius of 0.1. Results
illustrated that this radius of influence is good enough for training and testing. Results were estimated using a radius of 0.01. These results confirmed that the smaller the radius was, the better the results, as shown in Figs. 11, 12 and 13. A comparison of the results acquired with different radius values is organized in Table 8, and it is clear that the results that corresponded to a radius of 0.01 were the best.
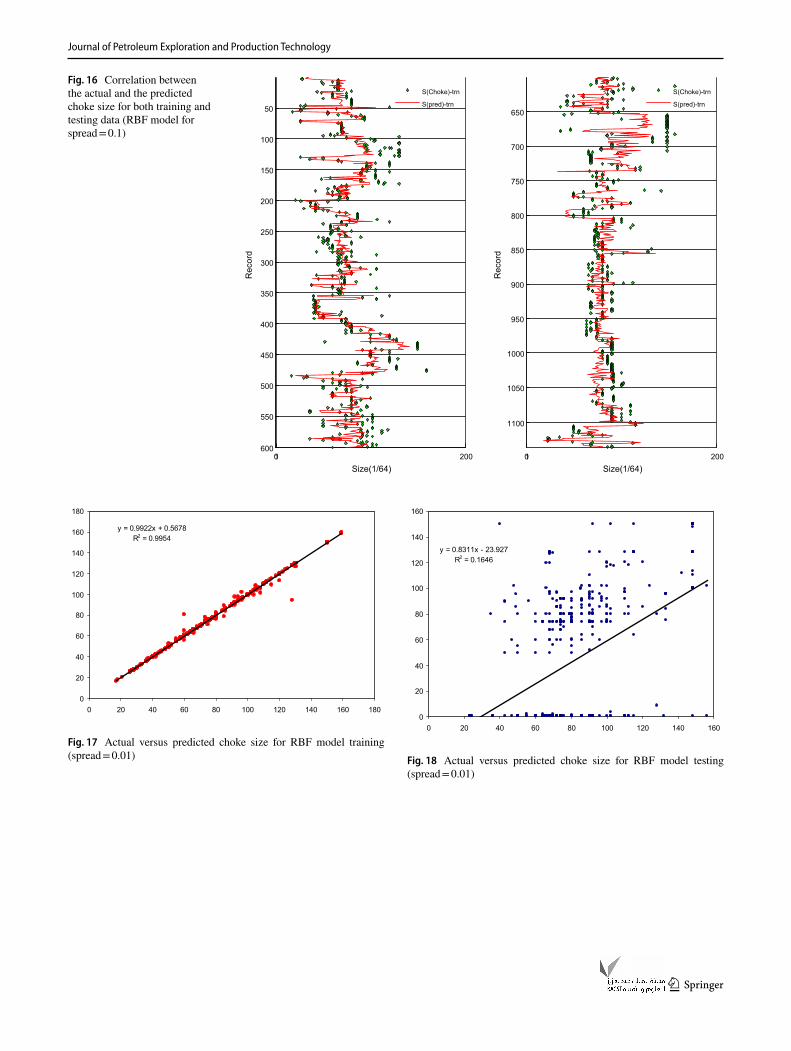
Radial basis function
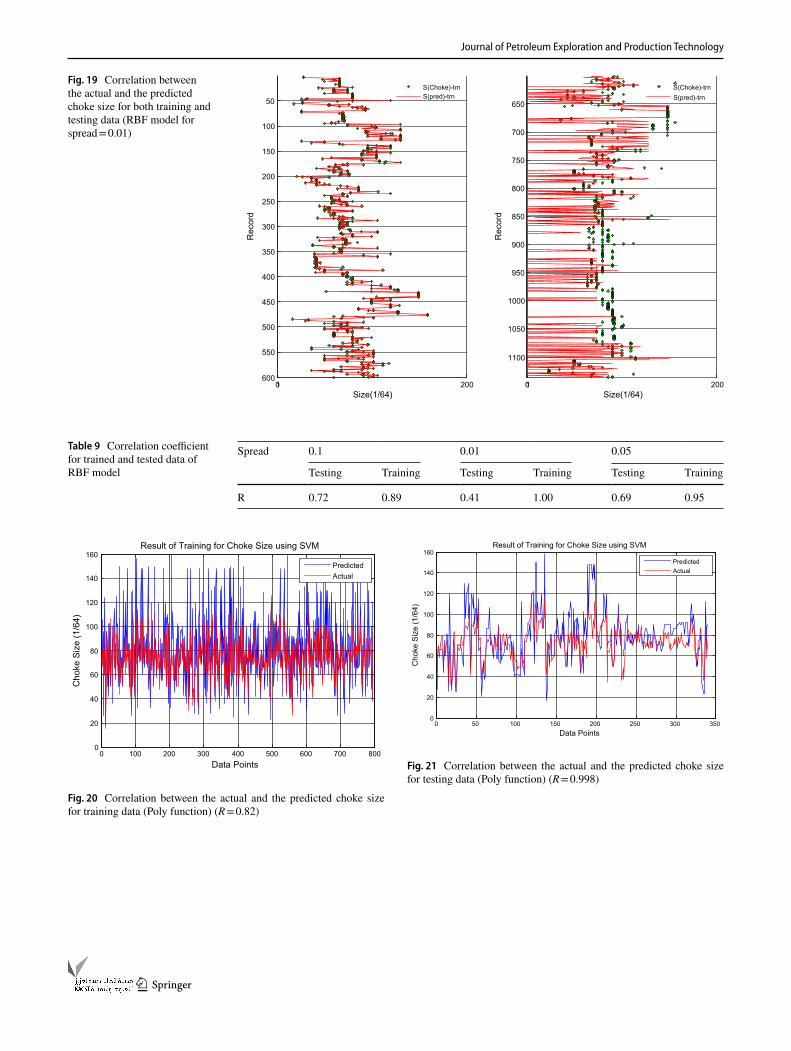
Another type of neural network used here is the radial basis function (RBF). Generalized regression neural network function (GRNN) with different spread values ranging from 0.01 to 0.1 was used. The optimum spread value was found to be 0.1, as illustrated in Figs. 14, 15 and 16. For the spread value of 0.01, the training prediction was perfect; however, when comparing the testing data, results were inaccurate, as shown in Figs. 17, 18 and 19. Table 9 concludes the results for various spread values. The two points that deviated from the trend line in Fig. 17 related to the actual data that were used in this study. In other words, the focus of this study was the prediction of choke size that can be estimated from the
Fig. 5 ANN structure
Table 6 Results of type 1 and type 2 NN with different learning and transfer functions (newcf = cascade-forward)
(newcf) newff newff newff newff newff newfftrainlm trainlm trainlm traingdx trainbfg trainscg trainoss
logsig-pureline logsig-pureline logsig–logsig logsig–logsig logsig–logsig logsig–logsig logsig–logsig
Training 0.88 0.89 0.94 0.80 0.84 0.85 0.20Validation 0.81 0.80 0.61 0.77 0.77 0.83 0.82Testing 0.84 0.82 0.83 0.77 0.79 0.83 0.80All 0.85 0.86 0.83 0.78 0.82 0.84 0.20
Table 7 The effect of the neurons number combination for type 2 NN
No. of neurons (7,15,8) (5,10,5) (10,10,10) (7,7,7) (7,10,8) (12,9,7) (7,9,12)
Training 0.96 0.91 0.95 0.93 0.95 0.96 0.94Validation 0.55 0.82 0.43 0.55 0.71 0.07 0.61Testing 0.87 0.84 0.79 0.76 0.79 0.79 0.85All 0.86 0.88 0.73 0.79 0.86 0.45 0.84

Journal of Petroleum Exploration and Production Technology
1 3
actual data, not the error that occurred in the actual data as in such case.
Support vector machines
Many different kernel functions are available in a support vector machine (SVM). In this study, a few of these func-tions were used, such as
kernel=‘poly’; %’gaussian’; ‘polyhomog’;’htrbf’;’rbf’;
command (2)
During the buildup of the SVM model, Poly and Gauss-ian predicted the best results among the others. Figures 20 and 21 show results achieved using a Poly function for both training and testing data with correlation coefficient 0.82 for training and 0.998 for testing. The Gaussian function results were not as good as the Poly function, as illustrated in Figs. 22 and 23.
Table 10 summarizes the results from the two techniques.
Functional network
Different percentages for training and testing were used in the functional network model, but the best results were 70% for the training and 30%. Both results for training and testing gave the same values of R-square when using this percentage combination as can be seen in Figs. 24 and 25.
Concluding remarks
Four main models for multiphase flow rate through chokes were developed, which are artificial neural network (ANN), fuzzy logic (FL), support vector machine (SVM), and func-tional network (FN). Several statistical and graphical tech-niques were made to check the accuracy of the new models.
The artificial intelligent (AI) was successfully applied to solve this problem using the different techniques pro-posed. The input and output data were preprocessed using normalization and log. It was observed that normalization
Fig. 6 Correlation coefficient for the trained, the validated, the tested and all data

Journal of Petroleum Exploration and Production Technology
1 3
Fig. 7 Correlation between the actual and the predicted choke size for both training and testing data
01 200
100
200
300
400
500
600
700
800
900
1000
1100
Rec
ord
Size(1/64)
S(Choke)-trn
S(pred)-trn
01 200
100
200
300
400
500
600
700
800
900
1000
1100R
ecor
d
Size(1/64)
S(Choke)-trn
S(pred)-trn
Table 8 Correlation coefficient for trained and tested data of FL model
Radii 0.1 0.05 0.01 0.20 0.145
Test Train Test Train Test Train Test Train Test Train
R 0.91 0.82 0.79 1.00 0.81 1.00 0.79 0.87 0.82 0.88
y = 0.8206x + 13.862R2 = 0.8323
0
20
40
60
80
100
120
140
160
180
0 20 40 60 80 100 120 140 160 180
Fig. 8 Actual versus predicted choke size for FL model training (Radii = 0.1)
y = 0.7792x + 17.837R2 = 0.6649
0
20
40
60
80
100
120
140
160
180
200
0 20 40 60 80 100 120 140 160 180 200
Fig. 9 Actual versus predicted choke size for FL model testing (Radii = 0.1)

Journal of Petroleum Exploration and Production Technology
1 3
of the input data was not as good as taking the log for the prediction.
Table 11 compares the five methods using the correlation coefficient as a comparison criterion for the data of testing and training. Fuzzy logic (FL) gives the best results for the
training data while support vector machines (SVM) provide the best results for the testing data. Since the analysis of the data indicated that the data were clustered for most of the input parameters and as the fuzzy logic is best in its predic-tion for clustered data, it gives the best results in this study.
Fig. 10 Correlation between the actual and the predicted choke size for both training and testing data (FL model for Radii = 0.1)
01 200
100
200
300
400
500
600
700
800
900
1000
1100
Rec
ord
Size(1/64)
Training
S(Choke)-trn
S(pred)-trn
01 200
100
200
300
400
500
600
700
800
900
1000
1100
Rec
ord
Size(1/64)
Testing
S(Choke)-trn
S(pred)-trn
y = x + 1E-06R2 = 1
0
20
40
60
80
100
120
140
160
180
0 20 40 60 80 100 120 140 160 180
Fig. 11 Actual versus predicted choke size for FL model training (Radii = 0.01)
y = 0.8132x + 14.85R2 = 0.6461
0
20
40
60
80
100
120
140
160
180
0 20 40 60 80 100 120 140 160 180
Fig. 12 Actual versus predicted choke size for FL model testing (Radii = 0.01)

Journal of Petroleum Exploration and Production Technology
1 3
Fig. 13 Correlation between the actual and the predicted choke size for both training and testing data (FL model for Radii = 0.01)
01 200
100
200
300
400
500
600
700
800
900
1000
1100
Rec
ord
Size(1/64)
Training
S(Choke)-trn
S(pred)-trn
01 200
100
200
300
400
500
600
700
800
900
1000
1100
Rec
ord
Size(1/64)
Testing
S(Choke)-trn
S(pred)-trn
y = 0.6903x + 22.047R2 = 0.7968
0
20
40
60
80
100
120
140
160
0 20 40 60 80 100 120 140 160
Fig. 14 Actual versus predicted choke size for RBF model training (spread = 0.1)
y = 0.5168x + 38.528R2 = 0.5141
0
20
40
60
80
100
120
140
160
0 20 40 60 80 100 120 140 160
Fig. 15 Actual versus predicted choke size for RBF model testing (spread = 0.1)
Journal of Petroleum Exploration and Production Technology
1 3
Fig. 16 Correlation between the actual and the predicted choke size for both training and testing data (RBF model for spread = 0.1)
01 200
50
100
150
200
250
300
350
400
450
500
550
600
Rec
ord
Size(1/64)
S(Choke)-trn
S(pred)-trn
01 200
650
700
750
800
850
900
950
1000
1050
1100
Rec
ord
Size(1/64)
S(Choke)-trn
S(pred)-trn
y = 0.9922x + 0.5678R2 = 0.9954
0
20
40
60
80
100
120
140
160
180
0 20 40 60 80 100 120 140 160 180
Fig. 17 Actual versus predicted choke size for RBF model training (spread = 0.01)
y = 0.8311x - 23.927R2 = 0.1646
0
20
40
60
80
100
120
140
160
0 20 40 60 80 100 120 140 160
Fig. 18 Actual versus predicted choke size for RBF model testing (spread = 0.01)
Journal of Petroleum Exploration and Production Technology
1 3
Fig. 19 Correlation between the actual and the predicted choke size for both training and testing data (RBF model for spread = 0.01)
01 200
50
100
150
200
250
300
350
400
450
500
550
600
Rec
ord
Size(1/64)
S(Choke)-trnS(pred)-trn
01 200
650
700
750
800
850
900
950
1000
1050
1100
Rec
ord
Size(1/64)
S(Choke)-trnS(pred)-trn
Table 9 Correlation coefficient for trained and tested data of RBF model
Spread 0.1 0.01 0.05
Testing Training Testing Training Testing Training
R 0.72 0.89 0.41 1.00 0.69 0.95
0 100 200 300 400 500 600 700 8000
20
40
60
80
100
120
140
160
Data Points
Cho
ke S
ize
(1/6
4)
Result of Training for Choke Size using SVM
PredictedActual
Fig. 20 Correlation between the actual and the predicted choke size for training data (Poly function) (R = 0.82)
0 50 100 150 200 250 300 3500
20
40
60
80
100
120
140
160
Data Points
Cho
ke S
ize
(1/6
4)
Result of Training for Choke Size using SVM
PredictedActual
Fig. 21 Correlation between the actual and the predicted choke size for testing data (Poly function) (R = 0.998)

Journal of Petroleum Exploration and Production Technology
1 3
0 100 200 300 400 500 600 700 8000
20
40
60
80
100
120
140
160
180
200
Data Points
Cho
ke S
ize
(1/6
4)Result of Training for Choke Size using SVM
PredictedActual
Fig. 22 Correlation between the actual and the predicted choke size for training data (Gaussian function) (R = 0.75)
0 50 100 150 200 250 300 35020
40
60
80
100
120
140
160
180
Data Points
Cho
ke S
ize
(1/6
4)
Result of Testing for Choke Size using SVM
PredictedActual
Fig. 23 Correlation between the actual and the predicted choke size for testing data (Gaussian function) (R = 0.998)
Table 10 Correlation coefficient for trained and tested data of SVM model
Function Poly Gaussian
Training 0.820 0.750Testing 0.997 0.997
0 100 200 300 400 500 600 700 8000
20
40
60
80
100
120
140
160
Data Points
Cho
ke S
ize
(1/6
4)
Result of Training for Choke Size using FN
PredictedActual
Fig. 24 Correlation between the actual and the predicted choke size for training data (FN) (R = 0.81)
0 50 100 150 200 250 300 3500
20
40
60
80
100
120
140
160
Data Points
Cho
ke S
ize
(1/6
4)
Result of Testing for Choke Size using FN
PredictedActual
Fig. 25 Correlation between the actual and the predicted choke size for testing data (FN) (R = 0.81)
Table 11 Correlation coefficient summary for the different tools
NN Fuzzy RBF SVM FN
Training 0.910 1.000 0.950 0.820 0.810Testing 0.840 0.810 0.690 0.997 0.810
Journal of Petroleum Exploration and Production Technology
1 3
Acknowledgement The authors would like to acknowledge the sup-port provided by King Abdulaziz City for Science and Technology (KACST) through the Science & Technology Unit at King Fahd Uni-versity of Petroleum & Minerals (KFUPM) for funding this work under Project No. 08-OIL82-4 as part of the National Science, Technology and Innovation Plan.
Open Access This article is distributed under the terms of the Crea-tive Commons Attribution 4.0 International License (http://creat iveco mmons .org/licen ses/by/4.0/), which permits unrestricted use, distribu-tion, and reproduction in any medium, provided you give appropriate credit to the original author(s) and the source, provide a link to the Creative Commons license, and indicate if changes were made.
References
Abdul-Majeed GH, Maha R (1991) Correlations developed to pre-dict two-phase flow through wellhead chokes. J Can Pet Technol 30(6):47–55
AlAjmi MD, Sulaiman AA, Mahsoon M (2015) Improving multiphase choke performance prediction and well production test valida-tion using artificial intelligence: a new milestone. In: SPE digital energy conference and exhibition
Al-Attar H (2008) Performance of wellhead chokes during sub-critical flow of gas condensates. J Pet Sci Eng 60(3–4):205–212
Al-Attar HH, Abdul-Majeed GH (1988) Revised bean performance equation for East Baghdad oil wells. SPE Prod Eng 3(1):127–131
Al-Khalifa MA, Al-Marhoun MA (2013) Application of neural network for two-phase flow through chokes. In: SPE Saudi Arabia sec-tion technical symposium and exhibition. Society of Petroleum Engineers
Al-Towailib AI, Al-Marhoun MA (1992) A new correlation for two-phase flow through chokes. King Fahd University of Petroleum and Minerals, Dhahran
Al-Towailib AI, Al-Marhoun MA (1994) A new correlation for two-phase flow through chokes. J Can Pet Technol 33(5):1–148
Burges CJ (1998) A tutorial on support vector machines for pattern recognition. Data Min Knowl Disc 2(2):121–167
Castillo E, Gutiérrez JM, Hadi AS, Lacruz B (2001) Some applications of functional networks in statistics and engineering. Technomet-rics 43(1):10–24
Duch W, Adamczak R, Jankowski N (1997) Initialization and optimi-zation of multilayered perceptrons. In: 3rd conference on neural networks and their applications, pp 99–104
Elhaj MA, Anifowose F, Abdulraheem A (2015) Single gas flow pre-diction through chokes using artificial intelligence techniques. In: Saudi Arabia section annual technical symposium and exhibition. Society Petroleum Engineers
Elhaj Murtada A, Anifowose Fatai, Abdulraheem Abdulazeez, Enamul Hossain M (2017) Prediction of Choke Size for Single Gas Flow using Artificial Intelligence Techniques. J Nat Sci Sustain Technol 11(2):99–116
Elish KO, Elish MO (2008) Predicting defect-prone software modules using support vector machines. J Syst Softw 8(15):649–660
Gilbert WE (1954) Flowing and gas-lift well performance. In: Drilling and production practice. American Petroleum Institute
Goh AT, Goh SH (2007) Support vector machines: their use in geotech-nical engineering as illustrated using seismic liquefaction data. Comput Geotech 34(5):410–421
Guojie L (2004) Radial basis function neural network for speaker veri-fication. The Nanyang Technological University, Singapore
Hosmer DW Jr, Lemeshow S, Sturdivant RX (2013) Applied logistic regression, vol 398. Wiley, Hoboken
Hou J, Wenfen H (2006) Novel approach to predict potentiality of enhanced oil recovery. In: Intelligent energy conference and exhi-bition. Society of Petroleum Engineers
Karnik NN, Mendel JM, Liang Q (1999) Type-2 fuzzy logic systems. IEEE Trans Fuzzy Syst 7(6):643–658
Lauría EJ, Duchessi PJ (2006) A Bayesian belief network for IT imple-mentation decision support. Decis Support Syst 42(3):1573–1588
Omana R, Houssiere Jr. C, Brown KE, Brill JP, Thompson RE (1969) Multiphase flow through chokes. In: Fall meeting of the society of petroleum engineers of AIME. Society of Petroleum Engineers
Osman ME, Dokla ME (1990) Gas condensate flow through chokes. In: European petroleum conference. Society of Petroleum Engineers
Pilehvari AA (1981) Experimental study of critical two-phase flow through wellhead chokes. University of Tulsa, Tulsa
Ros NCJ (1960) An analysis of critical simultaneous gas/liquid flow through a restriction and its application to flowmetering. Appl Sci Res 9(1):374
Sachdeva R, Schmidt Z, Brill JP, Blais RM (1986) Two-phase flow through chokes. In: SPE annual technical conference and exhibi-tion. Society of Petroleum Engineers
Salah A, Rahman AKN (2005) An enhancement of k-nearest neighbor classification using genetic algorithm. MICS
Surbey DW, Kelkar BG, Brill JP (1989) Study of multiphase critical flow through wellhead chokes. SPE Prod Eng 4(2):142–146
Wang J, Du H, Liu H, Yao X, Hu Z, Fan B (2007) Prediction of sur-face tension for common compounds based on novel methods using heuristic method and support vector machine. Talanta 73(1):147–156
Zadeh LA (1965) Information and control. Fuzzy Sets 8(3):338–353
Publisher’s Note Springer Nature remains neutral with regard to jurisdictional claims in published maps and institutional affiliations.