Embed Size (px)
Citation preview

International Journal of Oil, Gas and Coal Engineering 2017; 5(2): 19-26
http://www.sciencepublishinggroup.com/j/ogce
doi: 10.11648/j.ogce.20170502.12
ISSN: 2376-7669(Print); ISSN: 2376-7677(Online)
Optimization Drilling Parameters Performance During Drilling in Gas Wells
Mehaysen A. AL-Mahasneh
Chemical Engineering Department, Al-Huson University College, Al-Balq'a Applied University, Irbid, Jordan
Email address: [email protected], [email protected]
To cite this article: Mehaysen A. AL-Mahasneh. Optimization Drilling Parameters Performance During Drilling in Gas Wells. International Journal of Oil, Gas
and Coal Engineering. Vol. 5, No. 2, 2017, pp. 19-26. doi: 10.11648/j.ogce.20170502.12
Received: November 29, 2016; Accepted: December 10, 2016; Published: March 22, 2017
Abstract: The objective of the present work is to optimize drilling parameters such as WOB, ROP, RPM, flow rate and drill
diameter of hole. The research contribution to investigation and analysis field data. This paper focuses on the optimization of
drilling parameters. Drilling optimization is very important during drilling operation, to save time and cost of operation thus
increases the profit. The result from analysis is used to determine optimum, RPM, ROP, flow rate, to give optimum drilling
performance. Optimization the drilling parameters for depth at 11778.79 ft, weight on bit between 33000 lbs to 44000 lbs and
rotary speed range between 50 to 80 rotation per minute, flow rate is 356.67 gallon /min, Optimize value of weight on bit per
inch diameter of bit 8 1/2" in range 3882.35 lbs /in to 5176..47 lbs/in, The productive time for drilling is 60.5%. from total time
of operations.
Keywords: Drilling, Rate of Penetration, Rotary Speed, Weight on Bit, Optimization, Parameters Drilling, Gas Well
1. Introduction
Future oilfield resource developments are subject to
drill wells in cost efficient manners. For that reason future
management of oilfield drilling operations will face new
hurdles to reduce overall costs, increase performances and
reduce the probability of encountering problems. Drilling
wells for energy search from the ground has shown
considerable technological advances in the recent years.
Different methods from different disciplines are being
used nowadays in drilling activities in order to obtain a
safe, environmental friendly and cost effective well
construction.
Communication and computer technologies are among the
most important disciplines which can contribute to drilling
optimization. Large amount of data could be piped through
different locations on the planet in reliable and time efficient
manners. Advanced computer technologies are now being
used in storing large amounts of data, and solving complex
problems.
From the very early beginning of the drilling campaigns
the operators have always been seeking to reduce the drilling
costs mainly by increasing the drilling speed.
In the drilling industry, the first well drilled in a new field
(a wildcat well) generally will have the highest cost. With
increasing familiarity to the area optimized drilling could be
implemented decreasing costs of each subsequent well to be
drilled until appoint is reached at which there is no more
significant improvement [1]. The relationship among drilling
parameters are complex, the effort is to determine what
combination of operating conditions result in minimum cost
drilling [2]. The generally accepted convention for a proper
planning of any drilling venture is to optimize operations and
minimize expenditures [3]. Another essential aspect of the
optimization is to enhance the technology and make the
system effective [4]. Recently environmental friendly
activities have also started to be common practice in certain
locations, which in turn could be achieved by means of
reducing the risks associated with having technical problems.
In recent years the increasing emphasis that is being paid
by the oil and gas field operator companies towards working
much efficiently at the rig sites are based on some important
reasons. The most important of all are: cost and trouble free
operations. During a peak in the cost of hydrocarbon
resources, the rig supplier and oil field service provider
contractor charges are increasing, pushing operators to work
efficiently.
Due to the complexity of the activities being offshore

20 Mehaysen A. AL-Mahasneh: Optimization Drilling Parameters Performance During Drilling in Gas Wells
and/or being in the form clusters operators restraining
themselves from causing a damage, which may result in
destruction of more than one well due to their proximity
between each other being very close. Directional techniques
allowed drilling multiple wells from one location, thus
eliminating construction of expensive structures for each well
[5]. Due to the drilling requirements similarity of the wells
located at close distances, collecting past data, and utilizing
in a useful manner is considered to have an important impact
on drilling cost reduction provided that optimum parameters
are always in effect.
Major drilling variables considered to have an effect on
drilling rate of penetration (ROP) are not fully comprehended
and are complex to model [6]. For that very reason accurate
mathematical model for rotary drilling penetration rate
process has not so far been achieved. There are many
proposed mathematical models which attempted to combine
known relations of drilling parameters.
The proposed models worked to optimize drilling
operation by means of selecting the best bit weight and rotary
speed to achieve the minimum cost. Considerable drilling
cost reductions have been achieved by means of using the
available mathematical models.
It is important to bear in mind that formation properties,
which are uncontrollable are one of the most critical factors
in drilling performance determination. Drilling fluid
properties and bit types, though controllable are not in good
drilling practice to 3 change in ordinary bit runs. However,
hydraulics, the weight applied to the bit and bit and rotary
speed are among the controllable factors.
2. Objective of This Study
The optimization of rate of penetration for the drilling
activities is going to have direct effects on the cost reduction,
together with elimination of problems. It has-been reported
that drilling optimization should be based on the accumulated
and statistically processed empirical data rather than working
with implicit relations [7]. The scope of this study is to make
use of the data from rig sites. The data available to the
drilling engineer is mainly sourced from Mud Logging Units
(MLU).
It is also known that recently manufactured rigs are being
equipped with powerful data import capabilities that make
connection to third-party Well site Information. Transfer
Specification (WITS) data simple and reliable [7]. WITS is a
communications format used for the transfer of a wide
variety of well site data from one computer system to
another. It is a recommended format by which Operating and
Service companies involved in the Exploration and
Production areas of the Petroleum Industry may exchange
data in either an online or batch transfer mode. New
generation tool is Well site Information Transfer Standard
Markup Language (WITSML) which is the standard
transmission of well site data in a consistent form which
would enable the integration of information from different
suppliers [8].
The data could be piped in real-time, be processed and
interpreted such as to recommend the optimum drilling
parameters back in real-time as well [9].
This cycle is easily achievable in today’s technology by
means of using advanced communication systems, and
innovative computer technologies. In order to understand
what has been done so far in regards to drilling optimization
it is very important to see what has been performed in the
recent history.
3. Drilling Data Used for the Analysis
Necessary analyses for this research study performed using
data belonging to Horizontally drilled wells in RISHA GAS
area [10, 11, 12]. The wells were horizontally drilled from in
three locations he drilling objective was to reach production
target levels with relatively high inclinations. Figure 1 gives
brief information of horizontally wells processed for real-
time drilling optimization. Results belonging to three wells
profile have been presented in the study.
Figure 1. Cross Section Of Formation.
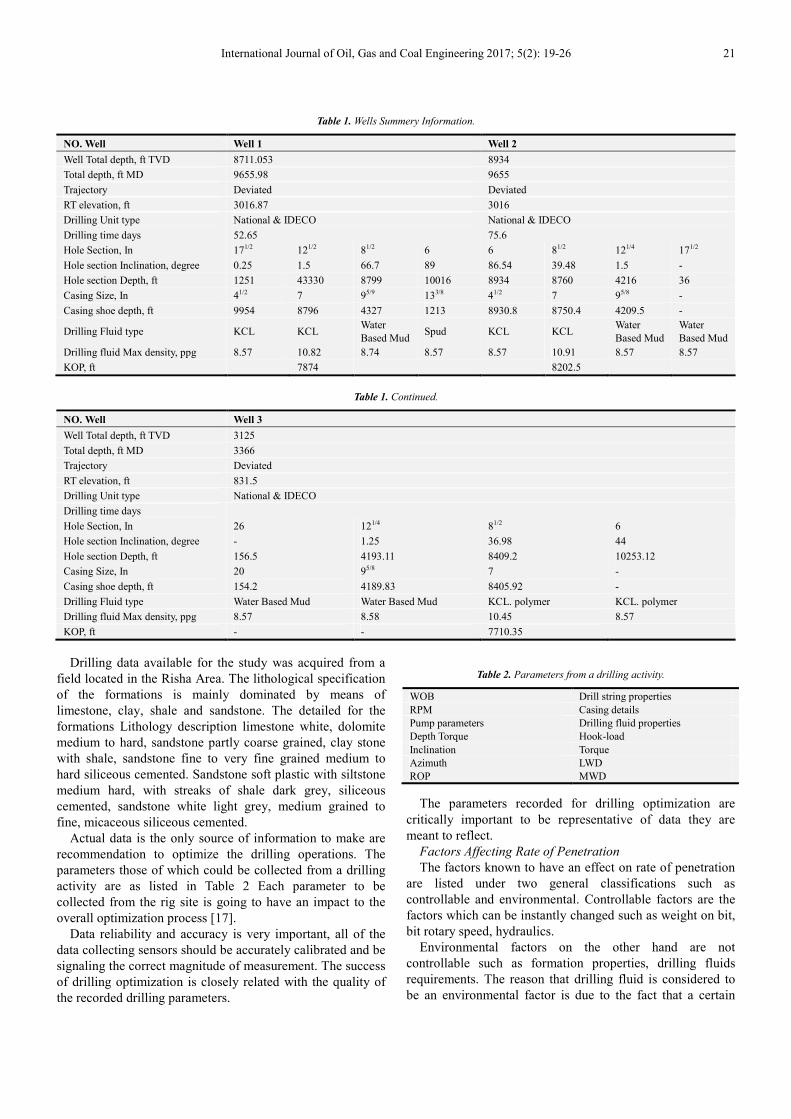
International Journal of Oil, Gas and Coal Engineering 2017; 5(2): 19-26 21
Table 1. Wells Summery Information.
NO. Well Well 1 Well 2
Well Total depth, ft TVD 8711.053 8934
Total depth, ft MD 9655.98 9655
Trajectory Deviated Deviated
RT elevation, ft 3016.87 3016
Drilling Unit type National & IDECO National & IDECO
Drilling time days 52.65 75.6
Hole Section, In 171/2 121/2 81/2 6 6 81/2 121/4 171/2
Hole section Inclination, degree 0.25 1.5 66.7 89 86.54 39.48 1.5 -
Hole section Depth, ft 1251 43330 8799 10016 8934 8760 4216 36
Casing Size, In 41/2 7 95/9 133/8 41/2 7 95/8 -
Casing shoe depth, ft 9954 8796 4327 1213 8930.8 8750.4 4209.5 -
Drilling Fluid type KCL KCL Water
Based Mud Spud KCL KCL
Water
Based Mud
Water
Based Mud
Drilling fluid Max density, ppg 8.57 10.82 8.74 8.57 8.57 10.91 8.57 8.57
KOP, ft
7874
8202.5
Table 1. Continued.
NO. Well Well 3
Well Total depth, ft TVD 3125
Total depth, ft MD 3366
Trajectory Deviated
RT elevation, ft 831.5
Drilling Unit type National & IDECO
Drilling time days
Hole Section, In 26 121/4 81/2 6
Hole section Inclination, degree - 1.25 36.98 44
Hole section Depth, ft 156.5 4193.11 8409.2 10253.12
Casing Size, In 20 95/8 7 -
Casing shoe depth, ft 154.2 4189.83 8405.92 -
Drilling Fluid type Water Based Mud Water Based Mud KCL. polymer KCL. polymer
Drilling fluid Max density, ppg 8.57 8.58 10.45 8.57
KOP, ft - - 7710.35
Drilling data available for the study was acquired from a
field located in the Risha Area. The lithological specification
of the formations is mainly dominated by means of
limestone, clay, shale and sandstone. The detailed for the
formations Lithology description limestone white, dolomite
medium to hard, sandstone partly coarse grained, clay stone
with shale, sandstone fine to very fine grained medium to
hard siliceous cemented. Sandstone soft plastic with siltstone
medium hard, with streaks of shale dark grey, siliceous
cemented, sandstone white light grey, medium grained to
fine, micaceous siliceous cemented.
Actual data is the only source of information to make are
recommendation to optimize the drilling operations. The
parameters those of which could be collected from a drilling
activity are as listed in Table 2 Each parameter to be
collected from the rig site is going to have an impact to the
overall optimization process [17].
Data reliability and accuracy is very important, all of the
data collecting sensors should be accurately calibrated and be
signaling the correct magnitude of measurement. The success
of drilling optimization is closely related with the quality of
the recorded drilling parameters.
Table 2. Parameters from a drilling activity.
WOB Drill string properties
RPM Casing details
Pump parameters Drilling fluid properties
Depth Torque Hook-load
Inclination Torque
Azimuth LWD
ROP MWD
The parameters recorded for drilling optimization are
critically important to be representative of data they are
meant to reflect.
Factors Affecting Rate of Penetration
The factors known to have an effect on rate of penetration
are listed under two general classifications such as
controllable and environmental. Controllable factors are the
factors which can be instantly changed such as weight on bit,
bit rotary speed, hydraulics.
Environmental factors on the other hand are not
controllable such as formation properties, drilling fluids
requirements. The reason that drilling fluid is considered to
be an environmental factor is due to the fact that a certain

22 Mehaysen A. AL-Mahasneh: Optimization Drilling Parameters Performance During Drilling in Gas Wells
amount of density is required in order to obtain certain
objectives such as having enough overpressure to avoid flow
of formation fluids. Another important factor is the effect of
the overall hydraulics to the whole drilling operation which is
under the effect of many factors such as Lithology, type of
the bit, down hole pressure and temperature conditions,
drilling parameters and mainly the rheological properties of
the drilling fluid. Rate of penetration performance depends
and is a function of the controllable and environmental
factors. It has been observed that the drilling rate of
penetration generally increases with decreased Equivalent
Circulating Density (ECD). Another important term
controlling the rate of penetration is the cuttings transport.
Ozbayoglu et al. 2004 [13], conducted extensive
sensitivity analysis on cuttings transport for the effects of
major drilling parameters, while drilling for horizontal and
highly inclined wells. It was concluded that average annular
fluid velocity is the dominating parameter on cuttings
transport, the higher the flow rate the less the cuttings bed
development. One of the most important considerations in
order to have an efficiently cuttings transported hole is to
take into account the factors given in Table 3 [14].
Table 3. Factors for efficient hole cleaning.
1 Hole angle, degree 1.25 to 1.50
2 Fluid Velocity, ft/min, for three wells 414.17 to 581.24
3 Fluid Properties (rheological properties and density) Vis=45-ta as, p.v=12, PH=10, 8.57ppg, 8.74 ppg
4 Cuttings Size, shape, and concentration Coarse medium and fine grained
6 Rate of pipe rotation and pipe eccentricity 80, 90, 100, 125
7 Fluid flow regime (laminar or turbulent) Turbulent flow
Table 4. Performed data runs for Well-1 12 ¼” Hole Formation Khisha and
Mudawrah.
No. Well Well 1
Formation Khisha and Mudawrah
Bit Size, In 12 1/4
Bit type GTX33, 3Js, H77F, S44, M4NE, S86F
Inc. min, degree 0.25
Inc max, degree 1.50
M. W. min, ppg 8.57
M. W, max, ppg 8.74
Start, Ft, TVD 1250.06
End, ft, TVD 4330.92
WOB min, lb 4400 8800 13200
WOB max, lb 15400 17600 19800
N min rpm 50 60 70
N max, rpm 80 90 100
ROP, min, ft/hr 10.17 10.99 12.56
ROP, max, ft/hr 14.63 19.68 19.68
Table 5. Performed data runs for Well-1 12 ¼” Hole Formation Khisha and
Mudawrah.
No. Well Well 2
Formation Khisha and Mudawrah
Bit Size, In 12 1/4
Bit type HP53AJ, H77F, S86F
Inc. min, degree 0.7 5
Inc. max, degree 1.50
M. W. min, ppg 8.57
M. W, max, ppg 8.74
Start, Ft, TVD 36. 09
End, ft, TVD 4216.06
WOB min, lb 15400 17600 19800
WOB max, lb 22000 24200 26400
N min rpm 80 80 90
N max, rpm 90 90 100
ROP, min, ft/hr 5.90 7.21 7.87
ROP, max, ft/hr 8.53 9.51 11.81
Table 6. Performed data runs for Well-1 12 ¼” Hole Formation Khisha and
Mudawrah.
No. Well Well 3
Formation Khisha and Mudawrah
Bit Size, In 12 1/4
Bit type J33, H77F, S44,
Inc. min, degree 0.2 5
Inc. max, degree 1.25
M. W. min, ppg 8.57
M. W, max, ppg 8.74
Start, Ft, TVD 119.75
End, ft, TVD 4196.39
WOB min, lb 6600 11000 13200
WOB max, lb 15400 17600 19800
N min rpm 75 80 80
N max, rpm 90 125 125
ROP, min, ft/hr 5.67 6.75 8.23
ROP, max, ft/hr 8.79 10.79 11.74
Figure 2. The Effect Of Bit Loading On penetration Rate For various Rocks.

International Journal of Oil, Gas and Coal Engineering 2017; 5(2): 19-26 23
Figure 3. The Effect of Bit Loading On penetration Rate For various Rocks.
Figure 4. The Effect of Bit Loading On penetration Rate For various Rocks.
Figure 5. Drilling Parameter According The Lithology.

24 Mehaysen A. AL-Mahasneh: Optimization Drilling Parameters Performance During Drilling in Gas Wells
Figure 6. Operation performance Chart " Rig Time + Actual Drilling Time.
Table 7. Time Break Down.
No Operation Total
Hours Days Percent- age
1 Drilling 2633.15 60.5
2 Reaming 174.50 4.0
3 Trips 507.45 11.7
4 Mud conditioning 31.00 0.7
5 Circulation 114.15 2.6
6 Deviation survey 20.20 0.5
7 Coring 35.35 0.8
8 Logging 87.55 2.0
9 Standby 12.00 0.3
10 Run casing 47.15 1.1
11 Cementing 16.25 0.4
12 Waiting on cement 41.35 1.0
13 Nippling BOPS 33.15 0.8
14 Loss treatment 285.45 6.6
15 Evaluating test 3.00 0.07
16 Drilling cement 23.55 0.5
17 Maintenance 45.25 1.03
18 Building or Laying down
drilling string 68.25 1.1
19 Fishing 19.45 0, 4
20 Operation with no charge 153.50 3.5
21 Total hours 4355.30 100%
4. Results & Discussion
The results for different optimization runs are as
summarized in the following sections. The runs were
individually performed for the same formation types, and
provided that the data were belonging to equally sized bit
diameters.
4.1. Presentation of the Results
The details of the performed data runs are as summarized
in Table 1, such as wellbore deviation, drilling fluid density,
type of fluid, hole section diameter, casing size, casing set
depth, kick off point, drilling times in days. The given dataset
are belonging to Well 1, well 2, well 3. well 1 objectives is to
delineate and explore the gas bearing reservoir of Risha
Formation, the well is anticipated to horizontally (max
inclination 89 degrees) penetrate Risha Formation at True
Vertical Depth (TVD) of 2655 m (GL) with vertical
displacement of 550m.
The parameters those of which could be collected from a
drilling activity are as listed in Table 2. Each parameter to be

International Journal of Oil, Gas and Coal Engineering 2017; 5(2): 19-26 25
collected from the rig site is going to have an impact to the
overall optimization process [16]. Data reliability and
accuracy is very important, all of the data collecting sensors
should be accurately calibrated and be signaling the correct
magnitude of measurement.
One of the most important considerations in order to have
an efficiently cuttings transported hole is to take into account
the factors given in Table 3 [14]. It was concluded that
average annular fluid velocity is between 414.17 to
581.24ft/min, dominating parameter on cuttings transport, the
higher the flow rate. Another important factor is the mainly
the rheological properties of the drilling fluid such as Vis
=45-50 s, P.V=12, PH=10, M.W 8.57 ppg to 8.74 ppg.
Rate of penetration performance depends and is a function
of the effect of the overall hydraulics to the whole drilling
operation which is under the effect of many factors such as
lithology, Type of the bit and nozzles, Downhole pressure
and temperature conditions.
It is clear that Fluid flow regime is turbulent flow which
better for bed development prevention for efficient hole
cleaning.
4.2. Factors Affecting Rate of Penetration
Performed data runs for Well-1, 12 ¼” Hole, Formation
Khisha and Mudawrah. The details of the performed data
runs are as summarized in Table 5 such as wellbore deviation
is between 0.25 to 1.75 degrees, the minimum drilling fluid
density is 8.57 ppg and the maximum drilling fluid density is
8.74 ppg, the weight applied to the bit and the rotation speed.
The given data set are belonging to Well 1 and Khisha &
Mudawrah Formation. The Bit type in use was a milled tooth
in type H77F, J33, HP53GX, and insert in type S86F, S44.
The general operating parameters for minimum weight on
bit magnitudes are between 4400, 8800, 13200 lb. and the
maximum weight on bit are 15400, 17600, 19800 lb, and 50
to 100 RPM for rotary speed [10, 11].
4.3. Rate of Penetration
Optimization of drilling operation can be obtained by
increasing drilling speed (Moses and Egbon, 2011, 2012) [17,
18]. After obtained the data, the rate of penetration was
collected from the field data. In Figure 2 shows the value of
penetration rate increase when increase weight on bit.
However, as more data are obtained, the values of rate of
penetration become more accurate.
This data is shown in Figure 2 illustrate the simulation of
weight on bit with penetration rate for depth 4330.02 ft,
Table 4.
Rate of penetration increase at moderate values from 10.17
to 19.68 ft/hr with increasing weight on bit form 4400 to
19800 lbs, and weight on bit per inch was 1077.55lbs/in.
The optimum value of 13200 lbs or 1077.55lbs/in of
weight on bit can be used to have optimized drilling
operation. This is valid as increasing weight on bit will
increase rate of penetration but only to some value where
after that, subsequence increase in bit weight causes only
slight improvements in penetration rate.
Based on the graph obtain in Figure 3 shown the
penetration rate for depth 4216.06 ft Table 5 increase from
5.90 to 11.81 ft/hr with increasing weight on bit.
However after that, rate of penetration increase slowly.
Although the weight on bit has increase from 15400 until
26400 lbs, and weight on bit per inch was 1706.12 lbs/in, rate
of penetration still in the range of 11.81 ft/hr.
Based on the graph obtain in Figure 4 indicates the value
of weight on bit with penetration rate for depth 4196.39ft.
Table 6 Rate of penetration increase at small ranges from
5.67 to 11.74 ft/hr with increasing weight on bit.
However after that, rate of penetration increase slowly.
Although the weight on bit has increase from 6600 until
19800 lbs, and weight on bit per inch was 1137.41 lbs/in, rate
of penetration still in the range of 11.74 ft/hr. The optimized
weight on bit is 13200lbs or 1077.55 lbs/in during drilling
operation, penetration rate for depth 4330.02 ft is suitable
due to formation that is may be high in strength.
Figure 5 Shows the drilling parameters performance to be
determined according Lithology and hole condition [19, 20].
The 17 1/2 hole Contains intercalation of limestone,
dolomite, chert, sandstone and claystone soft to medium
formation, the weight on bit was medium (26000 lb to 33000
lb) the penetration rate 10.33 ft/hr increase, the flow rate is
607gallon /minute to clean the hole from cuttings. The 12 1/4
hole, contains the sandstone and shale. The negative effects
from shale on drilling operation, Sloughing and swelling of
shale are the major problems encountered when drilling a
well. Shale make up of the drilled formations it means
instability problems some shale sections contains hydrotable
clays, which continually absorb water and swell and slough
into the hole. These formations, known as heaving shales,
may result in high cost of drilling the hole and also cause
other hole problems like pipe sticking, excessive solid build
up in the mud hole bridging. the penetration rate is 7.44 ft/hr
with moderately weight on bit and flow rate 475 gallon
/minute. The 8 1/2 hole contains the sandstone and siltstone
hard formation, the rate of penetration is decrease with
increase the weight on bit 33000 to 44000 lb and decrease in
rotation per minute 50- 80 RPM, the flow rate is decrease to
356 gallon /minute.
Figure 6 Show Operation performance, Rig Time and the
Actual Drilling Time.
Table 7. show the time breakdown. The productive, non-
productive and lost time are distributed.
The Rig spent 181.47 days on the location including.
Following is the time spent per hole phase: Performed data
runs for Well-4, 171 /2” Hole Formation Khisha and
Mudawarra, 35 days were spent to drill this hole, problems
with losses, treatment by cement plugs. 12 1/4 hole takes 44
days, we phase the problems of sloughing and caving shale
we spent time for treatment by increasing mud weight and
more times for conditioning mud and circulation to keep the
hole stability. 8 1/2 hole formation Dubeidib, sandstone
white, light grey fine medium grained and siltstone grey
slightly medium hard micaceous the interval was 1614 m

26 Mehaysen A. AL-Mahasneh: Optimization Drilling Parameters Performance During Drilling in Gas Wells
takes 79 days for drilling and other operations.
5. Conclusion
Main problems in this area partial loss circulation and
Severe total loss of circulation occurred at different depths in
the 171/2" holes, The loss zones were treated by pumping
cement plugs, mud plugs, gunk plugs and by dropping other
various materials such as balls of mixed of bentonite and
Loss of Circulation Materials (LCM) in addition to the
special-Net product to seal the loss zones..
The results of optimization show the significance of this
study. Determination of optimum weight on bit is very
important in drilling operation as this parameter can be
change during drilling operation. The optimization of weight
on bit with rotary speed per minute will optimize the whole
drilling operation as a whole. Increasing rate of penetration
will reduce the time need for drilling those reduces the cost
for drilling operation.
Optimization drilling parameters such as weight on bit
found that for depth at 11778.79ft, optimize weight on bit are
33000 lbs compared to 44000 lbs, with decrease the rpm
between 50- 80 rpm, the flow rate is 356.67 gallon /min to
keep the hole clean from cuttings, optimize value of weight
on bit per inch diameter of bit 8 1/2 " is between 3882.35
lbs/in to 5176.47 lbs/in.
The results of this study provide guidance for next drilling
operation near the drilled well to reduce the spent time for
drilling operations. The productive time for drilling
operations was 60.5%.
References
[1] Azar J. J., and Samuel G. R., "Drilling Engineering", Penn Well Corporation, Tulsa OK, 2007.
[2] Society Petroleum Engineering, March 2008, Petroleum Engineering, Drilling Engineering, Drilling Optimization, Practical Guidelines.
[3] Carden, R. S., Grace, R. D., and, Shursen, J. L.: “Drilling Practices, ” Petroskills-OGCI, Course Notes, Tulsa, OK, 2006, pp 1-8
[4] Samuel G. R., and Miska S., “Optimization of Drilling Parameters with the Performance of Multilobe Positive Displacement Motor (PDM), ” SPE 47791, IADC/SPE Asia Pacific Drilling Conference, Jakarta, Indonesia, September 1998
[5] Short J. A., “Introduction to Directional and Horizontal Drilling, ” PennWellPublishing Company, Tulsa, OK, 1993, pp 3
[6] Bourgoyne A. T. Jr., Millheim K. K., Chenevert M. E., and Young F. S., "Applied Drilling Engineering", Society of
Petroleum Engineers Text Book Series, Vol. 1, Richardson, TX, 1986.
[7] Drilling data management with server-based systems and proprietary software. World Oil, Vol. 229 No. 12, pp 78, December 2008.
[8] Pickering J. G., Kreijger J., Grovik L. O., Franssens D., and Doniger A., “WITSML “Comes of Age” for the Global Drilling and Completions Industry,” SPE 124347-MS, SPE Annual Technical Conference and Exhibition, New Orleans, Louisiana, 4-7 October 2009.
[9] Lummus J. L., “Drilling Optimization,” SPE 2744, SPE 40th Annual California Fall Meeting, San Francisco. November 1969
[10] -Final Drilling Report well RH-39, Drilling Rigs (National E-610, Ideco E-1700), Drilling Department August -2006.
[11] Final Final Drilling Report well RH-40H, Drilling Rigs (National E-610, Ideco E-1700), Drilling Department June -2006.
[12] Final Final Drilling Report well RH-42S, Drilling Rigs (National E-610, Ideco E-1700), Drilling Department June -2007.
[13] Ozbayoglu M. E., Miska S. Z., Reed T., and Takach N., “Analysis of the Effects of Major Drilling Parameters on Cuttings Transport Efficiency for High-Angle Wells in Coiled Tubing Drilling Operations, ” SPE 89334, SPE/IcoTA CT Conf. andExhb., Houston, TX, March 2004
[14] Al-Betairi E. A., Moussa M., and Al-Otaibi S., “Multiple Regression Approach to Optimize Drilling Operations in the Arabian Gulf Area, ” SPE 13694, Middle East Oil Symposium, Bahrain, March 1985
[15] Dubinsky V. S., and Baecker D. R., “An Interactive Drilling Dynamics Simulator for Drilling Optimization and Training,” SPE 49205, SPE Annual Technical Conference, New Orleans, September 1998.
[16] Tuna, E., 2010. Real-time-optimization of drilling parameters during drilling operations (Thesis). Middle East Technical University,
[17] Moses, A. A. and F. Egbon, 2011. Semi-analytical models on the effect of drilling fluid properties on Rate of Penetration (ROP), SPE no. 150806. Proceedings of the Nigeria Annual International Conference and Exhibition, 30 July-3, Abuja, Nigeria
[18] Sonny Irawan, Adib Mahfuz Abd Rahman and Saleem Qadir Tunio." Optimization of Weight on Bit During Drilling Operation Based on Rate of Penetration Model" Research Journal of Applied Sciences, Engineering and Technology 4 (12): 1690-1695, 2012, ISSN: 2
[19] Final Drilling Report well RH-3, N. R. A. Petroleum Exploration Directorate, 1988.
[20] Final Geological Report Well RH—3, N. R. A, Petroleum Exploration Directorate.