Embed Size (px)
Citation preview
RDO-JOuRnaL // 01/2013 2322
Process Engineering
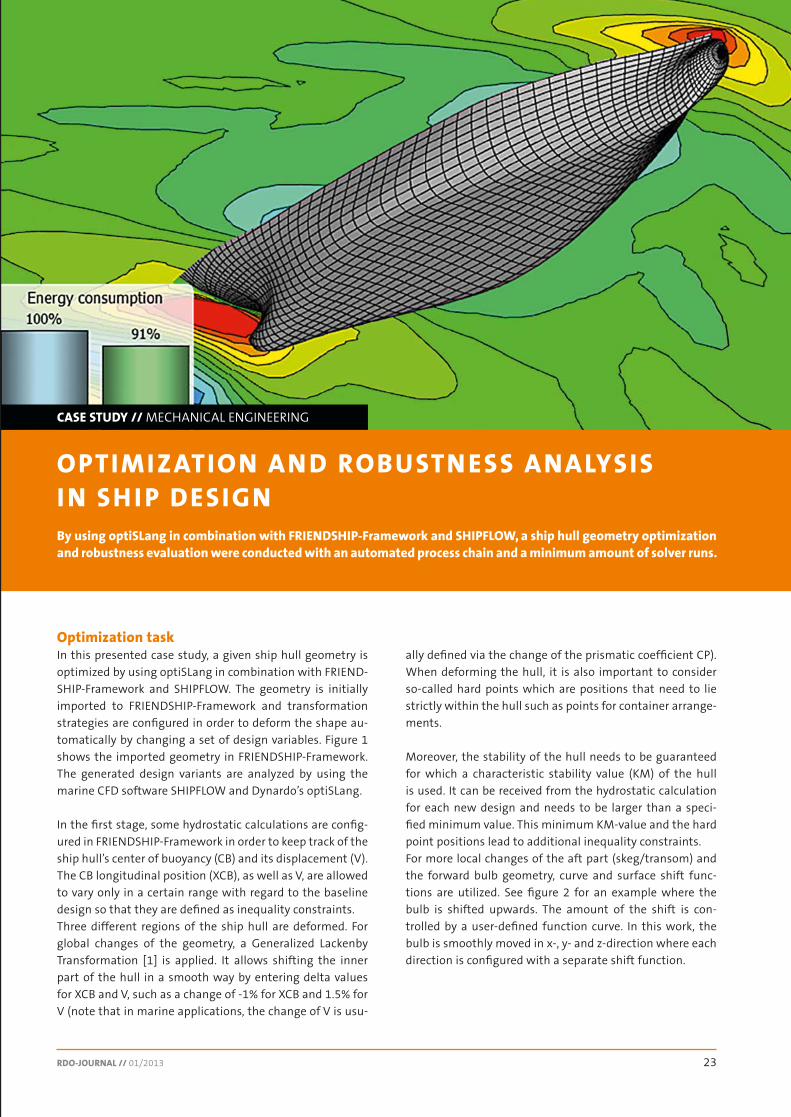
OPTiMizaTiOn an D RObuSTn ESS anaLySiS i n Sh i P DESignby using optiSLang in combination with fRiEnDShiP-framework and ShiPfLOw, a ship hull geometry optimization and robustness evaluation were conducted with an automated process chain and a minimum amount of solver runs.
caSE STuDy // MECHANICAL ENGINEERING
Optimization taskIn this presented case study, a given ship hull geometry is optimized by using optiSLang in combination with FRIEND-SHIP-Framework and SHIPFLOW. The geometry is initially imported to FRIENDSHIP-Framework and transformation strategies are configured in order to deform the shape au-tomatically by changing a set of design variables. Figure 1 shows the imported geometry in FRIENDSHIP-Framework. The generated design variants are analyzed by using the marine CFD software SHIPFLOW and Dynardo’s optiSLang.
In the first stage, some hydrostatic calculations are config-ured in FRIENDSHIP-Framework in order to keep track of the ship hull’s center of buoyancy (CB) and its displacement (V). The CB longitudinal position (XCB), as well as V, are allowed to vary only in a certain range with regard to the baseline design so that they are defined as inequality constraints.Three different regions of the ship hull are deformed. For global changes of the geometry, a Generalized Lackenby Transformation [1] is applied. It allows shifting the inner part of the hull in a smooth way by entering delta values for XCB and V, such as a change of -1% for XCB and 1.5% for V (note that in marine applications, the change of V is usu-
ally defined via the change of the prismatic coefficient CP). When deforming the hull, it is also important to consider so-called hard points which are positions that need to lie strictly within the hull such as points for container arrange-ments.
Moreover, the stability of the hull needs to be guaranteed for which a characteristic stability value (KM) of the hull is used. It can be received from the hydrostatic calculation for each new design and needs to be larger than a speci-fied minimum value. This minimum KM-value and the hard point positions lead to additional inequality constraints.For more local changes of the aft part (skeg/transom) and the forward bulb geometry, curve and surface shift func-tions are utilized. See figure 2 for an example where the bulb is shifted upwards. The amount of the shift is con-trolled by a user-defined function curve. In this work, the bulb is smoothly moved in x-, y- and z-direction where each direction is configured with a separate shift function.
friction between the sheets and the friction between bottom sheet and die. The tendency of a rising interlock is associated with increasing sheet thickness (bottom) and higher friction between the sheets as well as between sheet and die.
In comparison to the neck thickness, the percentage chang-es of the interlock due to parameter variations are higher: values of 0.131mm to 0.215mm are to be expected (see Fig-ure 13, right). Here, avoiding a negative tolerance of the bot-tom sheet, lubrication or lubricant residues on the friction pairings sheet/sheet and die/sheet will lead to less scatter of the interlock. Thus, a robust process can be ensured.
As the sensitivity analysis already indicates, both objectives are affected contrarily by the relevant parameters. Thus, for example, an avoidance of critical values concerning the inter-lock by ordering exclusively plus-tolerated die-side sheets in-creases compounds with a low neck thickness. Such changes in the production process are very costly and should be evalu-ated critically. The analysis of the process robustness allows, however, to gain knowledge about critical parameters and parameter combinations that can be utilized as a basis, for example, to implement a selective control of the relevant pa-rameters as a quality assessment in the development process.
Summary and OutlookA process chain, being increasingly numerical, especially in the automotive production, requires a profound under-standing of the joining processes to improve quality stan-dards and to explore cost saving potential. So far, the various capabilities and applications of FE simulation for sensitivity analysis, robustness evaluation and optimization have not been considered much in the mechanical joining technique.The performed sensitivity and robustness analysis for clinching indicates the potential of the numerically based analysis of clinching processes. From a variety of para-
meters that affect the joining process, in such studies, the relevant impact parameters are filtered and being provi-ded either for process optimization or an evaluation of the process robustness. The so obtained process knowledge exceeds the previously, often experimentally-generated, understanding and correlation studies. The possibility to assess parameters to such a complex extent and number, never been reached in experiments before, allows to obtain new insights and to find global and general correlations.
Based on these initial studies for clinching, further analy-sis will be conducted on other frequently used mechanical joining methods. The main focus of further research in the automotive industry is on the increasingly used self-pierce riveting technique. The challenges will be the numerical de-scription of the material separation, the expansion of com-puting stability and accuracy. As demonstrated in the sen-sitivity analysis for clinching, mechanical and technological characteristics of the materials, as well as the frictional conditions, are the basic data of the simulation represent-ing the fundamental basis for a realistic numerical analy-sis. When this data is available, the CAE-based sensitivity analysis and robustness evaluation of joining processes will be a key source of information for method comparison and selection of appropriate joining technologies.
author // Markus Israel (Fraunhofer Institute for Machine Tools and Forming Technology IWU)Source // www.dynardo.de/bibliothek
Fig. 14: Relevant influencing variables on the interlock

RDO-JOuRnaL // 01/2013 2524
Mechanical Engineering Mechanical Engineering
Sensitivity analysisDefining 14 design parameters (see figure 3 top) with up-per and lower bounds, as given in this table, and the per-formance-relevant responses, the sensitivity analysis is performed using a latin hypercube sampling in three steps to explore the total design space as thoroughly as possible. An extrapolation of the design parameter’s bounds can be used in every step to extend the optimization potential. But of course, as a consequence, this results in more samples which are located in the unfeasible design space, as seen in the lower portion of figure 3.
The modification of the parameter bounds is simply based on an extrapolation of the so called Metamodels of Optimal Prognosis (MOP). For example, in case of the violation of the maximal longitudinal center position, the assigned control
Fig. 1: Ship hull shown in FRIENDSHIP-Framework
parameter of the hull’s center of buoyancy can be enhanced up to 0.01 (see figure 4).
For each new design a CFD analysis is triggered using SHIP-FLOW. As a result, the response values of the Table 1 are re-turned and used for setting up an objective function:
OptimizationThe constrains, as shown in Table 1, have to be checked dur-ing the optimization process to ensure the hard point checks in y- and z-direction, the maximal longitudinal center posi-tion and the characteristic stability of the hull. The surrogate model of the objective function Rt, as shown in Figure 5, is
Parameter Description
Design parameters and random variables
Bulb Full-ness
Global fullness of the bulb geometry i.e. smooth changes to the bulb’s width
Bulb Tip DX Longitudinal position of the bulb tip
Bulb Tip DZ vertical position of the bulb tip
Delta CPPercental change of the prismatic coefficient that allows smoothly increasing or decreasing the hull’s displacement v
Delta XCBChange of the longitudinal position of the hull’s center of buoyancy
Mid TanAdditional control of Generalized Lackenby Transformation, controls the middle tangent of the displacement shift function
X MidAdditional control of Generalized Lackenby Trans-formation, controls the longitudinal mid position of the displacement shift function
Transom DZvertical shift of the transom’s lower edge in z-direction
Transom DYWidth of the transom, i.e. transom shift in y-direction, 5 additional variables for the skeg part for smoothly shifting the geometry in y-direction
Random variables
Sref Wetted surface at zero speed
dens Water density
visc Water kinetic viscosity
Lpp Length between perpendiculars
Re Reynolds Number
Response values and objectives
CWTWCWave resistance coefficient from transverse wave cut
CWWave resistance coefficient from pressure integra-tion
CF Frictional resistance coefficient
Constraints
hpCheckYHard points check in y-direction (HP: positions that are required to be strictly within the hull)
hpCheckZ Hard points check in z-direction
maxDXCBMaximum percental change allowed for longitudi-nal position of the hull’s center of buoyancy
minDISP: Minimum displacement for modified hull shape
minKMMinimum KM-value for modified hull shape (KM: characteristic stability value of the hull)
Fig. 2: Upwards deformation of the bulb using a shift transformation that is controlled
by a user-defined function curve.
Fig. 4: Extrapolation of the design parameters to make accessible optimization potential
Fig. 3: Lower and upper bounds to define the box constrains used within optimization
Table 1: Design parameters and random variables
Fig. 5: Surrogate model of the objective function Rt, approximated as meta-model of
optimal prognosis in the subspace of the both most important design variables.

w E L c O M E T O T h E
annuaL wEiMaR OPTiMizaTiOn anD STOchaSTic DaySDynardo’s conference for caE-based parametric optimization, stochastic analysis and Robust Design Optimization (RDO) in virtual product development.
or participants, we also offer everyone who is interested in the topic a platform of exchange with acknowledged spe-cialists from science and industry. You will find more infor-mation and current dates at www.dynardo.de/en/wosd.
We are looking forward to welcoming you to the next Wei-mar Optimization and Stochastic Days.
Our annual conference aims at promoting the successful application of parametric optimization and CAE-based sto-chastic analysis in virtual product design. The conference of-fers focused information and training in practical seminars and interdisciplinary lectures. Users can talk about their experiences in parametric optimization, service providers present their new developments and scientific research in-stitutions inform about state-of-the-art RDO methodology. We explicitly do not only invite optiSLang users as lecturers
26
Mechanical Engineering
approximated as meta-model of optimal prognosis based on 312 design evaluations of a latin hypercube sampling. This meta-model is used for pre-optimization in the total dimensional design space using an evolutionary algorithm. The resulting best design is used as a starting point for a gradient-based optimization using a sequential quadratic programming algorithm with additional 192 design evalua-tions. Table 2 collect the results of these optimization steps.
Robustness evaluationIn engineering problems, randomness and uncertainties are inherent and may be involved in several stages, for ex-ample in the ship design with material parameters and in the manufacturing process and environment. To evaluate the mean design improvements, their possible deviations
Response value Initial design Sensitivity analysisEvolutionary optimization
Sequential quadratic programming
CWTWC [×10-4] 2.27 1.02 0.766 0.666
CF [×10-3] 1.44 1.43 1.42 1.42
Design evaluations 1 312 1 192
Table 2: Results of the ship design optimization with 506 design evaluations, in summary.
and the estimated exeedence probabilities, a robustness analysis is carried out. The histograms of the objective terms as result of the 120 design evaluations show a signifi-cant improvement of the weighted objective function with large exeedance probabilities (92% and 95%) in compari-son with the initial values of CWTWC and CF. Besides the small mean value shift of the optimized CWTWC value, the given distributions show a robust design improvement of the wave resistance coefficient and the frictional resistance coefficient of the hull shape.
authors // Stefan Harries, Jörg Palluch (FRIENDSHIP SYSTEMS GmbH) / Dirk Roos (Niederrhein University of Applied Sciences) Source // www.dynardo.de/bibliothek
Fig. 6: Histograms of the objective terms as result of the robustness analysis.