Embed Size (px)
Citation preview
Optimization and Analysis of Power-To-Gas Technology [email protected]
Instituto Superior Tecnico, Universidade de Lisboa, Portugal
December 2017
AbstractIn order to support the R&D activities in the field of power-to-gas, Fraunhofer ISE is developing a power-
to-gas system simulator in the software environment (MATLAB, Simulink,Stateflow). The simulator en-
ables stationary and dynamic system simulations based upon empirical characteristics as well as mass
and energy balances of the most important components. In addition, a genetic optimization method has
already been tested for the optimized dimensioning of central system components and control variables
of the operation management or deployment strategy. Within the framework of the power-to-gas concept,
the hydrogen pathway is considered while investigating PEM as electrolysis variant in the framework of
Germany’s energy system transition. With regard to the configuration of such systems, various scenar-
ios are conceivable. Depending on the power source and the end application, they primarily differ in
storage and distribution of the produced hydrogen. Taking into account the integration of such systems
into inter-sectoral energy conversion chains, especially the integration of large amounts of wind energy
makes up a challenging task. On the other site, building up a hydrogen supply infrastructure under cur-
rent legal conditions and technology status is not challenging less. In order to improve the understanding
of such systems under the constraints of integration possibilities into Germany’s energy system, the aim
of this thesis is to carry out diverse system simulations and optimizations for representative sites and
chosen scenarios of dynamic operation with mainly wind energy.
1 Introduction
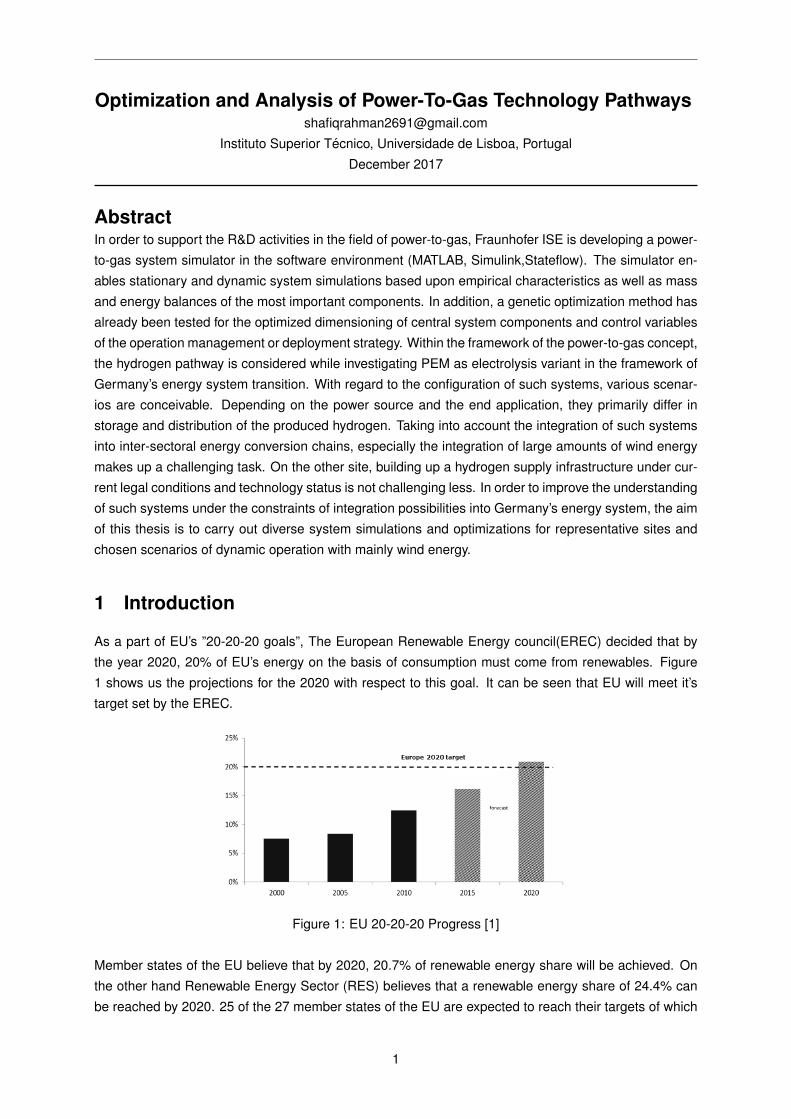
As a part of EU’s ”20-20-20 goals”, The European Renewable Energy council(EREC) decided that by
the year 2020, 20% of EU’s energy on the basis of consumption must come from renewables. Figure
1 shows us the projections for the 2020 with respect to this goal. It can be seen that EU will meet it’s
target set by the EREC.
Figure 1: EU 20-20-20 Progress [1]
Member states of the EU believe that by 2020, 20.7% of renewable energy share will be achieved. On
the other hand Renewable Energy Sector (RES) believes that a renewable energy share of 24.4% can
be reached by 2020. 25 of the 27 member states of the EU are expected to reach their targets of which
1

16 member states are advancing in the direction that would help them surpass their targets. Also the
member states predict that 11.27% of diesel and gasoline consumption in 2020 will be the share of
renewables in transport sector.
With increasing share of renwables, namely solar and wind in the grid, more erratic patterns of power
production can be observed. This is due to the nature of renewable energy technolgies and emphasis
the need for more reliable and high capacity energy storage technologies which ensure an energy supply
throughout the year. There are various methods of energy storage. These methods are characterised
by factors such a energy density, efficiency, location and or costs [5]. Chemical energy storage through
batteries, mechanical energy storage techniques like pumped hydro storage(PHS), compressed air en-
ergy storage (CAES) and thermal energy storage (TES) like sensible TES, chemical TES, etc. are some
methods. Each have their advantages and disadvantages.
Power to gas (P2G) provides a very dynamic storage option, where the conventional storage options
are not feasible or not enough. The main focus of this thesis is identifying suitable pathways depending
upon the end usage and simulating real life scenarios for a year. At the end of the simulation, the LCOE
of the pathway is determined and together with parameters like investment cost of the electrolysers
and other components, impact of duties and taxes, lifetime of components, etc. gives a picture of how
economically viable the pathway can be.
2 Basics of Electrolysis
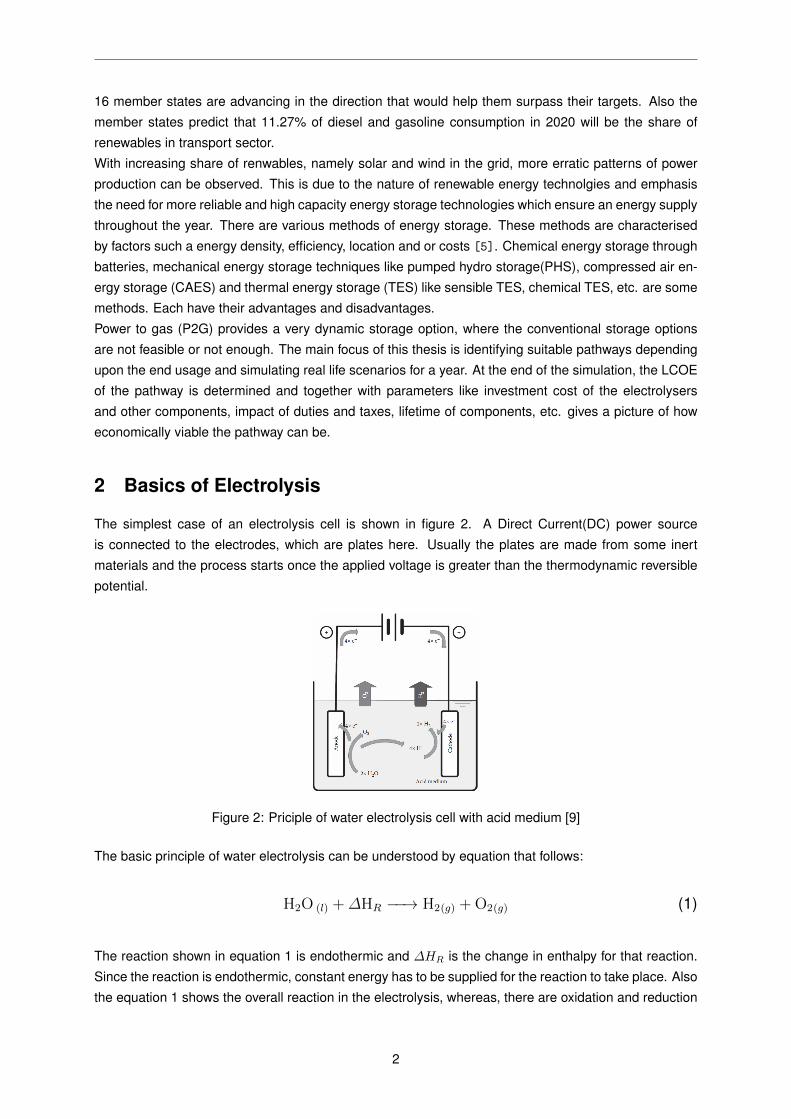
The simplest case of an electrolysis cell is shown in figure 2. A Direct Current(DC) power source
is connected to the electrodes, which are plates here. Usually the plates are made from some inert
materials and the process starts once the applied voltage is greater than the thermodynamic reversible
potential.
Figure 2: Priciple of water electrolysis cell with acid medium [9]
The basic principle of water electrolysis can be understood by equation that follows:
H2O (l) +∆HR −−→ H2(g) +O2(g) (1)
The reaction shown in equation 1 is endothermic and ∆HR is the change in enthalpy for that reaction.
Since the reaction is endothermic, constant energy has to be supplied for the reaction to take place. Also
the equation 1 shows the overall reaction in the electrolysis, whereas, there are oxidation and reduction
2

reactions going on at the anode and cathode respectively. The electrochemical half reactions are shown
below:
H2O (l) −−→1
2O2(g) + 2H+ + 2 e− (2)
2H + + 2 e − −−→ H2(g) (3)
Acid medium(electrolyte) is used for the process due to the limited self-ionization potential of water.
Also, since the ∆HR for the reaction is negative(endothermic), a voltage greater than the thermoneutral
voltage has to be supplied to operate a PEM electrolytic cell.
At the anode, the water is oxidised to produce oxygen, 2 protons and 2 electrons (equation 2). The
electrons produced, migrate to the cathode via the external connection. The protons produced move
through the electrolyte towards the cathode where it combines with the electrons from the external
circuit to form hydrogen gas.
This process is clean, simple and easy to maintain. 99.999 % pure by volume hydrogen is obtained by
this process [4]. The efficiency of the process is estimated to be around 70 % [4].
2.1 Proton Exchange Membrane(PEM) water electrolysis
The Proton Exchange Membrane(PEM) technology is based on a solid polymer electrolyte instead of
a liquid electrolyte. This electrolyte separates the two half cells and is called the Proton Exchange
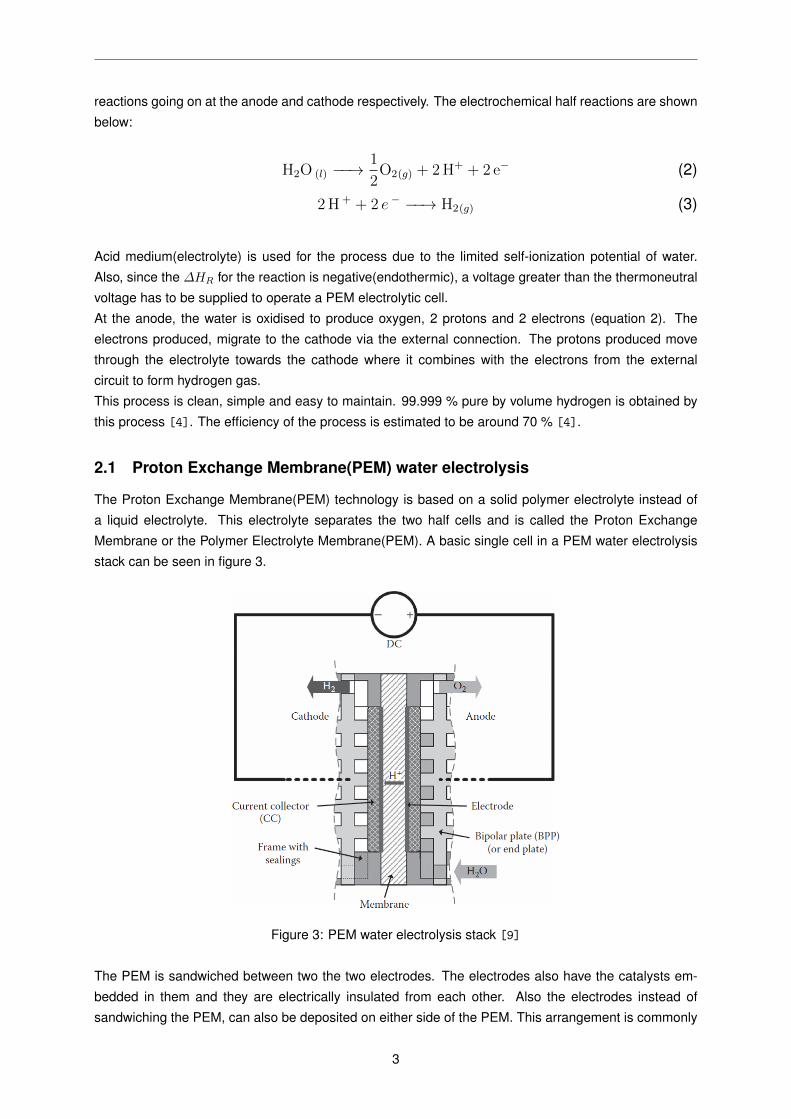
Membrane or the Polymer Electrolyte Membrane(PEM). A basic single cell in a PEM water electrolysis
stack can be seen in figure 3.
Figure 3: PEM water electrolysis stack [9]
The PEM is sandwiched between two the two electrodes. The electrodes also have the catalysts em-
bedded in them and they are electrically insulated from each other. Also the electrodes instead of
sandwiching the PEM, can also be deposited on either side of the PEM. This arrangement is commonly
3

referred to as the Membrane Electrode Assembly (MEA). The bipolar plate or end plate provides a path
for current to flow to the electrodes. The water is fed from the anode side and the H+ ions produced
travel through the polymer membrane to the cathode side. There is combines with electrons to produced
hydrogen gas. The electrochemical half reactions are as follows:-
Cathode
2H+ + 2 e− −−→ H2(g) (4)
Anode
H2O −−→1
2O2(g) + 2H+ + 2 e− (5)
Overall
H2O −−→ H2(g) +1
2O2(g) (6)
This design offers very good advantages over conventional designs. Some of them are as follows:-
• The main input apart from electricity is just pure water. This facilitates in maintaining a very simple
design for the cell.
• The response time of the system is very high due to the compact size/design and its kinetic. This is
a very important factor while considering the fact that this system will be interaction with renewable
sources of energy whose output is very dynamic.
• The thin PEM layer is a shorter proton transfer path. This reduces the overall ohmic losses.
• The electro-catalysts have high efficiency and quick kinetics. This is because they are made from
platinum group metals.
• The membrane helps to provide high gas tightness.
Similar to an alkaline water electrolysis cell, the cells are connected in parallel to for a stack. Higher
hydrogen production rates can be achieved by this. The bipolar plates (BPP) separate adjacent cells.
Thus the BPP acts as the cathode for one cell as well as the anode for the adjacent cell.
3 Operation of PEM system
Availability of water at the electrode and a cell voltage higher than thermoneutral cell voltage at ambi-
ent temperature are the conditions that are necessary to operate a PEM electrolyser at atmospheric
conditions. As most of the applications calls for hydrogen at pressure, electrolysers are operated under
pressure. This also eliminates the necessity of a compressor to provide hydrogen at higher pressures.
There are three common ways of PEM operations. They are listed below:-
• Differential or balanced pressure operation.
• Anode or cathode water feed operation.
• Thermal management by circulation of water at anode and cathode.
4
Each of these operation method calls for some changes in stack design for optimization. For example,
for differential pressure type of operation, the hydrogen side works under high pressure. The oxygen
side is slightly pressurised or not pressurised at all. So in this case, stacks have to be designed to with-
stand the pressure difference. In case of a balanced pressure operation, both the anode and cathode
sides are operated under the same pressure.
In a water feed opertation, water can be fed on either cathode or anode side. As shown in figure 3,
most of the PEM electrolysers are operated with anode water feed. Cathode water feed are also used
in some special applications. Since water is consumed in the anode and not in the cathode, water has
to move from the cathode to anode. This is a limitation which finally leads to a larger cell for same rates
of hydrogen production [9].
Thermal management is realised by a dedicated circulation system with circulation pump, heat ex-
changer, gas/water separator and water supply.
4 Power to Gas
After a brief introduction into the dynamics of a PEM electroysis system and it’s working, it is important
to know where the PEM system stands with respect to the bigger scenario. Power to Gas (P2G)is a
methodology that converts power to gaseous fuel [2]. This enables the intermittent production of energy
by renewables to be evened out throughout the year by providing them a controllable power load and
hence enabling them to have a bigger energy share. Also, de-carbonisation of gas sector, mobility sector
and industrial sector is helped as renewable power is converted into a natural gas substitute. Based on
what can be accomplished using P2G methodology, a large number of scenarios and pathways are
possible. The next section looks further into the scenarios.
4.1 Path 1
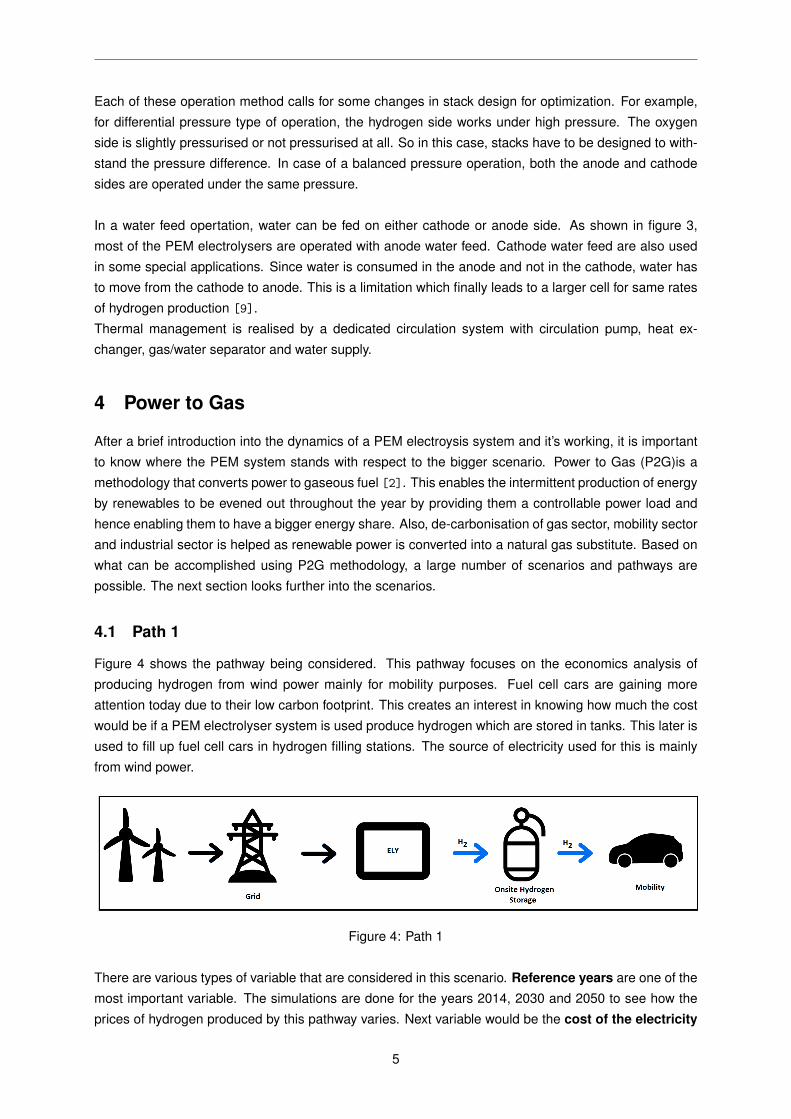
Figure 4 shows the pathway being considered. This pathway focuses on the economics analysis of
producing hydrogen from wind power mainly for mobility purposes. Fuel cell cars are gaining more
attention today due to their low carbon footprint. This creates an interest in knowing how much the cost
would be if a PEM electrolyser system is used produce hydrogen which are stored in tanks. This later is
used to fill up fuel cell cars in hydrogen filling stations. The source of electricity used for this is mainly
from wind power.
Figure 4: Path 1
There are various types of variable that are considered in this scenario. Reference years are one of the
most important variable. The simulations are done for the years 2014, 2030 and 2050 to see how the
prices of hydrogen produced by this pathway varies. Next variable would be the cost of the electricity
5
that is used in the electrolyser for the production of hydrogen. The German Renewable Energy sources
Act (Erneuerbare-Energien-Gesetz or EEG in german) was implemented to encourage production of
energy from renewable resources. The EEG amounts to 62.4 e/MWh. This represents the full taxes
scenario. A concession is given for consumption above 1GWh. Above 1GWh, the EEG is 1 e/MWh.
This corresponds to the scenarios where the taxes are reduced.The pathway has various scenarios
based on the variables for that specific pathway. This results in a scenario matrix that will tell us the
combinations of variables that have been considered for each path way.
4.2 Path 2
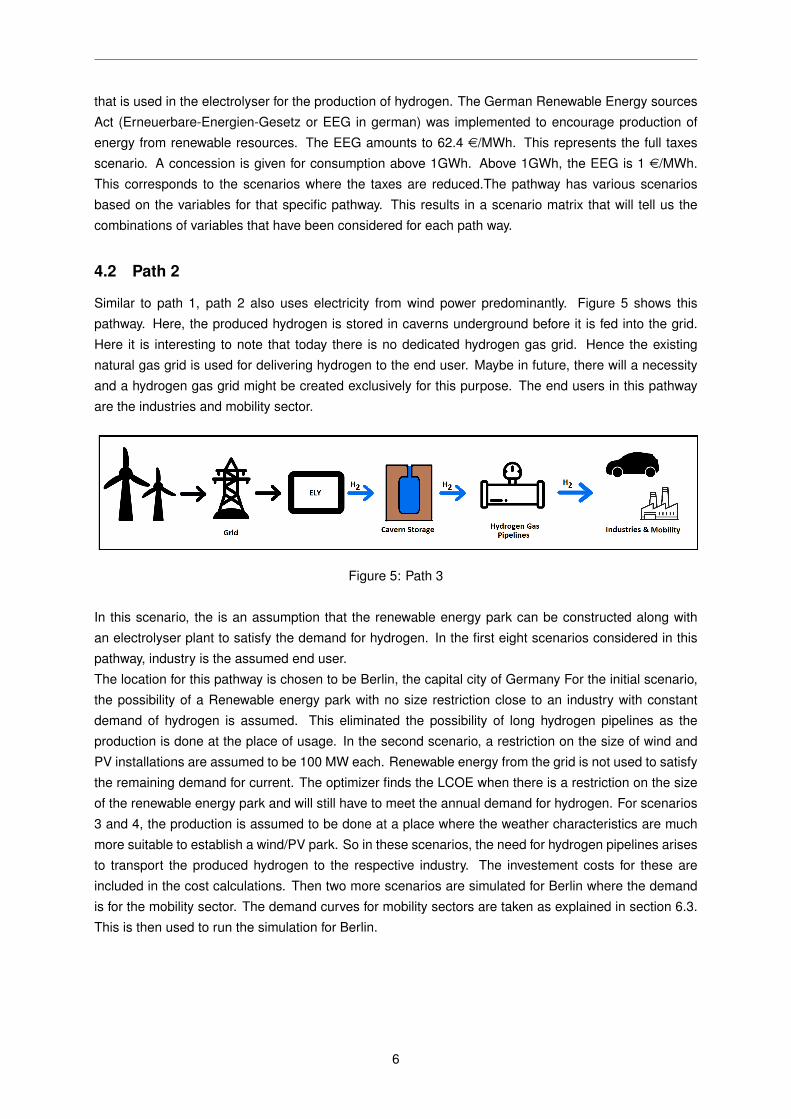
Similar to path 1, path 2 also uses electricity from wind power predominantly. Figure 5 shows this
pathway. Here, the produced hydrogen is stored in caverns underground before it is fed into the grid.
Here it is interesting to note that today there is no dedicated hydrogen gas grid. Hence the existing
natural gas grid is used for delivering hydrogen to the end user. Maybe in future, there will a necessity
and a hydrogen gas grid might be created exclusively for this purpose. The end users in this pathway
are the industries and mobility sector.
Figure 5: Path 3
In this scenario, the is an assumption that the renewable energy park can be constructed along with
an electrolyser plant to satisfy the demand for hydrogen. In the first eight scenarios considered in this
pathway, industry is the assumed end user.
The location for this pathway is chosen to be Berlin, the capital city of Germany For the initial scenario,
the possibility of a Renewable energy park with no size restriction close to an industry with constant
demand of hydrogen is assumed. This eliminated the possibility of long hydrogen pipelines as the
production is done at the place of usage. In the second scenario, a restriction on the size of wind and
PV installations are assumed to be 100 MW each. Renewable energy from the grid is not used to satisfy
the remaining demand for current. The optimizer finds the LCOE when there is a restriction on the size
of the renewable energy park and will still have to meet the annual demand for hydrogen. For scenarios
3 and 4, the production is assumed to be done at a place where the weather characteristics are much
more suitable to establish a wind/PV park. So in these scenarios, the need for hydrogen pipelines arises
to transport the produced hydrogen to the respective industry. The investement costs for these are
included in the cost calculations. Then two more scenarios are simulated for Berlin where the demand
is for the mobility sector. The demand curves for mobility sectors are taken as explained in section 6.3.
This is then used to run the simulation for Berlin.
6

5 Simulation Methodology
Simulation is defined as the imitation of the operation of a real-world process or system over time [7].
One of the most important part in a simulation is giving the simulator inputs that represent the real life
scenario as close as possible. The other important aspect is choosing the type of simulation. The basic
types of simulation are as follows :-
• Static or Dynamic
• Deterministic or Stochastic and
• Discrete or continuous
MATLAB is used to compute and analyse these kinds of models in a numerical environment. Calcula-
tions and visualiasations can be done in MATLAB. It is widely used in fields of engineering and mathe-
matics. MATLAB has other toolboxes/packages that makes its use much easier. StateFlow and Simulink
are such packages that allow the usage of graphical tools. Stateflow (developed by MathWorks) is a
control logic tool used to model reactive systems via state machines and flow charts within a Simulink
model [8]. Simulink provides a graphical programming environment for modelling and simulating dy-
namical system. All these together eliminates the necessity of text oriented programming. Also a parallel
computing toolbox is used in the simulations here. This allows the usage of all available cores in the
server to do the optimization simultaneously.
5.1 Key Performance Indicators
One of the primary grounds for comparision of the results from various scenarios are the LCOE. This
gives us an exact picture of how much per the end user must pay for a unit of energy produced in the
pathway.
For the first pathway, the Price Signal (PS) and Price Cap (PC) are chosen as one of the KPIs. This
directly reflects on the operation strategy of the system in the scenario. For example, if the PS and PC
are the same value, then this indicates that the system basically follows an on and off opeation. The
size of the reservoir (speicher) in m3 is also provides us with some useful information.
Then the full load hours (VLS) of the system is another KPI as this gives us information on the loading
of the electrolyser. The number of complete cycles that the reservoir/storage is used for also gives us
an insight into how the system has been working. More the storage cycle, more the reservoir is being
used to meet the demand. The Windshare (windanteil) and Greenshare(Grunanteil) are the other
parameters that tell us how much of the produced hydrogen is from electricity produced by wind energy
and renewable energy respectively. This basically gives us the information on what type of current is
used. The greenshare includes electricity from all renewable sources such as wind turbines, PV plants,
hydropower, etc. The windshare considers only the electricity from wind power. For the path two, where
the power is supplied only from the wind and PV plants, it is interesting to know the LCOE of these
components (wind and PV). This gives us an insight into the current production costs. For this the
respective LCOEs are calculated. Also to analyse the path 2 information on the electricity being used
is useful. For this purpose two other KPIs are used. The Windusage gives data on how much of wind
energy is used for the production of hydrogen. Similarly, the PVusage usage gives us information on how
much of the usage is from PV.
7

6 Optimization Variables
The optimization is carried out with the optimization tool box in MATLAB. Various inputs have to con-
sidered and this section deals with the inputs and other variables that have been considered in the
simulation. Some of the variables are discussed:-
6.1 Investment
The accuracy of investment costs taken for different parts of the electrolyser greatly affects the LCOE.
Different sources are used to find and decide the investment costs of various parts as accurately as
possible.
6.1.1 Electrolyser
The investment cost of electrolyser is based on the size of the electrolyser. Not much data is available in
this area. Fraunhofer 1 has data regarding the cost of electrolyser and it’s size. Based on these values a
graph is plotted. Using the plotted points, a power function trend line is created. Based on this function
a lookup table is created in simulink model which will choose the investment cost based on the size of
the electrolyser deemed suitable by the optimiser. The same procedure is adopted for the other years,
2030 and 2050 to be specific. Similarly investment costs for other components are calculated.
6.2 Economic Feasibility
Projects usually involved in production of energy is compared using their LCOEs. LCOE stands for
Levelised Cost of Energy. It is nothing but the cost to produce one unit of energy. It is more suitable to
use this method as most of the energy projects have their LCOEs calculated and calculating the same for
hydrogen production in P2G pathways will give us a good platform to compare. The LCOE is calculated
using the equation 7.
LCOE =I0 +
∑nt=1
At
(1+i)t∑n
t=1Wt
(1+i)t
(7)
Where,
LCOE is the Levelised Cost of Energy in e/kWh
I0 is the investment expenditures in e,
At is the expenditure in the year t in e,
Wt Annual Energy Production in kWh,
i is the calculating interest rate,
t is the respective year of operation.
1Based on internal communication with project partners
8

6.3 Gas Demand
6.3.1 Path 1
The size of the filling station determines the gas requirements. The size is determined by the project.
It is decided that it will be a large size refilling station. An average of 700 kg of hydrogen per day and
a maximum of 1000 kg per day is the demand for the decided size of the refuelling station [3]. Now a
demand profile for this hydrogen is necessary. As reference, the demand profiles of gasoline and diesel
was taken. This is under the assumption that hydrogen replenishment need will be the same as that of
gasoline and diesel. Monthly consumption of of gasoline and diesel was detemined based on the data
available from the Mineral Oil assosication [6].
6.3.2 Path 2
The gas demand for the second path is primarily for an industry. Based on projects such as Chem-
coast and HYPOS, a cavern size of 500,000 m3 and a electrolyser of size 1GW seemed to be a good
estimation [?]. Assuming full load hour of 2000 hours, we get a demand of 450 x 106 Nm3 annually.
Wind Share(Windanteil) and Green Share(Grunanteil) are also inputs to the simulation. These are the
parameters that give the share of renwables in the produced current. Wind Share gives the share of
power generated from wind energy in the grid and for the green share, wind turbines, hydro power oper-
ators and photovoltaic plant operators are combined together.
Ambient temperature and soil temperature data from Hamburg-Neuwiedenthal is also an input.The
reference year for this data is 2014. The data is sampled for intervals of 5 minutes. Also, soil tem-
peratures at a depth of 0.5 m were taken at the same location. These values are obtained from the
Fraunhofer ISE internal data collection. Also for the second pathway, the weather data, that is, the
ambient air temperature for the locations considered is collected from the online data base from the
Deutscher Wetterdienst [10].
7 Conclusion and Outlook
It is clear that the taxes are the biggest impact and this can be seen not only in the year 2014 but also
for the simulated results for the years 2030 and 2050. This clearly puts a perspective on what can be
done by the government in the field of P2G. Investment costs operating costs and other factors all do
can contribute to reducing the LCOE but these are based on how much scientific advancements can
be made in future. There is a certain degree of uncertainty there. But with respect to taxes, it can be
clearly seen that if the predicted pattern of power production and renewable penetration continues, then
the government policy changes can produce the biggest impact in reducing the costs at which hydrogen
can be produced and offered.
For the accuracy of the results, real life scenario has be depicted as much as possible by using a
variety of inputs. Also, during the course of this thesis, some assumptions have been made to make
the computation as fast as possible. This gives us a picture close to how things would happen real life.
There are other improvements that can be done to improve the accuracy of the results.For example a
simple electrolyser has been considered for both the pathways. There are different types of electrolysers
that can be used. For example, model of the electrolyser are based on a standard system. These
9

systems do not operate under overload conditions the rate of hydrogen production is not the best in the
market.Simulations can also be done in order to find out which system would be suitable.
Also, the wind to PV ratio was always maintained at 1:1 for the second path. This is based on the
assumption that the site chosen is equally good for wind and PV. In reality there might be places that are
more suitable for wind and less suitable for PV or the other way around. So the simulation can be done
allowing the optimization to find a suitable ratio between wind and PV investment. This will take longer
computational times, but will give results that are worth understanding.All these above suggestion are
meant to provide an outlook into what can be done further to understand better the possibility of P2G
pathways being the backbone of mobility sector and possibly for industries.
References
[1] European 20-20-20 targets, 2014.
[2] Dr. U. Bnger, H. Landinger, E. Pschorr-Schoberer, P. Schmidt, W. Weindorf (LBST), J. Jhrens,
U. Lambrecht (ifeu), K. Naumann (dbfz), and A. Lischke (DLR). Power-to-gas (ptg) in transport
status quo and perspectives for development. 2014.
[3] NATIONALE ORGANISATION WASSERSTOFF UND BRENNSTOFFZELLENTECHNOLOGIE.
70mpa hydrogen refuelling station standardization - functional description of station modules.
[4] Fatima ezzahra Chakika, MohammedKaddamia, and MohammedMikoub. Effect of operating pa-
rameters on hydrogen production by electrolysis of water. International Journal of Hydrogen En-
ergy, 2017.
[5] Sameer Hameer and Johannes L. Van Niekerk. A review of large-scale electrical energy storage.
International Journal of Energy Research, 2015.
[6] MINERALOLWIRTSCHAFTSVERBAND E.V.: Jahresbericht. Url: https://www.mwv.de/wp-
content/uploads/2016/06/mwv-publikationen-jahresbericht-2016.pdf. 2016.
[7] John S. Carsonn II Jerry Banks, Barry L. Nelson, and David M. Nicol. Discrete-Event System
Simulation. Prentice Hall.
[8] Mathworks. https://nl.mathworks.com/products/stateflow.html.
[9] Tom Smolinka, Emile Tabu Ojong, and Thomas Lickert. PEM Electrolysis for Hydrogen Production
Principles and Applications, chapter 2 - Fundamentals of PEM Water Electrolysis. Taylor & Francis
Group, LLC, 2016.
[10] DWD Deutscher Wetterdienst. ftp://ftp-cdc.dwd.de/pub//.
10
Optimization and Analysis of Power-To-Gas Technology Pathways
Shafiq Rahman Thottiyil Habeebu - Instituto Superior Tecnico
Prof. Jose Maria Campos da Silva Andre - University of Lisbon Mechanical Engineering Departament
M.Sc. Nikolai Wiebe - Fraunhofer ISE
AbstractIn order to support the R&D activities in the field of power-to-gas, Fraunhofer ISE is developing a power-
to-gas system simulator in the software environment (MATLAB, Simulink,Stateflow). The simulator en-
ables stationary and dynamic system simulations based upon empirical characteristics as well as mass
and energy balances of the most important components. In addition, a genetic optimization method has
already been tested for the optimized dimensioning of central system components and control variables
of the operation management or deployment strategy. Within the framework of the power-to-gas concept,
the hydrogen pathway is considered while investigating PEM as electrolysis variant in the framework of
Germany’s energy system transition. With regard to the configuration of such systems, various scenar-
ios are conceivable. Depending on the power source and the end application, they primarily differ in
storage and distribution of the produced hydrogen. Taking into account the integration of such systems
into inter-sectoral energy conversion chains, especially the integration of large amounts of wind energy
makes up a challenging task. On the other site, building up a hydrogen supply infrastructure under cur-
rent legal conditions and technology status is not challenging less. In order to improve the understanding
of such systems under the constraints of integration possibilities into Germany’s energy system, the aim
of this thesis is to carry out diverse system simulations and optimizations for representative sites and
chosen scenarios of dynamic operation with mainly wind energy.
1 Introduction
As a part of EU’s ”20-20-20 goals”, The European Renewable Energy council(EREC) decided that by
the year 2020, 20% of EU’s energy on the basis of consumption must come from renewables. Figure
1 shows us the projections for the 2020 with respect to this goal. It can be seen that EU will meet it’s
target set by the EREC.
Figure 1: EU 20-20-20 Progress [1]
Member states of the EU believe that by 2020, 20.7% of renewable energy share will be achieved. On
the other hand Renewable Energy Sector (RES) believes that a renewable energy share of 24.4% can
be reached by 2020. 25 of the 27 member states of the EU are expected to reach their targets of which
1
16 member states are advancing in the direction that would help them surpass their targets. Also the
member states predict that 11.27% of diesel and gasoline consumption in 2020 will be the share of
renewables in transport sector.
With increasing share of renwables, namely solar and wind in the grid, more erratic patterns of power
production can be observed. This is due to the nature of renewable energy technolgies and emphasis
the need for more reliable and high capacity energy storage technologies which ensure an energy supply
throughout the year. There are various methods of energy storage. These methods are characterised
by factors such a energy density, efficiency, location and or costs [5]. Chemical energy storage through
batteries, mechanical energy storage techniques like pumped hydro storage(PHS), compressed air en-
ergy storage (CAES) and thermal energy storage (TES) like sensible TES, chemical TES, etc. are some
methods. Each have their advantages and disadvantages.
Power to gas (P2G) provides a very dynamic storage option, where the conventional storage options
are not feasible or not enough. The main focus of this thesis is identifying suitable pathways depending
upon the end usage and simulating real life scenarios for a year. At the end of the simulation, the LCOE
of the pathway is determined and together with parameters like investment cost of the electrolysers
and other components, impact of duties and taxes, lifetime of components, etc. gives a picture of how
economically viable the pathway can be.
2 Basics of Electrolysis
The simplest case of an electrolysis cell is shown in figure 2. A Direct Current(DC) power source
is connected to the electrodes, which are plates here. Usually the plates are made from some inert
materials and the process starts once the applied voltage is greater than the thermodynamic reversible
potential.
Figure 2: Priciple of water electrolysis cell with acid medium [9]
The basic principle of water electrolysis can be understood by equation that follows:
H2O (l) +∆HR −−→ H2(g) +O2(g) (1)
The reaction shown in equation 1 is endothermic and ∆HR is the change in enthalpy for that reaction.
Since the reaction is endothermic, constant energy has to be supplied for the reaction to take place. Also
the equation 1 shows the overall reaction in the electrolysis, whereas, there are oxidation and reduction
2
reactions going on at the anode and cathode respectively. The electrochemical half reactions are shown
below:
H2O (l) −−→1
2O2(g) + 2H+ + 2 e− (2)
2H + + 2 e − −−→ H2(g) (3)
Acid medium(electrolyte) is used for the process due to the limited self-ionization potential of water.
Also, since the ∆HR for the reaction is negative(endothermic), a voltage greater than the thermoneutral
voltage has to be supplied to operate a PEM electrolytic cell.
At the anode, the water is oxidised to produce oxygen, 2 protons and 2 electrons (equation 2). The
electrons produced, migrate to the cathode via the external connection. The protons produced move
through the electrolyte towards the cathode where it combines with the electrons from the external
circuit to form hydrogen gas.
This process is clean, simple and easy to maintain. 99.999 % pure by volume hydrogen is obtained by
this process [4]. The efficiency of the process is estimated to be around 70 % [4].
2.1 Proton Exchange Membrane(PEM) water electrolysis
The Proton Exchange Membrane(PEM) technology is based on a solid polymer electrolyte instead of
a liquid electrolyte. This electrolyte separates the two half cells and is called the Proton Exchange
Membrane or the Polymer Electrolyte Membrane(PEM). A basic single cell in a PEM water electrolysis
stack can be seen in figure 3.
Figure 3: PEM water electrolysis stack [9]
The PEM is sandwiched between two the two electrodes. The electrodes also have the catalysts em-
bedded in them and they are electrically insulated from each other. Also the electrodes instead of
sandwiching the PEM, can also be deposited on either side of the PEM. This arrangement is commonly
3

referred to as the Membrane Electrode Assembly (MEA). The bipolar plate or end plate provides a path
for current to flow to the electrodes. The water is fed from the anode side and the H+ ions produced
travel through the polymer membrane to the cathode side. There is combines with electrons to produced
hydrogen gas. The electrochemical half reactions are as follows:-
Cathode
2H+ + 2 e− −−→ H2(g) (4)
Anode
H2O −−→1
2O2(g) + 2H+ + 2 e− (5)
Overall
H2O −−→ H2(g) +1
2O2(g) (6)
This design offers very good advantages over conventional designs. Some of them are as follows:-
• The main input apart from electricity is just pure water. This facilitates in maintaining a very simple
design for the cell.
• The response time of the system is very high due to the compact size/design and its kinetic. This is
a very important factor while considering the fact that this system will be interaction with renewable
sources of energy whose output is very dynamic.
• The thin PEM layer is a shorter proton transfer path. This reduces the overall ohmic losses.
• The electro-catalysts have high efficiency and quick kinetics. This is because they are made from
platinum group metals.
• The membrane helps to provide high gas tightness.
Similar to an alkaline water electrolysis cell, the cells are connected in parallel to for a stack. Higher
hydrogen production rates can be achieved by this. The bipolar plates (BPP) separate adjacent cells.
Thus the BPP acts as the cathode for one cell as well as the anode for the adjacent cell.
3 Operation of PEM system
Availability of water at the electrode and a cell voltage higher than thermoneutral cell voltage at ambi-
ent temperature are the conditions that are necessary to operate a PEM electrolyser at atmospheric
conditions. As most of the applications calls for hydrogen at pressure, electrolysers are operated under
pressure. This also eliminates the necessity of a compressor to provide hydrogen at higher pressures.
There are three common ways of PEM operations. They are listed below:-
• Differential or balanced pressure operation.
• Anode or cathode water feed operation.
• Thermal management by circulation of water at anode and cathode.
4

Each of these operation method calls for some changes in stack design for optimization. For example,
for differential pressure type of operation, the hydrogen side works under high pressure. The oxygen
side is slightly pressurised or not pressurised at all. So in this case, stacks have to be designed to with-
stand the pressure difference. In case of a balanced pressure operation, both the anode and cathode
sides are operated under the same pressure.
In a water feed opertation, water can be fed on either cathode or anode side. As shown in figure 3,
most of the PEM electrolysers are operated with anode water feed. Cathode water feed are also used
in some special applications. Since water is consumed in the anode and not in the cathode, water has
to move from the cathode to anode. This is a limitation which finally leads to a larger cell for same rates
of hydrogen production [9].
Thermal management is realised by a dedicated circulation system with circulation pump, heat ex-
changer, gas/water separator and water supply.
4 Power to Gas
After a brief introduction into the dynamics of a PEM electroysis system and it’s working, it is important
to know where the PEM system stands with respect to the bigger scenario. Power to Gas (P2G)is a
methodology that converts power to gaseous fuel [2]. This enables the intermittent production of energy
by renewables to be evened out throughout the year by providing them a controllable power load and
hence enabling them to have a bigger energy share. Also, de-carbonisation of gas sector, mobility sector
and industrial sector is helped as renewable power is converted into a natural gas substitute. Based on
what can be accomplished using P2G methodology, a large number of scenarios and pathways are
possible. The next section looks further into the scenarios.
4.1 Path 1
Figure 4 shows the pathway being considered. This pathway focuses on the economics analysis of
producing hydrogen from wind power mainly for mobility purposes. Fuel cell cars are gaining more
attention today due to their low carbon footprint. This creates an interest in knowing how much the cost
would be if a PEM electrolyser system is used produce hydrogen which are stored in tanks. This later is
used to fill up fuel cell cars in hydrogen filling stations. The source of electricity used for this is mainly
from wind power.
Figure 4: Path 1
There are various types of variable that are considered in this scenario. Reference years are one of the
most important variable. The simulations are done for the years 2014, 2030 and 2050 to see how the
prices of hydrogen produced by this pathway varies. Next variable would be the cost of the electricity
5

that is used in the electrolyser for the production of hydrogen. The German Renewable Energy sources
Act (Erneuerbare-Energien-Gesetz or EEG in german) was implemented to encourage production of
energy from renewable resources. The EEG amounts to 62.4 e/MWh. This represents the full taxes
scenario. A concession is given for consumption above 1GWh. Above 1GWh, the EEG is 1 e/MWh.
This corresponds to the scenarios where the taxes are reduced.The pathway has various scenarios
based on the variables for that specific pathway. This results in a scenario matrix that will tell us the
combinations of variables that have been considered for each path way.
4.2 Path 2
Similar to path 1, path 2 also uses electricity from wind power predominantly. Figure 5 shows this
pathway. Here, the produced hydrogen is stored in caverns underground before it is fed into the grid.
Here it is interesting to note that today there is no dedicated hydrogen gas grid. Hence the existing
natural gas grid is used for delivering hydrogen to the end user. Maybe in future, there will a necessity
and a hydrogen gas grid might be created exclusively for this purpose. The end users in this pathway
are the industries and mobility sector.
Figure 5: Path 3
In this scenario, the is an assumption that the renewable energy park can be constructed along with
an electrolyser plant to satisfy the demand for hydrogen. In the first eight scenarios considered in this
pathway, industry is the assumed end user.
The location for this pathway is chosen to be Berlin, the capital city of Germany For the initial scenario,
the possibility of a Renewable energy park with no size restriction close to an industry with constant
demand of hydrogen is assumed. This eliminated the possibility of long hydrogen pipelines as the
production is done at the place of usage. In the second scenario, a restriction on the size of wind and
PV installations are assumed to be 100 MW each. Renewable energy from the grid is not used to satisfy
the remaining demand for current. The optimizer finds the LCOE when there is a restriction on the size
of the renewable energy park and will still have to meet the annual demand for hydrogen. For scenarios
3 and 4, the production is assumed to be done at a place where the weather characteristics are much
more suitable to establish a wind/PV park. So in these scenarios, the need for hydrogen pipelines arises
to transport the produced hydrogen to the respective industry. The investement costs for these are
included in the cost calculations. Then two more scenarios are simulated for Berlin where the demand
is for the mobility sector. The demand curves for mobility sectors are taken as explained in section 6.3.
This is then used to run the simulation for Berlin.
6
5 Simulation Methodology
Simulation is defined as the imitation of the operation of a real-world process or system over time [7].
One of the most important part in a simulation is giving the simulator inputs that represent the real life
scenario as close as possible. The other important aspect is choosing the type of simulation. The basic
types of simulation are as follows :-
• Static or Dynamic
• Deterministic or Stochastic and
• Discrete or continuous
MATLAB is used to compute and analyse these kinds of models in a numerical environment. Calcula-
tions and visualiasations can be done in MATLAB. It is widely used in fields of engineering and mathe-
matics. MATLAB has other toolboxes/packages that makes its use much easier. StateFlow and Simulink
are such packages that allow the usage of graphical tools. Stateflow (developed by MathWorks) is a
control logic tool used to model reactive systems via state machines and flow charts within a Simulink
model [8]. Simulink provides a graphical programming environment for modelling and simulating dy-
namical system. All these together eliminates the necessity of text oriented programming. Also a parallel
computing toolbox is used in the simulations here. This allows the usage of all available cores in the
server to do the optimization simultaneously.
5.1 Key Performance Indicators
One of the primary grounds for comparision of the results from various scenarios are the LCOE. This
gives us an exact picture of how much per the end user must pay for a unit of energy produced in the
pathway.
For the first pathway, the Price Signal (PS) and Price Cap (PC) are chosen as one of the KPIs. This
directly reflects on the operation strategy of the system in the scenario. For example, if the PS and PC
are the same value, then this indicates that the system basically follows an on and off opeation. The
size of the reservoir (speicher) in m3 is also provides us with some useful information.
Then the full load hours (VLS) of the system is another KPI as this gives us information on the loading
of the electrolyser. The number of complete cycles that the reservoir/storage is used for also gives us
an insight into how the system has been working. More the storage cycle, more the reservoir is being
used to meet the demand. The Windshare (windanteil) and Greenshare(Grunanteil) are the other
parameters that tell us how much of the produced hydrogen is from electricity produced by wind energy
and renewable energy respectively. This basically gives us the information on what type of current is
used. The greenshare includes electricity from all renewable sources such as wind turbines, PV plants,
hydropower, etc. The windshare considers only the electricity from wind power. For the path two, where
the power is supplied only from the wind and PV plants, it is interesting to know the LCOE of these
components (wind and PV). This gives us an insight into the current production costs. For this the
respective LCOEs are calculated. Also to analyse the path 2 information on the electricity being used
is useful. For this purpose two other KPIs are used. The Windusage gives data on how much of wind
energy is used for the production of hydrogen. Similarly, the PVusage usage gives us information on how
much of the usage is from PV.
7
6 Optimization Variables
The optimization is carried out with the optimization tool box in MATLAB. Various inputs have to con-
sidered and this section deals with the inputs and other variables that have been considered in the
simulation. Some of the variables are discussed:-
6.1 Investment
The accuracy of investment costs taken for different parts of the electrolyser greatly affects the LCOE.
Different sources are used to find and decide the investment costs of various parts as accurately as
possible.
6.1.1 Electrolyser
The investment cost of electrolyser is based on the size of the electrolyser. Not much data is available in
this area. Fraunhofer 1 has data regarding the cost of electrolyser and it’s size. Based on these values a
graph is plotted. Using the plotted points, a power function trend line is created. Based on this function
a lookup table is created in simulink model which will choose the investment cost based on the size of
the electrolyser deemed suitable by the optimiser. The same procedure is adopted for the other years,
2030 and 2050 to be specific. Similarly investment costs for other components are calculated.
6.2 Economic Feasibility
Projects usually involved in production of energy is compared using their LCOEs. LCOE stands for
Levelised Cost of Energy. It is nothing but the cost to produce one unit of energy. It is more suitable to
use this method as most of the energy projects have their LCOEs calculated and calculating the same for
hydrogen production in P2G pathways will give us a good platform to compare. The LCOE is calculated
using the equation 7.
LCOE =I0 +
∑nt=1
At
(1+i)t∑n
t=1Wt
(1+i)t
(7)
Where,
LCOE is the Levelised Cost of Energy in e/kWh
I0 is the investment expenditures in e,
At is the expenditure in the year t in e,
Wt Annual Energy Production in kWh,
i is the calculating interest rate,
t is the respective year of operation.
1Based on internal communication with project partners
8

6.3 Gas Demand
6.3.1 Path 1
The size of the filling station determines the gas requirements. The size is determined by the project.
It is decided that it will be a large size refilling station. An average of 700 kg of hydrogen per day and
a maximum of 1000 kg per day is the demand for the decided size of the refuelling station [3]. Now a
demand profile for this hydrogen is necessary. As reference, the demand profiles of gasoline and diesel
was taken. This is under the assumption that hydrogen replenishment need will be the same as that of
gasoline and diesel. Monthly consumption of of gasoline and diesel was detemined based on the data
available from the Mineral Oil assosication [6].
6.3.2 Path 2
The gas demand for the second path is primarily for an industry. Based on projects such as Chem-
coast and HYPOS, a cavern size of 500,000 m3 and a electrolyser of size 1GW seemed to be a good
estimation [?]. Assuming full load hour of 2000 hours, we get a demand of 450 x 106 Nm3 annually.
Wind Share(Windanteil) and Green Share(Grunanteil) are also inputs to the simulation. These are the
parameters that give the share of renwables in the produced current. Wind Share gives the share of
power generated from wind energy in the grid and for the green share, wind turbines, hydro power oper-
ators and photovoltaic plant operators are combined together.
Ambient temperature and soil temperature data from Hamburg-Neuwiedenthal is also an input.The
reference year for this data is 2014. The data is sampled for intervals of 5 minutes. Also, soil tem-
peratures at a depth of 0.5 m were taken at the same location. These values are obtained from the
Fraunhofer ISE internal data collection. Also for the second pathway, the weather data, that is, the
ambient air temperature for the locations considered is collected from the online data base from the
Deutscher Wetterdienst [10].
7 Conclusion and Outlook
It is clear that the taxes are the biggest impact and this can be seen not only in the year 2014 but also
for the simulated results for the years 2030 and 2050. This clearly puts a perspective on what can be
done by the government in the field of P2G. Investment costs operating costs and other factors all do
can contribute to reducing the LCOE but these are based on how much scientific advancements can
be made in future. There is a certain degree of uncertainty there. But with respect to taxes, it can be
clearly seen that if the predicted pattern of power production and renewable penetration continues, then
the government policy changes can produce the biggest impact in reducing the costs at which hydrogen
can be produced and offered.
For the accuracy of the results, real life scenario has be depicted as much as possible by using a
variety of inputs. Also, during the course of this thesis, some assumptions have been made to make
the computation as fast as possible. This gives us a picture close to how things would happen real life.
There are other improvements that can be done to improve the accuracy of the results.For example a
simple electrolyser has been considered for both the pathways. There are different types of electrolysers
that can be used. For example, model of the electrolyser are based on a standard system. These
9

systems do not operate under overload conditions the rate of hydrogen production is not the best in the
market.Simulations can also be done in order to find out which system would be suitable.
Also, the wind to PV ratio was always maintained at 1:1 for the second path. This is based on the
assumption that the site chosen is equally good for wind and PV. In reality there might be places that are
more suitable for wind and less suitable for PV or the other way around. So the simulation can be done
allowing the optimization to find a suitable ratio between wind and PV investment. This will take longer
computational times, but will give results that are worth understanding.All these above suggestion are
meant to provide an outlook into what can be done further to understand better the possibility of P2G
pathways being the backbone of mobility sector and possibly for industries.
References
[1] European 20-20-20 targets, 2014.
[2] Dr. U. Bnger, H. Landinger, E. Pschorr-Schoberer, P. Schmidt, W. Weindorf (LBST), J. Jhrens,
U. Lambrecht (ifeu), K. Naumann (dbfz), and A. Lischke (DLR). Power-to-gas (ptg) in transport
status quo and perspectives for development. 2014.
[3] NATIONALE ORGANISATION WASSERSTOFF UND BRENNSTOFFZELLENTECHNOLOGIE.
70mpa hydrogen refuelling station standardization - functional description of station modules.
[4] Fatima ezzahra Chakika, MohammedKaddamia, and MohammedMikoub. Effect of operating pa-
rameters on hydrogen production by electrolysis of water. International Journal of Hydrogen En-
ergy, 2017.
[5] Sameer Hameer and Johannes L. Van Niekerk. A review of large-scale electrical energy storage.
International Journal of Energy Research, 2015.
[6] MINERALOLWIRTSCHAFTSVERBAND E.V.: Jahresbericht. Url: https://www.mwv.de/wp-
content/uploads/2016/06/mwv-publikationen-jahresbericht-2016.pdf. 2016.
[7] John S. Carsonn II Jerry Banks, Barry L. Nelson, and David M. Nicol. Discrete-Event System
Simulation. Prentice Hall.
[8] Mathworks. https://nl.mathworks.com/products/stateflow.html.
[9] Tom Smolinka, Emile Tabu Ojong, and Thomas Lickert. PEM Electrolysis for Hydrogen Production
Principles and Applications, chapter 2 - Fundamentals of PEM Water Electrolysis. Taylor & Francis
Group, LLC, 2016.
[10] DWD Deutscher Wetterdienst. ftp://ftp-cdc.dwd.de/pub//.
10