Embed Size (px)
Citation preview
International Research Journal of Advanced Engineering and Science ISSN (Online): 2455-9024
114
Adriella Elizabeth Doko, Widandi Soetopo, and Andre Primantyo Hendrawan, “Optimization Analysis of Operating Patterns of Guriola
Reservoir for Meet the Water Needs of the Community in Raenyale Village District West Sabu East Nusa Tenggara,” International
Research Journal of Advanced Engineering and Science, Volume 6, Issue 3, pp. 114-121, 2021.
Optimization Analysis of Operating Patterns of
Guriola Reservoir for Meet the Water Needs of the
Community in Raenyale Village District West Sabu
East Nusa Tenggara
Adriella Elizabeth Doko1, Widandi Soetopo
2, Andre Primantyo Hendrawan
3
1, 2, 3Water Resources Engineering, Brawijaya University, Malang, Jawa Timur, Indonesia-65145
Abstract— Sabu Raijua is one of the regencies in East Nusa
Tenggara Province, Sabu Raijua district has a dry climate, with an
abridged rainy season of 14 to 69 rainy days. In connection with
these conditions, it is necessary to build water structures to meet
water needs. One of the recommended water structures is the
reservoir. This study aims to determine the availability of water in the
pool, choose the pattern of operation of the reservoir, and a linear
programming model. The data used in this study consisted of two
methods, namely primary data and secondary data related to the
need for analysis. The data analysis method in this research is the
quantitative analysis method. Based on the Water Balance Analysis
results, there is a water deficit during the dry season, ranging from
April to December, with a maximum discharge of 0.011 million/m3
for the dry discharge scenario, 0.0218 million/m3 for the typical and
wet discharge scenario. After optimization, there is an increase in the
percentage of fulfillment of each rain scenario. the community can
well distribute the water contained in the Guriola Embung reservoir.
The maximum Fp result for dry water discharge is 7%. With an
average optimal clearance of 0.0074 million/ m3, Fp Maximum for
normal water discharge is 11% with moderate optimal support of
0.0076 million/m3, Fp Maximum for water discharge with a
maximum Fp of 61%. With the optimal release, the average water
discharge is 0.0066 million/m3 to meet water needs of 0.008 m3/s
with a total served population of 3351 people.
Keywords— Embung Guriola, linear programming, Raenyale
Village, optimization, reservoir.
I. INTRODUCTION
Drought is a word that is still often heard in some areas in
Indonesia. Water scarcity occurs in parts of Indonesia East
alone. However, in remote features of Java, there are still
many people who are willing to wait in line for hours to get
decent water appropriately used. Not only in Indonesia,
according to Barker and Amarasinghe (1999) [1], more than a
quarter of the world's population live in areas that will or will
experience water scarcity. Apart from the increased surface
water conditions reduced, geographical and climatic
conditions also affect water availability to meet the
community's water needs. The Province of East Nusa
Tenggara (NTT), one of the provinces in Indonesia, is difficult
to get water. Apart from the relative rainfall low every year,
another influencing factor is growth population that is
increasing every year (sippa.ciptakarya.go.id) [2], so that the
availability of water is not sufficient for needs and activities
Public. Sabu Raijua is one of the regencies in Nusa Tenggara
Province East Southeast, Sabu Raijua district has a temperate
natural condition Alam dry, with an abridged rainy season of
14 to 69 days rain. The dry season in this district ranges from
7 to 8 months, while the short rainy season only occurs from
December to with March (saburaijuakab.go.id) [3]. In
connection with these conditions, it is necessary to build water
structures to meet water needs. One of the recommended
water structures is the reservoir. According to Ibnu Kasiro in
the Handbook of Design Criteria for Small Embungs for Semi-
arid areas in Indonesia, Embungs function to collect rainwater
to supply a village in the dry season. During the dry season,
the town will use the water to meet residents, livestock, and a
few gardens. Reservoir type 2 itself is divided into three,
namely fill, concrete or pairs, and composites. The selection of
the reservoir body type is adjusted to the conditions and
topography of the area where will build the reservoir. One of
the efforts made by the government to improve water security
and meet the community's needs is to build a Guriola Embung
in Raenyale Village, West Sabu District, East Nusa Tenggara
Province. Raenyale Village, West Sabu District, is an area
with arid climatic conditions. With the Guriola reservoir, it is
hoped that it can meet the water needs of the local community.
The Guriola Embung has a limited storage capacity so that
when the dry season arrives, the water in the reservoir often
cannot meet the community's water needs. This study will
apply the optimization of the pool to the community's water
needs using a linear method.
II. LITERATURE REVIEW
A. Hydrological Analysis
Hydrology is a branch of earth science (Geoscience or
Science de la Terre) that explicitly studies the hydrological
cycle or the water cycle on the earth's surface with various
consequences. The basis of hydrology is a natural
phenomenon. The dominant hydrological element in an area is
rainfall. Therefore rainfall data for a place is the primary data
in determining the magnitude of the planned flood discharge
and the mainstay discharge in the area. According to Chay
Asdak in the book Hydrology and Watershed Management
(2010) [4], Precipitation is the outpouring or falling of water
from the atmosphere to the earth's surface and the sea in
different forms, namely rainfall in the tropics and rain and
snow in temperate climates. At the same time, another sense
International Research Journal of Advanced Engineering and Science ISSN (Online): 2455-9024
115
Adriella Elizabeth Doko, Widandi Soetopo, and Andre Primantyo Hendrawan, “Optimization Analysis of Operating Patterns of Guriola
Reservoir for Meet the Water Needs of the Community in Raenyale Village District West Sabu East Nusa Tenggara,” International
Research Journal of Advanced Engineering and Science, Volume 6, Issue 3, pp. 114-121, 2021.
of Precipitation is any product of the condensation of water in
the atmosphere. It occurs when the atmosphere becomes
saturated, and water then condenses and exits the solution. Air
becomes saturated through two processes, cooling or adding
water vapor. As for when it reaches the earth's surface,
Precipitation occurs in several forms, including rain, freezing
rain, drizzle, snow, sleet, and hail. In this study, the
Precipitation in question is related to rainfall. The amount or
degree of rain is expressed by the amount of rainfall in a unit
of time. The team used is mm/hour and is called the intensity
of Precipitation. (Sosrodarsono and Takeda, 2003) [5]. Rain
data is obtained from a rain gauge installed in one place,
which is called the main post, with the requirements of the
density between the posts meeting the needs of a region. The
final result of rain data processing is the tabulation availability
of rain data in a certain period, generally daily rain in one
year. If this data is available, it can also be expressed in
weekly, primary, semi-monthly, and monthly and yearly data.
The calculation of the average daily maximum rainfall data
must be carried out correctly to analyze the frequency of rain
data. In practice, it is often found that the daily complete rain
calculation for each rain post in one year is then averaged to
get the rain. This method is considered illogical and accurate
because the average rainfall is carried out on the shower from
each rain post on different days. The results will deviate far
from the actual events on the ground. Adequate rain is the
portion of the total rainfall that results in direct runoff. This
direct runoff consists of surface runoff and interflow, i.e.,
water that enters a thin layer below the soil surface with low
permeability, which comes out again at a quiet place and turns
into surface runoff. So the adequate rain is the total rainfall
minus the loss at the beginning of the rain due to interception
and infiltration.
B. Embung or Pond
In the Introduction to Embung Planning Module published
by the Ministry of Public Works and Public Housing (2017),
Embungs are water storage structures built in depressed areas,
usually outside rivers. Meanwhile, another definition of the
reservoir, according to the book Technical Guidelines for
Water Conservation Through Embankment Development
(2011), is a water conservation building that has the form of a
basin or water flow in the form of soil, stone, concrete, and
masonry fill that can hold water for various purposes. The dam
will store water in the rainy season, and then the water will be
used by a village during the dry season to meet needs, with the
priority sequence being residents, livestock, and gardens or
rice fields. This amount will determine the height of the body
of the reservoir and the capacity of the reservoir. According to
the first edition of the Embung Engineering Planning Standard
Module (2015), the types of reservoirs are divided into four
classes, namely:
a) Types of reservoirs based on construction are divided into
two reservoirs: single-purpose dams and multipurpose
damns.
b) Types of reservoirs based on their use are divided into
three reservoirs: storage dams, diversion dams, and
detention dams.
c) Types of reservoirs based on their location to the water
flow are divided into two, namely reservoirs on the water
flow (on stream) and reservoirs outside the water flow
(off-stream).
d) Types of reservoirs based on the formation material are
divided into fill dams, embankment dams, and concrete
dams.
Activities related to the operation of the reservoir can be
explained as all activities associated with the regulation of the
volume of the pool and the use of reservoir water, which
includes monitoring the physical condition of the facilities and
infrastructure. This activity consists of several sub-sections,
which include collecting hydrological data, opening and
closing the water gates of the reservoir, and monitoring the
reservoir. Water that enters the reservoir consists of two
groups, namely surface water from all rainfed areas and
effective rainwater that falls directly on the reservoir's surface.
C. Raw Water Needs
Water demand is the amount of water needed for
household, industrial, hospital, and other purposes. Priority for
water needs includes domestic, industrial, and public water
needs. Water needs are categorized into two, namely domestic
water needs and non-domestic water needs. Domestic water is
needs, namely the need for water used for household purposes,
for drinking, cooking, bathing, washing clothes, and other
purposes. Meanwhile, non-domestic water needs are water
used for offices, places of worship, public places, and others.
According to the Directorate General of Human Settlements
(2000), the standard of water needs is divided into two,
namely:
a) Domestic Water Needs Standard Domestic water demand
standards are the water requirements used in private
residences to meet daily needs such as cooking, drinking,
washing, and other household needs. The unit used is
liter/person/day.
b) Standard for Non-Domestic Needs Standard for non-
domestic water needs is the need for clean water outside
household needs. Non-domestic water needs consist of
commercial and industrial uses, namely water use by
commercial and industrial agencies. And public use,
namely the use of water for government buildings,
hospitals, schools, and places of worship.
D. Optimization
Optimization is an activity to get the best results in a given
situation. In addition, optimization is also a process of finding
the best solution or optimal value of optimization problems.
There are optimal problems that seek the maximum value or
minimum value (Nyoman Gunantara, 2018). The ultimate goal
of all these activities is to minimize the effort (effort) or
maximize the desired benefits (benefits). Since the effort
required or the expected use can be expressed as a function of
the decision variable, optimization can be defined as a process
to find conditions that give the minimum or maximum value
of a part. Optimization can be interpreted as an activity to get
the minimum value of a function because getting the total
International Research Journal of Advanced Engineering and Science ISSN (Online): 2455-9024
116
Adriella Elizabeth Doko, Widandi Soetopo, and Andre Primantyo Hendrawan, “Optimization Analysis of Operating Patterns of Guriola
Reservoir for Meet the Water Needs of the Community in Raenyale Village District West Sabu East Nusa Tenggara,” International
Research Journal of Advanced Engineering and Science, Volume 6, Issue 3, pp. 114-121, 2021.
value of a process can be done by finding the minimum of the
same position.
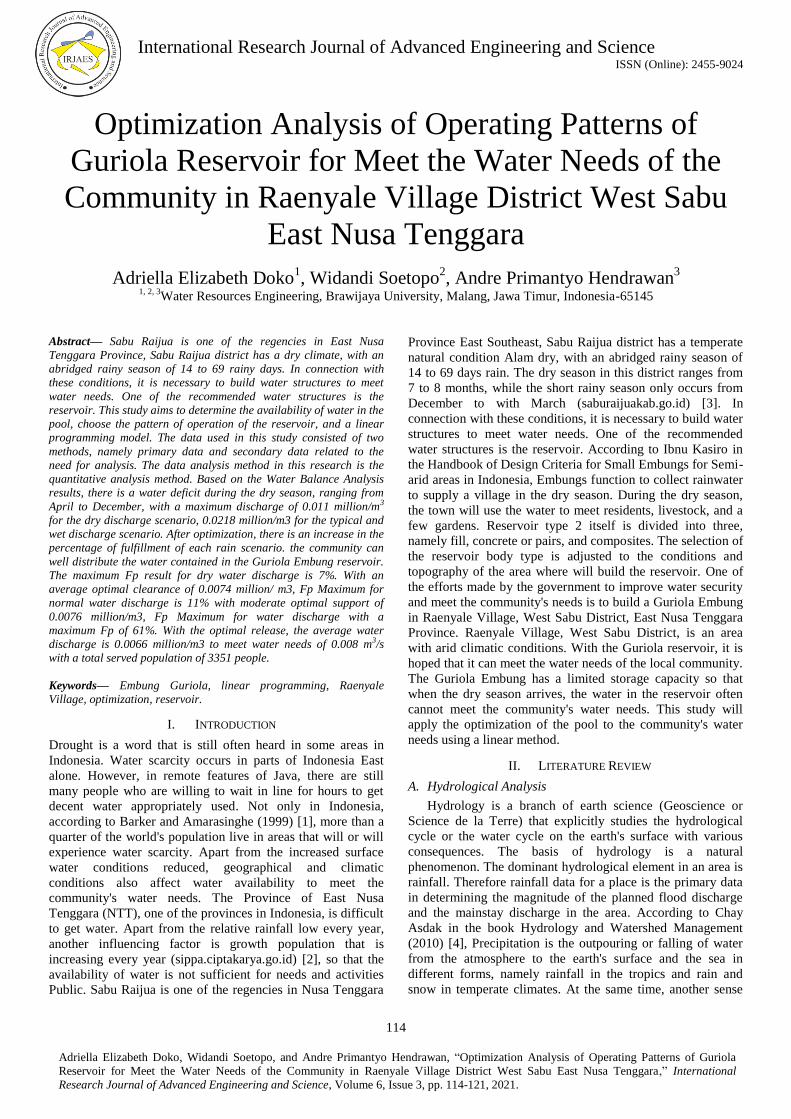
E. Optimization Model
The optimization model is the preparation of a model of a
system that is by the actual situation, which can later be
converted into a mathematical model by separating the main
elements so that a solution is achieved by the decision-making
goals or objectives of the decision-making. The optimization
model is used to overcome the problem of developing water
resources in an area with various aspects that need to be
studied, including flood control, drainage, drinking water,
flushing, irrigation, electric power, recreation, waste disposal,
etc.
Fig. 1. Optimization model schema.
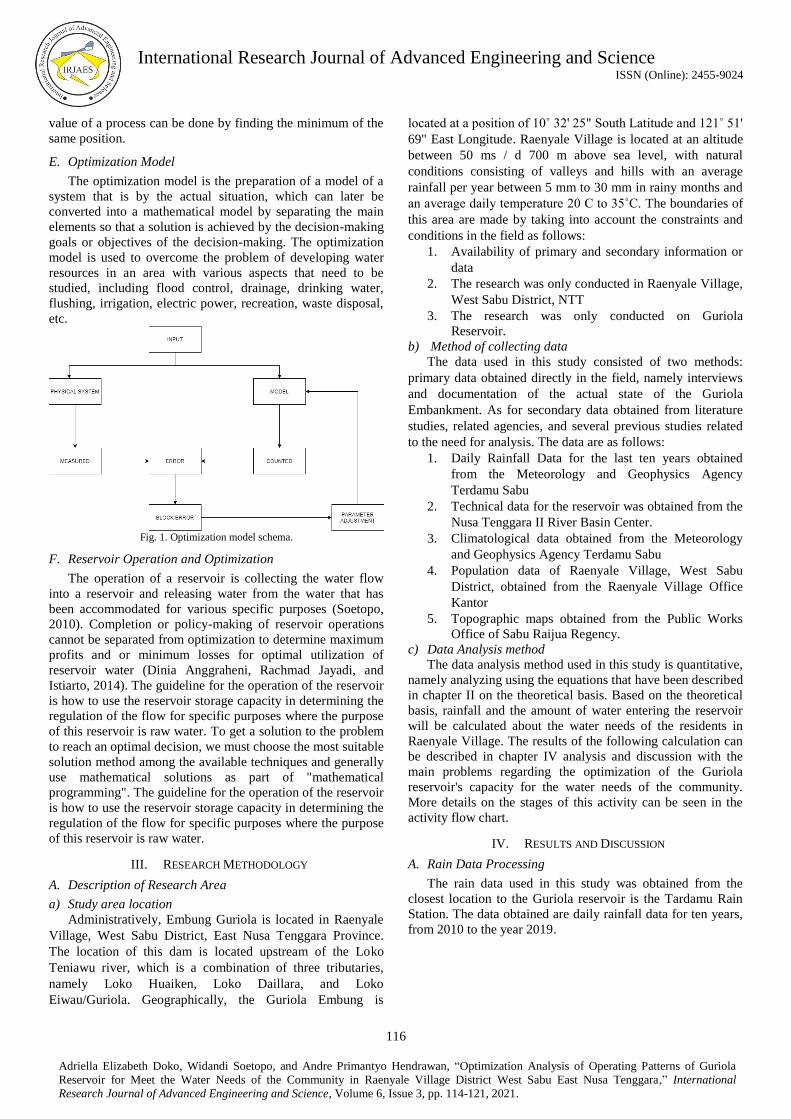
F. Reservoir Operation and Optimization
The operation of a reservoir is collecting the water flow
into a reservoir and releasing water from the water that has
been accommodated for various specific purposes (Soetopo,
2010). Completion or policy-making of reservoir operations
cannot be separated from optimization to determine maximum
profits and or minimum losses for optimal utilization of
reservoir water (Dinia Anggraheni, Rachmad Jayadi, and
Istiarto, 2014). The guideline for the operation of the reservoir
is how to use the reservoir storage capacity in determining the
regulation of the flow for specific purposes where the purpose
of this reservoir is raw water. To get a solution to the problem
to reach an optimal decision, we must choose the most suitable
solution method among the available techniques and generally
use mathematical solutions as part of "mathematical
programming". The guideline for the operation of the reservoir
is how to use the reservoir storage capacity in determining the
regulation of the flow for specific purposes where the purpose
of this reservoir is raw water.
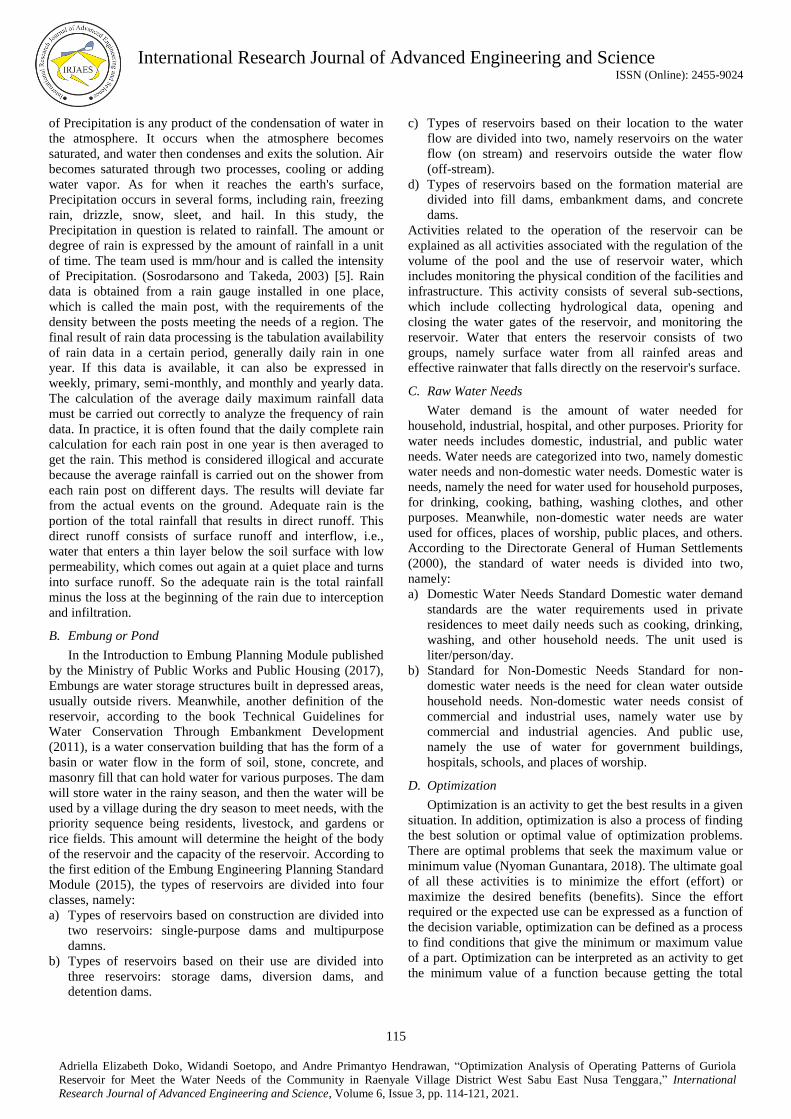
III. RESEARCH METHODOLOGY
A. Description of Research Area
a) Study area location
Administratively, Embung Guriola is located in Raenyale
Village, West Sabu District, East Nusa Tenggara Province.
The location of this dam is located upstream of the Loko
Teniawu river, which is a combination of three tributaries,
namely Loko Huaiken, Loko Daillara, and Loko
Eiwau/Guriola. Geographically, the Guriola Embung is
located at a position of 10˚ 32' 25" South Latitude and 121˚ 51'
69" East Longitude. Raenyale Village is located at an altitude
between 50 ms / d 700 m above sea level, with natural
conditions consisting of valleys and hills with an average
rainfall per year between 5 mm to 30 mm in rainy months and
an average daily temperature 20 C to 35˚C. The boundaries of
this area are made by taking into account the constraints and
conditions in the field as follows:
1. Availability of primary and secondary information or
data
2. The research was only conducted in Raenyale Village,
West Sabu District, NTT
3. The research was only conducted on Guriola
Reservoir.
b) Method of collecting data
The data used in this study consisted of two methods:
primary data obtained directly in the field, namely interviews
and documentation of the actual state of the Guriola
Embankment. As for secondary data obtained from literature
studies, related agencies, and several previous studies related
to the need for analysis. The data are as follows:
1. Daily Rainfall Data for the last ten years obtained
from the Meteorology and Geophysics Agency
Terdamu Sabu
2. Technical data for the reservoir was obtained from the
Nusa Tenggara II River Basin Center.
3. Climatological data obtained from the Meteorology
and Geophysics Agency Terdamu Sabu
4. Population data of Raenyale Village, West Sabu
District, obtained from the Raenyale Village Office
Kantor
5. Topographic maps obtained from the Public Works
Office of Sabu Raijua Regency.
c) Data Analysis method
The data analysis method used in this study is quantitative,
namely analyzing using the equations that have been described
in chapter II on the theoretical basis. Based on the theoretical
basis, rainfall and the amount of water entering the reservoir
will be calculated about the water needs of the residents in
Raenyale Village. The results of the following calculation can
be described in chapter IV analysis and discussion with the
main problems regarding the optimization of the Guriola
reservoir's capacity for the water needs of the community.
More details on the stages of this activity can be seen in the
activity flow chart.
IV. RESULTS AND DISCUSSION
A. Rain Data Processing
The rain data used in this study was obtained from the
closest location to the Guriola reservoir is the Tardamu Rain
Station. The data obtained are daily rainfall data for ten years,
from 2010 to the year 2019.
International Research Journal of Advanced Engineering and Science ISSN (Online): 2455-9024
117
Adriella Elizabeth Doko, Widandi Soetopo, and Andre Primantyo Hendrawan, “Optimization Analysis of Operating Patterns of Guriola
Reservoir for Meet the Water Needs of the Community in Raenyale Village District West Sabu East Nusa Tenggara,” International
Research Journal of Advanced Engineering and Science, Volume 6, Issue 3, pp. 114-121, 2021.
Fig. 2. Research Flow Chart.
Fig. 3. Stochastic Dynamic Program Optimization Flowchart.
Fig. 4. Embankment Simulation Flowchart.
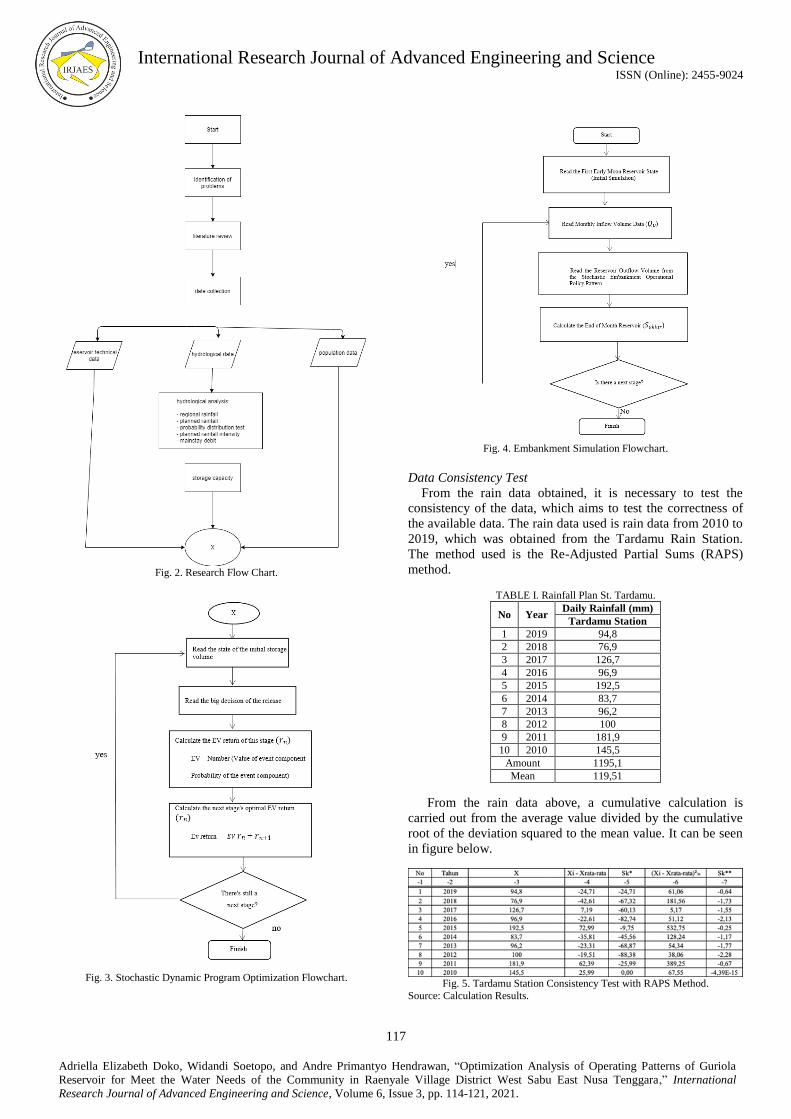
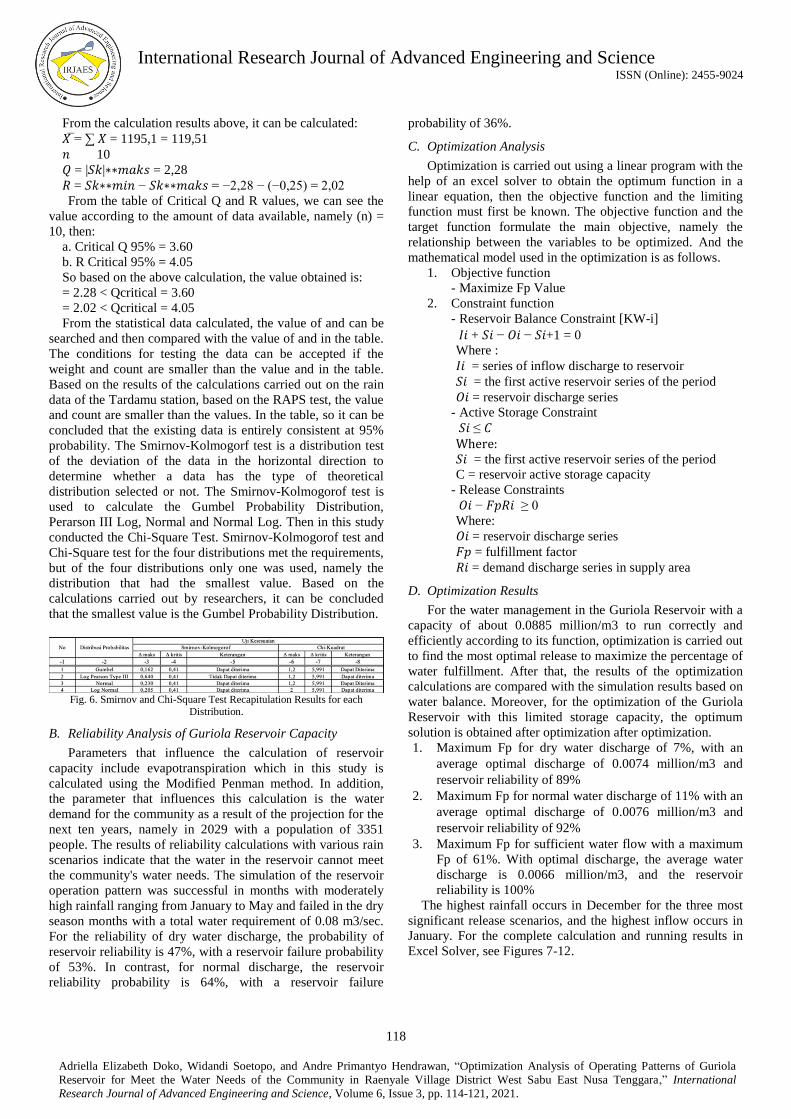
Data Consistency Test
From the rain data obtained, it is necessary to test the
consistency of the data, which aims to test the correctness of
the available data. The rain data used is rain data from 2010 to
2019, which was obtained from the Tardamu Rain Station.
The method used is the Re-Adjusted Partial Sums (RAPS)
method.
TABLE I. Rainfall Plan St. Tardamu.
No Year Daily Rainfall (mm)
Tardamu Station
1 2019 94,8
2 2018 76,9
3 2017 126,7
4 2016 96,9
5 2015 192,5
6 2014 83,7
7 2013 96,2
8 2012 100
9 2011 181,9
10 2010 145,5
Amount 1195,1
Mean 119,51
From the rain data above, a cumulative calculation is
carried out from the average value divided by the cumulative
root of the deviation squared to the mean value. It can be seen
in figure below.
Fig. 5. Tardamu Station Consistency Test with RAPS Method.
Source: Calculation Results.
International Research Journal of Advanced Engineering and Science ISSN (Online): 2455-9024
118
Adriella Elizabeth Doko, Widandi Soetopo, and Andre Primantyo Hendrawan, “Optimization Analysis of Operating Patterns of Guriola
Reservoir for Meet the Water Needs of the Community in Raenyale Village District West Sabu East Nusa Tenggara,” International
Research Journal of Advanced Engineering and Science, Volume 6, Issue 3, pp. 114-121, 2021.
From the calculation results above, it can be calculated:
𝑋 = ∑ 𝑋 = 1195,1 = 119,51
𝑛 10
𝑄 = |𝑆𝑘|∗∗𝑚𝑎𝑘𝑠 = 2,28
𝑅 = 𝑆𝑘∗∗𝑚𝑖𝑛 − 𝑆𝑘∗∗𝑚𝑎𝑘𝑠 = −2,28 − (−0,25) = 2,02
From the table of Critical Q and R values, we can see the
value according to the amount of data available, namely (n) =
10, then:
a. Critical Q 95% = 3.60
b. R Critical 95% = 4.05
So based on the above calculation, the value obtained is:
= 2.28 < Qcritical = 3.60
= 2.02 < Qcritical = 4.05
From the statistical data calculated, the value of and can be
searched and then compared with the value of and in the table.
The conditions for testing the data can be accepted if the
weight and count are smaller than the value and in the table.
Based on the results of the calculations carried out on the rain
data of the Tardamu station, based on the RAPS test, the value
and count are smaller than the values. In the table, so it can be
concluded that the existing data is entirely consistent at 95%
probability. The Smirnov-Kolmogorf test is a distribution test
of the deviation of the data in the horizontal direction to
determine whether a data has the type of theoretical
distribution selected or not. The Smirnov-Kolmogorof test is
used to calculate the Gumbel Probability Distribution,
Perarson III Log, Normal and Normal Log. Then in this study
conducted the Chi-Square Test. Smirnov-Kolmogorof test and
Chi-Square test for the four distributions met the requirements,
but of the four distributions only one was used, namely the
distribution that had the smallest value. Based on the
calculations carried out by researchers, it can be concluded
that the smallest value is the Gumbel Probability Distribution.
Fig. 6. Smirnov and Chi-Square Test Recapitulation Results for each
Distribution.
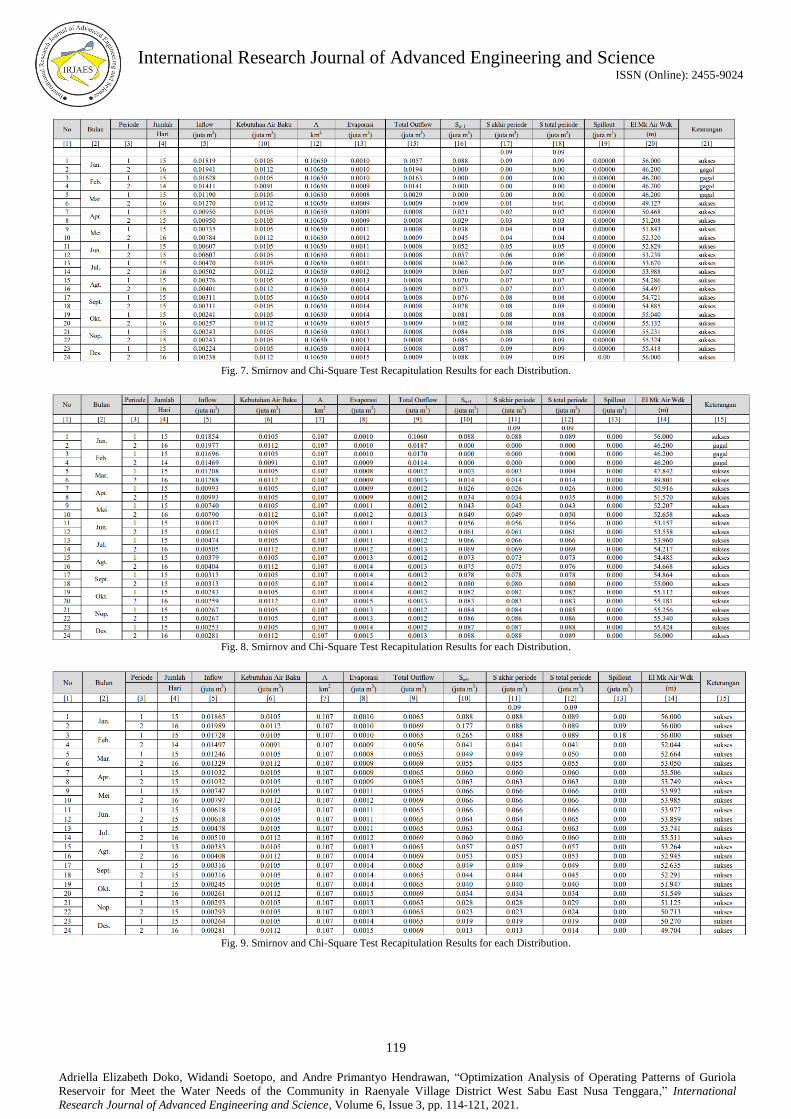
B. Reliability Analysis of Guriola Reservoir Capacity
Parameters that influence the calculation of reservoir
capacity include evapotranspiration which in this study is
calculated using the Modified Penman method. In addition,
the parameter that influences this calculation is the water
demand for the community as a result of the projection for the
next ten years, namely in 2029 with a population of 3351
people. The results of reliability calculations with various rain
scenarios indicate that the water in the reservoir cannot meet
the community's water needs. The simulation of the reservoir
operation pattern was successful in months with moderately
high rainfall ranging from January to May and failed in the dry
season months with a total water requirement of 0.08 m3/sec.
For the reliability of dry water discharge, the probability of
reservoir reliability is 47%, with a reservoir failure probability
of 53%. In contrast, for normal discharge, the reservoir
reliability probability is 64%, with a reservoir failure
probability of 36%.
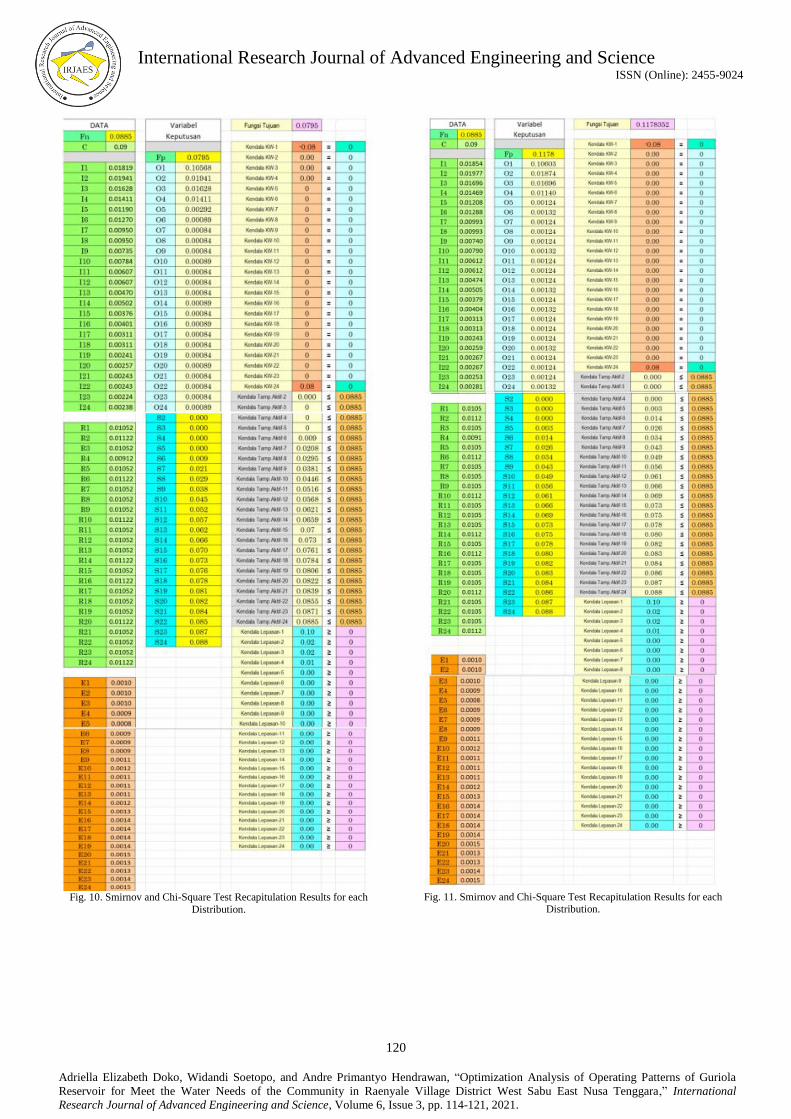
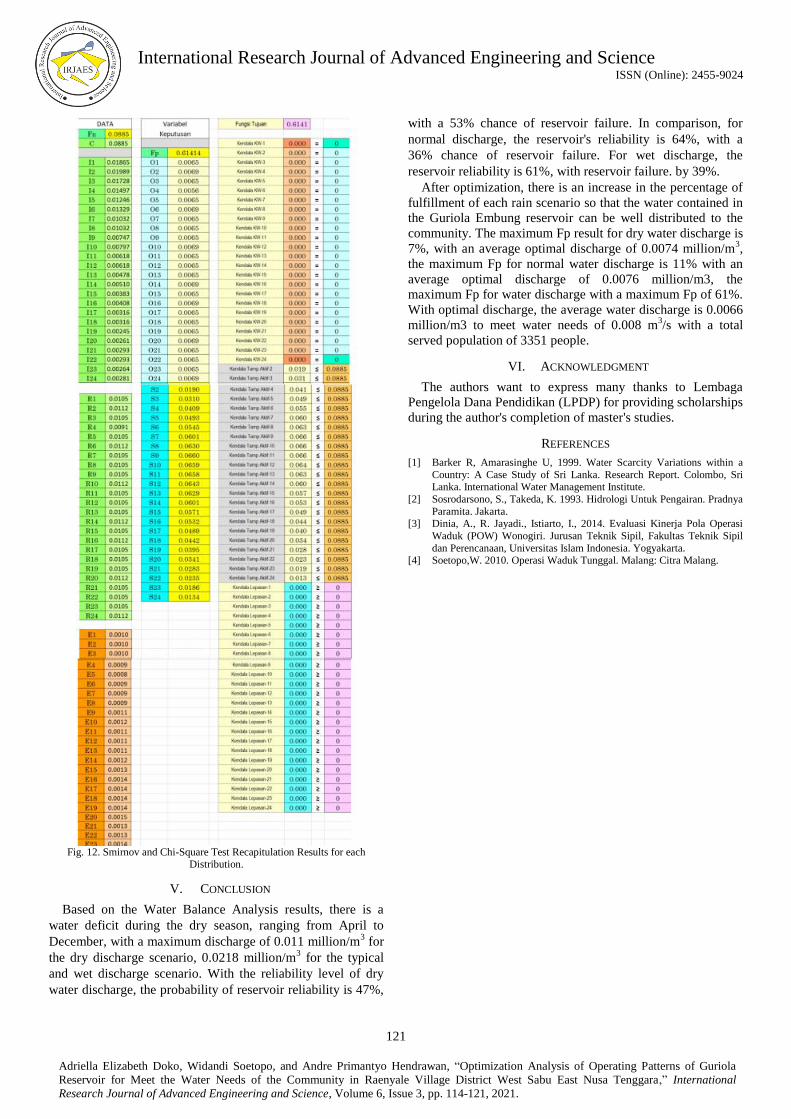
C. Optimization Analysis
Optimization is carried out using a linear program with the
help of an excel solver to obtain the optimum function in a
linear equation, then the objective function and the limiting
function must first be known. The objective function and the
target function formulate the main objective, namely the
relationship between the variables to be optimized. And the
mathematical model used in the optimization is as follows.
1. Objective function
- Maximize Fp Value
2. Constraint function
- Reservoir Balance Constraint [KW-i]
𝐼𝑖 + 𝑆𝑖 − 𝑂𝑖 − 𝑆𝑖+1 = 0
Where :
𝐼𝑖 = series of inflow discharge to reservoir
𝑆𝑖 = the first active reservoir series of the period
𝑂𝑖 = reservoir discharge series
- Active Storage Constraint
𝑆𝑖 ≤ 𝐶 Where: 𝑆𝑖 = the first active reservoir series of the period
C = reservoir active storage capacity
- Release Constraints
𝑂𝑖 − 𝐹𝑝𝑅𝑖 ≥ 0
Where:
𝑂𝑖 = reservoir discharge series
𝐹𝑝 = fulfillment factor
𝑅𝑖 = demand discharge series in supply area
D. Optimization Results
For the water management in the Guriola Reservoir with a
capacity of about 0.0885 million/m3 to run correctly and
efficiently according to its function, optimization is carried out
to find the most optimal release to maximize the percentage of
water fulfillment. After that, the results of the optimization
calculations are compared with the simulation results based on
water balance. Moreover, for the optimization of the Guriola
Reservoir with this limited storage capacity, the optimum
solution is obtained after optimization after optimization.
1. Maximum Fp for dry water discharge of 7%, with an
average optimal discharge of 0.0074 million/m3 and
reservoir reliability of 89%
2. Maximum Fp for normal water discharge of 11% with an
average optimal discharge of 0.0076 million/m3 and
reservoir reliability of 92%
3. Maximum Fp for sufficient water flow with a maximum
Fp of 61%. With optimal discharge, the average water
discharge is 0.0066 million/m3, and the reservoir
reliability is 100%
The highest rainfall occurs in December for the three most
significant release scenarios, and the highest inflow occurs in
January. For the complete calculation and running results in
Excel Solver, see Figures 7-12.
International Research Journal of Advanced Engineering and Science ISSN (Online): 2455-9024
119
Adriella Elizabeth Doko, Widandi Soetopo, and Andre Primantyo Hendrawan, “Optimization Analysis of Operating Patterns of Guriola
Reservoir for Meet the Water Needs of the Community in Raenyale Village District West Sabu East Nusa Tenggara,” International
Research Journal of Advanced Engineering and Science, Volume 6, Issue 3, pp. 114-121, 2021.
Fig. 7. Smirnov and Chi-Square Test Recapitulation Results for each Distribution.
Fig. 8. Smirnov and Chi-Square Test Recapitulation Results for each Distribution.
Fig. 9. Smirnov and Chi-Square Test Recapitulation Results for each Distribution.
International Research Journal of Advanced Engineering and Science ISSN (Online): 2455-9024
120
Adriella Elizabeth Doko, Widandi Soetopo, and Andre Primantyo Hendrawan, “Optimization Analysis of Operating Patterns of Guriola
Reservoir for Meet the Water Needs of the Community in Raenyale Village District West Sabu East Nusa Tenggara,” International
Research Journal of Advanced Engineering and Science, Volume 6, Issue 3, pp. 114-121, 2021.
Fig. 10. Smirnov and Chi-Square Test Recapitulation Results for each
Distribution.
Fig. 11. Smirnov and Chi-Square Test Recapitulation Results for each
Distribution.
International Research Journal of Advanced Engineering and Science ISSN (Online): 2455-9024
121
Adriella Elizabeth Doko, Widandi Soetopo, and Andre Primantyo Hendrawan, “Optimization Analysis of Operating Patterns of Guriola
Reservoir for Meet the Water Needs of the Community in Raenyale Village District West Sabu East Nusa Tenggara,” International
Research Journal of Advanced Engineering and Science, Volume 6, Issue 3, pp. 114-121, 2021.
Fig. 12. Smirnov and Chi-Square Test Recapitulation Results for each
Distribution.
V. CONCLUSION
Based on the Water Balance Analysis results, there is a
water deficit during the dry season, ranging from April to
December, with a maximum discharge of 0.011 million/m3 for
the dry discharge scenario, 0.0218 million/m3 for the typical
and wet discharge scenario. With the reliability level of dry
water discharge, the probability of reservoir reliability is 47%,
with a 53% chance of reservoir failure. In comparison, for
normal discharge, the reservoir's reliability is 64%, with a
36% chance of reservoir failure. For wet discharge, the
reservoir reliability is 61%, with reservoir failure. by 39%.
After optimization, there is an increase in the percentage of
fulfillment of each rain scenario so that the water contained in
the Guriola Embung reservoir can be well distributed to the
community. The maximum Fp result for dry water discharge is
7%, with an average optimal discharge of 0.0074 million/m3,
the maximum Fp for normal water discharge is 11% with an
average optimal discharge of 0.0076 million/m3, the
maximum Fp for water discharge with a maximum Fp of 61%.
With optimal discharge, the average water discharge is 0.0066
million/m3 to meet water needs of 0.008 m3/s with a total
served population of 3351 people.
VI. ACKNOWLEDGMENT
The authors want to express many thanks to Lembaga
Pengelola Dana Pendidikan (LPDP) for providing scholarships
during the author's completion of master's studies.
REFERENCES
[1] Barker R, Amarasinghe U, 1999. Water Scarcity Variations within a
Country: A Case Study of Sri Lanka. Research Report. Colombo, Sri Lanka. International Water Management Institute.
[2] Sosrodarsono, S., Takeda, K. 1993. Hidrologi Untuk Pengairan. Pradnya
Paramita. Jakarta. [3] Dinia, A., R. Jayadi., Istiarto, I., 2014. Evaluasi Kinerja Pola Operasi
Waduk (POW) Wonogiri. Jurusan Teknik Sipil, Fakultas Teknik Sipil
dan Perencanaan, Universitas Islam Indonesia. Yogyakarta. [4] Soetopo,W. 2010. Operasi Waduk Tunggal. Malang: Citra Malang.