Embed Size (px)
Citation preview

Optimising Grapevine Nutrition for Dried Vine Fruit Production
A Riverlink project ·
supported by
Dried Fruit Research and Development Council
~If& RIVERLINK f =~ Linking Horticultural Centres
,....- ~ in Sunraysia - Riverland 9

.,
CSI RO DIVISION OF HORTICULTURE AND AGRICULTURE VICTORIA
Final project report
to the
Dried Fruits Research and Development Council
'
Optimising Grapevine Nutrition for Dried Vine Fruit Production
Project CSH38
by
Michael Treeby (Principal Investigator), CSIRO Division of Horticulture, Private Mail Bag, Merbein VIC 3505. Ph: 050 51 3100; Fax: 050 51 3111 ; Email:
and
Selepelah Nagarajah, Sunraysia Horticultural Centre, P.O. Box 950, Mildura VIC 3505. Ph : 050 51 4500; Fax: 050 51 4523; E-mail : [email protected]
C S I RO AUSTR A LIA
~ AGRICULTURE IJ VICTORIA

INDEX
(ii) Industry Summary Part A. Nutrient standards for Sultana on own roots and Sultana on
Ramsey Part B. Petiole nutrient standards for Zante, Zante/Ramsey, Carina,
Carina/Ramsey and Gordo vines Part C. Magnesium deficiency in Sultana/Ramsey vines and potassium
fertiliser Part D. Extension aids on grapevine nutrition
iii) Background
(iv) Objectives
Part A. Nutrient standards for Sultana on own roots and Sultana on Ramsey A(v) Introduction
Derivation of Nutrient Stpndalds Analysis of Compositional Data Grapevine Nutrient Standards Nitrate-N versus total N
A(vi) Research Methodology Field Trials and Treatments Applied Analytical Methods Vine Performance Indices Statistical Treatment of the Data
A(vii) Results Vine Performance Petiole and Leaf Nutrient Concentrations Principal Component Analyses Correlation Studies Regression Analyses Nutrient Concentration Ranges
A(viii) Discussion and Conclusions
Part B. Petiole nutrient standards for Zante, Zante/Ramsey, Carina, Carina/Ramsey and Gordo
B(v) Introduction
B(vi) Research Methodology
B(vii) Results
B(viii) Discussion and Conclusions
Part C. Magnesium deficiency in Sultana/Ramsey vines and K fertiliser.
C(v) Introduction
1
2
3
4
4
5
6 6 6 6 7
10
lO 10 11 11 13
13 13 14 15 16 16 18
18
20
20
20
21
22
23
23
C(vi) Research Methodology Year 1: September 1992 to Apri/1993 Years 2 and 3: September 1993 to February 1995 Magnesium Deficiency and District Vineyard Data
C(vii) Results Year 1: September 1992 to Apri/1993 Years 2 and 3: September 1993 to February 1995 Magnesium Deficiency and District Vineyard Data
C(viii) Discussion and Conclusions
Part D. Extension aids on grapevine nutrition
D(v) Introduction
D(vi) Research Methodolpgy
D(vii) Results
D(viii) Discussion
(ix) Implications and Recommendations
(x) Intellectual Property Rights arising from the Project
(xi) Technical Summary of Information Developed
(xii) Acknowledgements
(xiii) References
Tables and Figures
Attachment
24 24 25 26
26 26 26 27
27
28
28
29
29
29
29
30
30
31
31
OPTIMISING GRAPEVINE NUTRITION
(ii) Industry Summary
Part A. Nutrient standards for Sultana on own roots and Sultana on Ramsey
Applications of fertiliser were used to induce differences in leaf and petiole nutrient
concentrations of Sultana on own roots and Sultana on Ramsey rootstock at flowering on five
sites in the Sunraysia region. Using an approach that retains much of the unique relationship
between vine performance over the three years of the trial and the concentration of each
nutrient in an array of nutrients within the tissue, critical nutrient concentration ranges for leaves
and petioles of Sultana on own roots and Sultana on Ramsey foroptimal performance (yield)
were established. The adequate concentration ranges represent those concentrations of
nutrients associated with optimum performance, measured as yield of dried fruit per vine, over
the three years of the trial. It was not possible to establish critical concentration ranges for all
nutrients in both leaves and petioles for both Sultana on own roots and Sultana on Ramsey
rootstock. Where it was not possible to make an estimate of the critical concentrations, the
existing accepted concentrations were assumed to be valid.
In comparison to the currently accepted grapevine petiole nutrient standards, the optimum
ranges for the petiole standards developed in this project are generally narrower. The petiole
standards also differ from the accepted standards in that %N, rather than mg N03-N/kg, is used
as the basis for assessing petiole N status, critical concentrations have been derived for S and
Fe and the adequate ranges forK are higher than the current standard. The petiole standards
developed for Sultana on Ramsey rootstock differ from the petiole standards developed for
Sultana on own roots in that the adequate ranges for N, K and B are higher, and the adequate
range for Fe is lower for Sultana on Ramsey rootstock in comparison to the petioles of Sultana
on own roots. The adequate ranges for S and Cu were similar.
The standards developed for the leaves of Sultana on own roots and Sultana on Ramsey
rootstock also differ. Leaves of Sultana on Ramsey required higher concentrations of P, K, B,
Mn and Zn for optimum performance than leaves of Sultana on own roots. As with petioles,
leaves of Sultana on Ramsey required lower concentrations of Fe than leaves of Sultana on
own roots for optimum performance, and the range for N in the leaves required for optimum
performance of Sultana on Ramsey was not as broad as that of Sultana on own roots.
Generally, the strength of the relationships between leaf nutrient status and performance were
stronger than the strength of the relationships between petiole nutrient status and performance.
Thus, the reliability of the concentration ranges developed is higher for leaves as opposed to
Page 1

OPTIMISING GRAPEVINE NUTRITION
petioles. Therefore, it is suggested that analysis of leaf blades sampled at flowering may be
preferable to analysis of petioles sampled at flowering for making assessments of vineyard
nutrient status in relation to performance of Sultana on own roots and Sultana on Ramsey
rootstock.
Part B. Petiole nutrient standards for Zante, Zante/Ramsey, Carina, Carina/Ramsey and Gordo
vines
With respect to the other varieties used for producing dried vine fruit there are two limitations to the
currently accepted petiole standards (Robinson, 1986). Firstly, the standards were not established in
Sunraysia, and, secondly, the standards may not be valid for all vine varieties and for grafted vines.
Therefore, a study was carried out to establish petiole nutrient standards for Zante, Zante/Ramsey,
Carina, Carina/Ramsey and Gordo vines growing in Sunraysia.
The standards were established by monitoring the petiole nutrient levels at flowering and the yield of
these varieties in a number of Sunraysia vineyards over two seasons. The nutrient levels in petioles
at flowering in vineyards which produced high yields were used to establish nutrient standards .
... :-:;:;:-: > .·.· · ·.·.·.·.·.·.··.·.;.·.·-: -·-·.· ·.·.·
· ·~· .pE}ti(){~' H(rtrieflf$~h4~WStof Zaht~ .cJri-~bti {361-dQ arid .6~~naon.oYt'n •f6ot~ •• ~iff~r •.. · ..
Page 2
OPTIMISING GRAPEVINE NUTRITION
; P¢ti9'~., bYffi~rt ~!~n~~r~~.J<lr z:~nte 9Yii~ht ~&1. .P~H.@ 99 9)Y.n -r99~. ~iff~ff.Ym in§~e at .• ¢~fit~· 6JW~6~~t@ ·g~~r1~HnR~rii~~y f®t~t6bl<; : i~s~ecfiV~t.Y~ ~r;d ....... , .. . Z g;~~~~~ions i~~~j~~~ine nutrierlt<st~~~based on anai;~G~tp~tioles sampled~t flowering
·.···.···· and comparison t6\ilie<appropriate shffid~rd developed in{t1i~section of the project will be
rnon~. reliable tt1#~:~~hCiusions based.~rit~~ ciurrently ai:c~~t~ Petiole nutrient·standards.
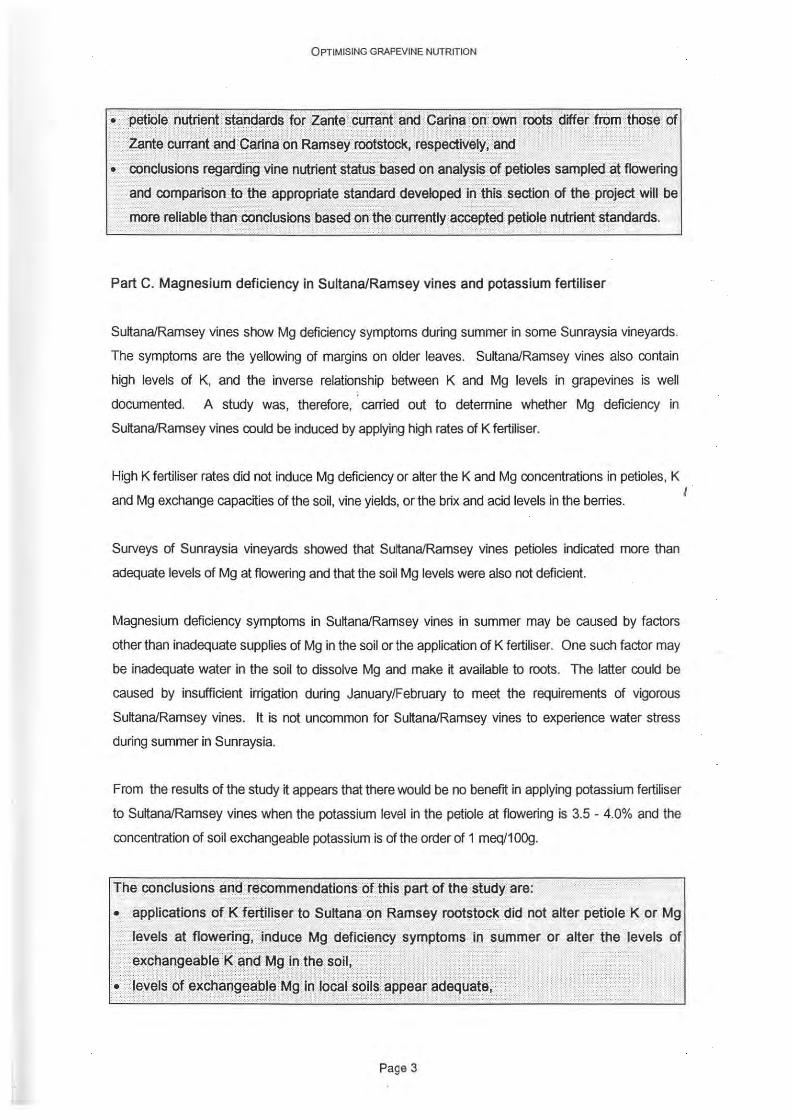
Part C. Magnesium deficiency in Sultana/Ramsey vines and potassium fertiliser
Sultana/Ramsey vines show Mg deficiency symptoms during summer in some Sunraysia vineyards.
The symptoms are the yellowing of margins on older leaves. Sultana/Ramsey vines also contain
high levels of K, and the inverse relationship between K and Mg levels in grapevines is well
documented. A study was, therefore, carried out to determine whether Mg deficiency in
Sultana/Ramsey vines could be induced by applying high rates of K fertiliser.
High K fertiliser rates did not induce Mg deficiency or alter the K and Mg concentrations in petioles, K
and Mg exchange capacities of the soil, vine yields, or the brix and acid levels in the berries.
Surveys of Sunraysia vineyards showed that Sultana/Ramsey vines petioles indicated more than
adequate levels of Mg at flowering and that the soil Mg levels were also not deficient.
Magnesium deficiency symptoms in Sultana/Ramsey vines in summer may be caused by factors
other than inadequate supplies of Mg in the soil or the application of K fertiliser. One such factor may
be inadequate water in the soil to dissolve Mg and make it available to roots. The latter could be
caused by insufficient irrigation during January/February to meet the requirements of vigorous
Sultana/Ramsey vines. It is not uncommon for Sultana/Ramsey vines to experience water stress
during summer in Sunraysia.
From the results of the study it appears that there would be no benefrt: in applying potassium fertiliser
to Sultana/Ramsey vines when the potassium level in the petiole at flowering is 3.5 - 4.0% and the
concentration of soil exchangeable potassium is of the order of 1 meq/1 OOg.
The conclusions arid recommendations pf]his part of the study are:
• applications of kJ~ffiliser to St.ittanabh Ramsey root~i~dkdid not alter petiole K or Mg
Jevels at flo~enQJ, ind~ce Mg deticJ~I19Y symptoms iQ summer or alter . the levels of
·~1~~~~~~1~~~l~f=~~f~~i~i6i:;~~!i:~~~1~lf~~~~~~~j=:\;!i \',:::;;;,;; o ·.· .. · ·••••• ••c•;;,:.h)f
Page 3
I
OPTIMISING GRAPEVINE NUTRITION
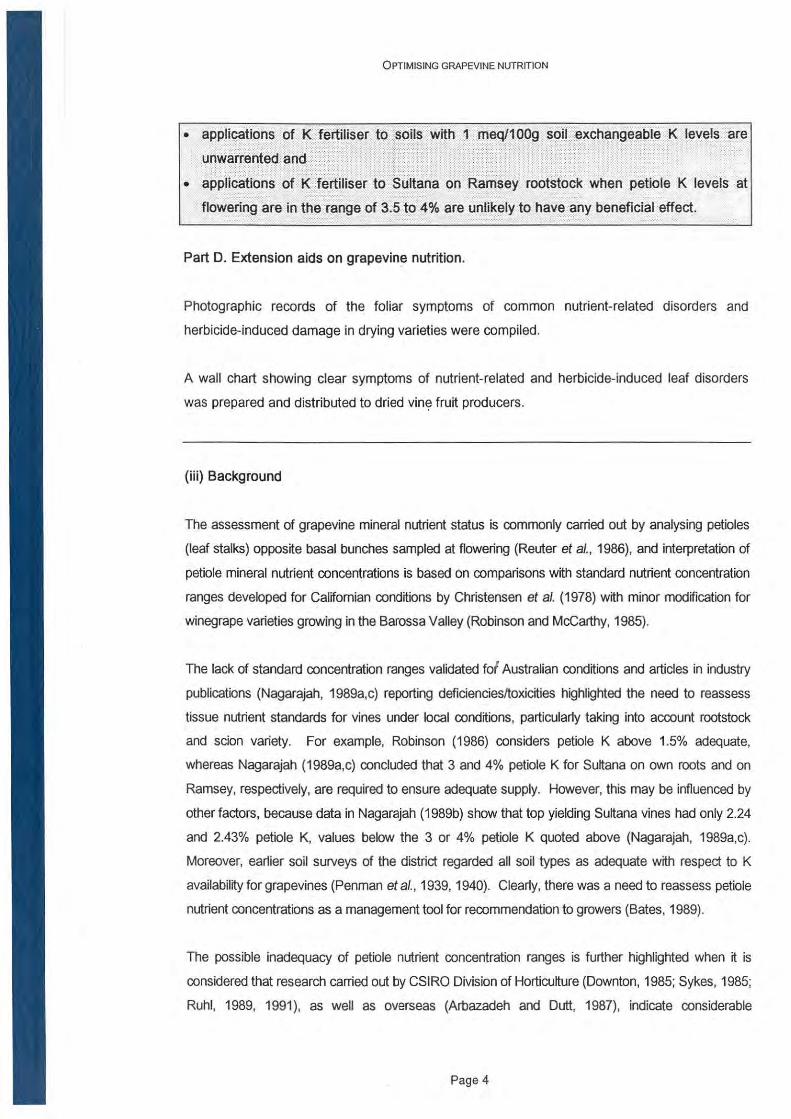
• OOg ~qil .¢x9hang~~ble .K level~ . are
"''"'~""'-·- .:.:.,,.,.,,,,,,,,"' .:.: ....... y '~~\:hen: ~:;J~:: K level: 00 • . j~ely to hav~ ~ny beneficial effect.
Part D. Extension aids on grapevine nutrition.
Photographic records of the foliar symptoms of common nutrient-related disorders and
herbicide-induced damage in drying varieties were compiled.
A wall chart showing clear symptoms of nutrient-related and herbicide-induced leaf disorders
was prepared and distributed to dried vinE? fruit producers.
(iii) Background
The assessment of grapevine mineral nutrient status is commonly carried out by analysing petioles
(leaf stalks) opposite basal bunches sampled at flowering (Reuter eta/., 1986), and interpretation of
petiole mineral nutrient concentrations is based on comparisons with standard nutrient concentration
ranges developed for Californian conditions by Christensen eta/. (1978) with minor modification for
winegrape varieties growing in the Barossa Valley (Robinson and McCarthy, 1985).
The lack of standard concentration ranges validated fof Australian conditions and articles in industry
publications (Nagarajah, 1989a,c) reporting deficiencies/toxicities highlighted the need to reassess
tissue nutrient standards for vines under local conditions, particularly taking into account rootstock
and scion variety. For example, Robinson (1986) considers petiole K above 1.5% adequate,
whereas Nagarajah (1989a,c) concluded that 3 and 4% petiole K for Sultana on own roots and on
Ramsey, respectively, are required to ensure adequate supply. However, this may be influenced by
other factors, because data in Nagarajah (1989b) show that top yielding Sultana vines had only 2.24
and 2.43% petiole K, values below the 3 or 4% petiole K quoted above (Nagarajah, 1989a,c).
Moreover, earlier soil surveys of the district regarded all soil types as adequate with respect to K
availability for grapevines (Penman eta/. , 1939, 1940). Clearly, there was a need to reassess petiole
nutrient concentrations as a management tool for recommendation to growers (Bates, 1989).
The possible inadequacy of petiole nutrient concentration ranges is further highlighted when it is
considered that research carried out by CSIRO Division of Horticulture (Downton, 1985; Sykes, 1985;
Ruhl, 1989, 1991), as well as overseas (Arbazadeh and Dutt, 1987), indicate considerable
Page 4

OPTIMISING GRAPEVINE NUTRITION
differences in mineral uptake and transport characteristics between grapevine rootstocks. In addition
to rootstock effects there are undoubtedly other factors influencing tissue nutrient levels, vine
performance and fertiliser needs.
An additional complication to the interpretation of petiole nutrient data is the interaction between
various minerals. Antagonism between K, Mg and Ca during uptake and P-induced Zn deficiency in
plants have been widely observed (viz. Marschner, 1986). For example, application of K fertilizer to
grapevines when levels are already adequate can induce Mg deficiency (Dumkov, 1966; Brechbuhler
eta/., 1968). The importance of the K/Mg balance in grafted vines in Sunraysia was highlighted by
observations of the symptoms of Mg deficiency in Sultana grafted on Ramsey rootstock in the district.
Solution culture experiments at CSIRO Merbein have shown that scion Mg and K levels are largely
determined by the rootstock type (ROhl, 1 ~91 ). Similarly, excessive levels of P in grapevines can
induce Zn deficiency in grapevines (Marschner and Schropp, 1977).
Therefore, misinterpretation of petiole analysis, caused by reliance on possibly inappropriate
standards and resulting inappropriate fertilizer application, can contribute to further serious nutritional
problems.
Validation and possible modification of existing standards, taking into account genotypic variation, is
needed to ensure an adequate and balanced nutrient supply for grapevines and consistently good
production.
(iv) Objectives
• To validate or modify existing standards for grapevine nutrient levels in the Sunraysia area
as a function of rootstock and scion types in relation to yield of dried vine fruit
• to study aspects of the K/Mg balance in grafted Sultana vines in the district and the
correction of Mg deficiency and
• to develop extension aids on grapevine nutrition to better inform growers of available
technology and to schedule a grower seminar on grapevine nutrition and fertiliser use at the
conclusion of the project
The following report is divided into four sections:
Part A. Nutrient standards for Sultana on own roots and Sultana on Ramsey
Part B. Petiole nutrient standards for Zante on own roots, Zante on Ramsey, Carina on
own roots, Carina on Ramsey and Gordo on own roots.
Page 5
OPTIMISING GRAPEVINE NUTRITION
Part C. Magnesium deficiency in Sultana/Ramsey vines and K fertiliser.
Part D. Extension aids on grapevine nutrition.
Part A. Nutrient standards for Sultana on own roots and Sultana on Ramsey
A(v) Introduction
Derivation of Nutrient Standards
Assessing the performance of any crop plant in relation to its mineral nutrient status involves
analysis of the plant material and compar!son to standard concentrations that, ideally, reflect the
relationship between crop performance and nutrient status. This type of relationship is
represented diagrammatically in Figure 1. Such relationships are relatively simple to quantify
for annual crop plants that produce a crop in a comparatively short period of time and are
almost completely dependent on nutrients taken up during the life cycle. For perennial crop
species, such as grapevines. the task is more complex due to the many factors that can affect
the final yield in the period between initiation of inflorescence primordia and the harvesting of
the resultant fruit. For grapevines, this period is approximately 16-17 months (Coombe, 1988).
Thus, it is difficult to quantify the relationship between nutrient status and the performance of
perennial crops.
Approaches to developing nutrient standards fall into two broad categories: replicated field trials
and surveys (Leece, 1968}. The first approach involves manipulating nutrient supply within a
given site and quantifying the relationship between crop nutrient status and performance. The
latter approach involves sampling plant tissue from high performing sites and arbitrarily defining
deficient, adequate and excessive ranges based on population averages and statistical
estimates of population spread.
Analysis of Compositional Data
Analysing nutrient concentration data in relation to crop performance is also problematic, and
several approaches have been developed to overcome the problems associated with the
interpretation of such data. The simplest approach is to take each nutrient individually and
relate to crop performance. This approach, known as the univariate method, ignores the many
interactions between nutrients, both in the soil and in the plant, that contribute to the plant's
nutrient concentrations and overall performance. This simplistic approach results in nutrient
Page 6

OPTIMISING GRAPEVINE NUTRITION
concentration ranges that may not adequately describe the complex relationship between tissue
nutrient concentration and crop performance because the ranges for each nutrient are implicitly
based on the assumption that levels of all other nutrients are non-limiting.
The use of nutrient ratios overcome the limitations implicit in the univariate approach to some
extent, and is the basis for the Diagnostic and Recommendation Integrated System (ORIS) or
bivariate approach (Beafils, 1973). ORIS has not been widely adopted because of the lack of a
physiological basis for many of the ratios used to describe the relationship between crop
nutrient status and crop performance (Smith, 1986). However, the approach developed
highlights a problem with compositional data of any type, namely, manipulation of one nutrient
invariably causes changes in the concentrations of other nutrients. In geology this problem is
termed "closure" or the "constant sum constraint" and essentially means that if one element in a
mineral structure increases in concentration then the concentration of one or more other
elements must decrease because of the finite space available for all elements to occupy
(Aitchison, 1983). The constant sum constraint concept cannot be applied to plant
compositional data as rigorously, but the closure concept has some validity: manipulating the
supply of a limiting nutrient, for example N, may cause a growth response diluting the
concentrations of other nutrients and pushing the concentrations of those nutrients toward being
limiting relative to that of the nutrient supplied. Awareness of this problem has resulted in the
development of the Compositional Nutrient Diagnosis concept (Parent and Dafir, 1992). In this
approach the concentrations of all nutrients are expressed as a proportion of the total nutrients
in the tissue. Thus, the sum of all nutrients, expressed on a common basis , equals a constant
nominal 100% or unity. The approach offers the advantage of retaining the unique relationship
between each nutrient in the compositional array, and the derived proportions lend themselves
to principal component analysis (Parent and Dafir, 1992).
Principal component analysis is a method of describing a range of variables in a reduced
number of new variables that are a linear combinations of the original variables (Jeffers, 1967;
Sokal and Rohlf, 1981; lezzoni and Pritts, 1991 ). Coupled with expressing nutrient concentrations
on a proportional basis, principal component analysis could simplify the search for cause and effect
type relationships between vine nutrient status and vine performance by reducing the number of
independent variables to be analysed while retaining all of the original variables and most of the
variability. Use of this procedure for determining critical nutrient concentrations in plant tissue was
first suggested by Holland (1966). No examples applying this procedure to the development of
critical nutrient concentrations for perennial crops could be found in the scientific literature.
Grapevine Nutrient Standards
Page 7

OPTIMISING GRAPEVINE NUTRITION
The petiole nutrient standards used in Australia have as their basis nutrient standards
developed by Cook (1966} and Christensen eta/. (1978} for grapevines growing in the San
Joaquin Valley of California. The original standards were based on consideration of variations
in petiole and blade nutrient concentrations over the growing season for Thompson Seedless
(Cook and Kishaba, 1956; Christensen, 1969). Comparing a number of sampling methods for
assessing vineyard fertiliser needs, Robinson et a/. (1978) concluded that the Californian
system of sampling basal petioles at flowering gave the best, most sensitive, assessment of the
nutrient status of Riverland vineyards. Robinson and McCarthy (1985) suggested modifications
to the Californian standards for assessing the nutrient status of grapevines growing in the
Barossa Valley of South Australia. The Californian standards, as modified by Robinson and
McCarthy, have been the basis by which the nutrient status of Australian vineyards have been
assessed since (Robinson, 1986}. These standards are presented in Table A 1.
Several aspects of the original Californian standards warrant further discussion.
The choice of petioles as opposed to leaf blades arose from earlier work indicating that petiole
K concentrations were more responsive to applications of K than were leaf blades on one site
(Ulrich, 1942a), and that petiole N03-N concentrations were more sensitive to N applications
than leaf N03-N or petiole or leaf total N (Ulrich, 1942b}. For example, on one sampling date
petiole N03-N concentrations were 10 times higher in vines receiving N in comparison to vines
not receiving N, whereas petiole total N concentrations responded by a factor of 1.4 and leaf
N03-N and total N responded by factors of 1.03 and 1.14, respectively (Ulrich, 1942b}. It was
concluded that petiole N03-N was a more sensitive measure of vine N status than blade or
petiole total N and blade N03-N. However, these studies did not attempt to test the strength of
the relationship between any measure of vine N and K status and any vine performance
response.
Cook and Kishaba ( 1956) found that petiole N03-N concentrations varied enormously
throughout the season, but were able to show that the pattern of variation was similar from
season to season. They correlated petiole N03-N concentrations from unfertilised control plots
throughout the first season of the trial with yield responses of fertilised plots in comparison to
unfertilised plots in the second and third years of the trial. They concluded that the petiole N03-
N concentrations were negatively related to the yield response that could be expected from
additions of N to Thompson Seedless vines: the lower the petiole N03-N concentrations were at
flowering, the more positive response that could be expected from additions of N in subsequent
years. Cook and Kishaba's data form the basis for the N03-N standards in use at present. It is
Page 8
OPTIMISING GRAPEVINE NUTRITION
not clear from this study what aspect of vine performance responded to N supply and was
responsible for the yield increases observed.
Christensen (1969) presented data describing the variation in petiole mineral nutrient contents
along shoots of Thompson Seedless from early flowering through to one month after flowering.
Nitrate-N concentrations were seen to vary enormously from season to season, but peaked
approximately 2 weeks before full flowering in all four seasons of the trial. Petiole N03-N
concentrations tended to be higher at the more basal nodes compared to the more apical
nodes, irrespective of the time of sampling. In contrast, petiole K concentrations increased the
closer the node was to the shoot tip, but concentrations in the petioles opposite the basal
cluster also peaked approximately 2 weeks before full flowering. Similar data sets were
generated for P, Ca, Mg, Fe, Mn, Zn and B. Christensen concluded that rapid changes
occurred in the concentrations of N03-N and Kin the petioles opposite the basal clusters during
the flowering period, and that the most stable period for their measurement occurred 3 to 4
weeks after flowering. Later studies (Christensen , 1984) relating blade and petiole N, P and K
levels suggested that blade total N concentrations were a more appropriate measure of vine N
status because it was a more stable pool than either petiole or blade N03-N levels. This
stability presumably is a reflection of labile nature of the N03-N pool and the stability of the
larger total reduced-N pool.
Questions of the most appropriate time to sample and the most appropriate N measure aside,
and with the exception of N03-N, it is difficult to see from the preceeding review of the literature
on what basis the petiole standards presented by Christensen et a/. (1978) are derived. It is
only in the case of petiole N03-N that there is any evidence of a statistically tested relationship
between petiole concentrations and vine performance (Cook and Kishaba, 1956). It is
reasonable to conclude that the standards are, for the most part, based on Cook's 1966 review
of grapevine nutrition, and as such constitute a synthesis of observations from widely varying
locations and varieties rather than a systematic derivation of standards that reflect "cause and
effect" relationships between vine nutrient status and performance for a single variety in a
specific area or location.
It was the objective of this part of the project to describe the relationship between vine
performance and vine nutrient status of Sultana on own roots and Sultana on Ramsey in order
to validate or modify the currently accepted petiole nutrient standards. The study was based on
nutrient status of the petiole and leaf opposite the basal cluster at flowering because it is in the
leaves, not the petioles, where the major measureable influences on vine performance occur,
namely carbon fixation and sugar export, but for the reasons outlined above, petiole sampling
Pa~e 9

OPTIMISING GRAPEVINE NUTRITION
has come to be accepted by industry. The approach adopted was to manipulate vine nutrient
status within a limited number of sites. By confining the study to a few sites with many
individuals, or plots, within each site, it is possible to eliminate or minimise differences in
management practices that may account for differences in vine performance between
properties involved in a survey approach to nutrient standard development. An example of a
cultural practice that would assume importance as the number of different properties involved
in a survey became greater would be the control of pests and diseases.
Nitrate-N versus total N
Grapevines and figs are unique amongst woody perennials in having a measure of N status in
terms of N03-N (Robinson, 1986). In the case of grapevines this situation probably arose from
the work of Cook and Kishaba (1956) described above. At the time that Cook and Kishaba
carried out their studies total N was determined using steam distillation of Khejdahl digests and
wet chemistry. The procedure was complex, labour intensive and prone to analytical error. By
comparison, the spectrophotometric method used by Cook and Kishaba to measure N03-N,
was relatively simple, less labour intensive and relatively less prone to operator error. Since
that time tremendous strides in analytical technology have occurred: total N can now be
determined on automated instruments using dry combustion and thermal conductivity of the
combustion gases or infra-red detection of nitrous oxides. It is not possible to purchase
standard reference plant material with a certified concentration of N03-N. Thus, it is not possible
to critically assess the performance of methods for measuring N03-N.
There are other physiological and scientific reasons for questioning the validity of assessing
plant N status in terms of N03-N. Firstly, N03-N is a very labile metabolic pool showing strong
diurnal variation (Marschner, 1986). Total N on the other hand is, due to the proportion of dry
matter that it occupies, more ·stable. Secondly, if N03-N is a valid yardstick of plant N status,
inorganic P, a very labile pool of P (Bieleski, 1973), is equally a valid measure of plant P status.
There are no concentration ranges for the phosphorus status of woody perennials described in
terms of inorganic P (Robinson, 1986).
A{vi} Research Methodology
Field Trials and Treatments Applied
Originally 7 field sites comprising 4 sites of Sultana on own roots and 3 sites of Sultana on
Ramsey rootstock were chosen. One grower withdrew his co-operation, and the number of
.Page 10

OPTIMISING GRAPEVINE NUTRITION
sites was reduced, accordingly, to 3 and 2 of Sultana on own roots and Sultana on Ramsey,
respectively.
Replicated field trials were set out on each site. A factorial combination of 3 N treatments (0, 40
and 80 kg N/ha/y as NH,N03 in split applications following flowering and harvest) , 2 P
treatments (0 and 20 kg/ha/y as single strength super phosphate applied in spring) and 2 K
treatments (0 and 50 kg/ha/y applied in spring as ~SO,) were imposed on 3-vine plots down
each of at least 9 replicate rows separated by 2 guard rows on each site. On 1 own roots site it
was possible to use 10 replicate rows.
Twenty leaves and petioles per plot were sampled at flowering and stored in paper bags on ice
blocks in eskies during transport back to. the Merbein Laboratory. Surface contamination was
removed by washing in reverse osmosis water and detergent acidified with a few drops of 1 N
HCI, followed by rinsing twice in de-ionised reverse osmosis water. The leaves were separated
from the petioles, blotted dry and dried in new paper bags at 65°C for several days. The
petioles were also blotted dry and fresh weights recorded before being dried in new paper bags
at 65°C. All samples were ground to pass through a 0.5 mm sieve prior to analysis.
Analytical Methods
Nitrogen was determined on a LECO FP228 Nitrogen Determinator using dry combustion and
infra red detection of oxidised N in the combustion gas. Chloride was measured on a Buchler
Instruments Digital Chloridometer using an aqueous extract titrated with silver. Phosphorus, K,
Ca. Mg, S, Na, B, Cu, Mn, Fe and Zn were measured in a Spectroflame Inductively-Coupled
Plasma Emission Spectrometer following digestion of the dried plant material in concentrated
HN03 for 12 hours at 125°C and dilution to a known volume. Aluminium was also measured to
check on potential contamination with dust particles and the generation of spurious results.
Nitrate-N was determined spectrophotometrically on a GBC UVNis 918 Spectrophotometer
according to the method of Heanes (1982) using acid washed activated charcoal and 0.025 M
aluminium sulphate as the extractant. Leaf chlorophyll was measured on a GBC UVNis 918
Spectrophotometer following extraction in dimethylsulphoxide according to the method of
Hiscox and lsraelstam (1979) and the concentrations calculated from the A664 and Ae47 readings
using the equations presented by Moran (1982).
Vine Performance Indices
Page 11

OPTIMISING GRAPEVINE NUTRITION
Vine performance in terms of fruit per vine in a given season is a function of the crop potential
(initiation, maintenance and development of inflorescence primordia) set during the previous
season and the realisation of that potential (inflorescence development prior to flowering, fruit
set, berry growth and the import of sugars) during the current season.
Potential crop size manifests, approximately, as bud fruitfulness as measured by the ratio of the
number of inflorescence primordia to the number of shoots appearing in spring. Skinner and
Matthews ( 1989) reported that inflorescence primordia maintenance and differentiation were
more sensitive to P deficiency than was inflorescence primordia initiation. Thus, the bud
fruitfulness estimates made are a function of inflorescence primordia initiation as well as
inflorescence primordia maintenance and differentiation during the previous season.
The number of canes wrapped down per vine directly impinges on the potential crop size that
remains on the vine at spring. Thus, the number of canes wrapped down was recorded to
correct for the effect of differences in pruning on potential crop size.
Although the number of berries per bunch is also a function of inflorescence development, it
also can be used as a crude measure of fruit set.
Berry weight, estimated from 100 berry samples collected immediately prior to harvest, is a
measure of berry development following fruit set.
Bunch weight, estimated from the total fresh weight of crop per vine divided by the number of
inflorescences per vine can be used as a measure of inflorescence development and fruit set.
Brix measurements carried out on 1 00-berry samples collected immediately prior to harvest can
be used as measure of the amount of sugar imported by the berries once a correction has been
made for the total number of berries per vine acting as sinks for sugar exported from the leaves.
Leaf chlorophyll is also a measure of the potential the vine has to fix and export sugar to the
ripening berries.
Estimates of yields of dried Sultana at 12.5% moisture on a whole vine and per bearer bases
can be made using the total fresh weight of grapes per vine and the Brix measurements using a
regression equation based on the data of Uhlig (1993). This corrects across and within sites for
differences in harvest dates and maturity.
Page 12
OPTIMISING GRAPEVINE NUTRITION
Yields per vine could be measured in all seasons on all vines, but not all the other vine
performance indices could be measured on all sites in all seasons.
Statistical Treatment of the Data
Petiole and leaf nutrient data were transformed according to Parent and Dafir (1992): the
concentration of each individual nutrient measured, with the exception of N03-N, in each
sample was expressed on a common basis, 1Jmoles/kg dry weight (x;). A geometric mean, g(x) ,
was calculated for each data point using all ~ for that data point:
g(x)=(x *x *x *x *x *v *x *v *x *x *x *x *x )(1113> N P K Ca Mg 1 '8 Na ''Cl 8 Cu Mn Fe Zn '
and a dimensionless value, ~. calculated for each nutient,
where i denotes each nutrient in an array of nutrients.
The geometric mean, g(x), essentially amounts to a measure of the total nutrient load in each
sample, and the Z; values account for the diluting effect of one nutrient on other nutrients and
overcomes the bounded sum constraint (Parent and Dafir, 1992).
The effect of the treatments applied were analysed as two randomised complete block designs
for Sultana on own roots and Sultana on Ramsey, with season and site forming additional
means of replication, using Genstat 5 Release 3 (Payne et al., 1993).
Treatment means were calculated across experimental blocks on each site for each year of the
study. Principal component analysis was then carried out on the mean z values. A new set of
6 variables for the petiole z values and 6 for the leaf z values were calculated from the original
set of 13 variables using the linear weightings provided by principal component analysis.
Product moment correlations and linear and non-linear regression analyses was used to
quantify the relationship between petiole and leaf nutrient principal components.
A(vii) Results
Vine Performance
Page 13

OPTIMISING GRAPEVINE NUTRITION
Summaries of the statistical analyses carried out on absolute responses and relative responses
for Sultana on own roots and Sultana on Ramsey rootstock are presented in Tables A2 to A5,
respectively.
Fertiliser main effects are presented in Tables A6 to A9. The responses over the three years of
the study could be summarised as follows:
• applications of 80 kg N/ha/y were associated with significant yield improvements (equivalent
to approximately 70 and 900 kg dried fruitlha/y for Sultana on own roots and Sultana on
Ramsey rootstock, respectively) due to increases in the bunch:shoot ratio and berry weight
(Table A6 and A7),
• when the effect of bearer numbers was removed by using the number of canes wrapped
down as a covariate (Tables A8 and A9), yields of Sultana on own roots receiving K
applications were the equivalent of 220 kg dried fruitlha/y higher due to higher bunch:shoot
ratios, shoots per cane and berry weights, and
• applications of P were associated with significantly lower yields of dried fruit per vine for
Sultana on Ramsey rootstock, but correcting for bearer number resulted in the negative
effect of P applications on yield of Sultana on Ramsey being negated.
Discussion of responses from this point onwards will be confined to yields of dried fruit per vine.
Petiole and Leaf Nutrient Concentrations
Summaries of the statistical analyses carried out on petiole and leaf nutrient concentrations and
derived z values for Sultana on own roots and Sultana on Ramsey rootstock are presented in
Tables A10 to A17.
Application of N, P or K, alone or in combination, to both Sultana on own roots and Sultana on
Ramsey rootstock significantly altered the concentrations of most nutrients in leaves and
petioles (Tables A10 to A13). This is illustrated in Tables A18 and A19 where the effects of N
fertiliser on petiole nutrient concentrations of Sultana on own roots and Sultana on Ramsey
rootstock are presented. Data in Tables A20 and A21 indicate that N fertiliser was associated
with higher total- and N03-N, Ca. Mg and Cl and lower P, K and S concentrations in the petioles
of both Sultana on own roots and Sultana on Ramsey at flowering. Sultana vines on Ramsey
rootstock that received 80 kg N /ha/y had significantly higher petiole B levels than unfertilised
vines or vines that received 40 kg N /ha/y. Sultana vines on own roots that received N fertiliser
had significantly higher Na concentrations in the petiole at flowering than unfertilised vines.
Page 14

OPTIMISING GRAPEVINE NUTRITION
The calculated z values suggest that many of the apparent changes in petiole and leaf nutrient
concentrations were a function of growth dilution rather than direct effects of the fertiliser
treatments on nutrient uptake and/or transport. Nitrogen supply main effects on petiole z values
for Sultana own roots and Sultana on Ramsey rootstock are presented in Tables A20 and A21,
respectively. Application of N fertiliser was associated with significant increases in petiole N,
Ca, Mg, Na and Zn status of Sultana on own roots relative to the total pool of nutrients. The
increased levels of these nutrients appeared to be at the expense of P and S. Application of N
fertiliser to Sultana on Ramsey rootstock was associated with significant increases in petiole N,
Mg, Cl and Fe status relative to the total pool of nutrients. The increases in the levels of these
mineral nutrients in Sultana on Ramsey rootstock appeared to be associated with a concomitant
decreases in P, Ca and S status relative_ to the total pool of mineral nutrients. Phosphorus and
K fertilisers had less impact on petiole z values. Leaf z values were generally unaffected by
fertiliser applications (data not presented).
Principal Component Analyses
The results of the principal component analyses carried out on the petiole and leaf z values are
presented in Tables A22 to A25 for Sultana on own roots and Sultana on Ramsey rootstock,
respectively. The first 6 principal components (PC1 through PC6) generally accounted for more
than 90% of the variation in the original 13 variables; PC1 generally accounting for
approximately one-third of the variation in the original 13 variables and the sixth principal
component generally accounting for 5% or less of the variation in the original 13 variables. The
latent vectors are weightings by which a linear transformation of the original variables will
produce a new variable that retains, proportionally, the original 13 variables. At this point, the
principal components have no physiological significance, and essentially amount to linear
combinations of the original variables capturing progressively less of the variation in the original
data set. The sign attached to the latent vector also has no physiological significance and
simply indicates the direction away from the principal component the original data tends to
cluster in the multidimensional hyperspace encompassing the cloud of data points. The first
principal component for the petiole z values of Sultana on own roots (Table A22) is strongly
influenced by the z values for the macronutrients, particularly Na, while Z8 and zZn play
insignificant roles. The second principal component is strongly influenced by the z values for Zn
and Mg, PC3 by the z values for S, Cu and Zn, PC4 by the z values for P and S, PC5 by the z
value for Fe and PC6 is strongly influenced by the z values for N and B. The first principal
component for leaf nutrient concentrations of Sultana on own roots (Table A23) is strongly
influenced by the z values for P, Ca and Na. Similarly, the first principal components for
Page 15
OPTIMISING GRAPEVINE NUTRITION
petioles and leaves of Sultana on Ramsey rootstock (Table A24 and A25) are dominated by the
z values forK and Cl and S and Zn, respectively.
Correlation Studies
The product-moment correlation coefficients relating yields of dried vine fruiUvine/year to petiole
and leaf principal components for Sultana on own roots and Sultana on Ramsey rootstock are
presented in Tables A26 and A27 respectively.
I
The first principal components for both petiole and leaf z values were not correlated with yields
of dried fruiUvine/year for Sultana on own roots (Table A26). The next 5 principal components
for petiole z values correlated strongly: with vine yields, PC2 and PC3 negatively, and the
remaining principal components positively. With the exception of PC3 , the same trend occurred
with respect to the principal components calculated from leaf z values.
The first principal components for petioles and leaves were negatively correlated with yields of
Sultana on Ramsey rootstock (Table A27). PC4 was the only other petiole principal component
that showed a significant correlation with vine performance. In contrast, vine performance was
significantly correlated with most principal components derived from leaf z values.
Regression Analyses
The product moment correlations indicate whether a dependent variable is generally positively
or negatively related to an independent variable over the whole range of data. The correlation
coefficients do not give detailed information concerning the nature of the relationship as the
independent variable increases or decreases. The nature of the relationship between the
dependent and independent variable can be quantified by fitting linear and non-linear regression
curves to the data.
The percentage of variation in the yield of dried fruiUvine accounted for by various linear and
non-linear functions are presented in Tables A28 and A29 and A30 and A31 for petioles and
leaves of Sultana on own roots and Sultana on Ramsey rootstock, respectively. Large
differences between the proportion of variation explained by the single order function and the
proportions explained by the quadratic and the various non-linear functions are indicative of the
nature of the relationship between the dependent and the independent variable. Small
differences between the linear and quadratic and non-linear functions in the proportions of
variation accounted for are indicative of a straight line relationship between the dependent and
Page 16
OPTIMISING GRAPEVINE NUTRITION
independent variables. However, caution needs to be exercised during the interpretation of
Tables A28 to A31 because although a large proportion of the data may be accounted for by
fitting a particular function to a data set. non-random distribution of residuals (the difference
between predicted values and the observed values) can occur because of the specific nature of
the function fitted emphasizing some pairs of data more than others. Where such problems
occurred, the resulting function was not used for comparison with the single order linear
regression.
For the petioles of Sultana on own roots, the proportion of variation accounted for by the
various functions fitted was generally low, and there was little evidence of divergence from
straight line relationships (Table A28). For the leaf principal components of Sultana on own
roots (Table A29), PC4 and PC5 provided the strongest evidence of divergence from linearity.
For Sultana on Ramsey rootstock (Tables A30 and A31), the most reliable contrasts between
the single order regressions and the non-linear functions were provided by petiole PC, and PC4 ,
and in leaf principal components by PC2 and PC5•
Non-linearity amongst the multi-variate principal components is important because it allows
definition of ranges for all nutrients without the need for further regression analyses.
Interpolated three-dimensional plots allow visualisation of the effect of two variables on a third
dependent variable. Importantly, three-dimensional plots allow rapid identification of segments
of data-sets where meaningful relationships between independent and dependent variables
occur. This is illustrated in Figure A2 where an interpolated three-dimensional plot of the first
and fifth principal components for leaf z values for Sultana on Ramsey rootstock is presented.
Vine performance improves as PC, decreases from approximately 3.2 to approximately 3.0. As
PC, decreases from approximately 3.0 to 2.9 vine performance does not improve, and vine
performance drops off as PC, decreases below approximately 2.8. Therefore, the optimum
range with respect to the linear combination of z values comprising PC, lies, approximately, in
the range 2.9-3.0. Using the interpolation band widths allows more accurate identification of the
beginning and end of the optimum range. This approach yielded a range of 2.85 to 3.011.
Similar, visual appraisal of interpolated three-dimensional plots and use of the interpolation
bandwidth for petiole principal components for Sultana on Ramsey indicated that the optimum
range for the first principal component was -0.12 and 0.14, and for Sultana on own roots, the
optimum ranges for the fourth and sixth leaf principal components were 1.82 and 2.03 and -1.24
and -1.39, respectively. There was no evidence of a clear relationship between any of the
petiole principal components and performance of Sultana on own roots.
Page 17

OPTIMISING GRAPEVINE NUTRITION
Nutrient Concentration Ranges
Having established optimum ranges in terms of the linear combination of z values comprising
the principal components, regression analyses were then carried out to relate the principal
component values back to the original nutrient concentrations. Using the regression equations
describing the concentration for each nutrient in terms of the principal component, the range for
each nutrient associated with optimum vine performance was calculated. In the case of petioles
of Sultana on own roots, where the multivariate principal components did not appear to bear
any relationship with vine performance, nutrient concentrations in the petioles associated with
optimum vine performance were estimated by using regression equations describing petiole
nutrient concentrations in terms of leaf nutrient concentrations. The results of these
calculations are presented in Tables A32 .to A35. The data did not allow confident calculation of
optimum ranges for all nutrients in both leaves and petioles.
Leaf nutrient concentration ranges for Sultana on own roots (Table A32) and Sultana on
Ramsey rootstock (Table A34) differ with respect to N, P, K, B, Mn, Fe and Zn. Leaves of
Sultana on Ramsey required higher concentrations of P, K, B, Mn and Zn for optimum
performance, lower concentrations of Fe and less !attitude was evident for leaf N in grafted
vines in comparison to vines on own roots. Concentration ranges for leaf Ca were similar, and
it was not possible to compare Mg, S, Cl and Cu concentrations.
Petiole nutrient concentration ranges for Sultana on own roots and Sultana on Ramsey
rootstock differ with respect to N, K, B and Fe (Table A33 and A35}. Lower concentrations of
N, K and B were associated with optimum performance of Sultana on own roots in comparison
to Sultana on Ramsey rootstock. Concentrations of Fe needed in the petioles of vines on
Ramsey did not appear to be as high as the concentrations of Fe required in the petioles of
Sultana on own roots. The concentration range of N in the petioles required for optimum
performance of Sultana on own roots was narrow in comparison to the concentration range for
Sultana on Ramsey rootstock. Concentration ranges for petioleS and Cu were similar, and no
comparisons were possible for petiole P, Ca, Mg, Na, Cl and Zn.
A(viii) Discussion and Conclusions
The project has indicated that petiole and leaf nutrient concentration ranges are different for
Sultana on own roots and Sultana on Ramsey rootstock. The multivariate approach used in this
project demonstrated that the range of nutrient concentrations in leaves and petioles of Sultana
on own roots and Sultana on Ramsey rootstock growing in the Sunraysia area associated with
Page 18

OPTIMISING GRAPEVINE NUTRITION
optimum yields are different. Phophorus, K, B and Zn levels in leaves and K, B and Zn levels in
petioles need to be higher in Sultana on Ramsey rootstock in comparison to Sultana on own
roots in order for nutrition to be non-limiting with respect to vine yields.
In comparison to the currently accepted grapevine petiole nutrient standards (Table A 1)
(Robinson, 1986), the adequate concentration ranges for petioles of Sultana on own roots and
Sultana on Ramsey rootstock growing in the Sunraysia area (Table A33 and A35) are generally
narrower. For example, Robinson (1986) suggests that 1.5% K or greater is adequate.
However, the multivariate approach used in this project suggests that optimum performance of
Sultana on own roots is associated with petiole K concentrations in the range of 1.9 and 2.8%.
Similarly, the accepted adequate concentration range for petiole B is 30- 100 mg, but analysis
carried out in this project suggest that optimum performance of Sultana on own roots is
associated with petiole B concentrations in the range of 40 to 54 mg/kg. The approach used to
derive the ranges presented in Tables A33 and A35 was not, however, able to provide ranges
for all nutrients. Where no estimate was possible, it was assumed that the original range
(Robinson, 1986) remains valid. A complete set of petiole nutrient standards that incorporates
the ranges estimated from this part of the project and, where no estimate was possible, the
currently accepted range, are presented in Table A36 for Sultana on own roots and in Table
A37 for Sultana on Ramsey rootstock.
Earlier discussion concerning the differences in the concentration ranges for Sultana on own
roots and Sultana on Ramsey rootstock is also applicable when comparing the accepted
standards to the concentration ranges for Sultana on Ramsey rootstock: the adequate
concentration range for P, for example, for Sultana on Ramsey rootstock falls at the higher end
of the currently accepted adequate range for petiole P.
Aside from being narrower, the petiole nutrient concentration ranges presented in Tables 33
and 35 differ from the currently accepted petiole nutrient standards (Table A 1) by the inclusion
of a more reliable robust and absolute measurement of N status and concentration ranges for S
and Fe in the petioles of Sultana on own roots and Sultana on Ramsey rootstock.
• le~~:"' ;sa~ii•cl! ~! ~,\,e~fi~ ~l~ ' .i\,Qi~~I~Ii~bi8 1~1cf~r l~an' lfei1o1liS· · Oli!hil'~\rtn~~ status of Sultana :On own roots as. itrelates to vine perfomance
;.·- ·.;:;:;:;.·.; . .. <;:;:;:;:;.:.;.;:.· . .;.:::::::-:-·.:-:.•.>:: :::·::::-.-.·,· :-:•:;:;::-:>:->.·.•>.·.·>>:<·:-: -,•.•,•,0:•,•::-:.;-;.;._ : . .;: .. •,,-:.: :<-'·,·.<.·.·.·. ·;.:-:-:-.- ·.·:·.· >:.;c., . . . . .··:.·>.·.- .·'
Page 19
OPTIMISING GRAPEVINE NUTRITION
~· · . ~~H6i~~ ~~d ~~~C~~ ·~~~~~~d ~t flowe~ng ar~ both .reliable· indicators of the nutrient
~t;!J~ ~f S~ltaria 0~ ~a~s~Y rciot~tock as itreiates to Vine petforiri~hc~ • .
• · petiole and leafnutri~nt stano~ic1s . ar~ ciiff~rent f~~ .. s~n:~~ ~n own. ~:,ts ~~~ stltana··on
R~~~;Y rb~t~t~b~. ~q~ : .. : : ..... .. . .. • ~etiblenutri~nf;t~Hd~~d$ f§F$utt~n~ gh d~dr9bts <1~~ ~ultana on Ramsey rootstock
~r~mifrov.#er, th~~ ·Pf~yiously()gc~pt~g. ) •.• <···· · ······'·· >/ ... : •
Part B. Petiole nutrient standards for Zante, Zante/Ramsey, Carina, Carina/Ramsey and Gordo
B(v} Introduction
The success of petiole sampling at flowering is dependent on having an appropriate set of nutrient
standards. Currently, Robinson's standards, based for the most part on Thompson seedless on own
roots, are used for this purpose (Robinson, 1986). There are two drawbacks in using the currently
accepted nutrient standards: they have not been validated for vines growing in Sunraysia and it is not
certain whether the same standards apply to different varieties and for vines on own roots and on
particular rootstocks.
Therefore, a study was carried out to establish suitable petiole nutrient standards for Zante,
Zante/Ramsey, Carina, Carina/Ramsey and Gordo vines. These are tentative standards and may be
revised as more nutrient data become available on these vine varieties.
B(vi} Method
The survey method was used to establish petiole nutrient standards for the other drying varieties
grown in the district. This approach involved monitoring vine petiole nutrient levels and yield in well
managed commercial vineyards over two growing seasons. From the survey, high yielding vineyards
were selected and their nutrient levels used to establish nutrient standards. Nutrient standards are
generally expressed as a range between two values and not as single individual values. Most
published standards for horticultural crops are based on such surveys (see Leece, 1968 and 1971 ,
Parsons and Eaton, 1980).
Well managed vineyards in Sunraysia were selected and surveys were carried out during 1993/94
and 1994/95. The vine varieties and the number of vineyards used in the surveys are shown below:
Page 20

Vine variety
Zante
Zante/Ramsey
Carina
Carina/Ramsey
Gordo
OPTIMISING GRAPEVINE NUTRITION
Number of vineyards assessed
15
4
9
6
11
In each vineyard, 100 petioles were collect~ at flowering from a marked row of vines. The petioles
were washed using detergent and distilled water, dried at 65•c and ground to a powder. The washing
procedure used would remove soil residues but not all spray residues of Zn, Mn and Cu.
Consequently, the results for these trace elements could be high due to the presence of spray
residues. The petiole nutrient analyses were carried out at CSIRO Division of Horticulture's Merbein
Laboratory as described earlier in Section A{ vi) of this report.
At harvest the fresh weight of the crop from the experimental row was recorded and berry sugar
levels measured. The dry weight of the crop was calculated from the fresh weight, berry sugar level
and the drying ratios (fresh/dry weight ratios) published in Figure 14.13 by Uhlig (1993).
The following procedure was used to establish petiole nutrient/salt standards for Zante,
Zante/Ramsey, Carina, Carina/Ramsey and Gordo vines: for each season, the vineyards were
ranked according to the dry weight of crop produced by the vines, the top five vineyards were
selected and the ten sets of nutrient data obtained during the two years were used to calculate the
mean value of each nutrient + or- t (P ;;:: 0.05) x standard error. The two values obtained from this
calculation are presented as the standards for nutrients in that variety/rootstock combination.
In the case of Zante/Ramsey the nutrient data of all four vineyards were used in the calculation, while
in the case of Carina/Ramsey the nutrient data of the top five of the six vineyards were used in the
calculation.
8(vii) Results
Petiole nutrient measured for Zante, Zante/Ramsey, Carina, Carina/Ramsey and Gordo vines are
presented in Table 81. The yield data for these vines are shown in Table 82.
Page 21

OPTIMISING GRAPEVINE NUTRITION
Figure B1 shows the comparison of nutrient levels for the various varieties, but some comparisons
were not made for the following reasons:
(a) Cu, Zn and Mn- results may not be accurate because of surface contamination,
(b) Fe- petiole analysis results are not a reliable indicator of Fe levels in vines,
(c) S - it does not appear to be a problem in these varieties in Sunraysia.
B(viii) Discussion and Conclusions
From Figure B1 the main differences between own rooted Zante, Carina and Gordo vines can be
summarised as:
• P - Gordo had a slightly higher value th<~m Carina and Zante vines,
• K - Gordo and Carina vines had the highest and lowest values, respectively,
• Mg - Carina vines had a higher value compared to Zante and Gordo vines,
• B- Zante vines had a broader range than Carina and Gordo vines,
• Na - Zante vines had a broader range than Carina and Gordo vines and
• Cl - Gordo vines had a broader range than Carina and Zante vines, and Cllevels in Carina were
higher than in Zante currant.
The main differences between own rooted and Ramsey rootstock Zante and Carina vines were:
• P - Rootstock vines had higher values than own rooted vines,
• K - Rootstock vines had higher values than own rooted vines,
• B - Rootstock vines tend to have a slightly higher value than own rooted vines,
• Na - Rootstock vines had distinctly lower values than own rooted vines and
• Cl - Rootstock vines had distinctly lower values than own rooted vines.
Similar differences in nutrient standards for different vine varieties has been reported by Parsons and
Eaton (1980).
A comparison between the currently accepted standard and the results of the present study are
presented in Figure C1. Nitrogen standards were not compared because the measurements of vine
N status used in the 2 sets of standards differ: Robinson (1986} uses N03-N and the standards
mentioned in this report are expressed as total N. In addition, it is not certain that N03-N is a reliable
indicator of N level in vines because it could be influenced by factors such as cultivar and rootstock
(Cook and Lider, 1964; Christensen, 1984), irrigation and rainfall (Cook, 1966}, temperature
(Christensen, 1969) and light intensity (Perez and Kliewer, 1982; Smart et.al. 1988). The main
difference between the two sets of standards are slightly higher P values in rootstock vines, generally
Page 22
OPTIMISING GRAPEVINE NUTRITION
higher K and Mg values and lower Na and Cl values in the standards developed in this component of
the project relative to the currently accepted standards (Robinson, 1986).
Part C. Magnesium deficiency in Sultana/Ramsey vines and K fertiliser.
C(v) Introduction
Sultana/Ramsey vines occasionally show Mg deficiency symptoms in vineyards during summer. The
symptoms occur in older leaves as marginal chlorosis which then gradually spreads towards the
centre of the leaf with increasing severity of Mg deficiency. Magnesium deficiency commonly occurs
on light soils and can be corrected by applying foliar sprays of a 2% solution of MgSO 4
to affected
leaves
Magnesium is an essential plant nutrient and plays several important functions in all plants.
Magnesium is a component of the chlorophyll molecule and is essential for photosynthesis
(Marschner, 1986). It is involved in the stabilisation of ribosomal particles, and in numerous enzyme
mediated biochemical reactions. Since Mg is readily transported within the plant, symptoms of its
deficiency appear first in older leaves (Marschner, 1986).
It is well documented that there is an inverse relationship between K and Mg concentrations in vines
(Cook 1966, Morris eta!. 1980, Nielson eta/. 1987, Sihamany eta/. 1988, Ruhl1991). Coutino eta/.
(1984) observed Mg deficiency when the Mg concentration in the petiole was lower than 0.25% and
the K/Mg ratio was in the range of 6 to 10. It did not occur when the ratio was less than 6, but was
Page 23

OPTIMISING GRAPEVINE NUTRITION
always found when the ratio was more than 10. According to Cook (1966) and Robinson (1986)
petiole Mg concentrations of less than 0.2% at flowering indicate Mg deficiency in grapevines.
Magnesium deficiency has been reported in acidic sandy soils especially when high rates of K
fertiliser are applied to these soils (Smith et a/ 1957). Cook {1966), in a review article on vine
nutrition, states that "with almost monotonous repetition the published reports of Mg deficiency state
that it occurs with vines in acid soils, low in cation exchange capacity (2 to 8 meq/100g), and
especially when heavy K applications are made to such soils". The adequate concentration of Mg in
the soil has been reported to be 2 meq/100g (Coutino eta/. 1984).
Phosphorus deficiency has also been reported to indirectly induce Mg deficiency in vines by affecting
the translocation of Mg from the root system to the shoots {Skinner and Mathews 1990).
Taylor ( 1992) reported high K/Mg ratios and Mg deficiency in Sultana/Ramsey vines in Sunraysia and
suggested that the deficiency may have been related to the application of K fertiliser to such vines.
Therefore, a study was carried out to determine whether the application of K fertiliser contributed to
Mg deficiency in Sultana/Ramsey vines.
Initially, the study was carried out on two vineyards which had Sultana/Ramsey vines and one
vineyard which had own rooted Sultana vines. Because the K treatments failed to induce Mg
deficiency in the initial year {1992/93) the study was continued for a further two years (93/95) on a
single vineyard with Sultana/Ramsey vines.
The measurements made in the study included cation concentrations in the petiole, cation exchange
capacity of the soil, crop produced by the vines, berry weight, sugar and acid levels in the berries at
harvest.
In addition, district vineyard survey results are presented showing that although there is an inverse
relationship between K and Mg in the petioles of Sultana on Ramsey rootstock, the vines were not
deficient in Mg at flowering, and soils in Sunraysia were not deficient in Mg.
C(vi) Method
Year 1: September 1992 to Apri/1993
The study was carried out using mature vines in three vineyards referred to as Vineyards 1, 2 and 3.
Vineyards 1 and 2 had Sultana/Ramsey rootstock vines while Vineyard 3 had own rooted Sultana
vines. Vineyards 1 and 3 had overhead irrigation while Vineyard 2 had furrow irrigation.
Page 24

OPTIMISING GRAPEVINE NUTRITION
Sultana/Ramsey vines in Vineyards 1 and 2 had a history of Mg deficiency. For treatments were
applied as shown below:
Treatments ~SO/vine, kg
KO 0
K0.2 0.2
K1 1
K1+ 1
There were 2 x 1 kg ~SO/vine treatments:in order to allow correction of any induced Mg deficiency
recorded in the K1+ treatment by applying MgSO, sprays. In addition, this would permit the study the
effect of foliar MgSO. sprays on the crop produced by the vines. Potassium sulphate was broadcast
near the vine trunk in September 1992. Potassium sulphate at 0.2 and 1 kg/vine is equivalent to 107
and 537 kg K/ha/annum; rates were much higher than the currently recommended rate of 50 kg
Klha/annum for grapevines requiring extra K. Experimental plots comprised 6 vines as 2 adjacent
rows of 3 vines. Plots were separated by 2 guard vines within rows. Treatments were applied in a
completely randomised block design and replicated 9 times in each vineyard. Petioles were collected
from opposite basal inflorescences in November 1992. The petiole samples were dried and ground to
a powder and cation concentrations measured as described in Section A(vi) of this report. Soil
samples (0-30 em depth) were collected near the vine trunk from the experimental plots in April 1993.
Five soil samples were collected from each plot and combined to form 1 sample. The soil was air
dried, ground to a powder and the cation exchange capacity measured using the method of Tucker
(1974). The crop produced in Vineyards 2 and 3 was harvested and weighed in February 1993. Crop
data could not be obtained in Vineyard 1 because the grapes were machine harvested. The effect of
the treatments was determined by analysis of variance.
Years 2 and 3: September 1993 to February 1995
The study was continued using Sultana/Ramsey vines in Vineyard 1 described above. The
treatments were similar to the earlier study except for the following dlfferences inK+ treatment: (a) in
1993 the soil was ripped in the middle of the traffic row using a ripper drawn by a tractor and the K
fertiliser placed at a depth of 30 em to facilitate movement onto the profile, and (b) in 1994 the
amount of ~so. applied in this treatment was reduced from 1 kg/vine to 0.6 kg/vine and was
broadcast on the soil surface near the vine trunk. Petiole samples were collected in November of
1993 and 1994 for determination of cation levels as described previously. Soil samples were
collected before the application of the fertiliser in September and again in November of 1993 and
Page 25

OPTIMISING GRAPEVINE NUTRITION
1994, and exchangeable K and Mg levels determined as described above Crop fresh weights were
recorded in 1995 only; extensive rain damage precluded weighing the crop in 1994. Berry weight,
brix and acid concentrations of the berries were measured in February 1994 and 1995.
Magnesium Deficiency and District Vineyard Data
Petioles were collected at flowering from Sultana/Ramsey vines in 20, 21 and 24 Sunraysia
vineyards in 1991, 1992 and 1995, respectively. The same vineyards were used in the 1991 and
1992 surveys, but the 1995 survey was on different vineyards because it formed part of another
study. In each vineyard 100 petioles were collected, dried and ground to powder and the K and Mg
levels measured as described Soil samples were collected near the vine trunk (0 -30 em depth) from
39 Sunraysia vineyards in October 1995. In each vineyard 10 soil samples were collected from a
row of 15 vines and combined to form one sample. The soil samples were dried and ground to
powder and the exchangeable K and Mg levels measured (Tucker, 1974).
C(vii) Results
Year 1: September 1992 to April1993
Cation concentrations in the petioles and K/Mg ratios in petioles collected in November 1992 are
presented in Table C 1. The application of high rates of K neither significantly alter the concentration
of any of the cations measured in petioles nor induced foliar Mg deficiency symptoms. The K/Mg
ratio in Sultana/Ramsey vines was considerably higher than in own rooted vines. The cation
exchange capacity of soil samples collected in April 1993 are shown in Table C2. The K treatments
did not significantly alter the exchange capacity of the individual cations in the soil. Potassium
fertiliser treatment only significantly increased yield in the K1+ treatment (Table C3).
Years 2 and 3: September 1993 to February 1995
Cations in the petioles and the K/Mg ratios in petioles collected in November 1993 and 1994 are
shown in Table C4. The only significant effect of K fertiliser treatment was that it increased Ca levels
in K1 and K1+ treatments in 1994. Application of K fertiliser did not induce Mg deficiency symptoms
in either year. The cation exchange capacity of soil samples collected in September and November
1993 and 1994 are shown in Table C5. Potassium fertiliser application did not significantly change
the exchange capacity of K or the other cations in the soil. The 1994 values of Ca are higher than
the previous year, but as far as is known this is not related to any experimental treatment. The fresh
weight of crop harvested in February 1995 is shown in Table C6. Potassium fertiliser treatment did
not significantly increase yield. The berry weight, brix and acid concentration in berries in February
1994 and 1995 are shown in Table C7. The effect of K fertiliser on berry acid level was not
consistent. In 1994 the acid levels appear to increase in the K1 treatment and decrease in K1+
Page 26

OPTIMISING GRAPEVINE NUTRITION
treatment. Potassium fertiliser did not have a significant effect on berry weight or brix values in either
year.
Magnesium Deficiency and District Vineyard Data
The data presented Figure C1 and Table C8 show that there was a moderately strong to strong
negative correlation between K and Mg levels in the petioles of Sultana/Ramsey vines at flowering.
However, the mean Mg levels in the petioles in district vineyards were not below the currently
accepted deficiency level, i.e. 0.2%. Only 1 site had a Mg level below 0.2% during the period of
study. Sultana/Ramsey vines had 2 -3 times the minimum requirement of Mg during 1991/92 and
1995 .. These results clearly indicate that Mg deficiency is not a problem in Sultana/Ramsey vines at
flowering in Sunraysia vineyards.
The relationship between exchangeable K and Mg in the soil in 39 vineyards is shown in Figure C2.
The mean Mg level in the soil appears to be adequate to supply the requirements of Sultana/Ramsey
vines (i.e. above 2 meq/100g). Only 5 out of the 39 vineyards had Mg levels slightly lower than 2
meq/100g. The absence of a strong negative correlation between exchangeable K and Mg in the soil
suggests that K was not associated with depressed exchangeable Mg levels in Sunraysia soils.
C(viii) Discussion and Conclusions
Although Sultana/Ramsey vines had both higher K levels and K/Mg ratios than own rooted Sultana
vines, applying high rates of K fertiliser did not induce Mg deficiency. Earlier reports of K fertiliser
induced Mg deficiency were in acid sandy soils with a cation exchange capacity of 2 to 8 meq/1 OOg
(Smith 1957 and Cook 1966). In contrast, the present study was carried out in alkaline non-sandy
soils which had a cation exchange capacity of about 25 meq/1 OOg. These differences in soil
characteristics may have been responsible for the failure to induce Mg deficiency by application of
high rates of K fertiliser. It should also be mentioned that acidic sandy soils are rare in Sunraysia.
Furthennore, application of K fertiliser failed to affect the K and Mg levels in the petioles, vine yields
or sugar and acid levels in the berries. The latter suggests that the vines already had adequate levels
of K. The results indicate that there will be no significant response to K fertiliser by Sultana/Ramsey
vines if the petiole K at flowering is over 3.5% and the soil K in spring is about 1 meq/1 OOg. Cook
(1966) reports that vines generally show a response to K only when they show visual K deficiency
symptoms. The experimental vines did not show any K deficiency symptoms.
Potassium fertiliser did not increase levels of exchangeable K in the soil. Fixation of K in the clay
minerals may have been responsible for this observation. Similar results were reported by Bula et a/
(1982).
Page 27
OPTIMISING GRAPEVINE NUTRITION
Petiole Mg data in Sunraysia vineyards indicate that Sultana/Ramsey vines had more than adequate
levels of Mg at flowering (November). It does not necessarily follow that the vines cannot develop
Mg deficiency symptoms later in the season as Mg deficiency symptoms are seen in
January/February. Soils in district vineyards appear to contain adequate levels of Mg. But Mg
deficiency can occur in soils containing adequate supplies of Mg if excessive absorption of K takes
place. The latter occurs only in acid soils (Guillobez eta/, 1990) and is unlikely in the alkaline soils of
Sunraysia.
Therefore, it appears that foliar symptoms of Mg deficiency in Sultana/Ramsey vines in
January/February may be caused by factors other than inadequate supplies of soil Mg. One such
factor may be high soil water deficit in the root-zone and the consequent low transport of Mg to the
root/soil interface by mass flow. High soil water deficit can be caused by insufficient irrigation to meet
the requirements of vigorous rootstock vines in summer. It is not uncommon to observe water
stressed Sultana/Ramsey vines in Sunraysia during summer.
:·:-·>. ··:- . . ·.·
• . ~PPJI~tior}s 9t:B :f~rtiii~er tc)}s~Jt~~a tin ~ffis~y ~j~o~k ~0 not. ~~~; symptorhs of Mg
·.: ''def1b.i~~c9t8 ~PP~~f ...... , .• ,.,"'. ::.:::.. .. :. ::::::::::-::::-::::;:::::::::::;:::::::::.:;::::::::;.;.. :·:·:·:···.·.·:·:·:·:·:·:·:·:···:··: :·:·:·:::::·:::·:::::·:::: ... ::::::::::::::.~.:=:=:::=~=:=:=:::::::>>=· :::::::;:;:;: :_.;:·:···
• . ap~:~~~t~.n·~,··bt ~··t4~ili~~~··~id.::~~··i~~;:s~··~~··,l~~el;··~···e~6t,ang!atll~···~·· in •• the• soil a(ld
Part D. Extension aids on grapevine nutrition
D(v) Introduction
Rapid diagnosis of nutrient-related vine disorders potentially could save dried vine fruit
producers money by reducing the need for costly analyses, and allowing appropriate corrective
measures to be taken. Available texts on vine nutrition (eg. Woodham and Alexander, 1970;
Christensen et a/., 1978; Bergmann, 1988; Gartel, W. 1988; Magarey et al., 1994) are not
readily accessible to local dried vine fruit producers and contain many examples of nutrient-
Page 28
OPTIMISING GRAPEVINE NUTRITION
related disorders that are extremely rare in local vineyards, leading to confusion and possibly
incorrect diagnosis and inappropriate corrective measures. Also, leaf disorders induced by
herbicides are often mis-diagnosed as nutrient related; again, this may lead to inappropriate
action. Thus, there was a need for an accessible publication that allowed rapid diagnosis of the
most common nutrient-related leaf disorders that occur in the Sunraysia district, as well as
containing clear illustrations of the symptoms caused by the various herbicides used in local
vineyards. The project team felt that the most appropriate format for such a publication was a
wall chart.
D(vi) Research Methodology
A photographic record of the foliar symptoms of common nutrient-related disorders in drying
varieties was compiled. A photographic record of the symptoms of herbicide-induced damage
to grapevines was also compiled. The exact cause of the nutrient-related symptoms was
checked by ICP analysis of the dried ground leaf tissue according to the method outlined in
section A(vi) of this report. The symptoms of herbicide-induced leaf disorders were verified
against published photographs (Pearson et at., 1988; Magarey et at., 1994).
D(vii) Results
A wall chart showing clear symptoms of nutrient-related and herbicide-induced leaf disorders
was prepared and distributed to dried vine fruit producers. A copy of the wall chart is attached
to this report.
D(viii) Discussion
Dried vine fruit producers now have the means to rapidly and correctly identify the causes of the
most common nutrient-related leaf disorders likely to be seen in vineyards in the Sunraysia
area. In addition, the wall chart allows rapid diagnosis of herbicide-induced leaf disorders, and
so ensuring that more efficacious decisions are made.
(ix) Implications and Recommendations
Sunraysia's dried vine fruit producers now have available to them a set of leaf and petiole
nutrient standards by which the nutrient status of grape vine varieties on own roots and on
Ramsey rootstock used for drying can be judged in relation to vine performance. Because the
Page 29
OPTIMISING GRAPEVINE NUTRITION
standards are based on the relationship between nutrient status and yields of vines growing in
the area and because the adequate range for most nutrients is narrower than previously
accepted, growers are more likely to get the correct signal from analytical results regarding the
nutrient status of their vineyards and hence the efficacy of their nutrient management program
will be improved, returns on inputs maximised and possibly vine performance enhanced.
In the case of Sultana on own roots, the nutrient status of the leaves, rather than petioles,
generally tended to bear a stronger relationship with vine performance, and it is recommended
that for purposes of assessing vine nutrient status in relation to vine performance leaf blades
opposite the basal inflorescence be sampled and analysed, and that the interpretation be made
using the standards set out in Tables A32 of this report. The poor relationships between petiole
nutrient status and performance of Sulta~a on own roots necessitated setting petiole standards
for Sultana on own roots on the basis of the relationship between leaf and petiole nutrient
concentrations. For this reason it is considered that the petiole standards for Sultana on own
roots are not as robust and reliable as the leaf standards. It is, therefore, not recommended
that petiole testing be used for Sultana on own roots. Leaf or petiole sampling for Sultana on
Ramsey rootstock and using the leaf or petiole nutrient standards set out in Tables A32 and
A37 are both reliable methods for assessing the nutrient status of Sultana on Ramsey in
relation to vine performance.
It is recommended that for assessing the nutrient status of Carina and Zante currant on own
roots and on Ramsey rootstock and Gordo on own roots the ranges described in Table 81 be
used.
On-going monitoring and use of these nutrient ranges will allow dried vine fruit producers to
modify their vineyard nutrient management program to ensure that vine nutrient status is non
limiting with respect to vine performance and to maximise returns.
(x) Intellectual Property Rights arising from the Project
The information obtained in this study will be published and will enter into the public domain.
(xi) Technical Summary of Information Developed
Page 30
OPTIMISING GRAPEVINE NUTRITION
Ranges of nutrient concentrations in leaves and petioles at flowering associated with optimum
performance of Sultana on own roots and Sultana on Ramsey rootstock were developed using
a multivariate measure of the concentration of individual nutrients in a compositional array of
nutrients and principal component analysis. The concentrations of nutrients associated with
optimum performance of Sultana on own roots and Sultana on Ramsey rootstock differed.
Ranges of nutrient concentrations in petioles at flowering associated with high yielding Zante
currants and Carina on own roots and on Ramsey rootstock and Gordo on own roots were
defined using a survey approach. The standards developed differed between varieties , and,
within varieties, between rootstocks.
Magnesium deficiency symptoms in Sultana vines on Ramsey rootstock are caused by factors
other than low soil Mg or high rates of K fertiliser application.
(xii) Acknowledgements
The authors wish to thank Ms Donna Milne for the meticulus attention to detail in all the analytical work carried out as part of this project, and for the many field operations required to assess vine performance.
We acknowledge the advice of Dr Ray Carrel and Ms Angela Reid of CSIRO Mathmatics and Statistics and the Biometrics Unit of Agriculture Victoria in the design of the trials and analysis of the data. We especially thank Messrs. Berton, Cook, Gledhill, Harrison, Horsfall and Mazza, who allowed the large scale trials of this project to be conducted on their properties, and the many growers who helped to carry out the nutrient and yield survey.
Mr Mark Dale and Dr.B.K. Taylor are thanked for reviewing parts of this report, and Dr.B.K. Taylor is also thanked for instigating the K!Mg balance part of the project and for carrying out all the work during 1992/93 season.
We also thank Mr Ted Lawton and Mrs Lyn Jacka for taking the many photographs needed to compile the poster and Ms Donna Milne for carrying out the analyses needed to verify the cause of the nutrient-related disorders.
Finally, we gratefully acknowledge the support of the Dried Fruit Research and Development Council.
(xiii) References
Aitchison, J. 1983. Principal component analysis of compositional data. Biometrika 70, 57-65.
Alexander, D. McE. and Woodham, R.C. 1970. Chemical composition of leaf tissues of Sultana vines grown in nutrient solutions deficient in macro elements. Vitis 9, 207-217.
Page 31

OPTIMISING GRAPEVINE NUTRITION
Arbabzadeh, F. and Dutt, G. 1987. Salt tolerance of grape rootstocks under glasshouse conditions. American Journal of Enology and Viticulture 38, 95-99.
Bates, V. 1989. Petiole analysis for nutrient management. Australian Dried Fruit News NS 16(5), 14.
Beaufils, E.R. 1973. Diagnosis and Recommendation Integrated System (ORIS}. Soil Science Bulletin No 1. University of Natal, Pietermaritzburg.
Bergmann, W. 1988. Emahrungsstorungen bei Kulturpflanzen. Gustav Fischer Verlag, Stuttgart. ISBN 3-437-30562-X.
Bielski, R.L. 1973. Phosphate pools, phosphate transport, and phosphate availability, Annual Review of Plant Physiology24, 225-252.
Brechbuhler. Ch., Dietrich, J.V. and Levy, J.F. 1968. Les carences Magnesiennes en Alsace: diagnostic et correction. Vignes et vins 173, 19-29.
Bula, E. , Nemketh, K., Panezel, M. , Prileszky, G. and Kohalami, H. 1982. Potash Review, Subject 29, 11th Suite No.3. 4 pp.
Christensen, P. 1969. Seasonal changes and distribution of nutritional elements in Thompson seedless grapevines. American Journal of Enology and Viticulture 20, 176-190.
Christensen, P. 1984. Nutrient level comparisons of leaf petioles and blades in twenty-six grape cultivars over three years (1979 through 1981}. American Journal of Enology and Viticulture 35, 124-133.
Christensen, L.P.; Kasimatis, A.N. and Jensen, F.L. 1978. Grapevine nutrition and fertilization in the San Joaquin Valley. University California Division Agricultural Science, Berkley, Publication No. 4087.
Cook, J.A. 1966. Grape nutrition. In Childers, N.F. (Ed.) Temperate to Tropical Fruit Nutrition. pp 777-812. Horticultural Publications, New Brunswick.
Cook, J.A. and Kishaba, T. 1956. Petiole nitrate analysis as a criterion of nitrogen needs in California vineyards. Proceedings of the American Society of Horticultural Science 68, 131-140.
Cook, J.A. and Lider, L.A. 1964. Mineral composition of bloomtime grape petiole in relation to rootstock and scion variety behaviour. Proceedings of the American Society of Horticultural Science 84, 243-254.
Coombe, B.G. Grape Phenolgy. In Coombe, B.G. and Dry, P.R. (Eds.) Viticulture. Volume 1. Resources in Australia. Australian Industrial Publishers, Adelaide. 1988.
Coutinho, J.F. , Ahlrichs, J.L. and Magalhaes, N.P. 1984. Magnesium, potassium and calcium nutrition in the vineyards with acid soils of the Douro Valley, Portugal. Progress-Agricole-etViticole 101 , 128-135. [Seen in Horticultural Abstracts, 1984, 054-03330] .
Downton, W.J.S. 1985. Growth and mineral composition of the sultana grapevine as influenced by salinity and rootstock. Australian Journal of Agricultural Research 36, 425-434.
Dumkow, K. 1966. Versuche zur Physiologie des Magnesiummangels bei der Rebe. 2. Mitt. Untersuchungen Ober die Mineralstoffgehalte gesunder und an der Magnesiummangelchlorose erkrankter Rebblatter. Wein Wissenschaft 21, 403-425.
Page 32

OPTIMISING GRAPEVINE NUTRITION
Gartel, W. 1988. Nutrient Disorders. In Pearson, R.C. and Goheen, A. (Editors) Compendium of Grape Diseases. APS Press, St Paul. ISBN 0-89054-088-8.
Guillobez, S., Costaing, X. and Sallee, B. 1990. Potassium-Mg antagonism in Arabica coffee in the West Cameron region. The Cafe-Cacao 34, 265-280. [Seen in Horticultural Abstracts, 1992, 062-00834].
Heanes, D. 1982. Determination of nitrate-N by an improved extraction procedure adapted for ultraviolet spectrophotometry. Communications in Soil Science and Plant Analysis 13, 803-818.
Hiscox, J.D. and lsraelstam, G.F. 1979. A method for the extraction of chlorophyll from leaf tissue without maceration. Canadian Journal of Botany 57, 1332-1334.
Holland, D.A. 1966 The interpretation of leaf analyses. Journal of Horticultural Science 41 , 311-329.
lezzoni, A. and Pritts, M.P. 1991. Applications of principal component analysis to horticultural research. HortScience 26, 334-342.
Jeffers, J.N.R. 1967. Two case studies in the application of principal component analysis. Applied Statistics 16, 225-236.
Kliewer, W.M. 1971. Effect of nitrogen on growth and composition of fruit from Thompson Seedless' grapevines. Journal of the American Society of Horticultural Science 96, 816-819.
Leece, D.R. 1968. The concept of leaf analysis of fruit trees. The Journal of the Australian Journal of Agricultural Science 34, 146-153.
Leece, D.R., Cradock, F.W. and Carter, O.G. 1971. Development of leaf nutrient concentration standards for peach trees in New South Wales. Journal of Horticultural Science 46, 163-175.
Magarey, P.A., Wachtel, M.F. and Nicholas, P.R. 1994. Disorders and Injuries. In Diseases and Pests. Grape Production Series Number 1. Winetitles, Adealaide. ISBN1-875130-15-2.
Marschner, H. 1986. Mineral Nutrition of Higher Plants. Academic Press, London. ISBN 0-12-473540-1.
Marschner, H. and Schropp, A. 1977. Vergleichende Untersuchungen Uberdie Empfindlichkeit von 6 Unterlagensorten der Weinrebe gegenUber Phosphatinduziertem Zink-Mangel. Vitis 16, 79-88.
Moran, R. 1982. Formulae for determination of chlorphyllous pigments extracted with N,Ndimethylformamide. Plant Physiology69, 1376-1381.
Morris, J.R., Cawthon, D.L. and Flemming, J.W. 1980. Effects of high rates of potassium fertilisation on raw product quality and changes in pH and acidity during storage of Concord grape juice. American Journal of Enology and Viticulture 31 ,323-328.
Nagarajah, S. 1989a. Potassium deficiency - A major problem in Sunraysia vineyards. Australian Dried Fruit News NS 16(5), 21-23.
Nagarajah, S. 1989b. Increasing vineyard productivity through improved mineral nutrition. Australian Dried Fruit News NS 16(5), 15-17.
Nagarajah, S. 1989c. Boron deficiency symptoms in Zante currants. Australian Dried Fruit News NS 16(5), 18-19.
Page 33
OPTIMISING GRAPEVINE NUTRITION
Nagarajah, S. 1989d. Leaf stalk analysis is being used to identify poor yields in Sultana vines. Rural Quarterly 2(4), 22-23.
Nielson, G.H., Stevenson, D.S. and Gohringen, A. 1987. The effect of NPK fertilisation on element uptake, yield and fruit composition of Foch grapes in British Columbia. Canadian Journal of Plant Science 67, 511-520.
Payne, R.W.; Lane, P.W.; Digby, P.G.N.; Harding, S.A.; Leech, P.K.; Morgan, G.W.; Todd, A.D.; Thompson, R.; Tunnicliffe Wilson, G., Welham, S.J. and White, R.P. 1993. GenstatT"' Release 3 Reference Manual. Clarenden Press, Oxford. ISBN 0-19-852312-2.
Parent, L.E. and Dafir, M. 1992. A theoretical concept of compositional nutrient diagnosis. Journal of the American Society of Horticultural Science 117, 239-242.
Parsons, D.C. and Eaton , G.W. 1980. Nutrient content of the petioles of some grape cuttivars in British Columbia. Canadian Journal of Plant Science 60, 873-877.
Pearson, R.C., Pool, R.M. and Jubb, G.L. :1988. Pesticide Toxicity. In Pearson, R.C. and Goheen, A. (Eds) Compendium of Grape Diseases. APS Press, St Paul. ISBN 0-89054-088-8.
Penman, F.; Hubble, G.D.; Taylor, J.K. and Hooper, P.O. 1940. A soil survey of the Mildura Irrigation Settlement, Victoria. Council for Scientific and Industrial Research, Bulletin No. 133.
Penman, F. and MrAipin, D.M. 1949. Boron poisoning in citrus. The Journal of Agriculture, Victoria 47,181-189.
Penman, F.; Taylor J.K.; Hooper, P.O. and Marshall, T.J. 1939. A soil survey of the Merbein Irrigation District, Victoria Council for Scientific and Industrial Research, Bulletin No. 123.
Perz, J.R. and Kliewer, W.M. 1982. Influence of light regime and nitrate fertilisation on nitrate reductase activity and concentrations of nitrate and arginine in tissues of three cultivars of grapevines. American Journal of Enology and Viticulture 33, 86-93.
Reuter, D.J.; Robinson, J.B.; Peverill, K.l. and Price, G.H. 1986. Guidelines for collecting, handling and analysing plant material. In Reuther, D.J. and Robinson, J.B. (eds.) Plant Analysis: An Interpretation Manual. pp 20-33. lnkata Press. Melbourne and Sydney. ISBN 0 909605 41 6.
Robinson, J.B. and McCarthy, M.G. 1985. Use of petiole analysis for assessment of vineyard nutrient status in the Barossa district of South Australia. Australian Journal of Experimental Agriculture 25, 231-240.
Robinson, J.B., Nicholas, P.R. and McCarthy, M.G. 1985. Use of petiole analysis for assessment of vineyard nutrient status in the Barossa district of South Australia. Australian Journal of Experimental Agriculture 25, 231-240.
Robinson, J.B. 1986. Fruits, vines and nuts. In Reuther, D.J. and Robinson. J.B. (eds.) Plant Analysis: An Interpretation Manual. pp 120-147. lnkata Press, Melbourne and Sydney. ISBN 0 909605 41 6.
Ruhl, E.H. 1989. Uptake and distribution of potassium by grapevine rootstocks and its implication for grape juice pH of scion varieties. Australian Journal of Experimental Agriculture 29, 707-712.
Ruhl, E.H. 1991 . Effect of potassium supply on cation uptake and distribution in grafted Vitis champinii and Vitis berlandieri x Vitis rupestris rootstocks. Australian Journal of Experimental Agriculture 31, 687-691.
Page 34
OPTIMISING GRAPEVINE NUTRITION
Ruhl, E.H.; Clingeleffer, P.R.; Nicholas, P.R.; Cirami, R.M.; McCarthy, M.G. and Whiting, J.R. 1988. Effect of rootstocks on berry weight and pH, mineral content and organic acid concentrations of grape juice of some wine varieties. Australian Journal of Experimental Agriculture 28, 119-125.
Shikhamany, S.D., Chelvan, R.C. and Chadha, K.L. 1988. The effect of varying levels of nitrogen and potash on petiole nutrient content in Thompson Seedless grapes (Vitis Vinifera). Indian Journal of Horticultural Science 45, 180-188.
Skinner, P.W. ; Cook, J.A. and Mathews, M.A. 1988. Responses of grapevine cvs Chenin blanc and Chardonnay to phosphorus fertiliser applications under phosphorus-limited soil conditions. Vitis 27, 95-109.
Skinner, P.W. and Mathews, M.A. 1989. Reproductive development in grape (Vitis vinifera L.) under phosphorus-limited conditions. Scientia Horticulturae 38, 49-60.
Skinner,P.W. and Mathews, M.A. 1990. A novel interaction of magnesium translocation with the supply of phosphorus to the roots of grapevine (Vftis vinifera L). Plant and Cell Environment 13, 821-826.
Smart, R.E., Smith, S.M. and Winchester, R.V. 1988. Light quality and quantity effects on fruit ripening for Cabemet Sauvignon. American Journal of Enology and Viticulture 39,250-258.
Smith, C.B. , Flemming, H.K. and Poorbagh, H.J. 1957. The nutritional status of Concord grape vines in Erie County, Pennsylvania, as indicated by petiole and soil analysis. Proceedings of the American Society for Horticultural Science 70, 189-196.
Smith, F.W. 1986. Interpretation of plant analysis. In Reuther, D.J. and Robinson, J.B. (eds.) Plant Analysis: An Interpretation Manual. pp 1-12. lnkata Press, Melbourne and Sydney. ISBN 0 90960541 6.
Sokal, R.R. and Rohlf, F.J. 1981. Biometry. The Principles and Practice of Statistics in Biological Research. 2nd Edition. W.H. Freeman and Company, San Francisco. ISBN 0-7167-1254-7.
Sykes, S.R. 1985. Variation in chloride accumulation by hybrid vines from crosses involving the cultivars Ramsey, Villard blanc and Sultana. American Journal of Enology and Viticulture 36, 30-37.
Taylor, B.K. 1992. The potassium/magnesium balance in grafted Sultana vines. Australian Dried Fruit News N.S. 19(3), 16-17.
Tucker, B.M. 1974. Laboratory procedures for cation exchange measurements on soils. CSIRO Division of Soils, Technical paper No.23.
Uhlig, B. 1993. Physiological, Ecological and Drying Emulsion Effects on the Quality of Dried "Sultana" Grapes (Vitis vinifera L.). PhD thesis, Bonn University. Verlag M. Wehle, Witterschlick/Bonn. ISBN 3-925267-67-0.
Ulrich, A. 1942a. Potassium content of grape leaf petioles and blades contrasted with soil analyses as an indicator of the potassium status of the plant. Proceedings of the American Society of Horticultural Science 41, 204-212.
Ulrich, A. 1942b. Nitrate content content of grape leaf petiole as an indicator of the nitrogen status of the plant. Proceedings of the American Society of Horticultural Science 41, 213-218.
Weaver, R.J. 1976. Grape Growing. John Wiley and Sons, Inc. ISBN 0 -471-92324-9.
Page 35
OPTIMISING GRAPEVINE NLJTRITION
Winkler, A.J., J.A.Cook, W.M. Kliewer and L.A. Lider 1974. General Viticulture, 2nd ed. University of California Press, Los Angeles, pp 432.
Woodham, R.C. and Alexander, D. McE. 1970. Foliar symptoms of malnutrition in the Sultana vine. CSIRO Australia Division of Horticultural Research Technical Communication Paper No. 1.
Page 36

Table A1. Petiole nutrient concentration ranges for grapevines (Robinson, 1986)
Concentration range
Toxic or Nutrient Deficient Marginal Critical Adequate High Excessive
N03-N (mg/kg) < 340 340-500 500- 1200 > 1200 p (%) < 0.15 0.15-0.20 0.2- 0.3 0.2- 0.46 > 0.46 K (%) < 1.0 1.0-1.5 > 1.5 Ca (%) 1.2 - 2.5 Mg (%) < 0.2% 0.2- 0.3 > 0.3 Na (%) > 0.5 Cl (%) > 1.0 or 1.5 B (mg/kg) < 25 26-30 30 - 100 > 100 Cu (mg/kg) <3 3-6 >6 Mn (mg/kg) < 20 20-25 > 25 Zn (mg/kg) < 15 15- 26 > 26

Table A2. Summary of statistical analyses of fertiliser treatment effects on agronomic performance indices for Sultana on own roots. Key to statistical analysis: ns, not significant at P=0.05; *, significant at P=0.05; **, significant at P=0.01 ; ***, significant at P=0.001
Shoots/vine Bunch/ Bunch: Shoots/ Berry wt Brix Dried fruit Fresh Dried Fresh wt1 Berries Petiole vine shoot ratio cane yield/bearer yield/ yield bunch bunch drywt
vine vine
N *** s * * * *** ns ** * * ** ns p ns ns ns ns * ns ns ns ns ns ns ns K ns ns ns ns ns ns ns ns ns ns ns *
N*P ns ns ns ns ns ns ns ns ns ns ns ** N*K * ns ns ns ns * ns I"}~ ns ** ** ns P*K ns ns ns * ** ns ns ns ns ns ns ns
N*P*K *** ns ns *** ns ns ns ns * ns ns **
Table A3. Summary of statistical analyses of fertiliser treatment effects on agronomic performance indices for Sultana on own roots using canes wrapped down as a covariate. Key to statistical analysis: ns, not significant at P=0.05; *, significant at P=0.05; **, significant at P=0.01 ; ***, significant at P=0.001
Shoots/vine Berry wt Brix Dried fruit Fresh Dried Fresh wtl Berries Petiole /cane yield yield bunch bunch drywt
vine vine
N ** ns ** ns ns ns ns ns * p ns ns * ns ns ns ns ns ns K ns * ns *** *** *** ns ns ns
N*P ns ns ns ns ns ns ns ns * N*K ns ns * ns ns ns ns ns ns P*K ns ns ns ns ns ns ns ns ns
N*P*K * ns ns ns ns ns ns ns ** Covariate *** ns ns *** *** *** ns ns *

Table A4. Summary of statistical analyses of fertiliser treatment effects on agronomic performance indices for Sultana on Ramsey rootstock. Key to statistical analysis: ns, not significant at P=0.05; *, significant at P=0.05; **, significant at P=0.01; ***, significant at P=0.001
Shoots/vine Bunch/ Bunch: Shoots Berry wt Brix Dried fruit Fresh Dried Fresh wt1 Berries Petiole vine shoot ratio cane /cane yield yield bunch bunch drywt
vine vine
N ns *** *** ns *** ns *** *** *** ns ns *** p * ns ns * ns * ns * * ns ns ns K ** ns ** * ns ns ns ns ns ns ns ***
N*P * * ns * * ns ns ns ns * * ns N*K *** ns ns ns * ns ns ** ** ns ns ns P*K ns ns ns ns ** ns ns ns ns ns ns ns
N*P*K *** *** ** ns ns ns ns ns ns ** ** **
Table A5. Summary of statistical analyses of fertiliser treatment effects on agronomic performance indices for Sultana on Ramsey rootstock using canes wrapped down as a covariate. Key to statistical analysis: ns, not significant at P=0.05; *, significant at P=0.05; **, significant at P=0.01 ; ***, significant at P=0.001
Shoots/vine Berry wt Brix Dried fruit Fresh Dried Fresh wt/ Berries Petiole /cane yield yield bunch bunch dry wt
vine vine
N ns *** ns *** *** *** ns ns *** p ns ns * ns ns ns ns ns ns K *** * ns ns ns ns ns ns **
N*P ns ns * ns ns ns ns ns ns N*K ns ns ns ns ns ns ns ns ns P*K ns ns ns ns ns ns ns ns ns
N*P*K ns ns ns ns ns ns ns ns * Covariate ** *** ns ns *** *** ** ** *

Table A6. Fertiliser main effects on yield of dried fruit per vine of Sultana on own roots .. Different superscripts within rows indicate significant differences between treatment means at P=0.05.
An absence of superscripts indicates that there was no significant effect.
0 2.251A8
0 2.257
0 2.210
kg dried fruit per vine
kg N/ha/y 40
2.152A
kg P/ha/y
kg K!ha/y
80 2.3188
20 2.223
50 2.271
Table A7. Fertiliser main effects on yield of dried fruit per vine of Sultana on Ramsey rootstock. Different superscripts within rows indicate significant differences between treatment means at P=0.05. An
absence of superscripts indicates that there was no significant effect.
kg dried fruit per vine
kg N/ha/y 0 40 80
3.269A 3.585 ... 4.1998
kg P/ha/y 0 20
3.774"' 3.5958
kg Klha/y 0 50
3.689 3.680
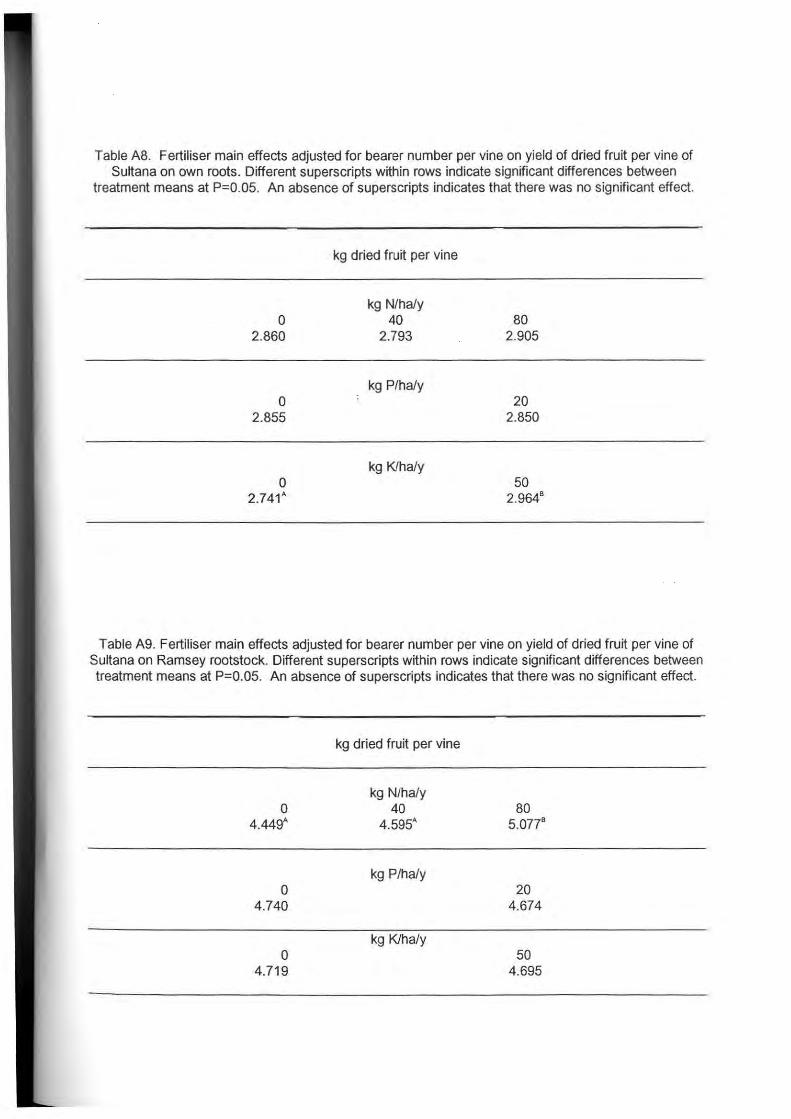
Table A8. Fertiliser main effects adjusted for bearer number per vine on yield of dried fruit per vine of Sultana on own roots. Different superscripts within rows indicate significant differences between
treatment means at P=0.05. An absence of superscripts indicates that there was no significant effect.
kg dried fruit per vine
kg N/ha/y 0 40 80
2.860 2.793 2.905
kg P/ha/y 0 20
2.855 2.850
kg Klha/y 0 50
2.741A 2.9646
Table A9. Fertiliser main effects adjusted for bearer number per vine on yield of dried fruit per vine of Sultana on Ramsey rootstock. Different superscripts within rows indicate significant differences between treatment means at P=0.05. An absence of superscripts indicates that there was no significant effect.
kg dried fruit per vine
kg N/ha/y 0 40 80
4.449A 4.595A 5.0776
kg P/ha/y 0 20
4.740 4.674
kg K/ha/y 0 50
4.719 4.695
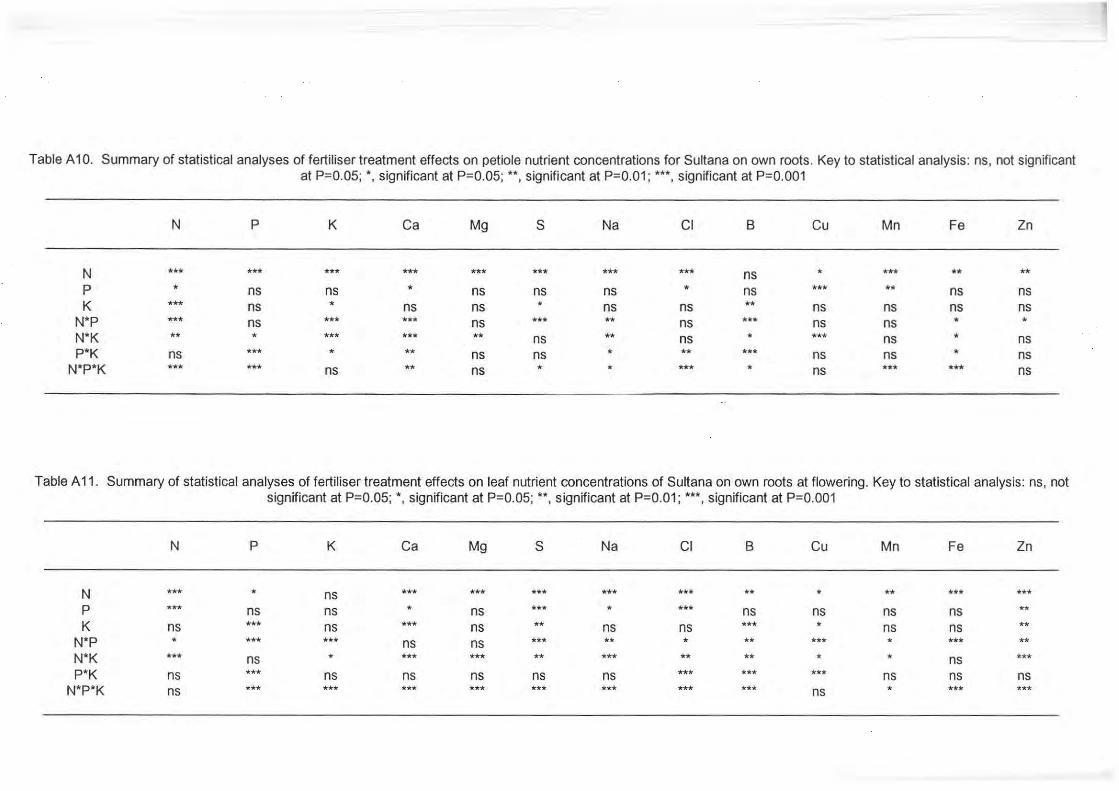
Table A 10. Summary of statistical analyses of fertiliser treatment effects on petiole nutrient concentrations for Sultana on own roots. Key to statistical analysis: ns, not significant at P=0.05; *, significant at P=0.05; **, significant at P=0.01; ***, significant at P=0.001
N p K Ca Mg s Na Cl B Cu Mn Fe Zn
N *** *** *** *** *** *** *** *** ns * *** ** ** p * ns ns * ns ns ns * ns *** ** ns ns K *** ns * ns ns * ns ns ** ns ns ns ns
N*P *** ns *** *** ns *** ** ns *** ns ns * * N*K ** * *** *** ** ns ** ns * *** ns * ns P*K ns *** * ** ns ns * ** *** ns ns * ns
N*P*K *** *** ns ** ns * * *** * ns *** *** ns
Table A 11. Summary of statistical analyses of fertiliser treatment effects on leaf nutrient concentrations of Sultana on own roots at flowering. Key to statistical analysis: ns, not significant at P=0.05; *, significant at P=0.05; **, significant at P=0.01; ***,significant at P=0.001
N p K Ca Mg s Na Cl B Cu Mn Fe Zn
N *** * ns *** *** *** *** *** ** * ** *** *** p *** ns ns * ns *** * *** ns ns ns ns ** K ns *** ns *** ns ** ns ns *** * ns ns **
N*P * *** *** ns ns *** ** * ** *** * *** ** N*K *** ns * *** *** ** *** ** ** * * ns *** P*K ns *** ns ns ns ns ns *** *** *** ns ns ns
N*P*K ns *** *** *** *** *** *** *** *** ns * *** ***

Table A 12. Summary of statistical analysis of fertiliser treatment effects on petiole nutrient concentrations for Sultana on Ramsey rootstock. Key to statistical analysis: ns, not significant at P=0.05; *, significant at P=0.05; **, significant at P=0.01; ***, significant at P=0.001
N p K Ca Mg s Na Cl B Ca Mn Fe Zn
N *** *** *** ** *** *** ns *** *** ns *** ns *** p ns *** * ns ns ns ns *** ns *** ns ns ns K ** ns ns *** * * *** ns * ns * ns **
N*P ns ns ** *** * * ns *** *** ns * ** *** N*K ns *** ns * ns ** *** *** ** *** ns ** ns P*K ** ns ns ns ns ns ns ns ns ns *** *** ns
N*P*K ns ** *** ** ns *** ns ns ** *** ns ns **
Table A 13. Summary of statistical analyses of fertiliser treatment effects on leaf nutrient concentrations for Sultana on Ramsey rootstock. Key to statistical analysis: ns, not significant at P=0.05; *, significant at P=0.05; **,significant at P=0.01; ***,significant at P=0.001
N p K Ca Mg s Na Cl B Cu Mn Fe Zn
N *** ns * ns ns ns ns *** ns * ** ** ns p ns ns ns ns ns ns *** * *** ns ** * ns K *** ns ns *** ns *** ** * ns *** ns *** ***
N*P * ns ns ns * * ** ns ns *** *** *** ns N*K ns * ns ns ns ns ns *** *** ns * * * P*K ns ** * *** ns *** ns ns * *** * ns *
N*P*K * ns ** ns ns ns ns * ** * * ns **
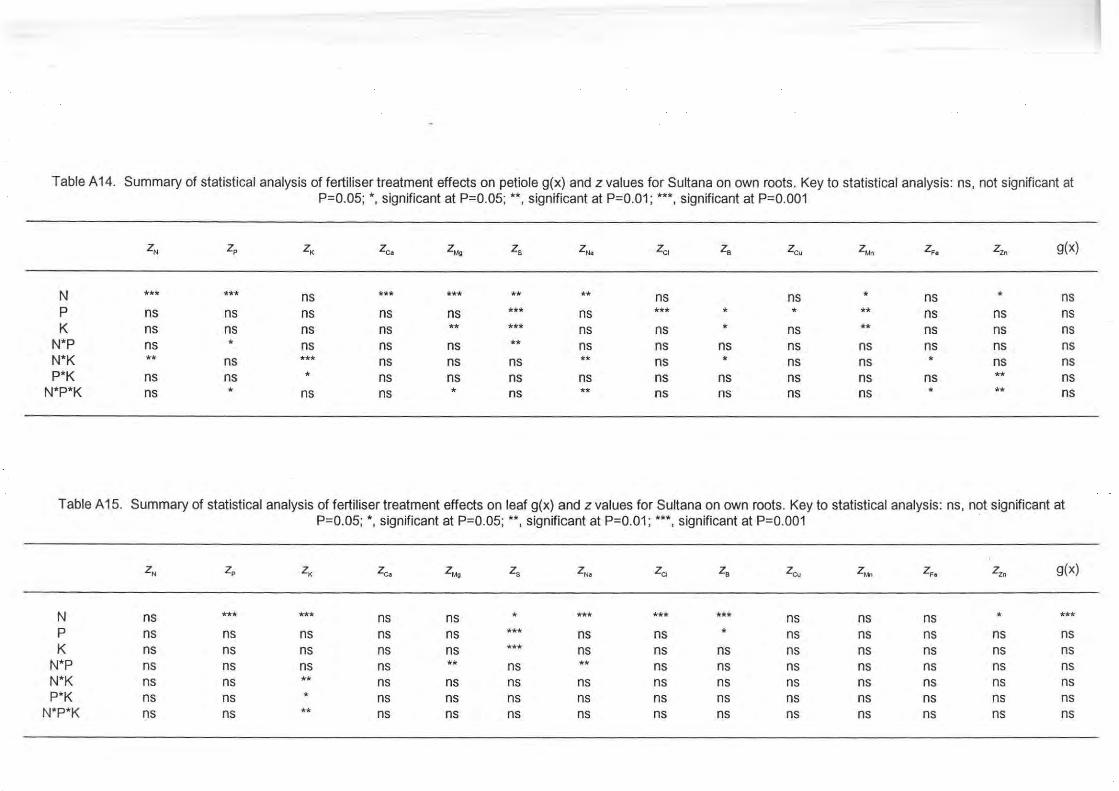
Table A 14. Summary of statistical analysis of fertiliser treatment effects on petiole g(x) and z values for Sultana on own roots. Key to statistical analysis: ns, not significant at P=0.05; *, significant at P=0.05; **, significant at P=0.01; ***, significant at P=0.001
ZN Zp ZK Zc. ZMg Zs zN. Za ZB Zcu z., zF. zm g(x)
N *** *** ns *** *** ** ** ns ns * ns * ns p ns ns ns ns ns *** ns *** * * ** ns ns ns K ns ns ns ns ** *** ns ns * ns ** ns ns ns
N*P ns * ns ns ns ** ns ns ns ns ns ns ns ns N*K ** ns *** ns ns ns ** ns * ns ns * ns ns P*K ns ns * ns ns ns ns ns ns ns ns ns ** ns
N*P*K ns * ns ns * ns ** ns ns ns ns * ** ns
Table A 15. Summary of statistical analysis of fertiliser treatment effects on leaf g(x) and z values for Sultana on own roots. Key to statistical analysis: ns, not significant at P=0.05; *, significant at P=0.05; **, significant at P=0.01; ***, significant at P=0.001
ZN Zp ZK Zc. ZMg Zs zN. Zc, Zs Zcu z"'" zF. Zzn g(x)
N ns *** *** ns ns * *** *** *** ns ns ns * *** p ns ns ns ns ns *** ns ns * ns ns ns ns ns K ns ns ns ns ns *** ns ns ns ns ns ns ns ns
N*P ns ns ns ns ** ns ** ns ns ns ns ns ns ns N*K ns ns ** ns ns ns ns ns ns ns ns ns ns ns P*K ns ns * ns ns ns ns ns ns ns ns ns ns ns
N*P*K ns ns ** ns ns ns ns ns ns ns ns ns ns ns
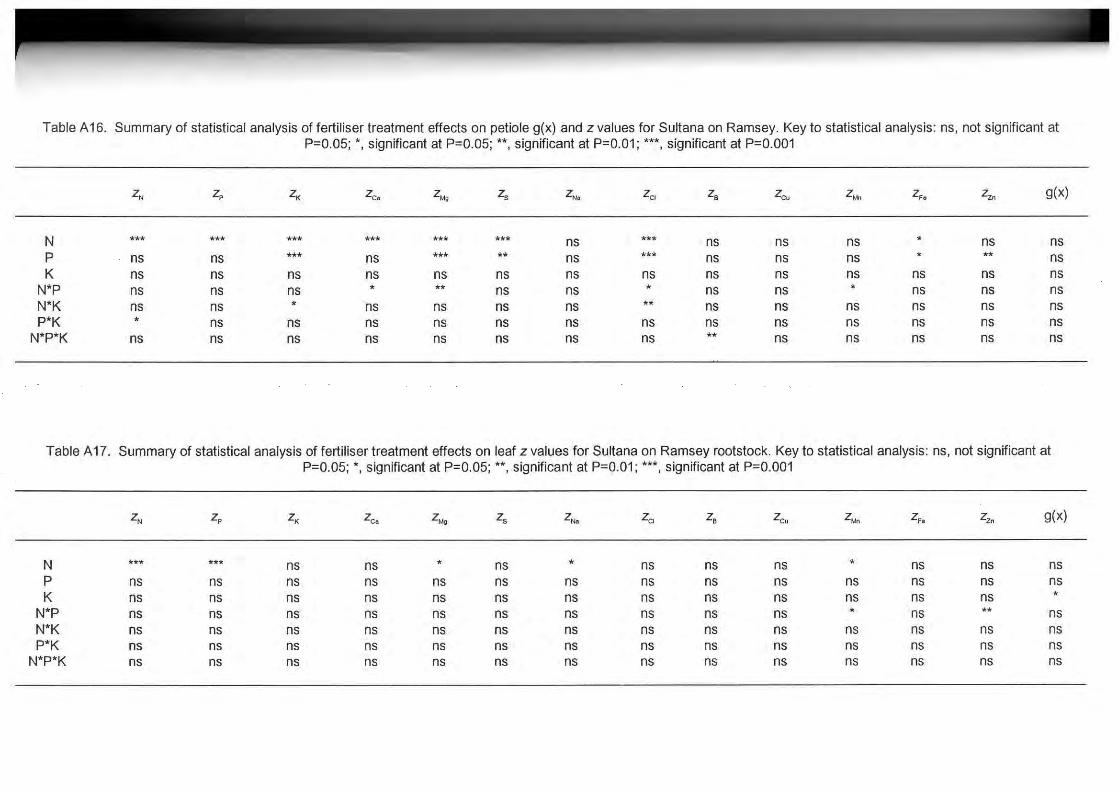
Table A 16. Summary of statistical analysis of fertiliser treatment effects on petiole g(x) and z values for Sultana on Ramsey. Key to statistical analysis: ns, not significant at P=0.05; *, significant at P=0.05; **, significant at P=0.01; ***, significant at P=0.001
ZN Zp ZK Zc. ZMg Zs z N. ZCI ZB Zcu ZMn z F. Zzn g(x)
N *** *** *** *** *** *** ns *** ns ns ns * ns ns p ns ns *** ns *** ** ns *** ns ns ns * ** ns K ns ns ns ns ns ns ns ns ns ns ns ns ns ns
N*P ns ns ns * ** ns ns * ns ns * ns ns ns N*K ns ns * ns ns ns ns ** ns ns ns ns ns ns P*K * ns ns ns ns ns ns ns ns ns ns ns ns ns
N*P*K ns ns ns ns ns ns ns ns ** ns ns ns ns ns
Table A17. Summary of statistical analysis of fertiliser treatment effects on leaf z values for Sultana on Ramsey rootstock. Key to statistical analysis: ns, not significant at P=0.05; *,significant at P=0.05; ** , significant at P=0.01; *** , significant at P=0.001
ZN Zp ZK Zc. ZMg Zs zN. Zcl ZB Zcu ZMn zF. Zzn g(x)
N *** *** ns ns * ns * ns ns ns * ns ns ns p ns ns ns ns ns ns ns ns ns ns ns ns ns ns K ns ns ns ns ns ns ns ns ns ns ns ns ns *
N*P ns ns ns ns ns ns ns ns ns ns * ns ** ns N*K ns ns ns ns ns ns ns ns ns ns ns ns ns ns P*K ns ns ns ns ns ns ns ns ns ns ns ns ns ns
N*P*K ns ns ns ns ns ns ns ns ns ns ns ns ns ns
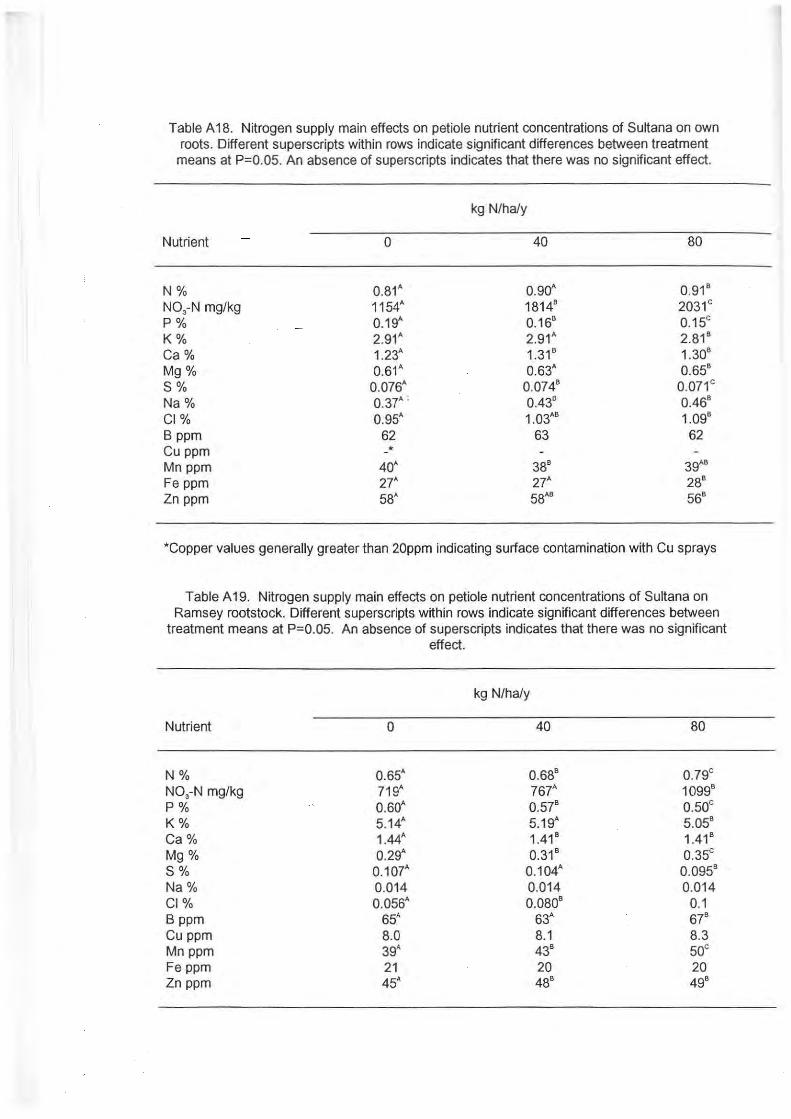
Table A18. Nitrogen supply main effects on petiole nutrient concentrations of Sultana on own roots. Different superscripts within rows indicate significant differences between treatment
means at P=0.05. An absence of superscripts indicates that there was no significant effect.
kg N/ha/y
Nutrient 0 40 80
N% 0.81 ... 0.90 ... 0.91 8
N03-N mg/kg 1154 ... 18148 2031c P% 0.19 ... 0.168 0.15c
K% 2.91 ... 2.91 ... 2.81 8
Ca% 1.23 ... 1.31 8 1.308
Mg% 0.61 ... 0.63 ... 0 .658
S% 0.076 ... 0.0748 0.071 c Na% 0.37 ... : 0.438 0.468
Cl% 0.95A 1.03A8 1.098
B ppm 62 63 62 Cu ppm -* Mn ppm 40 ... 388 39A8
Fe ppm 27 ... 27A 288
Zn ppm 58 ... 58A8 568
*Copper values generally greater than 20ppm indicating surface contamination with Cu sprays
Table A19. Nitrogen supply main effects on petiole nutrient concentrations of Sultana on Ramsey rootstock. Different superscripts within rows indicate significant differences between
treatment means at P=0.05. An absence of superscripts indicates that there was no significant effect.
kg N/ha/y
Nutrient 0 40 80
N % 0.65A 0.688 0.79c N03-N mg/kg 719A 767A 10998
P% 0.60A 0.578 0.50c K% 5.14A 5.19 ... 5.058
Ca% 1.44 ... 1.418 1.418
Mg% 0.29A 0.31 8 0.35c S% 0.107A 0.104 ... 0.0958
Na % 0.014 0.014 0.014 Cl% 0.056A 0.0808 0.1 B ppm 65A 63A 678
Cu ppm 8.0 8.1 8.3 Mn ppm 39"' 438 50c Fe ppm 21 20 20 Z n ppm 45A 488 498
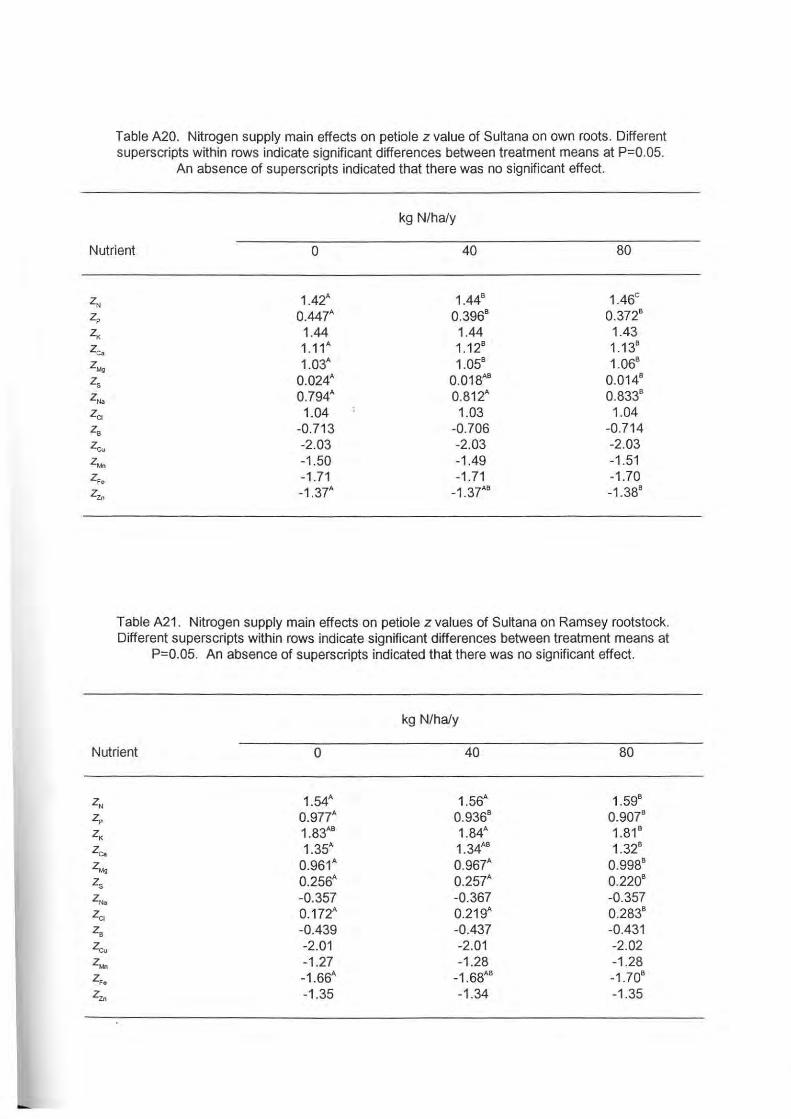
Table A20. Nitrogen supply main effects on petiole z value of Sultana on own roots. Different superscripts within rows indicate significant differences between treatment means at P=0.05.
An absence of superscripts indicated that there was no significant effect.
kg N/ha/y
Nutrient 0 40 80
1.42A 1.448 1.46c 0.447A 0.3968 0.3728
1.44 1.44 1.43 1.11A 1.128 1.138
1.03A 1.058 1.068
0.024A 0.018A8 0.0148
0.794A 0.812A 0.8338
1.04 1.03 1.04 -0.713 -0.706 -0.714 -2.03 -2.03 -2.03 -1.50 -1.49 -1.51 -1.71 -1 .71 -1.70 -1.37A -1 .37A8 -1 .388
Table A21 . Nitrogen supply main effects on petiole z values of Sultana on Ramsey rootstock. Different superscripts within rows indicate significant differences between treatment means at
P=0.05. An absence of superscripts indicated that there was no significant effect.
kg N/ha/y
Nutrient 0 40 80
ZN 1.54A 1.56A 1.598
ZP 0.977A 0.9368 0.9078
ZK 1.83A8 1.84A 1.818
Z c. 1.35A 1.34A8 1.328
ZMg 0.961A 0 .967A 0.9988
Z s 0.256A 0.257A 0.2208
ZNa -0.357 -0.367 -0.357 Za 0.172A 0 .219A 0.2838
Z8 -0.439 -0.437 -0.431 Zcu -2.01 -2.01 -2.02 z..., -1 .27 -1.28 -1.28 zF. -1.66A -1.68A8 -1.708
ZZn -1 .35 -1.34 -1.35
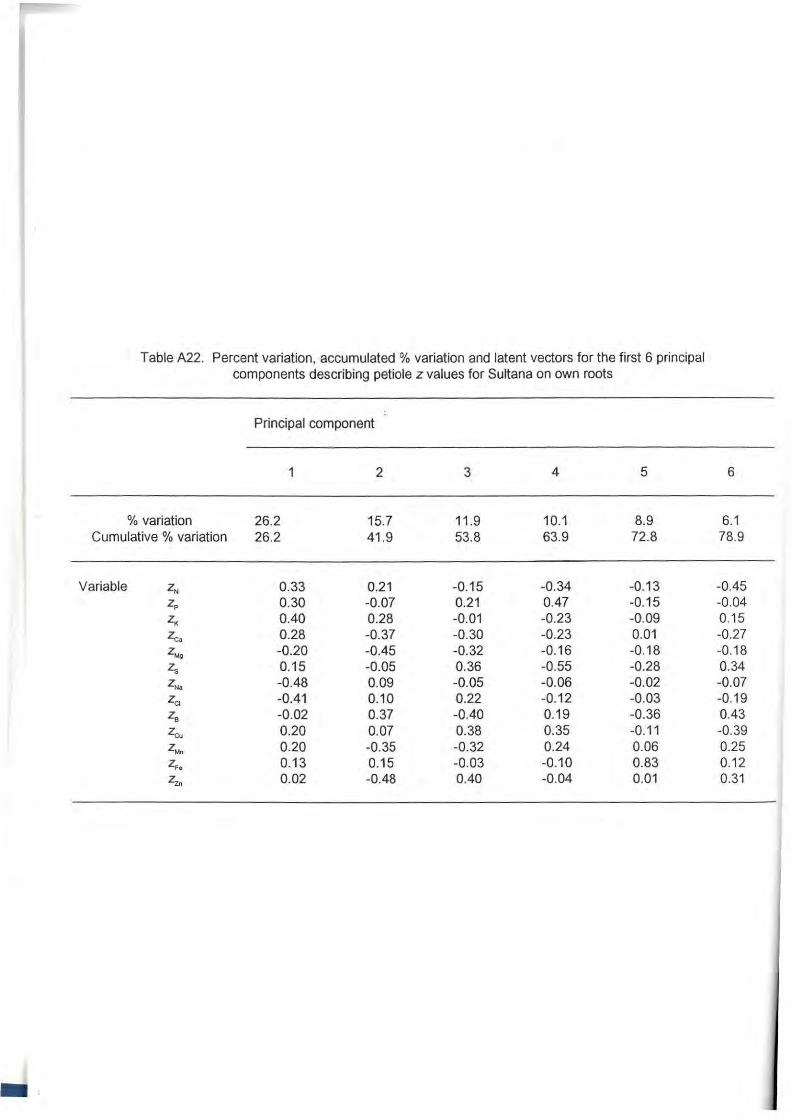
Table A22. Percent variation, accumulated % variation and latent vectors for the first 6 principal components describing petiole z values for Sultana on own roots
Principal component
1 2 3 4 5 6
%variation 26.2 15.7 11 .9 10.1 8.9 6.1 Cumulative % variation 26.2 41.9 53.8 63.9 72.8 78.9
Variable ZN 0.33 0.21 -0.15 -0.34 -0.13 -0.45 ZP 0.30 -0.07 0.21 0.47 -0.15 -0.04 ZK 0.40 0.28 -0.01 -0.23 -0.09 0.15 zc. 0.28 -0.37 -0.30 -0.23 0.01 -0.27 zt.4g -0.20 -0.45 -0.32 -0.16 -0.18 -0.18
Zs 0.15 -0.05 0.36 -0.55 -0.28 0.34 ZNa -0.48 0.09 -0.05 -0.06 -0.02 -0.07 ZCI -0.41 0.10 0.22 -0.12 -0.03 -0.19 Za -0.02 0.37 -0.40 0.19 -0.36 0.43 ZC<J 0.20 0.07 0.38 0.35 -0.11 -0.39 ZMn 0.20 -0.35 -0.32 0.24 0.06 0.25 zF. 0.13 0.15 -0.03 -0.10 0.83 0.12 Z-zr, 0.02 -0.48 0.40 -0.04 0.01 0.31
• •

Table A23. Percent variation, latent vectors for the first 6 principal components describing leaf z values for Sultana on own roots
Principal component
1 2 3 4 5 6
%variation 49.4 14.8 9.2 7.9 4.7 3.8 Cumulative% variation 49.4 64.2 73.4 81.2 85.9 89.7
Variable ZN -0.29 -0.20 -0.29 0.19 -0.36 -0.34 Zp -0.36 0.12 0.05 0.13 0.05 0.08 ZK -0.29 -0.06 0.08 0.43 -0.30 0.51 Zc.. -0.34 0.14 0.01 -0.21 0.18 -0.30 ZMg -0.23 0.34 0.34 0.20 0.44 -0.06 Zg -0.31 0.01 -0.41 -0.19 -0.17 -0.27 zN. 0.35 0.18 -0.12 0.07 0.16 0.10 ZCI 0.30 0.39 -0.19 0.00 -0.18 -0.16 Zs 0.11 -0.57 -0.11 0.37 0.18 0.02 Zcu -0.27 0.16 0.29 0.31 -0.03 -0.26 ZMn -0.28 0.18 -0.14 -0.40 -0.16 0.57 zF. -0.24 -0.32 -0.24 -0.24 0.58 0.10 ZZn 0.01 -0.37 0.64 -0.44 -0.26 -0.12
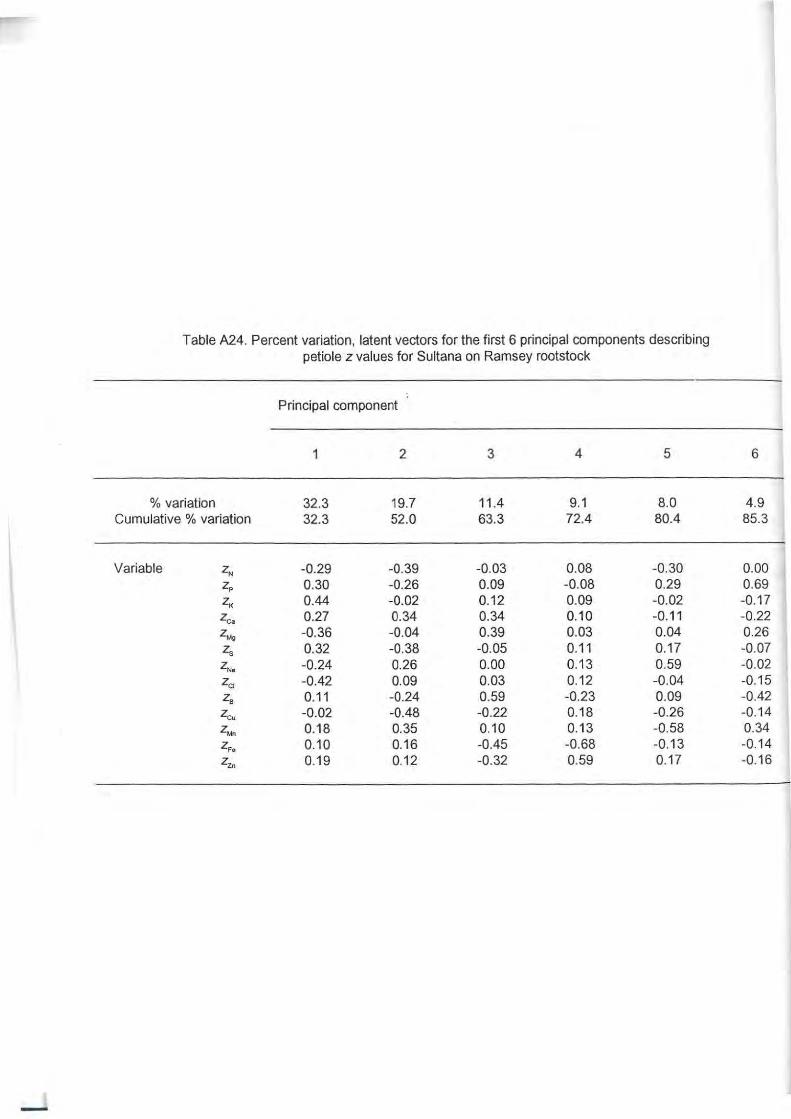
Table A24. Percent variation, latent vectors for the first 6 principal components describing petiole z values for Sultana on Ramsey rootstock
Principal component
1 2 3 4 5 6
%variation 32.3 19.7 11.4 9.1 8.0 4.9 Cumulative % variation 32.3 52.0 63.3 72.4 80.4 85.3
Variable ZN -0.29 -0.39 -0.03 0.08 -0.30 0.00 ZP 0.30 -0.26 0.09 -0.08 0.29 0.69 ZK 0.44 -0.02 0.12 0.09 -0.02 -0.17 Zea 0.27 0.34 0.34 0.10 -0.11 -0.22 ZM!I -0.36 -0.04 0.39 0.03 0.04 0.26
Zs 0.32 -0.38 -0.05 0.11 0.17 -0.07
zN. -0.24 0.26 0.00 0.13 0.59 -0.02 ZCI -0.42 0.09 0.03 0.12 -0.04 -0.15 Za 0.11 -0.24 0.59 -0.23 0.09 -0.42 Zcu -0.02 -0.48 -0.22 0.18 -0.26 -0.14
z"' 0.18 0.35 0.10 0.13 -0.58 0.34
zF. 0.10 0.16 -0.45 -0.68 -0.13 -0.14 ZZn 0.19 0.12 -0.32 0.59 0.17 -0.16
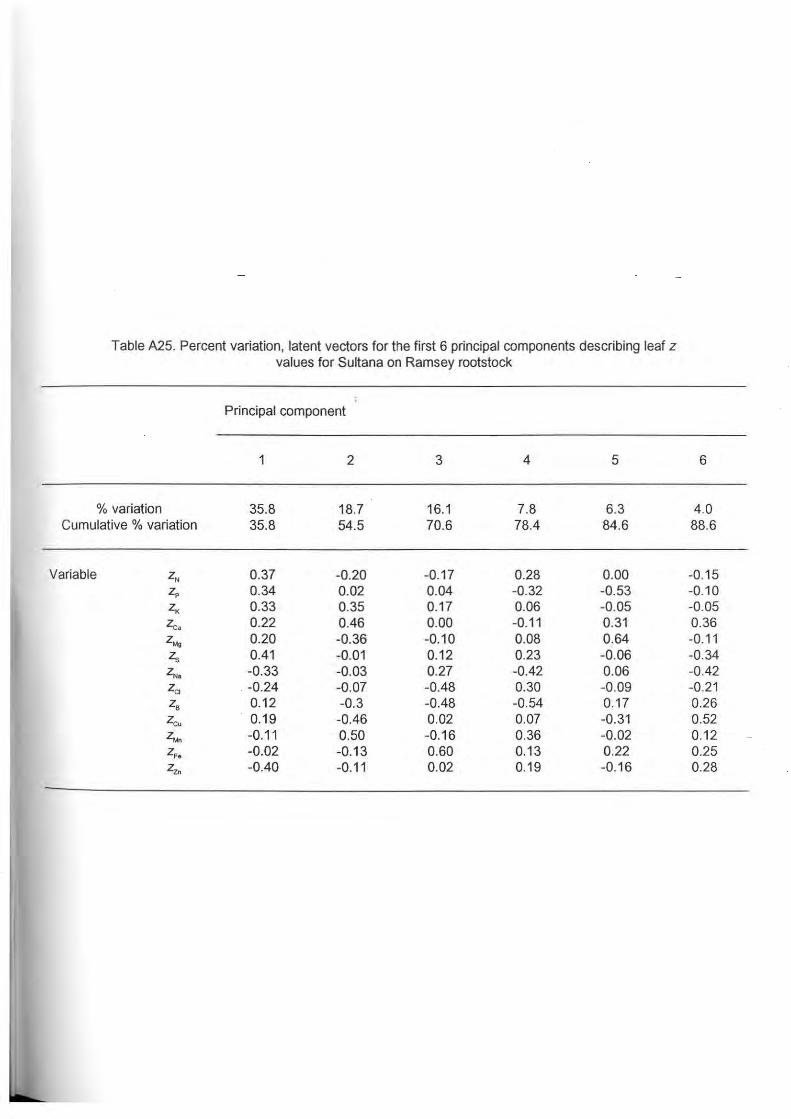
Table A25. Percent variation, latent vectors for the first 6 principal components describing leaf z values for Sultana on Ramsey rootstock
Principal component
1 2 3 4 5 6
% variation 35.8 18.7 16.1 7.8 6.3 4.0 Cumulative % variation 35.8 54.5 70.6 78.4 84.6 88.6
Variable ZN 0.37 -0.20 -0.17 0.28 0.00 -0.15 Zp 0.34 0.02 0.04 -0.32 -0.53 -0.10 ZK 0.33 0.35 0.17 0.06 -0.05 -0.05 zc. 0.22 0.46 0.00 -0.11 0.31 0.36 ZMg 0.20 -0.36 -0.10 0.08 0.64 -0.11 Zg 0.41 -0.01 0.12 0.23 -0.06 -0.34 z N. -0.33 -0.03 0.27 -0.42 0.06 -0.42 Za -0.24 -0.07 -0.48 0.30 -0.09 -0.21 Ze 0.12 -0.3 -0.48 -0.54 0.17 0.26 Zcu 0.19 -0.46 0.02 0.07 -0.31 0.52 ZMn -0.11 0.50 -0.16 0.36 -0.02 0.12 zF. -0.02 -0.13 0.60 0.13 0.22 0.25 Zz, -0.40 -0.11 0.02 0.19 -0.1 6 0.28
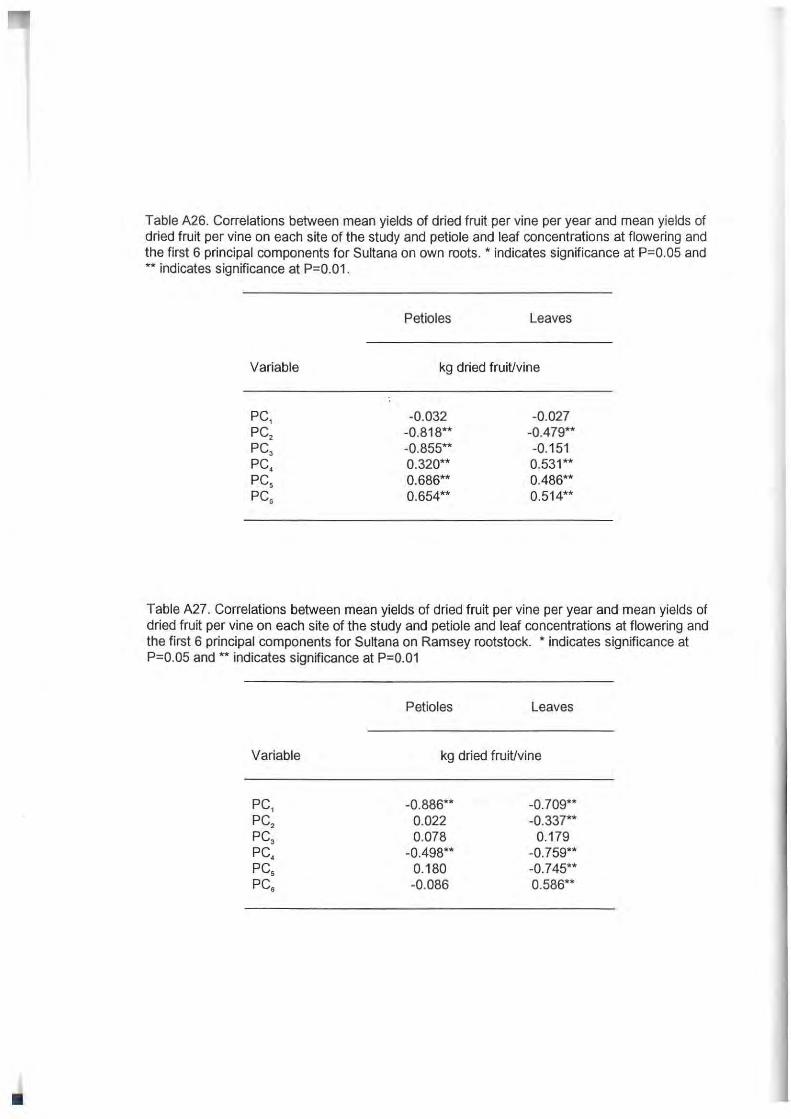
Table A26. Correlations between mean yields of dried fruit per vine per year and mean yields of dried fruit per vine on each site of the study and petiole and leaf concentrations at flowering and the first 6 principal components for Sultana on own roots. * indicates significance at P=0.05 and ** indicates significance at P=0.01.
Variable
PC, PC2
PC3
PC. PC5
PC6
Petioles Leaves
kg dried fruit/vine
-0.032 -0.027 -0.818** -0.479** -0.855** -0.151 0.320** 0.531** 0.686** 0.486** 0.654** 0.514**
Table A27. Correlations between mean yields of dried fruit per vine per year and mean yields of dried fruit per vine on each site of the study and petiole and leaf concentrations at flowering and the first 6 principal components for Sultana on Ramsey rootstock. * indicates significance at P=0.05 and ** indicates significance at P=0.01
Variable
PC, PC2
PC3
PC. PCS PCS
Petioles Leaves
kg dried fruit/vine
-0.886** -0.709** 0.022 -0.337** 0.078 0.179
-0.498** -0. 759** 0.180 -0.745** -0.086 0.586**
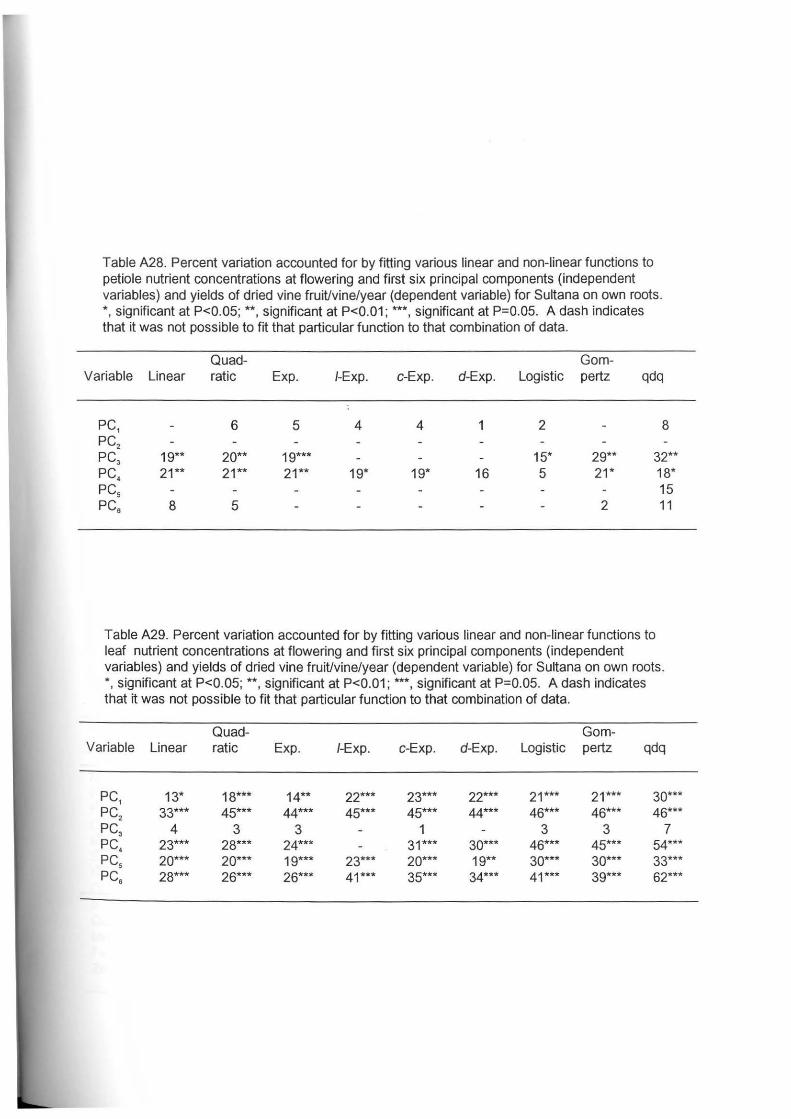
Table A28. Percent variation accounted for by fitting various linear and non-linear functions to petiole nutrient concentrations at flowering and first six principal components (independent variables) and yields of dried vine fruit/vine/year (dependent variable) for Sultana on own roots. *, significant at P<0.05; **, significant at P<0.01; ***, significant at P=0.05. A dash indicates that it was not possible to fit that particular function to that combination of data.
Quad- Gom-Variable Linear ratic Exp. /-Exp. c-Exp. d-Exp. Logistic pertz qdq
PC, 6 5 4 4 1 2 8 PC2
PC3 19** 20** 19*** 15* 29** 32** PC. 21** 21** 21** 19* 19* 16 5 21* 18* PC5 15 PC6 8 5 2 11
Table A29. Percent variation accounted for by fitting various linear and non-linear functions to leaf nutrient concentrations at flowering and first six principal components (independent variables) and yields of dried vine fruit/vine/year (dependent variable) for Sultana on own roots. *, significant at P<0.05; **, significant at P<0.01; ***, significant at P=0.05. A dash indicates that it was not possible to fit that particular function to that combination of data.
Quad- Gom-Variable Linear ratic Exp. /-Exp. c-Exp. d-Exp. Logistic pertz qdq
PC, 13* 18*** 14** 22*** 23*** 22*** 21*** 21*** 30*** PC2 33*** 45*** 44*** 45*** 45*** 44*** 46*** 46*** 46*** PC3 4 3 3 1 3 3 7 PC. 23*** 28*** 24*** 31*** 30*** 46*** 45*** 54*** PCS 20*** 20*** 19*** 23*** 20*** 19** 30*** 30*** 33*** PC6 28*** 26*** 26*** 41*** 35*** 34*** 41*** 39*** 62***
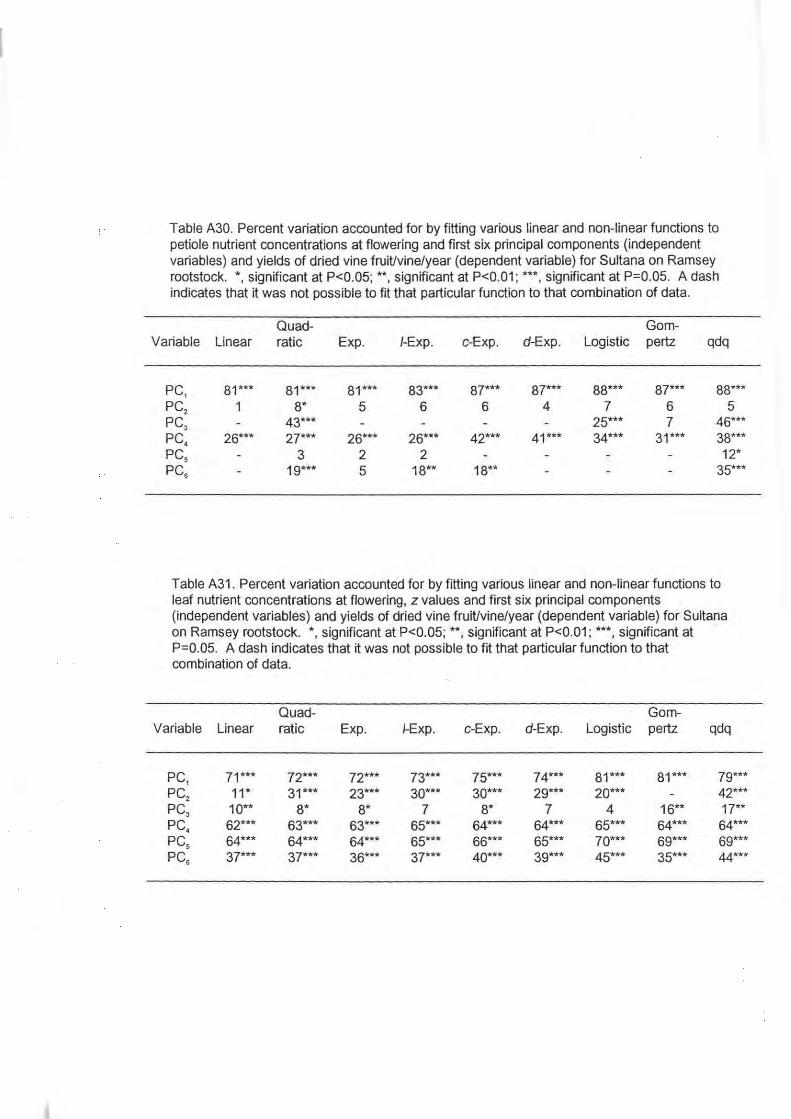
j
Table A30. Percent variation accounted for by fitting various linear and non-linear functions to petiole nutrient concentrations at flowering and first six principal components (independent variables) and yields of dried vine fruiUvine/year (dependent variable) for Sultana on Ramsey rootstock. *,significant at P<0.05; u. significant at P<0.01 ; ***, significant at P=0.05. A dash indicates that it was not possible to fit that particular function to that combination of data.
Quad- Gam-Variable Linear ratic Exp. /-Exp. c-Exp. d-Exp. Logistic pertz qdq
PC, 81*** 81*** 81*** 83*** 87*** 87*** 88*** 87*** 88*** PC2 1 8* 5 6 6 4 7 6 5 PC3 43*** 25*** 7 46*** PC4 26*** 27*** 26*** 26*** 42*** 41*** 34*** 31*** 38*** PC5 3 2 2 12* PC6 19*** 5 18** 18** 35***
Table A31. Percent variation accounted for by fitting various linear and non-linear functions to leaf nutrient concentrations at flowering, z values and first six principal components (independent variables) and yields of dried vine fruiUvine/year (dependent variable) for Sultana on Ramsey rootstock. *,significant at P<0.05; **,significant at P<0.01 ; ***,significant at · P=0.05. A dash indicates that it was not possible to fit that particular function to that combination of data.
Quad- Gam-Variable Linear ratic Exp. 1-Exp. c-Exp. d-Exp. Logistic pertz
PC, 71*** 72*** 72*** 73*** 75*** 74*** 81*** 81*** PC2 11* 31*** 23*** 30*** 30*** 29*** 20*** PC3 10** 8* 8* 7 8* 7 4 16** PC4 62*** 63*** 63*** 65*** 64*** 64*** 65*** 64*** PCS 64*** 64*** 64*** 65*** 66*** 65*** 70*** 69*** PC6 37*** 37*** 36*** 37*** 40*** 39*** 45*** 35***
qdq
79*** 42*** 17**
64*** 69*** 44***

Table A32. Leaf nutrient concentration ranges for Sultana on own roots. Ranges derived from principal components based on leaf z values.
Nutrient Deficient
N (%) < 2.9 p (%) < 0.22 K(%) < 1.0 Ca (%) < 2.2 Mg (%) s (%) < 0.23 Na (%) < 0.09 Cl (%) B (mg/kg) < 35 Cu (mg/kg) Mn (mg/kg) < 133 Fe (mg/kg) < 110 Zn (mg/kg) < 35
Concentration Range
Adequate
3.0- 3.4 > 0.23 > 1.1 > 2.2
> 0.24 0.09-0.24
35-60
> 134 110- 120 35-50
High
>3.4
> 0.24
> 0.60 > 9.5
> 121 > 51
Table A33. Petiole nutrient concentration ranges for Sultana on own roots. Ranges derived from regression equations relating leaf nutrient concentrations to petiole nutrient concentrations, and using the optimum ranges described in Table 19.
Nutrient Deficient
N(%) < 0.85 p (%) K (%) < 1.8 Ca (%) Mg (%) s {%) < 0.07 Na (%) Cl {%) B (mg/kg) < 39 Cu (mg/kg) Mn (mg/kg) < 38 Fe (mg/kg) < 24 Zn (mg/kg) < 65
Concentration Range
Adequate
0.86- 0.90
1.9 -2.8
> 0.08
40-54
> 39 25-29
> 65
High
> 0.91
> 2.9
>55 > 9.5
> 30
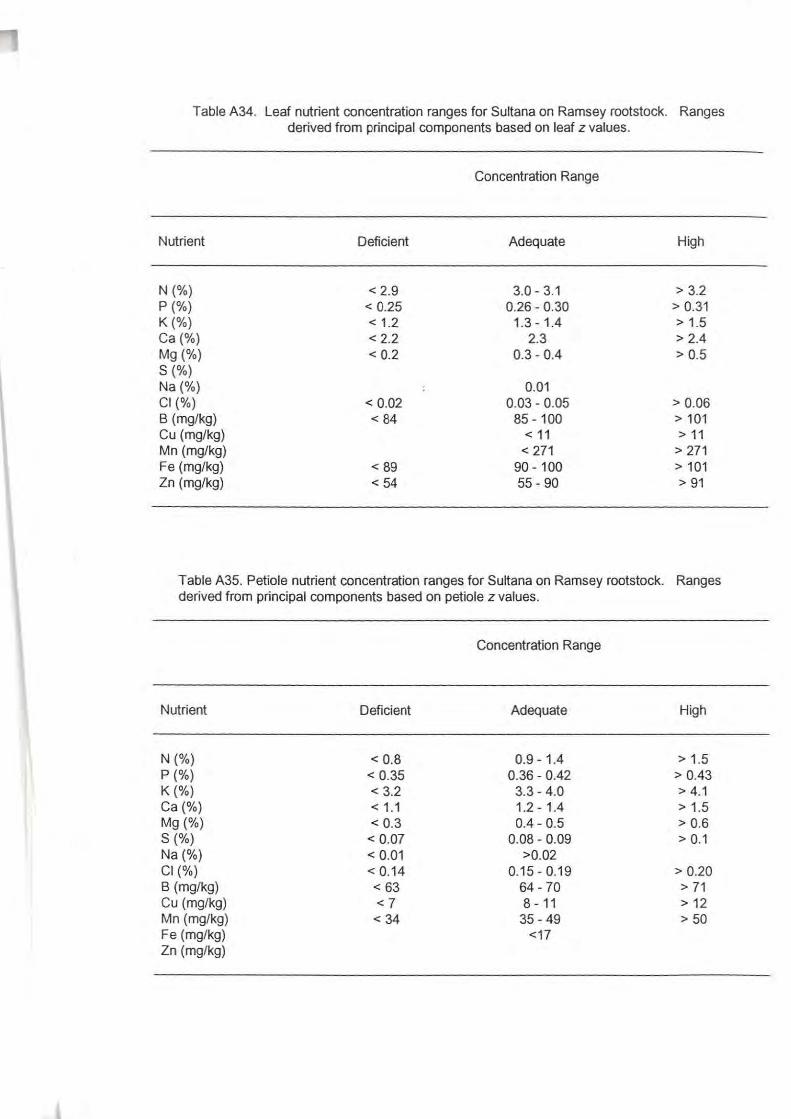
Table A34. Leaf nutrient concentration ranges for Sultana on Ramsey rootstock. Ranges derived from principal components based on leaf z values.
Concentration Range
Nutrient Deficient Adequate High
N (%) < 2.9 3.0-3.1 > 3.2 p (%) < 0.25 0.26- 0.30 > 0.31 K (%) < 1.2 1.3-1.4 > 1.5 Ca (%) < 2.2 2.3 >2.4 Mg (%) < 0.2 0.3- 0.4 > 0.5 s (%) Na (%) 0.01 Cl (%) < 0.02 0.03-0.05 > 0.06 B (mg/kg) < 84 85- 100 > 101 Cu (mg/kg) < 11 > 11 Mn (mg/kg) < 271 > 271 Fe (mg/kg) < 89 90- 100 > 101 Zn (mg/kg) <54 55-90 > 91
Table A35. Petiole nutrient concentration ranges for Sultana on Ramsey rootstock. Ranges derived from principal components based on petiole z values.
Concentration Range
Nutrient Deficient Adequate High
N (%) < 0.8 0.9-1.4 > 1.5 p (%) < 0.35 0.36- 0.42 > 0.43 K (%) < 3.2 3.3- 4.0 > 4.1 Ca(%) < 1.1 1.2- 1.4 > 1.5 Mg (%) < 0.3 0.4-0.5 > 0.6 s (%) < 0.07 0.08 - 0.09 > 0.1 Na (%) < 0.01 >0.02 Cl (%) < 0.14 0.15 - 0.19 > 0.20 B (mg/kg) < 63 64-70 > 71 Cu (mg/kg) <7 8- 11 > 12 Mn (mg/kg) < 34 35-49 >50 Fe (mg/kg) <17 Zn (mg/kg)
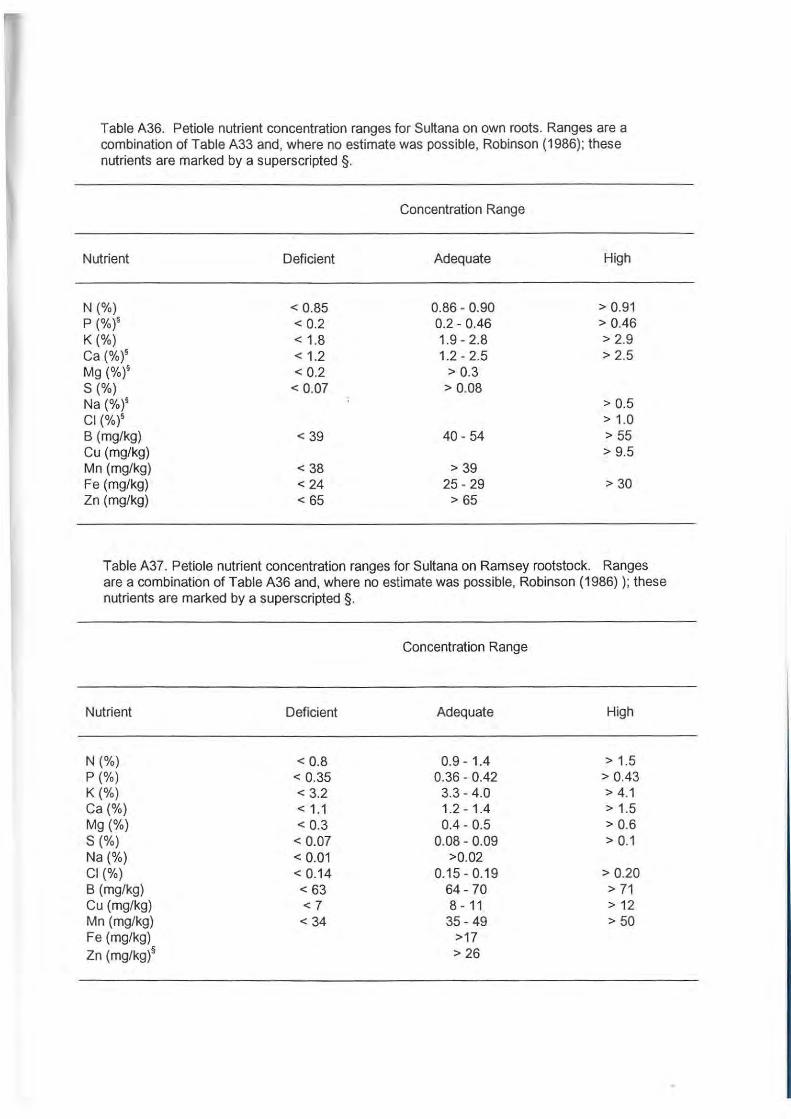
Table A36. Petiole nutrient concentration ranges for Sultana on own roots. Ranges are a combination of Table A33 and, where no estimate was possible, Robinson (1986); these nutrients are marked by a superscripted §.
Concentration Range
Nutrient Deficient Adequate High
N (%) < 0.85 0.86-0.90 > 0.91 p (%)§ < 0.2 0.2- 0.46 > 0.46 K (%) < 1.8 1.9-2.8 > 2.9 Ca (%)§ < 1.2 1.2-2.5 > 2.5 Mg (%)§ < 0.2 > 0.3 s (%) < 0.07 > 0.08 Na (%)§ > 0.5 Cl (%)§ > 1.0 B (mg/kg) < 39 40-54 >55 Cu (mg/kg) > 9.5 Mn (mg/kg) < 38 > 39 Fe (mg/kg} < 24 25-29 > 30 Zn (mg/kg} < 65 > 65
Table A37. Petiole nutrient concentration ranges for Sultana on Ramsey rootstock. Ranges are a combination of Table A36 and, where no estimate was possible, Robinson (1986) ); these nutrients are marked by a superscripted §.
Concentration Range
Nutrient Deficient Adequate High
N (%) < 0.8 0.9- 1.4 > 1.5 p (%) < 0.35 0.36 - 0.42 > 0.43 K (%) < 3.2 3.3- 4.0 > 4.1 Ca (%) < 1.1 1.2- 1.4 > 1.5 Mg (%) < 0.3 0.4- 0.5 > 0.6 s (%) < 0.07 0.08-0.09 > 0.1 Na (%) < 0.01 >0.02 Cl (%) < 0.14 0.15-0.19 > 0.20 B (mg/kg} < 63 64-70 > 71 Cu (mg/kg) <7 8- 11 > 12 Mn (mg/kg) < 34 35-49 >50 Fe (mg/kg} >17 Zn (mg/kg}§ > 26

I
Table B1. Petiole nutrient standards for Zante, Zante/Ramsey, Carina, Carina/Ramsey and Gordo vines based on petioles collected at flowering (dry weight basis).
Zante/ Carina/ Nutrient Zante Ramsey Carina Ramsey Gordo
N,% 0.86-1.35 0.83 -1 .17 0.71-0.96 0.89-1.17 0.79-1 .06 P,% 0.24-0.40 0.45 ..; 0.59 0.23 - 0.40 0.31 -0.55 0.36 - 0.48 K, % 2.22-3.54 3.70-4.55 1.87-2.35 2.73 - 3.58 4.31 - 5.15 Ca, % 1.30- 1.77 1.49 - 1.72 1.41- 1.63 1.47-1 .75 1.46-1 .66 Mg, % 0.33-0.51 0.42-0.57 0.56-0.74 0.52-0.64 0.35 - 0.46 S,% 0.11-0.16 0.16-0.19 0.10-0.14 0.13-0.17 0.12 - 0.15 Na,% 0.21-0.49 0.02-0.05 0.19- 0.31 0.03 - 0.09 0.22 - 0.36 Cl,% 0.51 - 0.68 0.08-0.29 0.72-0.90 0.18 - 0.39 0.50 - 0.88 B, ppm 35.9-66.9 59.3 - 74.8 38.4-48.3 52.6 - 61.6 38.8 - 44.3 Cu, ppm 9.0 - 27.1 11 .7-27.0 3.6-54.0 5.3-49.4 9.9-35.4 Mn, ppm 29.1-61.8 52.7 - 91 .9 43.2-81 .9 28.7 - 72.8 37.8- 8.63 Fe, ppm 15.1 - 24.5 17.8-23.1 18.7-39.0 22.5-36.5 27.6-49.2 Zn, ppm 47.5 - 64.3 59.4-81 .7 51 .1-63.3 58.8 - 86.5 45.5-71 .2
Table B2. The average dry yield of Zante, Zante/Ramsey, Carina, Carina/Ramsey and Gordo vines (kg/vine).
Vine variety
Zante Zante/Ramsey
Carina Carina/Ramsey
Gordo
Average dry yield - kg/vine
3.88-6.31 3.92-6.90 3.00 - 6.05 3.94-6.87 4.24 - 5.37

Table C1. The concentration of cations and K/Mg ratio in petioles in November 1992 in three vineyards according to K fertiliser treatment. Different superscripts within rows indicate
significant differences between treatment means at P=0.05. An absence of superscripts indicates that there was no significant effect.
Vineyard Cation, % dry weight KO K0.2 K1 K1+
1 K 3.66 AB 3.81 B 3.48A 3.82 B
Mg 0.41 0.39 0.38 0.35 Sultana/ Ca 1.32 1.35 1.32 1.30 Ramsey Na 0.04 0.04 0.03 0.03
K/Mg Ratio 8.9 9.8 9.2 10.9
2 K 4.11 AB 3.88A 4.08 AB 4.27 B
Mg 0.26 0.26 0.26 0.23 Sultana/ Ca 1.35 1.29 1.35 1.29 Ramsey Na
: 0.02 0.01 0.01 0.01
K/Mg Ratio 15.8 A 14.9 A 15.7A 18.6 B
3 K 2.47 2.48 2.61 2.53 Mg 0.63 0.63 0.60 0.66
Sultana Ca 1.33 1.29 1.27 1.25 Na 0.20 0.17 0.18 0.21 K/Mg Ratio 3.9 3.9 4.4 3.8
Table C2. The cation exchange capacity of the soil in April 1993 from three vineyards according to K fertiliser treatment. An absence of superscripts indicates that there was no significant effect.
Vineyard Cation, meq/1 OOg KO K0.2 K1 K1+
1 K 1.0 1.1 1.0 1.0 Mg 3.2 3.2 3.1 2.8
Sultana/ Ca 21.3 21.3 20.2 20.5 Ramsey Na 0.3 0.2 0.2 0.2
Total 25.8 25.8 24.5 24.5
2 K 0.6 0.6 0.6 0.6 Mg 2.8 2.6 2.7 2.7
Sultana/ Ca 19.7 19.9 19.6A 18.8 Ramsey Na 0.2 0.2 0.2 0.3
Total 23.3 23.3 23.2 22.4
3 K 0.5 0.5 0.6 0.5 Mg 2.9 2.8 2.9 3.0
Sultana Ca 20.9 20.6 21.0 21.4 Na 0.2 0.2 0.2 0.3
Total 24.5 24.1 24.7 25.2

Table C3. Crop produced by Sultana/Ramsey and Sultana vines according to fertiliser treatment.
Vineyard KO K0.2 K1 K1+
2- Sultana/ Ramsey, kg/vine 22.8 23.3 22.3 22.6
3- Sultana, :
kg/vine 20.0' 19.6A 19.2" 23.4 B
Table C4. The concentration of cations and K/Mg ratio in the petioles at flowering in 1993 and 1994 according to K fertiliser treatment. Different superscripts within rows indicate significant
differences between treatment means at P=0.05. An absence of superscripts indicates that there was no significant effect.
Year Cations, % dry weight KO K0.2 K1 K1+
1993 K 4.02 4.14 4.12 4.31 Mg 0.31 0.29 0.30 0.29 Ca 1.13 1.12 1.18 1.19 Na 0.03 0.03 0.03 0.03 K/Ca ratio 13.0 14.3 13.7 14.9
1994 K 4.38 4.44 4.47 4.68 Mg 0.33 0.31 0.33 0.31 Ca 1.16' 1.16' 1.25AB 1.31 8
Na 0.06 0.06 0.06 0.05 K!Ca ratio 13.3 14.3 13.5 15.1
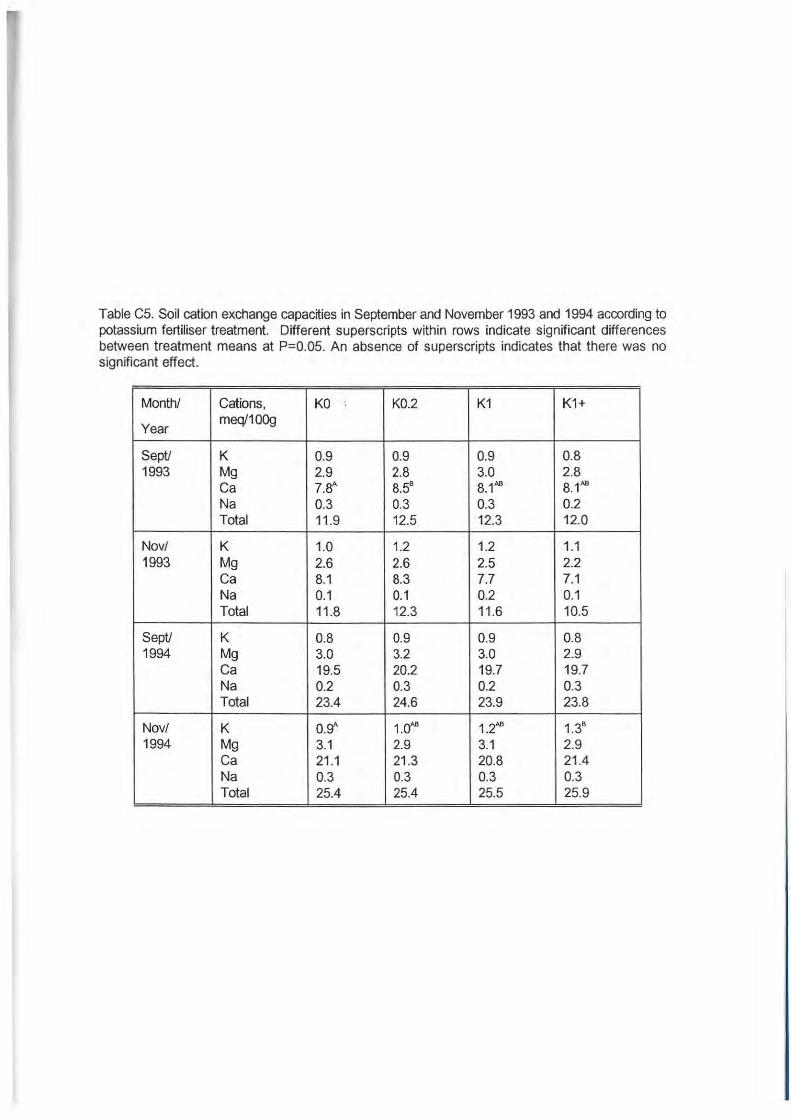
Table C5. Soil cation exchange capacities in September and November 1993 and 1994 according to potassium fertiliser treatment. Different superscripts within rows indicate significant differences between treatment means at P=0.05. An absence of superscripts indicates that there was no significant effect.
Month/ Cations, KO : K0.2 K1 K1+
Year meq/100g
Sept! K 0.9 0.9 0.9 0.8 1993 Mg 2.9 2.8 3.0 2.8
Ca 7.8A 8.58 8.1.A.B 8.1.A.B Na 0.3 0.3 0.3 0.2 Total 11.9 12.5 12.3 12.0
Nov/ K 1.0 1.2 1.2 1.1 1993 Mg 2.6 2.6 2.5 2.2
Ca 8.1 8.3 7.7 7.1 Na 0.1 0.1 0.2 0.1 Total 11.8 12.3 11.6 10.5
Sept/ K 0.8 0.9 0.9 0.8 1994 Mg 3.0 3.2 3.0 2.9
Ca 19.5 20.2 19.7 19.7 Na 0.2 0.3 0.2 0.3 Total 23.4 24.6 23.9 23.8
Nov/ K o.gA 1.~ 1.~ 1.38
1994 Mg 3.1 2.9 3.1 2.9 Ca 21.1 21.3 20.8 21.4 Na 0.3 0.3 0.3 0.3 Total 25.4 25.4 25.5 25.9

Table C6. The fresh weight of grapes according to potassium fertiliser treatment.
KO K0.2 K1 K1+
Fresh weight, kg/vine 20.6 22.7 19.6 24.3
Table C7 . Beny weight, beny brix and acid concentration in February 1994 and 1995 according to K fertiliser treatment. Different superscripts within rows indicate significant differences between
treatment means at P=0.05. An absence of superscripts indicates that there was no significant effect.
KO K0.2 K1 K1+
1994 Beny weight, g 198.3 204.5 192.6 196.5 Brix 20.48 20.3AB 19.4A 20.98
Acid, mg/1 OOg 8.4" 8.4A 9.18 7f
1995 Beny weight, g 122.7'' 129.5AB 137.28 131 .3AB Brix 18.9 18.6 18.4 18.7 Acid, mg/100g 8.5 8.5 8.6 8.6
Table C8. Mean K and Mg concentrations in petioles in Sultana/Ramsey vines in Sunraysia vineyards. Standard errors are indicates within ().
Year Number of Potassium, Magnesium, vineyards
% dry.wt. % dry.wt.
1991 20 3.61 (0.17) 0.36 (0.04)
1992 21 3.46 (0.09) 0.36 (0.02)
1995 24 4.38 (0.11) 0.60 (0.02)
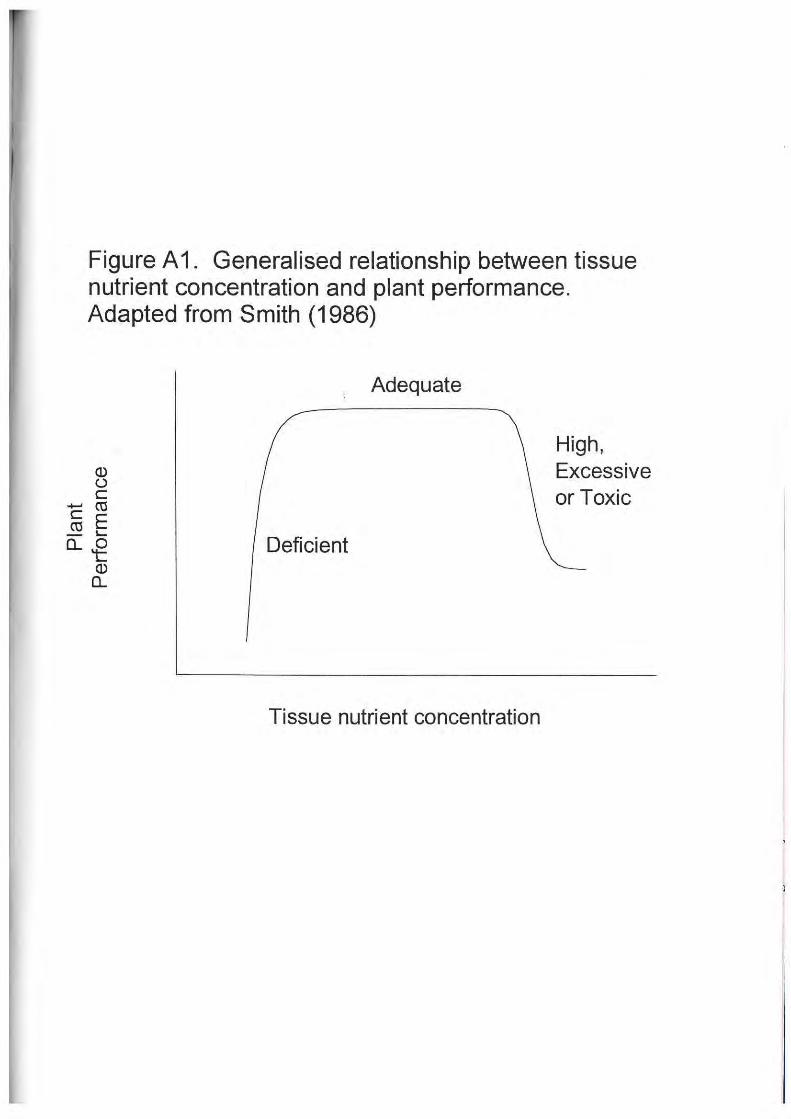
Figure A 1. Generalised relationship between tissue nutrient concentration and plant performance. Adapted from Smith (1986)
(l) (.) c
...... ro c E ro ,_ 0...~
(l)
0...
Adequate
Deficient
Tissue nutrient concentration
High, Excessive or Toxic
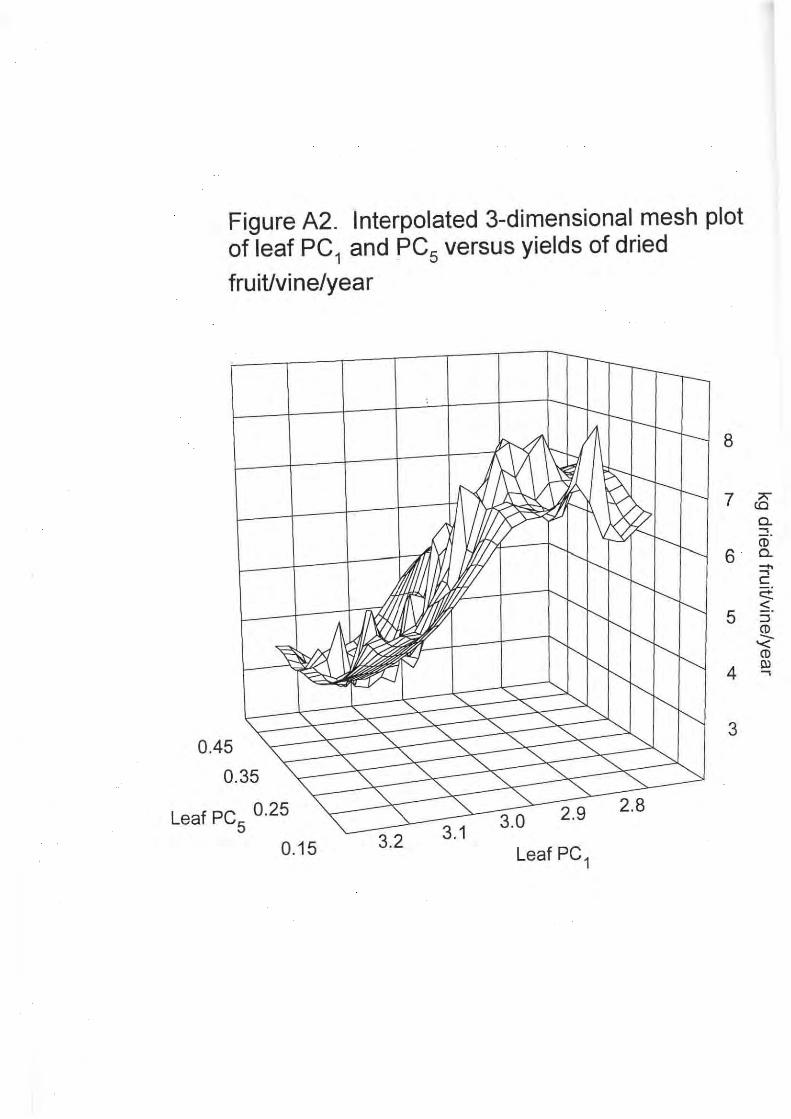
Figure A2. Interpolated 3-dimensional mesh plot of leaf PC
1 and PC5 versus yields of dried
fruit/vine/year
0.45
0.35
Leaf PC 0·25 5
0.15 3.2 Leaf PC 1
8
7 c8 a. .., Ci)'
6 a. --... .., c ~ :5.
5 :::J CD -'< CD
4 ~
3
Figure B1. Petiole nutrient levels from high yielding vines in Sunraysia (seasons 93/94 & 94/95} for Gordo (G), Carina/Ramsey (C/R), Carina (C), Zante/Ramsey (Z/R), Zante (Z) compared with Standard values for Sultana (Robinson, 1986).
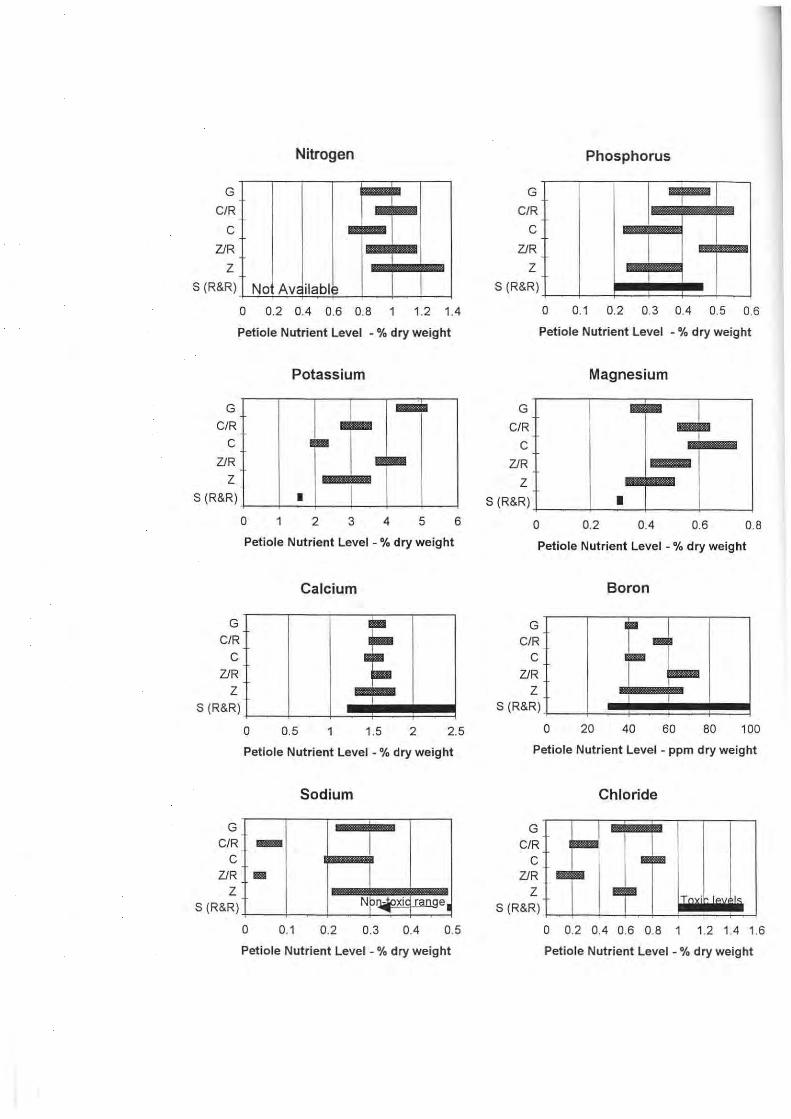
G
C/R
c Z/R
z S (R&R) No
Nitrogen
Ill -Ave. ilable
0 0.2 0.4 0.6 0.8 1 1.2 1.4
Petiole Nutrient Level - "'o dry weight
Potassium
G
C/R
c Z/R
z S (R&R) I
0 2 3 4 5 6
G
C/R c
Z/R
z S (R&R)
G C/R
c Z/R
z S (R&R)
Petiole Nutrient Level- "'o dry weight
Calcium
;:. ~ ~
0 0.5 1.5 2 2.5
Petiole Nutrient Level - "'o dry weight
Sodium
-Ill
N:>~xic rall.Qe 1 .... 0 0.1 0.2 0.3 0.4 0 .5
Petiole Nutrient Level - "'o dry weight
G
C/R c
Z/R
z S (R&R)
Phosphorus
I
0 0.1 0.2 0 .3 0.4 0.5 0.6
Petiole Nutrient Level - "'o dry weight
Magnesium
G
C/R • • l ..,.
c Z/R -z
S (R&R) I
0 0.2 0.4 0.6 0.8
Petiole Nutrient Level- "'o dry weight
G C/R
c Z/R
z S (R&R)
0 20
Boron
... 1 -·• I r--I
40 60 80 100
Petiole Nutrient Level- ppm dry weight
Chloride
Gr-~~~~BT~-rl C/R
c Z/R
z s (R&R)L-LJ_J~~~!!!!!J
0 0.2 0.4 0.6 0.8 1 1.2 1.4 1.6
Petiole Nutrient Level - "'o dry weight

Petiole Mg (%) 1
0.9
0.8
0.7
0.6
0.5
0.4
0.3
0.2
0.1
0
1.5 2
Figure C1. Relationship between petiole Mg and K in Sult~na on Ramsey vines
2.5 3 3.5 4
Petiole K (%)
Correlation Coefficients 1991 -0.92*** 1992 -0.57 ** 1995 -0.54 **
A
4.5 5 5.5
• 1991--1991 Fit Ill 1992- - - 1992 Fit A 1995-1995 Fit
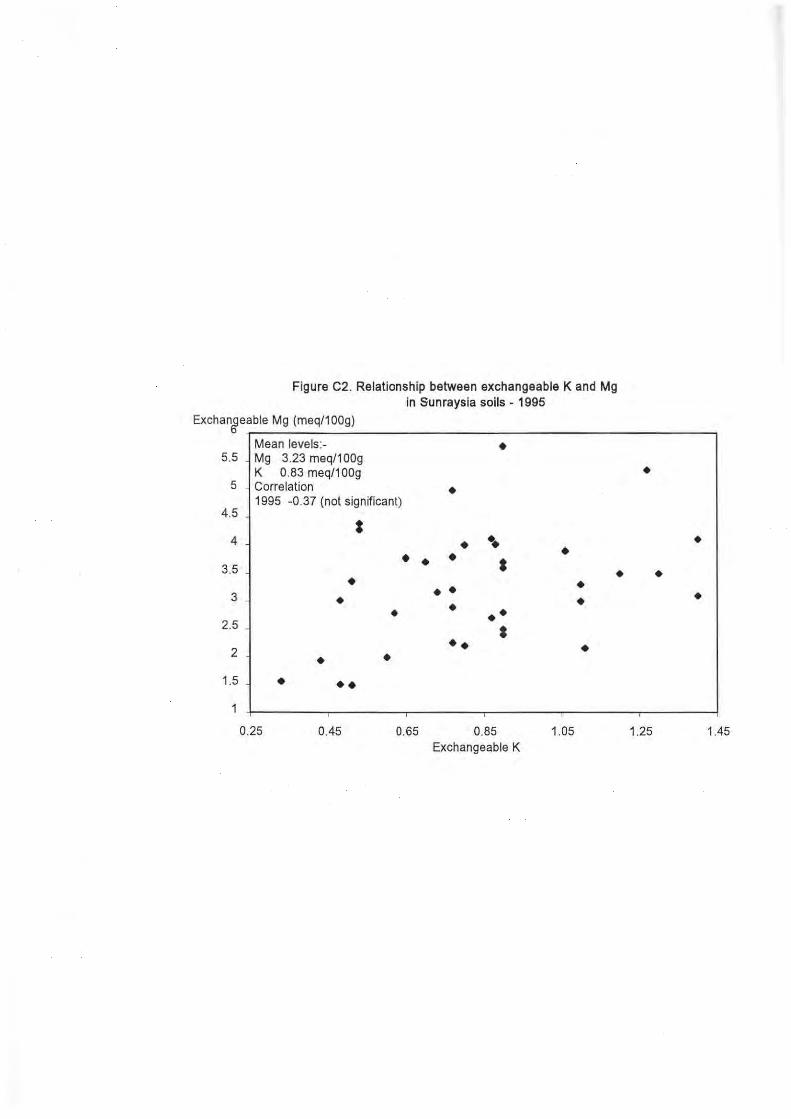
Figure C2. Relationship between exchangeable K and Mg in Sunraysia soils - 1995
Exchan~eable Mg (meq/1 OOg)
Mean levels:- • 5.5 Mg 3.23 meq/100g K 0.83 meq/100g •
5 Correlation • 4.5
1995 -0.37 (not significant)
t 4 • •• •
• • • • • 3.5 • • • • 3 •• • • • • • • • 2.5 • 2 •• • • •
1.5 • •• 0. 25 0.45 0.65 0.85 1.05 1.25 1.45
Exchangeable K
Leaf Disorders
of Grape"ines
in Sunrausia
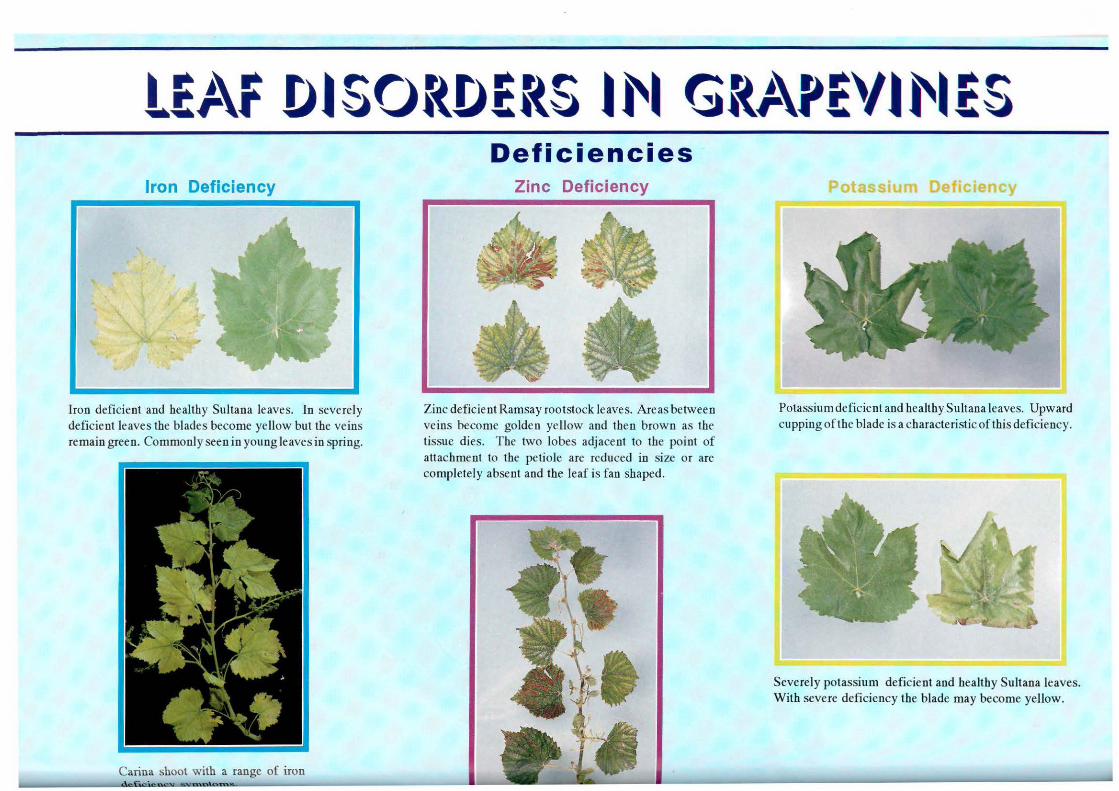
t!J.\f DISORDERS 1~1 GRJ.\P!Vt~I!S Iron Deficiency
Iron deficient and healthy Sultana leaves. In severely deficient leaves the blades become ye llow but the veins remain green. Commonly seen in young leaves in spring.
'. \~;~\\ .. · .
...
~ ... ,(.: .. -·~.
/ / .. ' .~,-.
.-.~ .. ·,if_ ,·. •. ~ Me-,, ~ ., ;-.- ' ..
: ..
Carina shoot with a range of iron
Deficiencies Zinc Deficiency
Zinc deficient Ramsay rootstock leaves. Areas between ve ins become golden ye llow and then brown as the tissue dies. The two lobes adjacent to the point of attachment to the petiole are reduced in size or are completely absent and the leaf is fan shaped.
Potassium Deficiency
Potassium deficient and healthy S ultana leaves. Upward cupping of the blade is a characteristic of this deficiency.
Severely potassium deficient and healthy Sultana leaves. With severe deficiency the blade may become yellow.

Magnesium deficient Carina currant leaf. In this and other varieties which produce dark coloured berries, the margins of magnesium deficient leaves are purplish red and the colour can spread to the centre of the leaf.
Salt Toxicity !!-~-....
Sultana shoot showing severely salt
Magnesium Deficiency
Three stages in the development of magnesium deficiency symptoms in Sultana leaves. The leaf margin turns whitish yellow, the yellow becomes bright and spreads towards the centre of the leaf, and finally the yellow tissue turns to brown as the tissue dies. Symptoms appear in older leaves in mid summer
Toxicities
Salt toxicity in Sultana leaves. Initially the leaf margin turns black and then brown as the tissue dies.
Sultana shoot with potassium deficient leaves. Potassium deficiency symptoms are seen in old leaves in Spring
Boron Toxicity
Boron toxicity in Sultana leaves. Brown spots develop along the margin and spread towards the centre of the leaf.
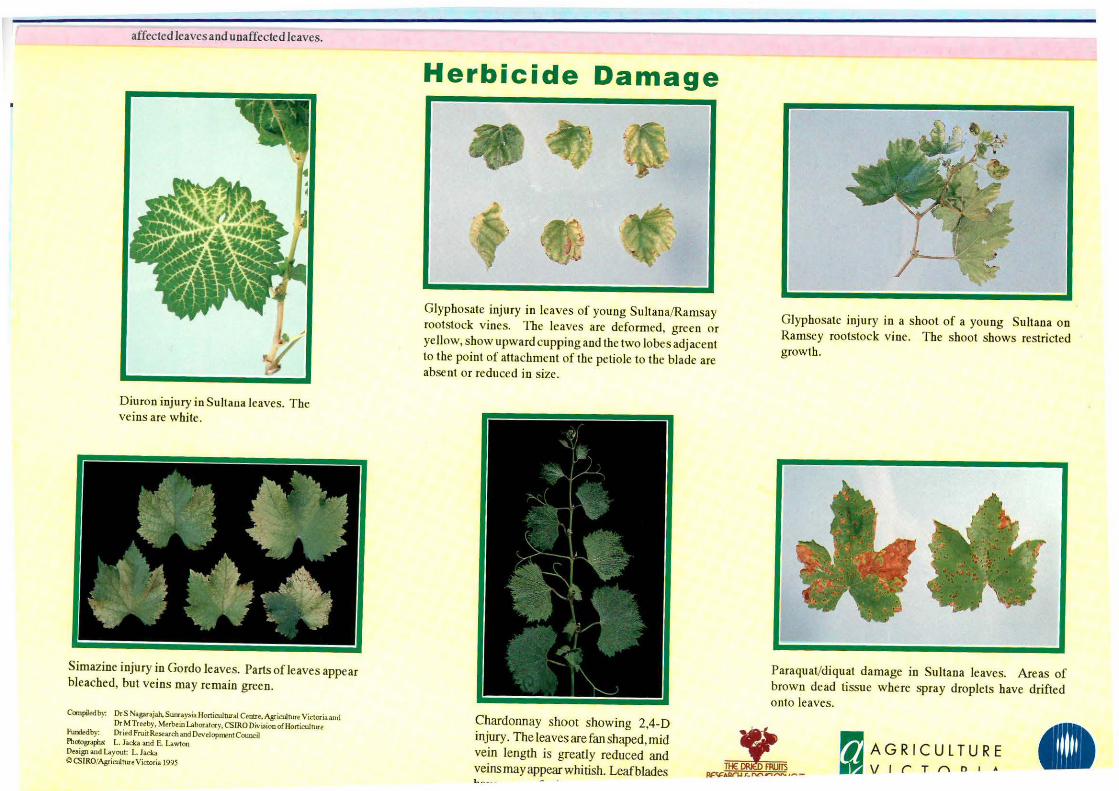
affected leaves and unaffected leaves.
Diuron injury in Sultana leaves. The veins are white.
fill
• '
?·:1 ~ . ~ . . ... •,, . .
.
..• ~ ·~·~t.· c .• ~· •· :.'
,. ~ · • , ·to: • I :
• '*T • . • .r.;... ~- · . ~ .. ,. '
a I !I Simazine injury in Gordo leaves. Parts of leaves appear bleached, but veins may remain green.
Canpil<dby: DrS Nagarajah, Sumay>ia Honicultural Cell!re, Agriculture Victoria and Dr MTreeby, Merbein Laboratory, CSIRO Di\'l$ioo of Horticul ture
fwlded by: Dried FruitRuearch and Develop11Ynt Council Phcrograpu: L. Jacka and E. l>Moo De>i!!Jl and Loyoot: L Jacka f> CSIRO/AgricultureVictoria 1995
Herbici·de Damage
Glyphosate injury in leaves of young Sultana/Ramsay rootstock vines. The leaves are deformed, green or ye llow, show upward cupping and the two lobes adjacent to the point of attachment of the petiole to the blade are abse nt or reduced in size.
Glyphosate injury in a shoot of a young Sultana on Ramsey rootstock vine. The shoot shows restricted growth.
Paraquat/diquat damage in Sultana leaves. Areas of brown dead tissue where spray droplets have drifted onto leaves.
.3: AGRICULTURE A
~, . -. .. Chardormay shoot showing 2,4-D injury. The leaves are fan shaped, mid vein length is greatly reduced and veins mayappearwhitish. Leafblades ~A.Df"\.l r_ r'\C\...,_,... •-- I V l rTAo • 1-- - - -