Embed Size (px)
Citation preview

Optimisation of indication
selection and prioritisation

Deciding on which patient population to target is one of the most important strategic decisions to inform early clinical development
• The choice of indication or therapeutic position to target or prioritise has substantial impact on the commercial opportunity a novel therapy presents
• The commercial opportunity is impacted by:
A. The room for innovation per patient in the relevant target population which is a measure of the maximum price potential in a given indication/therapeutic position
B. The size of the target patient population, i.e. the maximum volume opportunity
• A and B are subsequently used to inform maximum revenue potential and determine which indication presents the greatest commercial opportunity
• We use the two main components of cost-utility framework to assess the room for innovation per patient, and estimate the value of curing the target patient (i.e. returning them to the same average health state as the general population)
1. Impact on healthcare costs: The value of eliminating the need for current therapeutic approaches over the remaining lifetime
2. Impact on health outcomes (measured as Quality-Adjusted Life-years): The value of improving the patient’s health status in terms of quality of life (QoL) and life expectancy to match that of the general population over their remaining lifetime
• Finally, we use epidemiological data to estimate the size of the different target patient populations, and determine the target population with the greatest revenue potential
2
1.
Co
sts
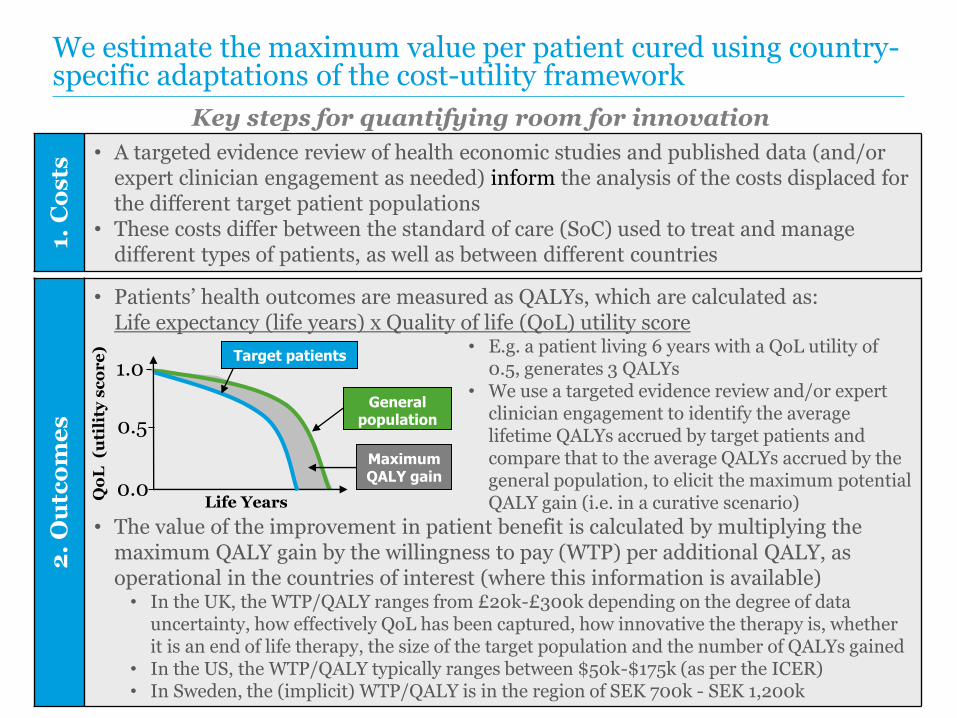
• A targeted evidence review of health economic studies and published data (and/or expert clinician engagement as needed) inform the analysis of the costs displaced for the different target patient populations
• These costs differ between the standard of care (SoC) used to treat and manage different types of patients, as well as between different countries
We estimate the maximum value per patient cured using country-specific adaptations of the cost-utility framework
Key steps for quantifying room for innovation
2.
Ou
tco
me
s
• Patients’ health outcomes are measured as QALYs, which are calculated as: Life expectancy (life years) x Quality of life (QoL) utility score
• E.g. a patient living 6 years with a QoL utility of 0.5, generates 3 QALYs
• We use a targeted evidence review and/or expert clinician engagement to identify the average lifetime QALYs accrued by target patients and compare that to the average QALYs accrued by the general population, to elicit the maximum potential QALY gain (i.e. in a curative scenario)
• The value of the improvement in patient benefit is calculated by multiplying the maximum QALY gain by the willingness to pay (WTP) per additional QALY, as operational in the countries of interest (where this information is available)• In the UK, the WTP/QALY ranges from £20k-£300k depending on the degree of data
uncertainty, how effectively QoL has been captured, how innovative the therapy is, whether it is an end of life therapy, the size of the target population and the number of QALYs gained
• In the US, the WTP/QALY typically ranges between $50k-$175k (as per the ICER)• In Sweden, the (implicit) WTP/QALY is in the region of SEK 700k - SEK 1,200k
Maximum QALY gain
Qo
L (u
tili
ty s
co
re
)
General population
Life Years
0.5
Target patients
0.0
1.0

Case Study: identifying the indication of greatest commercial opportunity for a novel gene therapy
• The novel gene therapy has three different potential target populations
£-
£100,000
£200,000
£300,000
£400,000
£500,000
£600,000
Targetpopulation 1
Targetpopulation 2
Targetpopulation 3
Value of max. lifetime QALY gain*
Lifetime value of SoC
UK room for innovation assessment (maximum value of cure) per patient
£365k
£520k
£335k
£215,000
£240,000
£125,000
• Our targeted evidence review found that both the lifetime cost of the SoC and the lifetime QALY impact varied considerably between the three potential target populations:
Target pop.
SoC cost
Max. QALY gain
1 £150k 4.3
2 £280k 4.8
3 £210k 2.5
£150,000
£280,000£210,000
• This translated into three target population-specific value potentials (per patient) as shown in the graph
* Using WTP/QALY as per NICE guidelines
4

Target population
Max. value per patient
Max. number of patients
Estimated revenue potential
1 £365k 1,200 £438 million
2 £520k 1,800 £936 million
3 £335k 1,100 £368 million
We subsequently used epidemiological data to inform volume opportunity and assess differences in revenue potential across the three target populations
5
The outputs from our analyses allowed our client to:• Identify the target population (2) that presents the greatest commercial
opportunity, in order to inform the clinical development programme accordingly
• Understand which target population is likely to be the best candidate for potential subsequent indication-extension studies