Embed Size (px)
Citation preview
This article was downloaded by: [The Aga Khan University]On: 09 October 2014, At: 07:34Publisher: Taylor & FrancisInforma Ltd Registered in England and Wales Registered Number: 1072954 Registeredoffice: Mortimer House, 37-41 Mortimer Street, London W1T 3JH, UK
International Journal of EnvironmentalAnalytical ChemistryPublication details, including instructions for authors andsubscription information:http://www.tandfonline.com/loi/geac20
Optimisation and assessment of aninnovative high sensitivity 90-degreereflecting ICP-MS ion optics systemfor the validation of simultaneousdetermination of arsenic and seleniumin water matricesEusebio Álvarez Vázquez a , Ramón Bouza Deaño a , MiguelTernero Rodríguez a & Antonio J. Fernández Espinosa aa Faculty of Chemistry, Department of Analytical Chemistry ,University of Sevilla , C. Profesor García González 1, Campus ofReina Mercedes, E-41012 Seville, SpainPublished online: 23 Mar 2011.
To cite this article: Eusebio Álvarez Vázquez , Ramón Bouza Deaño , Miguel Ternero Rodríguez &Antonio J. Fernández Espinosa (2011) Optimisation and assessment of an innovative high sensitivity90-degree reflecting ICP-MS ion optics system for the validation of simultaneous determinationof arsenic and selenium in water matrices, International Journal of Environmental AnalyticalChemistry, 91:5, 462-472, DOI: 10.1080/03067310903045489
To link to this article: http://dx.doi.org/10.1080/03067310903045489
PLEASE SCROLL DOWN FOR ARTICLE
Taylor & Francis makes every effort to ensure the accuracy of all the information (the“Content”) contained in the publications on our platform. However, Taylor & Francis,our agents, and our licensors make no representations or warranties whatsoever as tothe accuracy, completeness, or suitability for any purpose of the Content. Any opinionsand views expressed in this publication are the opinions and views of the authors,and are not the views of or endorsed by Taylor & Francis. The accuracy of the Contentshould not be relied upon and should be independently verified with primary sourcesof information. Taylor and Francis shall not be liable for any losses, actions, claims,proceedings, demands, costs, expenses, damages, and other liabilities whatsoever orhowsoever caused arising directly or indirectly in connection with, in relation to or arisingout of the use of the Content.

This article may be used for research, teaching, and private study purposes. Anysubstantial or systematic reproduction, redistribution, reselling, loan, sub-licensing,systematic supply, or distribution in any form to anyone is expressly forbidden. Terms &Conditions of access and use can be found at http://www.tandfonline.com/page/terms-and-conditions
Dow
nloa
ded
by [
The
Aga
Kha
n U
nive
rsity
] at
07:
34 0
9 O
ctob
er 2
014
Intern. J. Environ. Anal. Chem.Vol. 91, No. 5, 20 April 2011, 462–472
Optimisation and assessment of an innovative high sensitivity 90-degree
reflecting ICP-MS ion optics system for the validation of simultaneous
determination of arsenic and selenium in water matrices
Eusebio Alvarez Vazquez, Ramon Bouza Deano, Miguel Ternero Rodrıguez andAntonio J. Fernandez Espinosa*
Faculty of Chemistry, Department of Analytical Chemistry, University of Sevilla, C. ProfesorGarcıa Gonzalez 1, Campus of Reina Mercedes, E-41012 Seville, Spain
(Received 20 February 2009; final version received 14 May 2009)
A routine ICP-MS method for the determination of As and Se in fresh andsewage water has been developed. After a first phase of optimisation, where thetorch alignment, flow of gases and ion optic adjustments were calibrated, themethod was validated successfully. The parameters limits of detection, linearity,working range, sensitivity and the interferences, precision and accuracy werestudied with three procedures for the method: measuring two SRMs (BCR-714 ofinfluent wastewater and NIST 1643e of groundwater); spiking four differentmatrices at three levels of concentration; and doing a proficiency test. The limitsof detection obtained were 0.2 and 0.8mgL�1 for As and Se, respectively. Thepercentages of linearity obtained were 99.2% for As and 99.8% for Se. Allrecovery values were according to the AOAC intervals, from 95.3% for As in thewastewater matrix to 106.4% for Se in the seawater matrix. The accuracy was alsostudied determined via a proficiency testing resulting in acceptable Z-scores of0.65 and 0.4 respectively for As and Se. The complete method allowed analysis ofwater samples according to European Directive 2000/60 EC and the differentguides for method validation.
Keywords: ICP-MS; arsenic; selenium; optimisation; validation; fresh water;wastewater
1. Introduction
There has been great interest in recent years in the determination of As and Se levels inenvironmental, foods and biological samples [1,2]. As and Se are two essential elementsthat must be present in the human diet but their presence in high concentrations isdetrimental to health. There is a great similarity between these elements as both maintain anatural balance between their different chemical forms in the earth’s crust, air and waterphases. Human activities are altering these cycles in a manner that the elements finallyaccumulate in the surface and groundwaters [3,4]. This fact implies a risk of direct contactwith the population that could cause damage and adverse health symptoms. Therefore,appropriate analytical methods are essential to quantify the presence of these pollutants inwater in order to avoid hazardous contamination of potable water systems, such as thatwhich occurred in Bangladesh [5,6], East Bengala [7] or Nepal [8].
*Corresponding author. Email: [email protected]
ISSN 0306–7319 print/ISSN 1029–0397 online
� 2011 Taylor & Francis
DOI: 10.1080/03067310903045489
http://www.informaworld.com
Dow
nloa
ded
by [
The
Aga
Kha
n U
nive
rsity
] at
07:
34 0
9 O
ctob
er 2
014
Regarding the toxicological aspect, the effects of acute poisoning caused by a largeintake of As would be different from those of small doses spread over a long period oftime. A punctual high dosage produces vomiting or diarrhoea while small amountscontinued over time would cause diseases of the circulatory system, hyperkeratosis orcancer of the skin, bladder or kidney [9]. High amounts of Se in a short space of time cancause dizziness, fatigue and irritation of mucous membranes. When exposure is extremelyhigh, fluid retention can occur in the lungs, while bronchitis, pneumonia, asthma, nausea,chills, fever, sore throat, shortness of breath, conjunctivitis, vomiting, abdominal pain,diarrhoea and an enlarged liver are all symptoms [10].
In a response to this problem, governments of different countries have echoed therecommendations of the Environmental Protection Agency of the US (EPA) [11] and theWorld Health Organization (WHO) [12], which should ensure that the presence of thesetwo elements in potable water to avoid harmful ingestion is below 10 mgL�1. In Europe,Directive 2000/60 EC [13] establishes quality criteria for these elements in water samples.The range of possible techniques for the determination of As and Se in waters is wide. Itincludes inductively coupled plasma optical emission spectroscopy (ICP-OES) [14,15],graphite furnace atomic absorption spectroscopy (GF-AAS) [16,17], hydride generationatomic absorption spectroscopy (HG-AAS) [18,19], UV–Vis molecular absorptionspectrophotometry [20,21], ion chromatography (IC) [22], hydride generation with coldtrap of heptanes, gas chromatography with multiple ion detector [23,24], fluorimetry [25],neutron activation analysis (NAA) [26,27], anodic and catodic stripping voltammetry(ASV/CSV) [28] and inductively coupled plasma mass spectroscopy (ICP-MS) [29–31].However, there exists an urgent necessity for analytical techniques to determine As and Selevels simultaneously and with high sensitivity. At the same time, the necessity is extendedto techniques that remove or minimise the usual interferences for elements, specifically forAs and Se, such as the spectral interferences, the formation of solvent based interferencesand the poly-atomic spectral interferences of atomic masses.
ICP-MS is a relatively quick and versatile technique with very low limits of detection.The most significant disadvantage is the high cost of acquisition and maintenance of theequipment as well as the high level of training required in order to handle it.
The aim of this work is to develop a rapid routine ICP-MS method for thedetermination of As and Se in order to monitor the levels of these contaminants in thedrinking water of the population. Also, the final method will be extended to the analysis insamples of groundwater, estuarine, seawater and sewage water.
2. Experimental
2.1 Reagents and standards
High purity Argon gas of 99.999% (Praxair, Madrid, Spain) was used in this method tosupply the plasma. Distilled water used in this method was provided from a combinedMilli-Q Elix/Milli-Q Gradient system (Millipore, Bedford, MA, USA). Nitric acid 69%Suprapur grade (Sharlab, Barcelona, Spain) utilised in this method was free from As andSe residues. Flush water was prepared by diluting Brijj 35 30% w/w aqueous solution(Sharlab, Barcelona, Spain) to 2%.
Tuning, internal standard solution and As and Se standards used in this method wereprepared from stock standard solutions (Inorganic Ventures, Lakewood, NJ, USA).
International Journal of Environmental Analytical Chemistry 463
Dow
nloa
ded
by [
The
Aga
Kha
n U
nive
rsity
] at
07:
34 0
9 O
ctob
er 2
014
2.2 Apparatus
Analyses were performed on an ICP-quadrupole-MS (ICP-QMS) Varian 810-MSequipped with a 90-degree reflecting ion optics system and a SPS-3 auto-sampler(Varian, Mulgrave, Victoria, Australia). The parts near the torch, cones and the RF spirewere cooled by using a Kuhlmobil 142 VD cooling system (Van der Heijden, Dorentrup,Germany). Nebulisation chamber was cooled by Peltier effect, another recent improve-ment that also increases the sensitivity. Data was acquired and processed using theICP-MS Expert Software version 1.1 b49 from Varian. The optimum performance of theexperimental conditions for the ICP-MS was obtained from the parameters listed inTable 1.
The sample introduction system consists of a Micromist glass low-flow nebuliser, apeltier-cooled (4�C) double pass glass spray chamber and a quartz torch. The spraychamber was cooled to reduce the vapour loading on the plasma, increasing the availableenergy for atomisation and ionisation of the elements of interest and to reduce theformation of solvent based interferences. Sample transport from the auto-sampler to thenebuliser was performed using a peristaltic pump.
The 90-degree reflecting ICP-MS ion optics is a new optic system for routine sampleanalysis that delivers exceptional sensitivity. In the ion optics system the ions are reflectedand focused at 90� by a parabolic electrostatic field produced by an ion mirror. The ionoptics had a hollow structure that allows photons and neutrals passing through to reducecontamination to ion optics. The vacuum pump is mounted behind the ion mirror toremove unwanted particles and this creates a highly efficient vacuum.
2.3 Sample pre-treatment procedure
A microwave digestion system Mars (CEM, Indian Trail, USA) was used when particulatematter was present in wastewater. When the sample was clear (no particulate matterpresent or discoloured and turbidity 51 NTU) it was only necessary to acidify it withHNO3 4%. When unclear samples were analysed (e.g. wastewater), it was necessary tomake a microwave-assisted digestion. Microwave pre-treatment used in this techniqueconsisted in adding 2mL of HNO3 69% Suprapur grade at 25mL of sample and heating
Table 1. Values assigned to ICP-MS parameters in the method.
Ion optics (Volts)
Flow parameters (Lmin�1)Plasma flow 17.5 First extraction lens �2Auxiliary flow 1.65 Second extraction lens �155Sheath gas 0.27 Third extraction lens �210Nebuliser flow 0.91 Corner lens �218
Mirror lens left 33Torch alignment (mm) Mirror lens right 21Sampling depth 5 Mirror lens bottom 21Other Entrance lens 1RF power (kW) 1.35 Fringe bias �2.5Pump rate 6 Entrance plate �31Stabilisation delay 60 Pole bias 0
464 E.A. Vazquez et al.
Dow
nloa
ded
by [
The
Aga
Kha
n U
nive
rsity
] at
07:
34 0
9 O
ctob
er 2
014
for 30 minutes at 200�C with the microwave oven programmed at 300, 600 or 1200 Wattsdepending of the number of samples (510, 10–30 or 30–45 samples, respectively). Afterthis, they were raised to 50mL in plastic flasks and measured in the analytical instrumenttogether clear samples.
2.4 Determination of As and Se in water
2.4.1 Method of analysis
The isotopes selected for As and Se were respectively 75As and 78Se. The stable isotope 89Ywas used as an internal standard to correct the matrix effect and drifts of sensitivity. Theinternal standard was added on-line in different tubes to the samples. The 89Y internalstandard containing 5 mgL�1 of Yttrium was prepared by diluting a 1000mgL�1 stockstandard solution (Inorganic Ventures, Lakewood, NJ, USA).
The calibration curve (0.5, 1, 5, 20, 50, 250mgL�1) was prepared from the standardsolution of As and Se. After the microwave process had concluded, samples wereintroduced in test tubes in the SP3 auto-sampler to be measured by the instrument. When amicrowave process is used the result must be multiplied by a dilution factor.
A 10 mgL�1 standard of As and Se was measured as a quality control sample (QC) foreach 10 samples. Besides, a blank was evaluated after the calibration curve ends, to ensurethat no contamination had, being the value lower than 75% of the quantitation limit.Additionally, three replicates were taken for samples and evaluated for the percentage ofRelative Standard Deviation (RSD) that needed to be lower than the validation results.
2.4.2 Validation of the analytical method
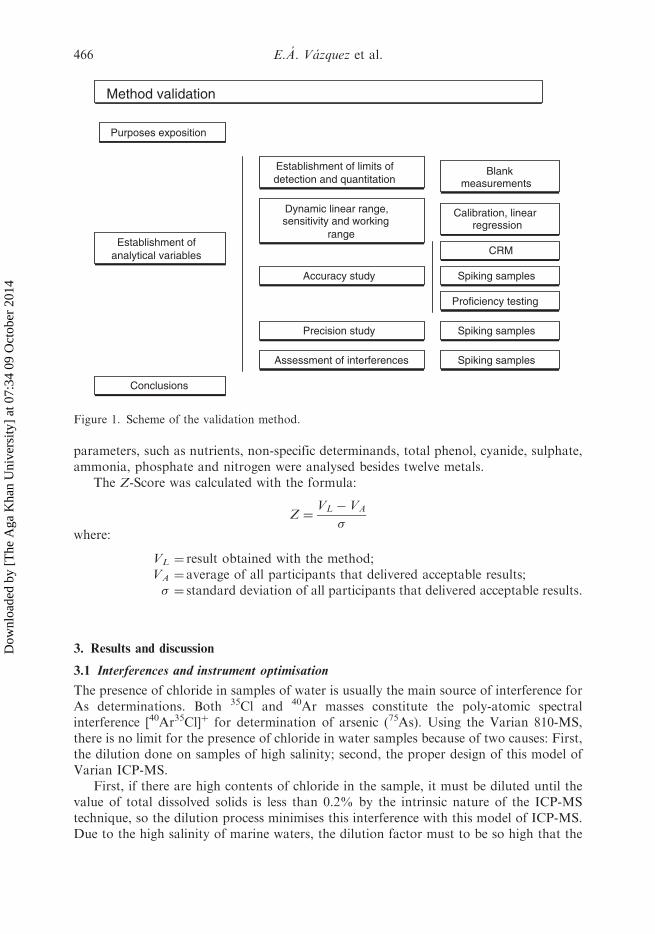
The analytical method validation was designed according to these references: theEurachem Guide [32], the harmonised guidelines for single-laboratory validation ofmethods of analysis [33], the practical guide to Analytical Method Validation [34], theENAC G-CSQ-02 document [35] and the 2002/657/EC Commission Decision of 12 August2002 [36]. Consequently, the validation parameters limits of detection (LOD), workingrange, traceability, accuracy and precision were determined using this method for As andSe. These values were estimated with experiments that are summarised in Figure 1.
For the evaluation of the accuracy and traceability and the precision study of thecomplete procedure on the different matrices of water, two types of standard referencematerials (SRMs) were used: a BCR-714 of influent wastewater (Community ReferenceBureau, BCR, Brussels, Belgium) for complexes matrices and an NIST 1643e ofgroundwater (National Institute of Standards and Technology, NIST, Gaithersburg,MD, USA) for simple matrices. An F-test was applied successfully to corroborate thisspiking samples study for both elements.
2.5 Proficiency study
A proficiency testing was done in collaboration with nine other laboratories – N¼ 10(Aquacheck proficiency test) [37]. The aim of this exercise is usually to ensure the accuracyof all participant laboratories. The proficiency testing followed an operational plan anddistribution schemes of samples based on wastewaters and sludge samples where some
International Journal of Environmental Analytical Chemistry 465
Dow
nloa
ded
by [
The
Aga
Kha
n U
nive
rsity
] at
07:
34 0
9 O
ctob
er 2
014
parameters, such as nutrients, non-specific determinands, total phenol, cyanide, sulphate,ammonia, phosphate and nitrogen were analysed besides twelve metals.
The Z-Score was calculated with the formula:
Z ¼VL � VA
�where:
VL ¼ result obtained with the method;VA ¼ average of all participants that delivered acceptable results;� ¼ standard deviation of all participants that delivered acceptable results.
3. Results and discussion
3.1 Interferences and instrument optimisation
The presence of chloride in samples of water is usually the main source of interference forAs determinations. Both 35Cl and 40Ar masses constitute the poly-atomic spectralinterference [40Ar35Cl]þ for determination of arsenic (75As). Using the Varian 810-MS,there is no limit for the presence of chloride in water samples because of two causes: First,the dilution done on samples of high salinity; second, the proper design of this model ofVarian ICP-MS.
First, if there are high contents of chloride in the sample, it must be diluted until thevalue of total dissolved solids is less than 0.2% by the intrinsic nature of the ICP-MStechnique, so the dilution process minimises this interference with this model of ICP-MS.Due to the high salinity of marine waters, the dilution factor must to be so high that the
Method validation
Purposes exposition
Establishment of analytical variables
Conclusions
Establishment of limits of detection and quantitation
Accuracy study
Precision study
Assessment of interferences
Dynamic linear range, sensitivity and working
range
Blank measurements
Calibration, linear regression
CRM
Spiking samples
Proficiency testing
Spiking samples
Spiking samples
Figure 1. Scheme of the validation method.
466 E.A. Vazquez et al.
Dow
nloa
ded
by [
The
Aga
Kha
n U
nive
rsity
] at
07:
34 0
9 O
ctob
er 2
014
[Ar][Cl] interference result is almost annulled. Consequently, arsenic concentrations as wellas chloride levels are diluted; nevertheless arsenic levels are higher than fresh waters andresulting arsenic concentration rests over the quantitation limit.
On the other hand, in matrices with appreciable levels of chloride but lower values ofsalinity any dilution was necessary in order to reach that total dissolved solids (TDS) beless than 0.2%. In this case the 90-degree reflecting ICP-MS ion optics system minimizesthe interference due to the follows innovative specifications: First, the system designcombines an extremely powerful ionic lens with a mass spectrometer that is configured 90degrees with the cones (improving the signal-noise ratio), allowing together the importantdecrease of the quatitation limits of arsenic in presence of relatively high levels of chloride.Second, this quadrupole is circular, improving the resolution of masses, in front to astandard linear quadrupole, which cannot differentiate between the Asþ and the ArClþ
masses. Asþ and ArClþ masses are similar but they are in fact different and the circularquadrupole improve this mass differentiation. Consequently, both dilution process andexcellent design of this model of MS detector allowed eliminating the [40Ar35Cl]þ
interference.Various aspects were considered in optimising the instrument. Contents in total
dissolved solids are calculated multiplying the value of electrical conductivity in mS cm�1
by the factor 0.64. When samples exceed 0.2% in solids they must be diluted, conse-quently, this reduces the grade of interference with Argon.
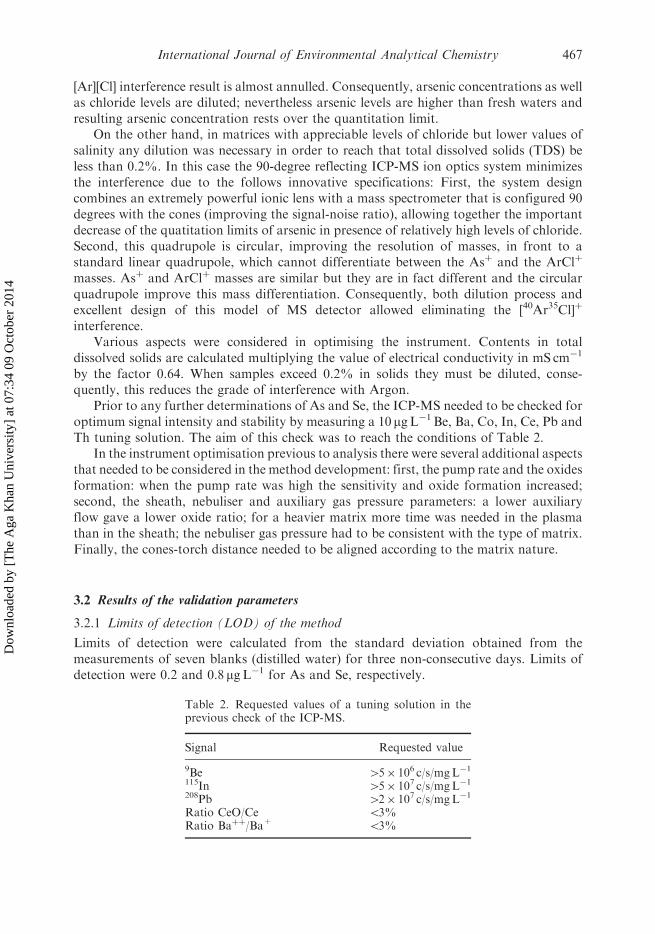
Prior to any further determinations of As and Se, the ICP-MS needed to be checked foroptimum signal intensity and stability by measuring a 10 mgL�1 Be, Ba, Co, In, Ce, Pb andTh tuning solution. The aim of this check was to reach the conditions of Table 2.
In the instrument optimisation previous to analysis there were several additional aspectsthat needed to be considered in the method development: first, the pump rate and the oxidesformation: when the pump rate was high the sensitivity and oxide formation increased;second, the sheath, nebuliser and auxiliary gas pressure parameters: a lower auxiliaryflow gave a lower oxide ratio; for a heavier matrix more time was needed in the plasmathan in the sheath; the nebuliser gas pressure had to be consistent with the type of matrix.Finally, the cones-torch distance needed to be aligned according to the matrix nature.
3.2 Results of the validation parameters
3.2.1 Limits of detection (LOD) of the method
Limits of detection were calculated from the standard deviation obtained from themeasurements of seven blanks (distilled water) for three non-consecutive days. Limits ofdetection were 0.2 and 0.8mgL�1 for As and Se, respectively.
Table 2. Requested values of a tuning solution in theprevious check of the ICP-MS.
Signal Requested value
9Be 45� 106 c/s/mgL�1115In 45� 107 c/s/mgL�1208Pb 42� 107 c/s/mgL�1
Ratio CeO/Ce 53%Ratio Baþþ/Ba+ 53%
International Journal of Environmental Analytical Chemistry 467
Dow
nloa
ded
by [
The
Aga
Kha
n U
nive
rsity
] at
07:
34 0
9 O
ctob
er 2
014
LODs and LOQs were higher when a dilution factor was employed: so, the results weremultiplied by the corresponding dilution factor. When it was necessary to make amicrowave, the dilution factor was 2. Samples of seawater used a dilution factor 10 due totheir high salt concentration, over the maximum of total dissolved solids (0.2%).
3.2.2 Linearity and working range: sensitivity
The ICP-MS calibration curve was linear for both elements with percentages of linearity of99.2 for As and 99.8% for Se. These results are according to the specification of the newion optics system where good long-term stability around 5 hours was achieved for elementswith no sign of interface blockage or ion lens contamination. When the dilution factor wasnot considered, the As working range was 0.5–275.0mgL�1 and the SE working range was1.0–275.0 mgL�1.
The sensitivity obtained was more than 1Gcps permgL�1 (1000 million cps permgL�1). The Gigahertz sensitivity grants the flexibility to choose instrument conditions tosuit the sample and the desired analyte concentration range.
3.2.3 Accuracy and traceability study
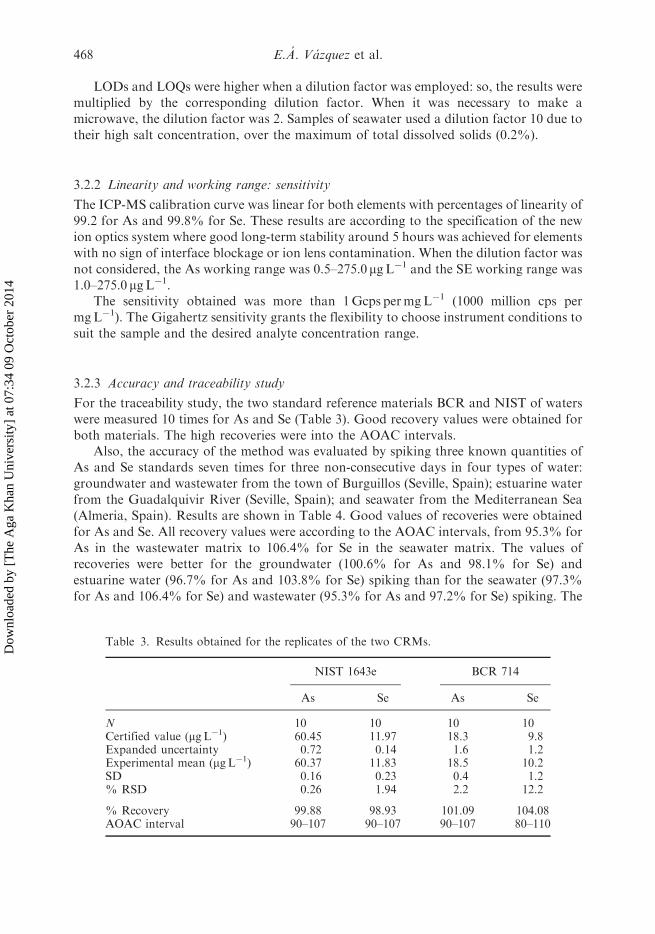
For the traceability study, the two standard reference materials BCR and NIST of waterswere measured 10 times for As and Se (Table 3). Good recovery values were obtained forboth materials. The high recoveries were into the AOAC intervals.
Also, the accuracy of the method was evaluated by spiking three known quantities ofAs and Se standards seven times for three non-consecutive days in four types of water:groundwater and wastewater from the town of Burguillos (Seville, Spain); estuarine waterfrom the Guadalquivir River (Seville, Spain); and seawater from the Mediterranean Sea(Almeria, Spain). Results are shown in Table 4. Good values of recoveries were obtainedfor As and Se. All recovery values were according to the AOAC intervals, from 95.3% forAs in the wastewater matrix to 106.4% for Se in the seawater matrix. The values ofrecoveries were better for the groundwater (100.6% for As and 98.1% for Se) andestuarine water (96.7% for As and 103.8% for Se) spiking than for the seawater (97.3%for As and 106.4% for Se) and wastewater (95.3% for As and 97.2% for Se) spiking. The
Table 3. Results obtained for the replicates of the two CRMs.
NIST 1643e BCR 714
As Se As Se
N 10 10 10 10Certified value (mgL�1) 60.45 11.97 18.3 9.8Expanded uncertainty 0.72 0.14 1.6 1.2Experimental mean (mgL�1) 60.37 11.83 18.5 10.2SD 0.16 0.23 0.4 1.2% RSD 0.26 1.94 2.2 12.2
% Recovery 99.88 98.93 101.09 104.08AOAC interval 90–107 90–107 90–107 80–110
468 E.A. Vazquez et al.
Dow
nloa
ded
by [
The
Aga
Kha
n U
nive
rsity
] at
07:
34 0
9 O
ctob
er 2
014
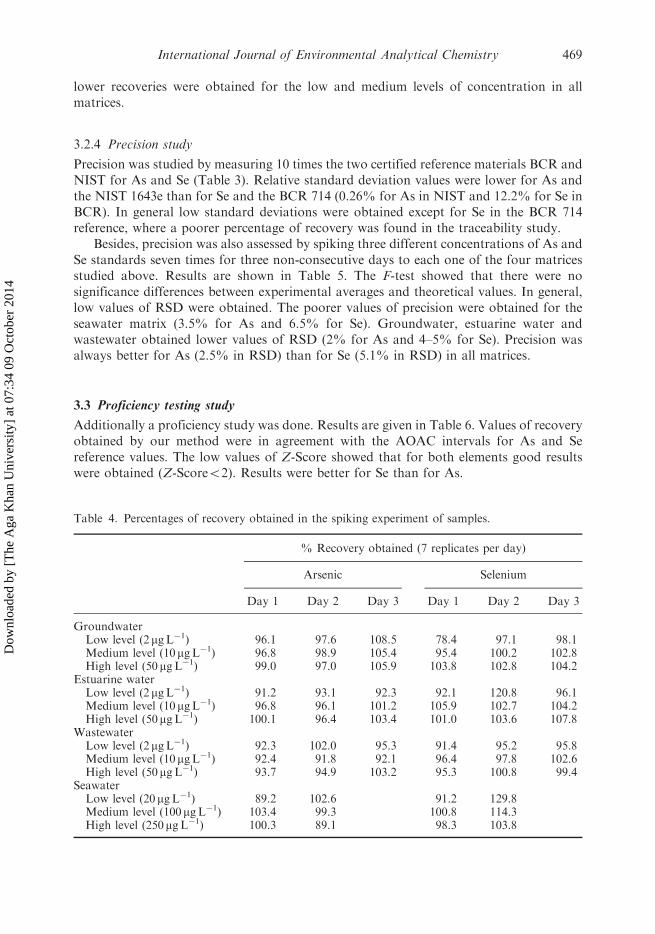
lower recoveries were obtained for the low and medium levels of concentration in allmatrices.
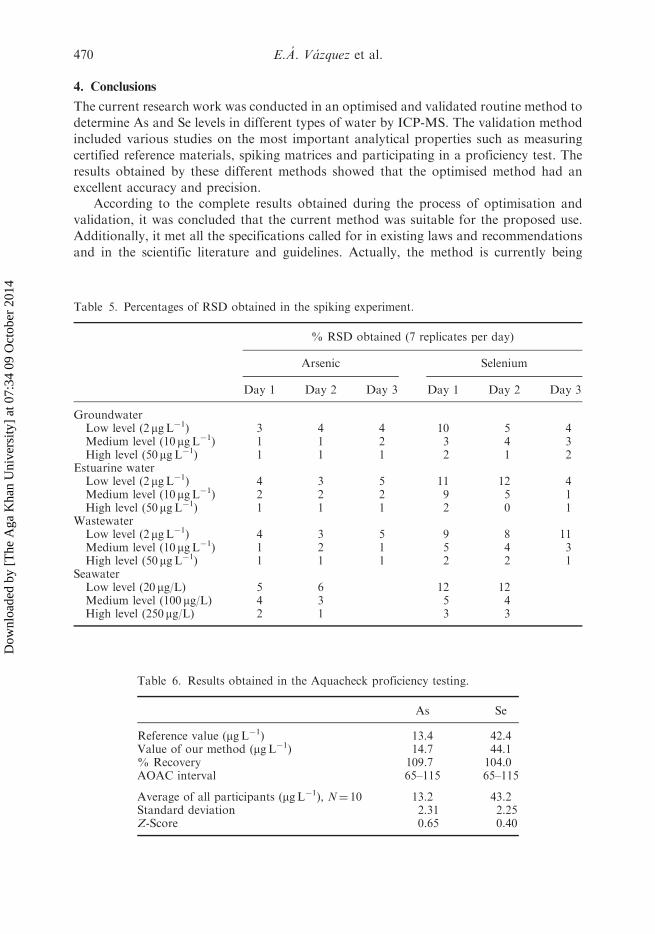
3.2.4 Precision study
Precision was studied by measuring 10 times the two certified reference materials BCR andNIST for As and Se (Table 3). Relative standard deviation values were lower for As andthe NIST 1643e than for Se and the BCR 714 (0.26% for As in NIST and 12.2% for Se inBCR). In general low standard deviations were obtained except for Se in the BCR 714reference, where a poorer percentage of recovery was found in the traceability study.
Besides, precision was also assessed by spiking three different concentrations of As andSe standards seven times for three non-consecutive days to each one of the four matricesstudied above. Results are shown in Table 5. The F-test showed that there were nosignificance differences between experimental averages and theoretical values. In general,low values of RSD were obtained. The poorer values of precision were obtained for theseawater matrix (3.5% for As and 6.5% for Se). Groundwater, estuarine water andwastewater obtained lower values of RSD (2% for As and 4–5% for Se). Precision wasalways better for As (2.5% in RSD) than for Se (5.1% in RSD) in all matrices.
3.3 Proficiency testing study
Additionally a proficiency study was done. Results are given in Table 6. Values of recoveryobtained by our method were in agreement with the AOAC intervals for As and Sereference values. The low values of Z-Score showed that for both elements good resultswere obtained (Z-Score52). Results were better for Se than for As.
Table 4. Percentages of recovery obtained in the spiking experiment of samples.
% Recovery obtained (7 replicates per day)
Arsenic Selenium
Day 1 Day 2 Day 3 Day 1 Day 2 Day 3
GroundwaterLow level (2 mgL�1) 96.1 97.6 108.5 78.4 97.1 98.1Medium level (10mgL�1) 96.8 98.9 105.4 95.4 100.2 102.8High level (50mgL�1) 99.0 97.0 105.9 103.8 102.8 104.2
Estuarine waterLow level (2 mgL�1) 91.2 93.1 92.3 92.1 120.8 96.1Medium level (10mgL�1) 96.8 96.1 101.2 105.9 102.7 104.2High level (50mgL�1) 100.1 96.4 103.4 101.0 103.6 107.8
WastewaterLow level (2 mgL�1) 92.3 102.0 95.3 91.4 95.2 95.8Medium level (10mgL�1) 92.4 91.8 92.1 96.4 97.8 102.6High level (50mgL�1) 93.7 94.9 103.2 95.3 100.8 99.4
SeawaterLow level (20mgL�1) 89.2 102.6 91.2 129.8Medium level (100mgL�1) 103.4 99.3 100.8 114.3High level (250mgL�1) 100.3 89.1 98.3 103.8
International Journal of Environmental Analytical Chemistry 469
Dow
nloa
ded
by [
The
Aga
Kha
n U
nive
rsity
] at
07:
34 0
9 O
ctob
er 2
014
4. Conclusions
The current research work was conducted in an optimised and validated routine method to
determine As and Se levels in different types of water by ICP-MS. The validation method
included various studies on the most important analytical properties such as measuring
certified reference materials, spiking matrices and participating in a proficiency test. The
results obtained by these different methods showed that the optimised method had an
excellent accuracy and precision.According to the complete results obtained during the process of optimisation and
validation, it was concluded that the current method was suitable for the proposed use.
Additionally, it met all the specifications called for in existing laws and recommendations
and in the scientific literature and guidelines. Actually, the method is currently being
Table 5. Percentages of RSD obtained in the spiking experiment.
% RSD obtained (7 replicates per day)
Arsenic Selenium
Day 1 Day 2 Day 3 Day 1 Day 2 Day 3
GroundwaterLow level (2 mgL�1) 3 4 4 10 5 4Medium level (10mgL�1) 1 1 2 3 4 3High level (50mgL�1) 1 1 1 2 1 2
Estuarine waterLow level (2 mgL�1) 4 3 5 11 12 4Medium level (10mgL�1) 2 2 2 9 5 1High level (50mgL�1) 1 1 1 2 0 1
WastewaterLow level (2 mgL�1) 4 3 5 9 8 11Medium level (10mgL�1) 1 2 1 5 4 3High level (50mgL�1) 1 1 1 2 2 1
SeawaterLow level (20mg/L) 5 6 12 12Medium level (100mg/L) 4 3 5 4High level (250mg/L) 2 1 3 3
Table 6. Results obtained in the Aquacheck proficiency testing.
As Se
Reference value (mgL�1) 13.4 42.4Value of our method (mgL�1) 14.7 44.1% Recovery 109.7 104.0AOAC interval 65–115 65–115
Average of all participants (mgL�1), N¼ 10 13.2 43.2Standard deviation 2.31 2.25Z-Score 0.65 0.40
470 E.A. Vazquez et al.
Dow
nloa
ded
by [
The
Aga
Kha
n U
nive
rsity
] at
07:
34 0
9 O
ctob
er 2
014
satisfactorily applied in a routine laboratory with accreditation for about 35 samples
per day.The whole results showed that the limits of detection obtained were consistent with the
requirements of Directive 98/83/EC for drinking-water which states that the detection limit
of the method should be less than 10% of the value of the parametric analyte (10mgL�1
for As and Se). The precision values obtained in the spiking studies were in accordance
with the criteria of Directive 98/83/EC and the criterion of Horwitz [38] to establish a
maximum acceptable precision depending on the concentration.Finally, the evaluation of the accuracy and traceability was done employing various
methods. The accuracy study through the use of a certified reference material has led to
excellent results, showing that the rates of recovery and accuracy levels were appropriate
and the method was free of systematic errors. The accuracy was also evaluated through
spiking studies at three different concentration levels, showing also excellent results. The
percentages of recovery obtained were in accordance with the values tabulated by the
AOAC [39]. The proficiency testing was the external validation, which achieved
satisfactory and relevant results.
References
[1] M. Dakeishi, M. Katsuyuki, and P. Grandjean, Environ. Health 5, 31 (2006).[2] U. Tinggi, Essentiality and Toxicity of Se and Its Status in Australia: A Review (Elsevier Science,
Ireland, 2002).[3] D.L. Macalady, D. Ahmann, and J. Garbarino, Redox transformations, complexation and soil/
sediment interactions of inorganic forms of As and Se in aquatic environments: effects of
natural organic matter tailings and mine waste Colorado ’02, Proceedings of the International
Conference on Tailings and Mine Waste (Colorado, USA, 2002).[4] A.A. Carbonell-Barrachina, F.M. Burlo-Carbonell, and J.J. Mataix-Beneyto, Arsenico en el
sistema suelo planta. Significado Ambiental (Ed.: Universidad de Alicante, 1995).[5] U.K. Chowdhury, B.K. Biswas, T.R. Chowdhury, G. Samanta, B.K. Mandal, G.C. Basu,
C.R. Chanda, D. Lodh, K.C. Saha, S.K. Mukherjee, S. Roy, S. Kabir, Q. Quamruzzaman, and
D. Chakraborti, Curr. Sci. India 73, 48 (1997).[6] M. Tondel, M. Rahman, and A. Magnuson, Environ. Health Persp. 107, 727 (1999).
[7] M.M. Rahman, U.K. Chowdhury, K. Paul, M.K. Sengupta, and D. Lodh, World Health
Organ. 83, 1 (2005).[8] S.R. Panthi, S. Sharma, and A.K. Mishra, Kathmandu Univ. J. Sci. Engin. Technol. 2, 1 (2006).
[9] US-ATSDR. ToxFAQTM for As. Agency for Toxic Substances & Disease Registry. Department
of Health and Human Services (Buford Hwy NE, Atlanta, GA, USA). http://www.atsdr.cdc.
gov/tfacts2.html (2007).[10] US-ATSDR. ToxFAQTM for Se. Agency for Toxic Substances & Disease Registry. Department
of Health and Human Services (Buford Hwy NE, Atlanta, GA, USA). http://www.atsdr.cdc.
gov/tfacts92.html (2003).[11] US-EPA Environmental Protection Agency. National Primary Drinking Water Standards. Office
of Water (4606M). EPA 816-F-03-016. http://www.epa.gov/safewater/consumer/pdf/mcl.pdf
(2003).
[12] WHO. Guidelines for Drinking-water Quality, 3rd ed. http://www.who.int/water_sanitation_
health/dwq/gdwq3rev/en/(2004).
[13] Directive 2000/60/EC of the European Parliament and of the Council of 23 October 2000
establishing a framework for Community action in the field of water policy.
International Journal of Environmental Analytical Chemistry 471
Dow
nloa
ded
by [
The
Aga
Kha
n U
nive
rsity
] at
07:
34 0
9 O
ctob
er 2
014
[14] US-EPA Environmental Protection Agency. Method 6010B. Inductively Coupled Plasma.Atomic Emission Spectrometry. Revision 2 (1996).
[15] Standard Method 3120 B. Inductively Coupled Plasma (ICP) Method, Standard Methods for theExamination of Water and Wastewater, 19th ed. (American Public Health Association,
Washington, 1995).[16] US-EPA Environmental Protection Agency. Method 200.9. Determination of Trace
Elements by Stabilized Temperature Graphite Furnace Atomic Absorption. Revision 2.2,
Methods for the Determination of Metals in Environmental Samples – Supplement I, EPA7600/R-94-111 (1994).
[17] Standard Method 3113 B. Electrothermal Atomic Absorption Spectrometric Method, Standard
Methods for the Examination of Water and Wastewater, 19th ed. (American Public HealthAssociation, Washington, 1995).
[18] Standard Method 3114 B. Manual Hydride Generation/Atomic Absorption Spectrometric
Method, Standard Methods for the Examination of Water and Wastewater, 19th ed. (AmericanPublic Health Association, Washington, 1995).
[19] US-EPA Environmental Protection Agency. Method 7740. Method for Analysis of Aqueous SeSamples by GHAA (1997).
[20] Standard Method 3500 B. As. Colorimetric Method, Standard Methods for the Examination ofWater and Wastewater, 19th ed. (American Public Health Association, Washington, 1995).
[21] Standard Method 3500C. Se. Colorimetric Method, Standard Methods for the Examination of
Water and Wastewater, 19th ed. (American Public Health Association, Washington, 1995).[22] E.C.V. Butler, J. Chromatogr. 450, 353 (1988).[23] S.H. Vien and R.C. Fry, Anal. Chem. 60, 465 (1988).
[24] Y. Odanaka, N. Tsuchiya, O. Matano, and S. Goto, Anal. Chem. 55, 939 (1983).[25] P. Anjali, R.J. Nikhil, K.S. Tapan, B. Manas, and P. Tarasankar, Anal. Comm. 33, 315 (1996).[26] R.S. Braman, D.L. Johnson, and C.C. Foreback, Anal. Chem. 49, 621 (1977).[27] I. Drabaek, V. Carlsen, and L. Just, J. Radioanal. Nucl. Ch. 103, 249 (1986).
[28] K. McLaughlin, D. Boyd, C. Hua, and M.R. Smyt, Electroanalysis 4, 689 (2005).[29] US-EPA Environmental Protection Agency. Method 6020A. Inductively Coupled Plasma Mass
Spectrometry. Revision 1 (1998).
[30] US-EPA Environmental Protection Agency. Method 200.8. Determination of Trace Elements inWaters and Wastes by Inductively Coupled Plasma Mass Spectrometry. Revision 5.4 (1994).
[31] ISO 17294_2. Water Quality. Application of inductively coupled plasma mass spectrometry.
Part 2. Determination of 62 elements (2003).[32] Eurachem Guide. The fitness for purpose of analytical methods. A laboratory guide to
method validation and related topics. LGC. http://www.eurachem.org/guides/valid.pdf (1998).
[33] M. Thompson, S.L.R. Ellison, and R. Wood, Pure Appl. Chem. 74, 835 (2002).[34] J.M. Green, Anal. Chem. 68, 305A (1996).[35] ENAC G-CSQ-02, Guıa para los laboratorios que realizan validaciones de metodos de analisis
quımicos (Entidad Nacional de Acreditacion, Spain, 1996).
[36] 2002/657/EC: Commission Decision of 12 August 2002 implementing Council Directive 96/23/EC concerning the performance of analytical methods and the interpretation of results. Doc.No. C(2002) 3044 (2002).
[37] Aquacheck. Issue No. 2006-7/1. Aquacheck distribution No. 307 (2006).[38] W. Horwitz, Anal. Chem. 54, 67 (1994).[39] AOAC peer verified methods programme. Manual on Policies and Procedures (1993).
472 E.A. Vazquez et al.
Dow
nloa
ded
by [
The
Aga
Kha
n U
nive
rsity
] at
07:
34 0
9 O
ctob
er 2
014