Embed Size (px)
Citation preview
Optimal Trait Scoring for Age Estimation
Lyle W. Konigsberg and Susan R. Frankenberg
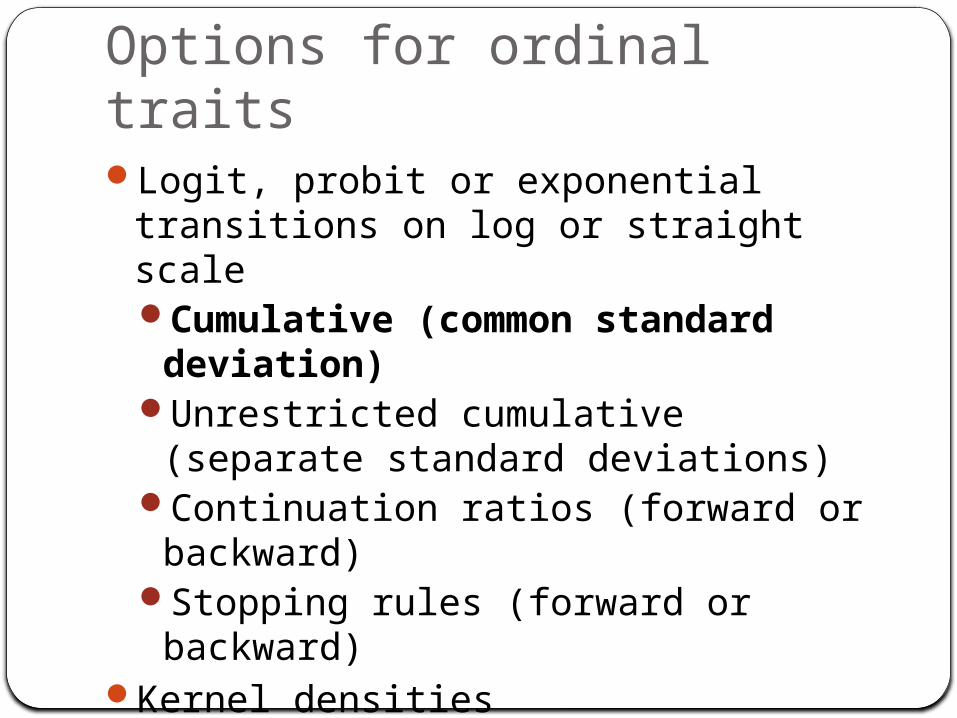
Options for ordinal traitsLogit, probit or exponential transitions
on log or straight scaleCumulative (common standard deviation)
Unrestricted cumulative (separate standard deviations)
Continuation ratios (forward or backward)
Stopping rules (forward or backward)Kernel densitiesSugeno fuzzy integral
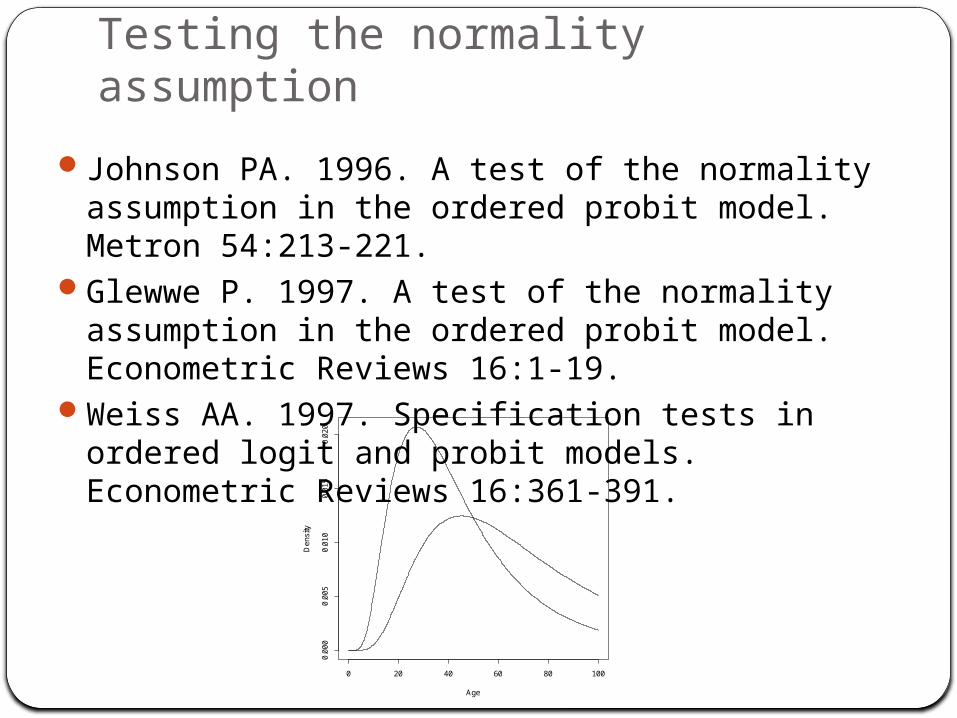
Testing the normality assumption
Johnson PA. 1996. A test of the normality assumption in the ordered probit model. Metron 54:213-221.
Glewwe P. 1997. A test of the normality assumption in the ordered probit model. Econometric Reviews 16:1-19.
Weiss AA. 1997. Specification tests in ordered logit and probit models. Econometric Reviews 16:361-391.
0 20 40 60 80 100
0.0
000
.005
0.0
100
.015
0.0
20
Age
Den
sity
Materials
Todd scores from:422 males (Terry Collection)332 females (Terry Collection)163 females (Gilbert and McKern)
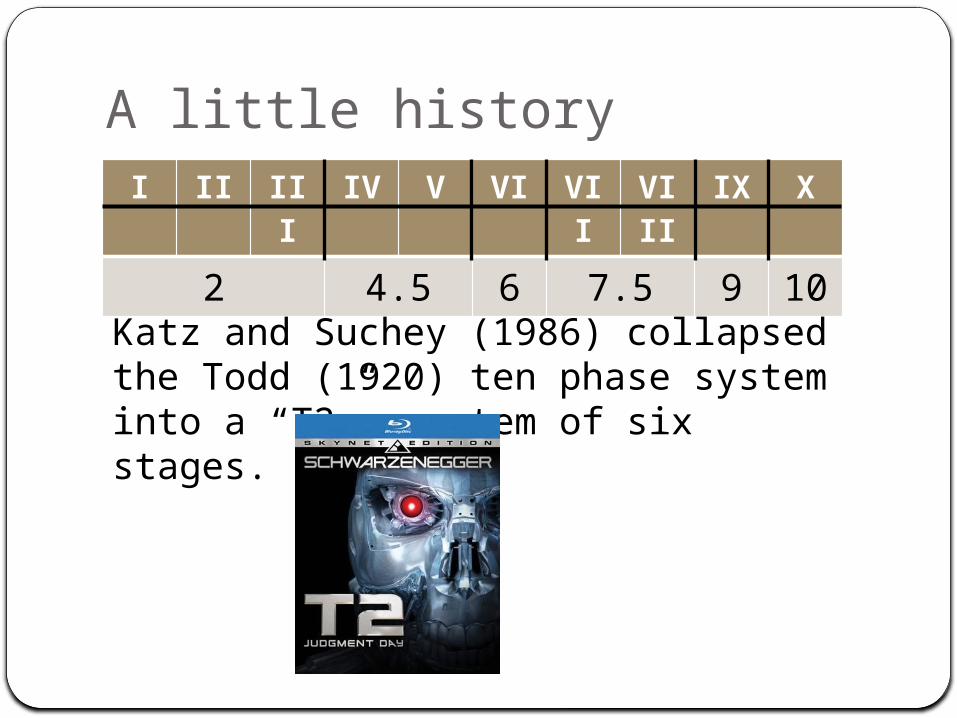
A little historyI II III IV V VI VII VII
IIX X
2 4.5 6 7.5 9 10
Katz and Suchey (1986) collapsed the Todd (1920) ten phase system into a “T2” system of six stages.
I II III IV V VI VII VIII
IX X
1 2 3 4 5 6
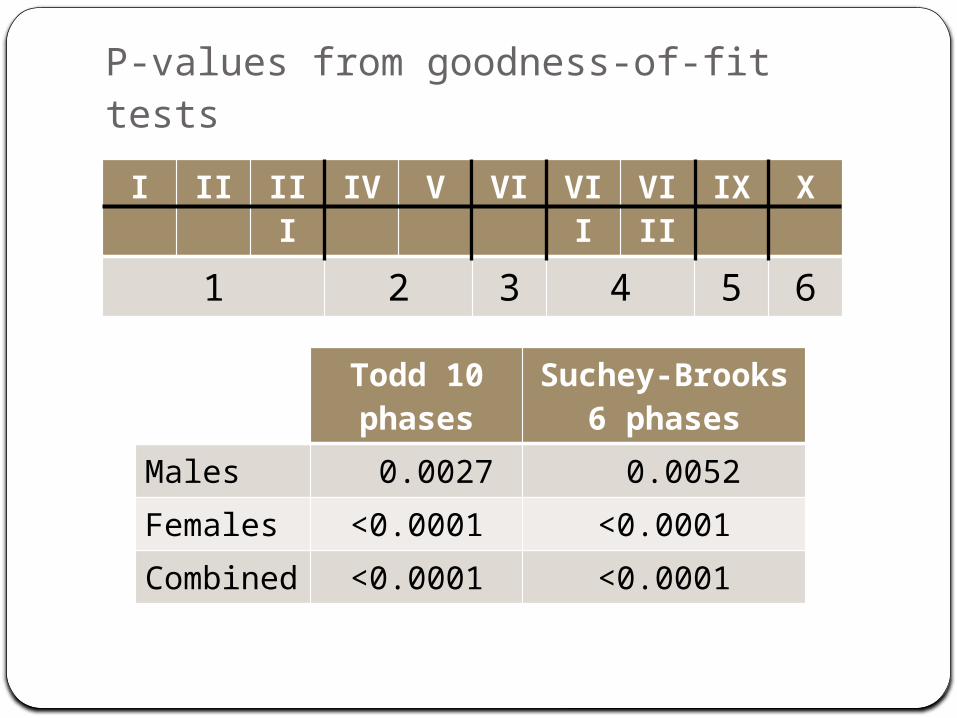
P-values from goodness-of-fit tests
Todd 10 phases
Suchey-Brooks 6 phases
Males 0.0027 0.0052
Females <0.0001 <0.0001
Combined
<0.0001 <0.0001
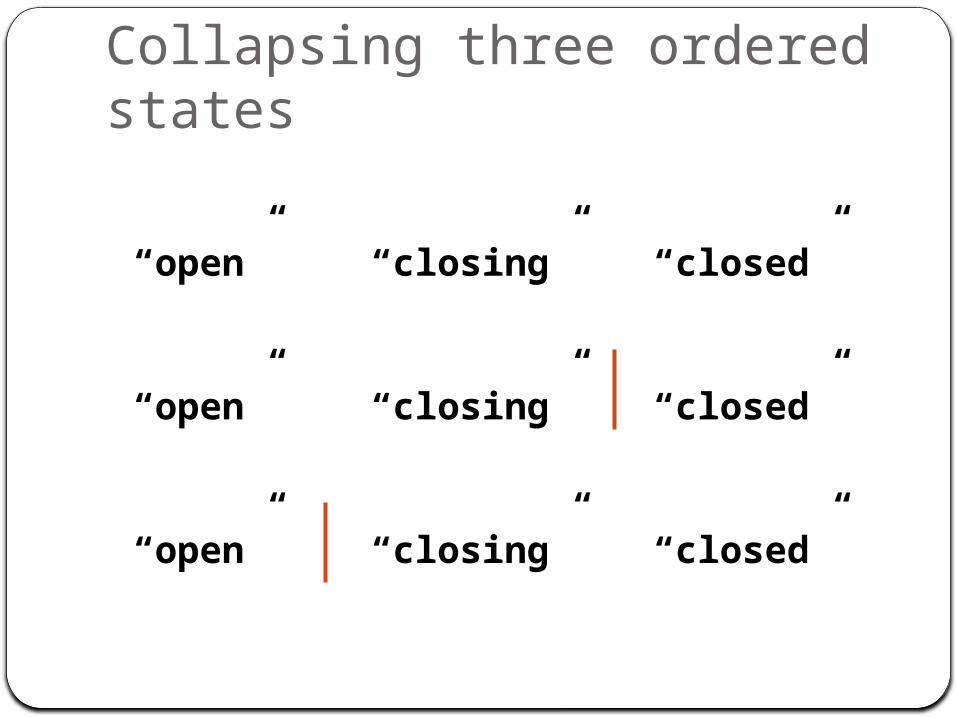
Collapsing three ordered states
“open” “closing” “closed”
“open” “closing” “closed”
“open” “closing” “closed”
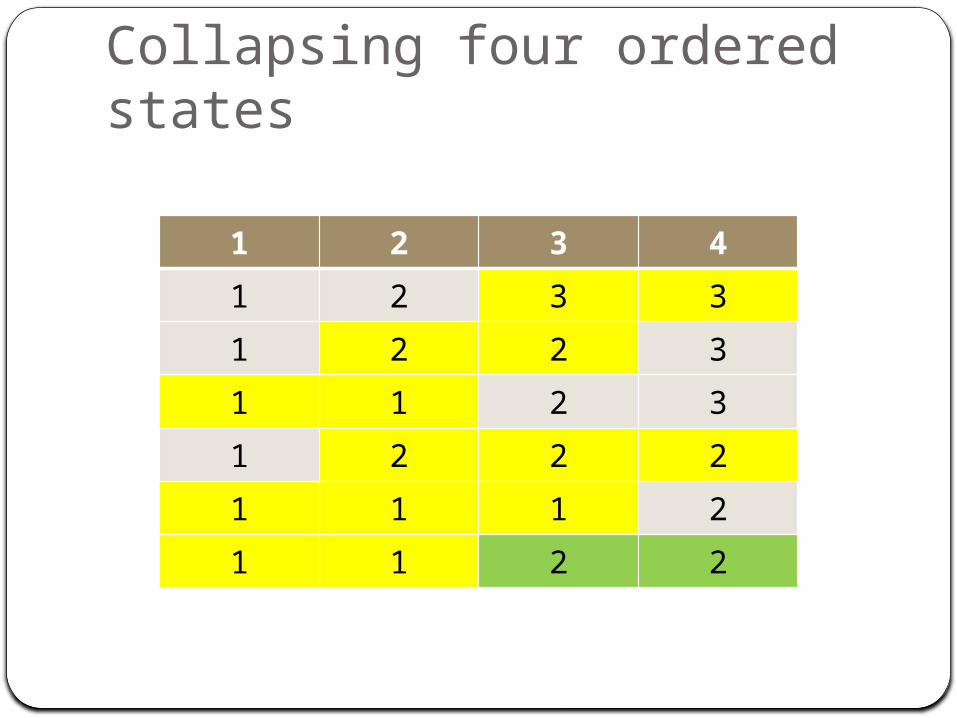
Collapsing four ordered states
1 2 3 4
1 2 3 3
1 2 2 3
1 1 2 3
1 2 2 2
1 1 1 2
1 1 2 2
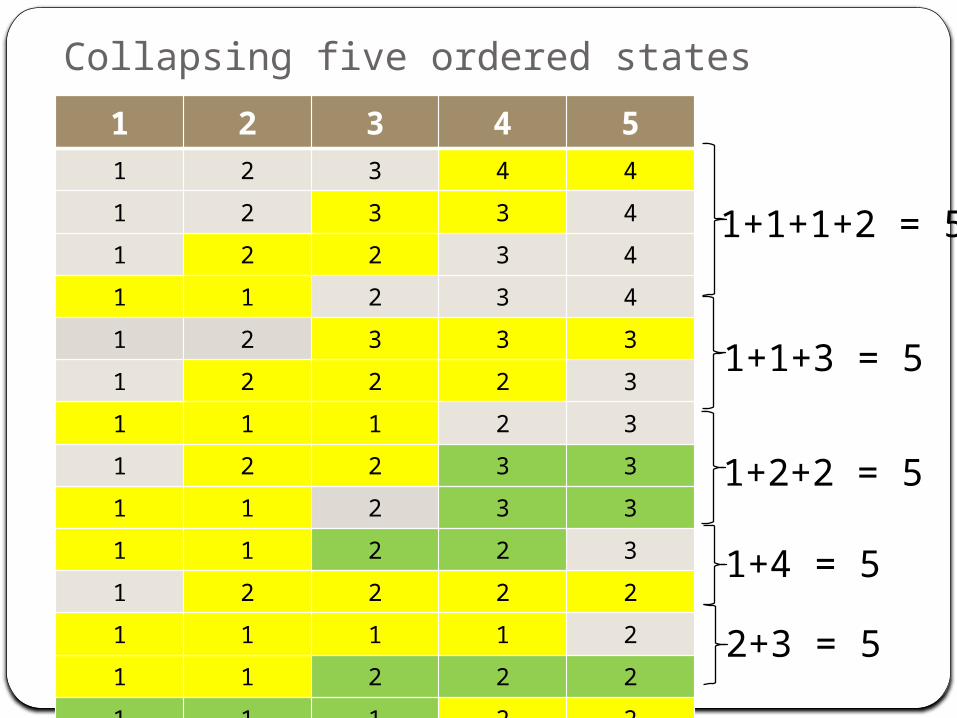
Collapsing five ordered states1 2 3 4 51 2 3 4 4
1 2 3 3 4
1 2 2 3 4
1 1 2 3 4
1 2 3 3 3
1 2 2 2 3
1 1 1 2 3
1 2 2 3 3
1 1 2 3 3
1 1 2 2 3
1 2 2 2 2
1 1 1 1 2
1 1 2 2 2
1 1 1 2 2
1+1+1+2 = 5
1+1+3 = 5
1+2+2 = 5
1+4 = 5
2+3 = 5
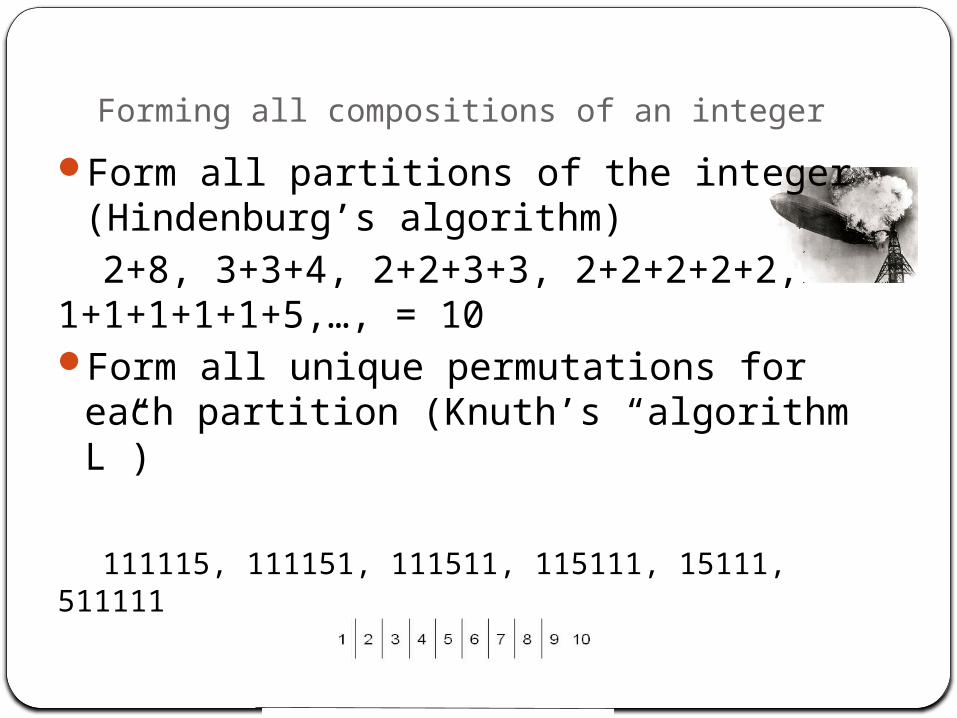
Forming all compositions of an integerForm all partitions of the integer
(Hindenburg’s algorithm)2+8, 3+3+4, 2+2+3+3,
2+2+2+2+2, 1+1+1+1+1+5,…, = 10Form all unique permutations for each
partition (Knuth’s “algorithm L”)
111115, 111151, 111511, 115111, 15111, 511111
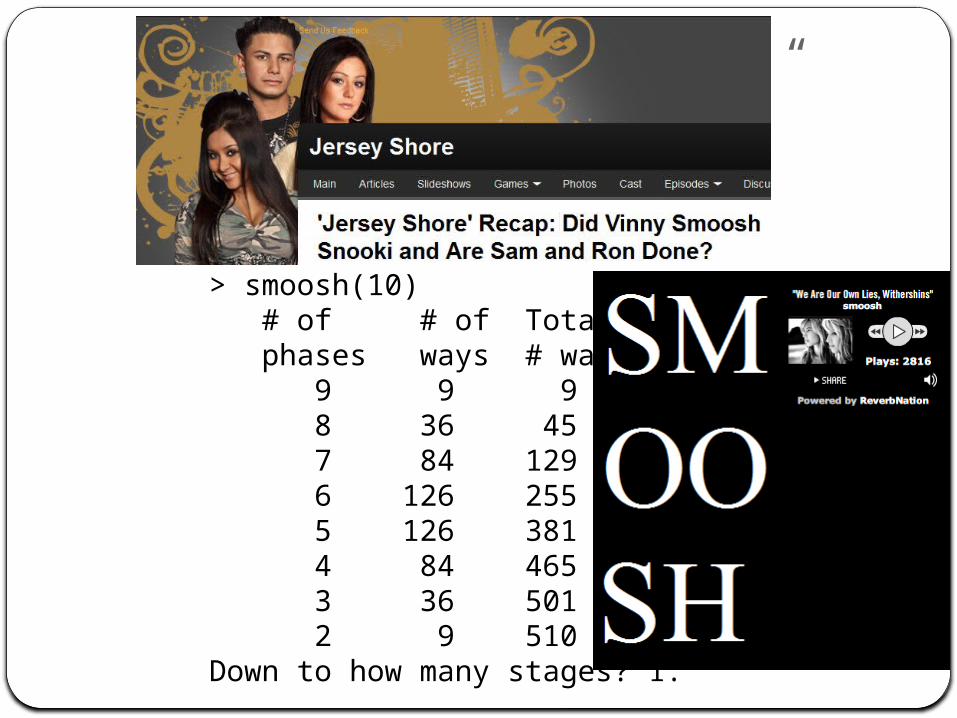
> smoosh(10) # of # of Total phases ways # ways 9 9 9 8 36 45 7 84 129 6 126 255 5 126 381 4 84 465 3 36 501 2 9 510Down to how many stages? 1:
The “R” script “smoosh”
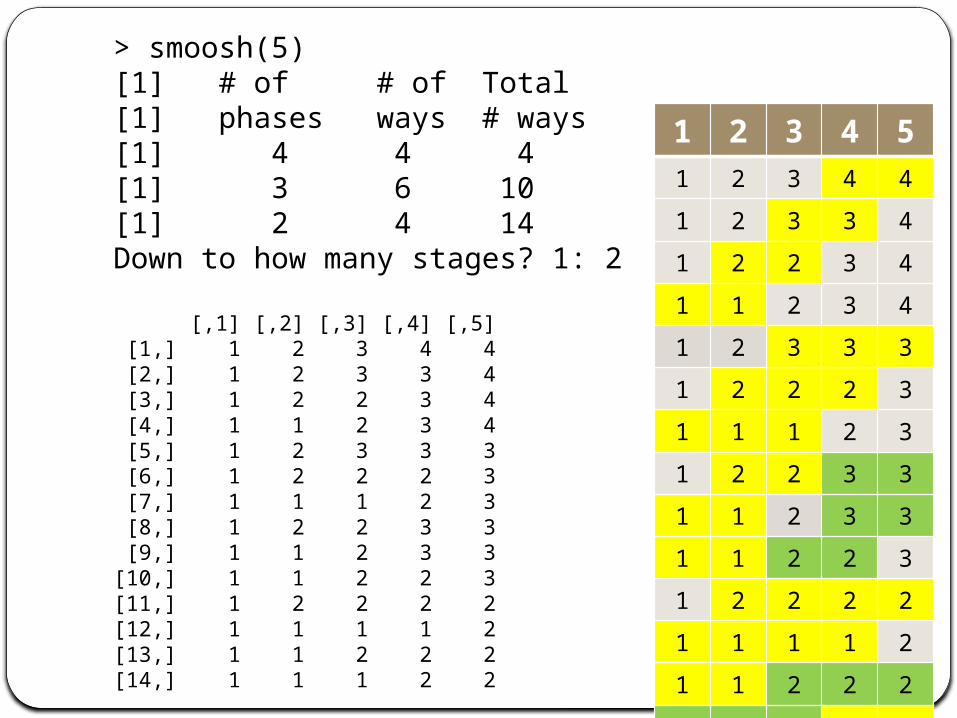
> smoosh(5)[1] # of # of Total[1] phases ways # ways[1] 4 4 4[1] 3 6 10[1] 2 4 14Down to how many stages? 1: 2
[,1] [,2] [,3] [,4] [,5] [1,] 1 2 3 4 4 [2,] 1 2 3 3 4 [3,] 1 2 2 3 4 [4,] 1 1 2 3 4 [5,] 1 2 3 3 3 [6,] 1 2 2 2 3 [7,] 1 1 1 2 3 [8,] 1 2 2 3 3 [9,] 1 1 2 3 3[10,] 1 1 2 2 3[11,] 1 2 2 2 2[12,] 1 1 1 1 2[13,] 1 1 2 2 2[14,] 1 1 1 2 2
1 2 3 4 51 2 3 4 4
1 2 3 3 4
1 2 2 3 4
1 1 2 3 4
1 2 3 3 3
1 2 2 2 3
1 1 1 2 3
1 2 2 3 3
1 1 2 3 3
1 1 2 2 3
1 2 2 2 2
1 1 1 1 2
1 1 2 2 2
1 1 1 2 2
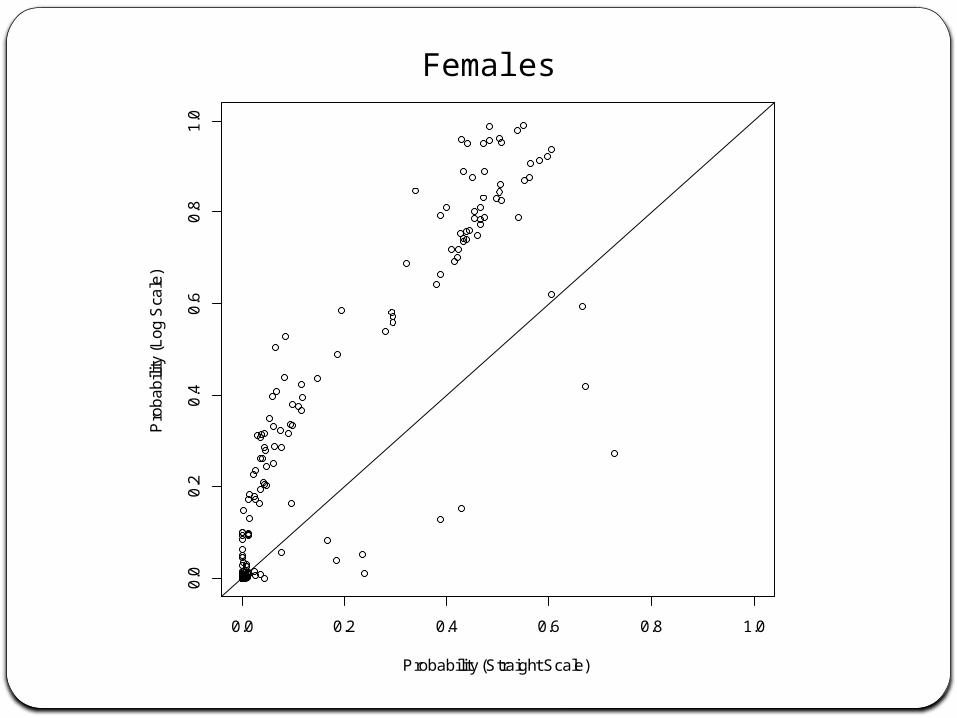
Females
0.0 0.2 0.4 0.6 0.8 1.0
0.0
0.2
0.4
0.6
0.8
1.0
Probability (Straight Scale)
Pro
ba
bili
ty (
Lo
g S
cale
)
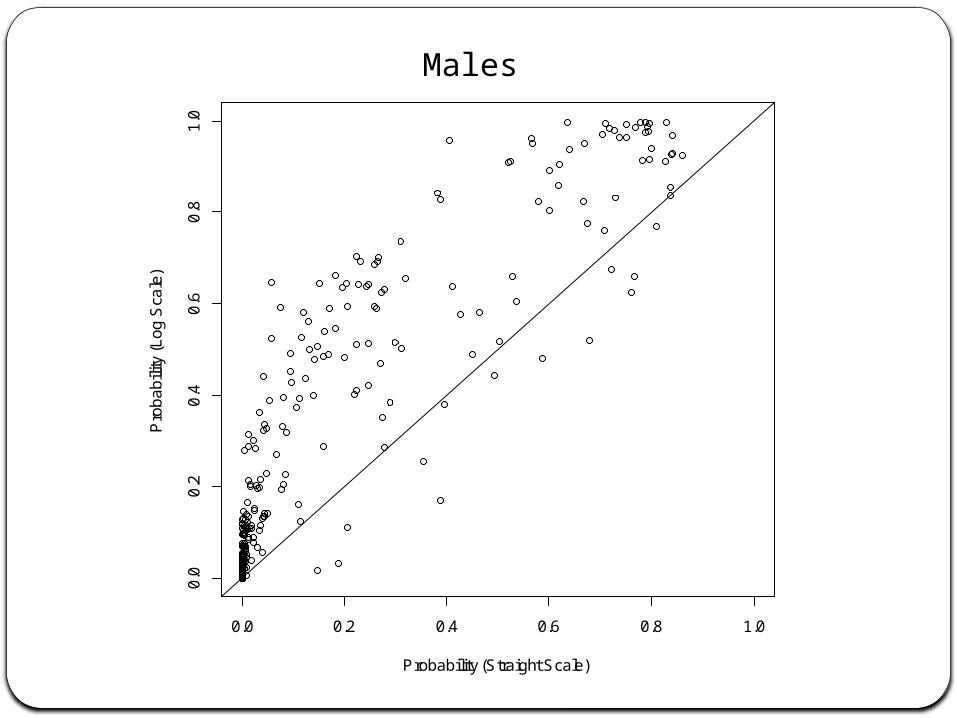
Males
0.0 0.2 0.4 0.6 0.8 1.0
0.0
0.2
0.4
0.6
0.8
1.0
Probability (Straight Scale)
Pro
ba
bili
ty (
Lo
g S
cale
)
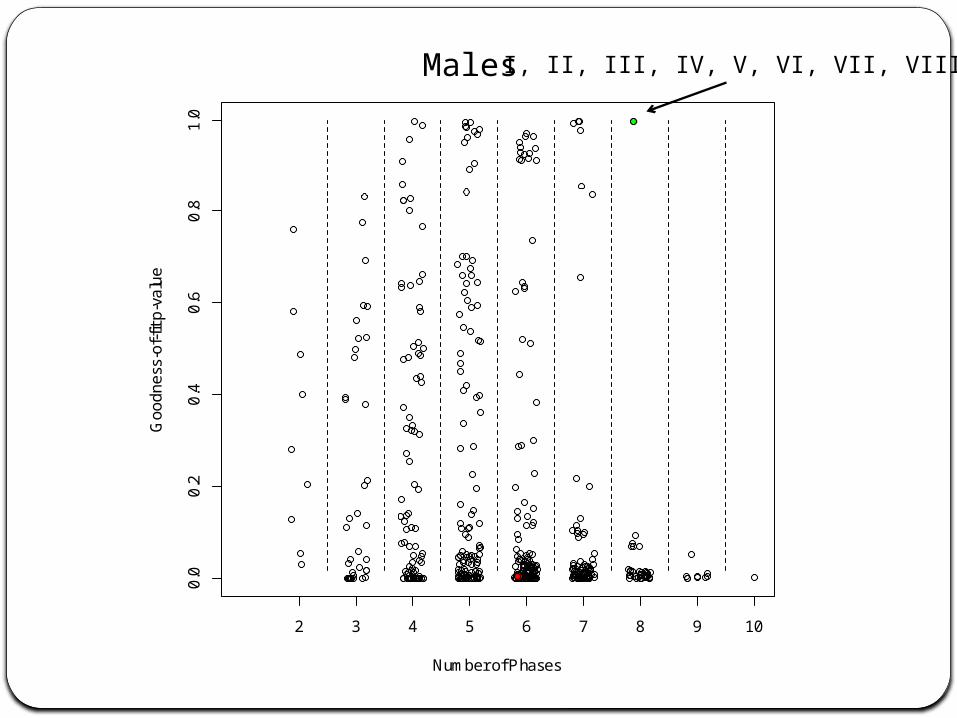
Males
Number of Phases
Go
od
ne
ss-o
f-fit
p-v
alu
e
0.0
0.2
0.4
0.6
0.8
1.0
2 3 4 5 6 7 8 9 10
I, II, III, IV, V, VI, VII, VIII-X
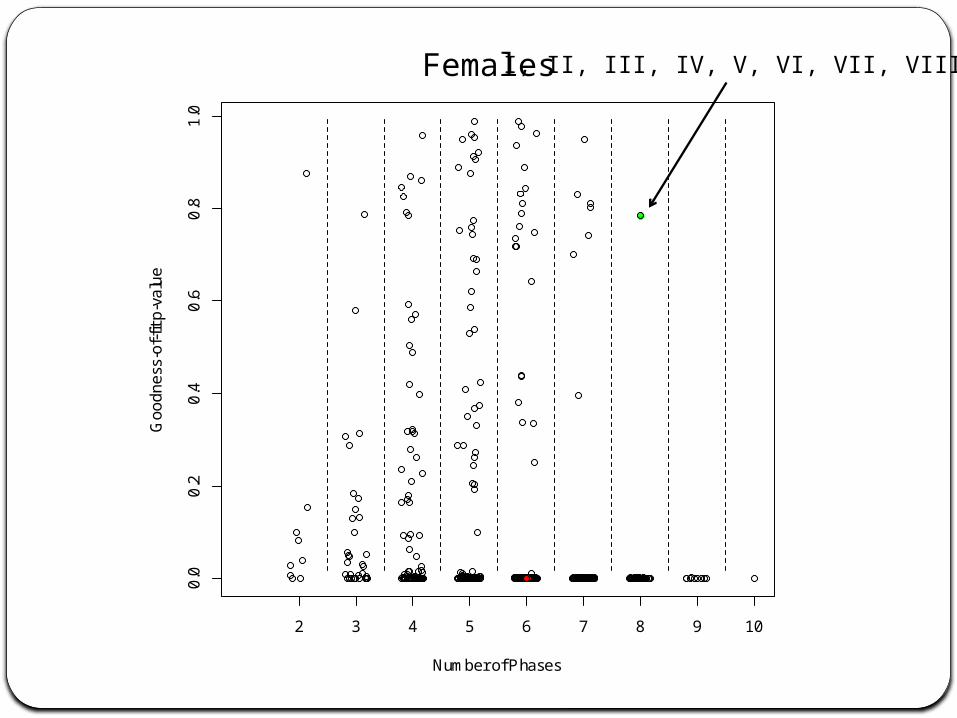
Females I, II, III, IV, V, VI, VII, VIII-X
Number of Phases
Go
od
ne
ss-o
f-fit
p-v
alu
e
0.0
0.2
0.4
0.6
0.8
1.0
2 3 4 5 6 7 8 9 10
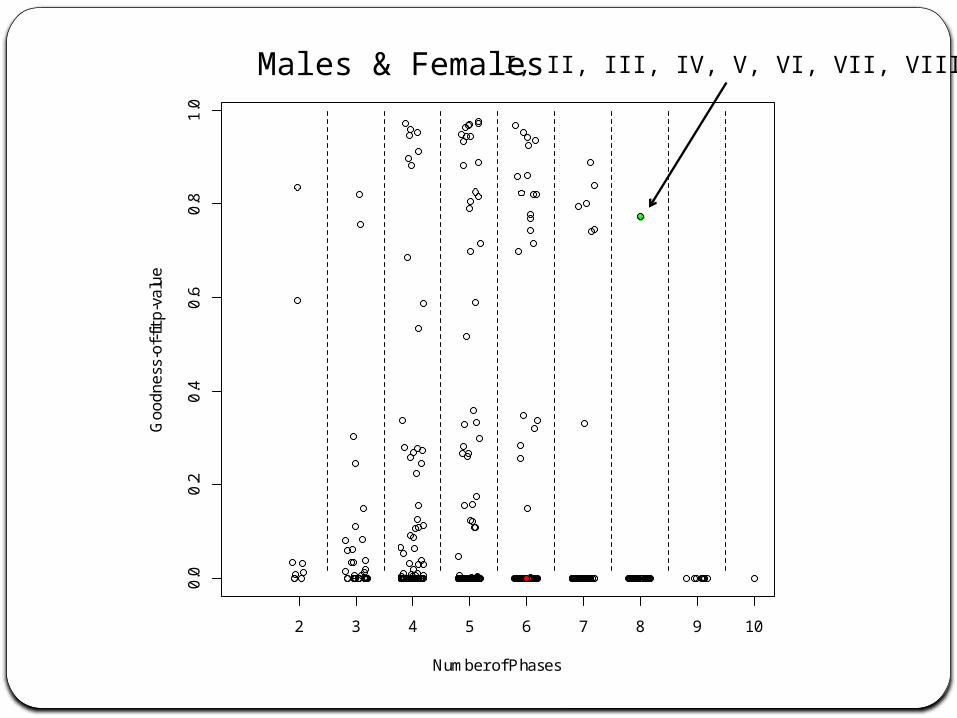
Males & Females I, II, III, IV, V, VI, VII, VIII-X
Number of Phases
Go
od
ne
ss-o
f-fit
p-v
alu
e
0.0
0.2
0.4
0.6
0.8
1.0
2 3 4 5 6 7 8 9 10
20 60 100
0.0
0.2
0.4
0.6
0.8
1.0
Stage I
Age
Pro
babi
lity
20 60 100
0.0
0.2
0.4
0.6
0.8
1.0
Stage II
Age
Pro
babi
lity
20 60 100
0.0
0.2
0.4
0.6
0.8
1.0
Stage III
Age
Pro
babi
lity
20 60 100
0.0
0.2
0.4
0.6
0.8
1.0
Stage IV
Age
Pro
babi
lity
20 60 100
0.0
0.2
0.4
0.6
0.8
1.0
Stage V
Age
Pro
babi
lity
20 60 100
0.0
0.2
0.4
0.6
0.8
1.0
Stage VI
Age
Pro
babi
lity
20 60 100
0.0
0.2
0.4
0.6
0.8
1.0
Stage VII
Age
Pro
babi
lity
20 60 100
0.0
0.2
0.4
0.6
0.8
1.0
Stage VIII-X
Age
Pro
babi
lity
Females
Age
De
nsi
ty
20 40 60 80 100
Males
Age
De
nsi
ty
20 40 60 80 100
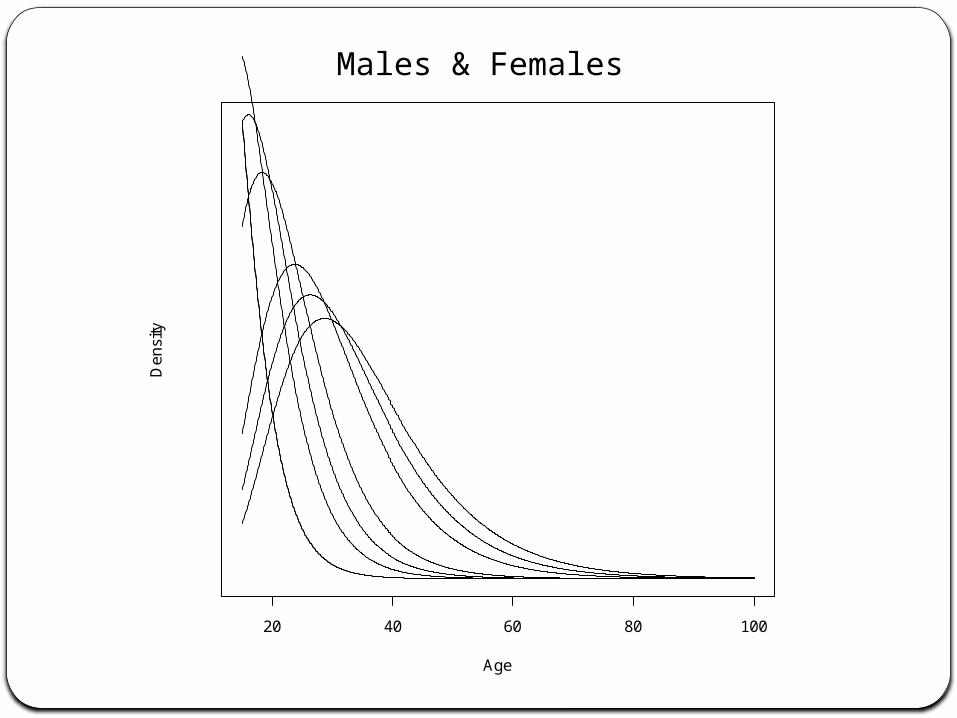
Males & Females
Age
De
nsi
ty
20 40 60 80 100
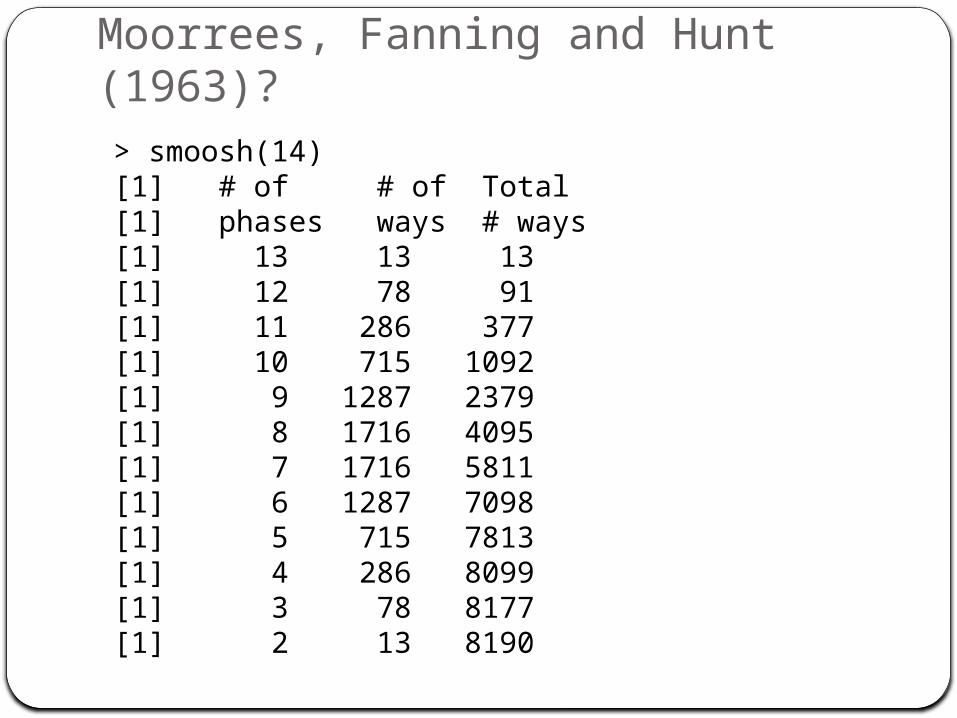
> smoosh(14)[1] # of # of Total[1] phases ways # ways[1] 13 13 13[1] 12 78 91[1] 11 286 377[1] 10 715 1092[1] 9 1287 2379[1] 8 1716 4095[1] 7 1716 5811[1] 6 1287 7098[1] 5 715 7813[1] 4 286 8099[1] 3 78 8177[1] 2 13 8190
Moorrees, Fanning and Hunt (1963)?
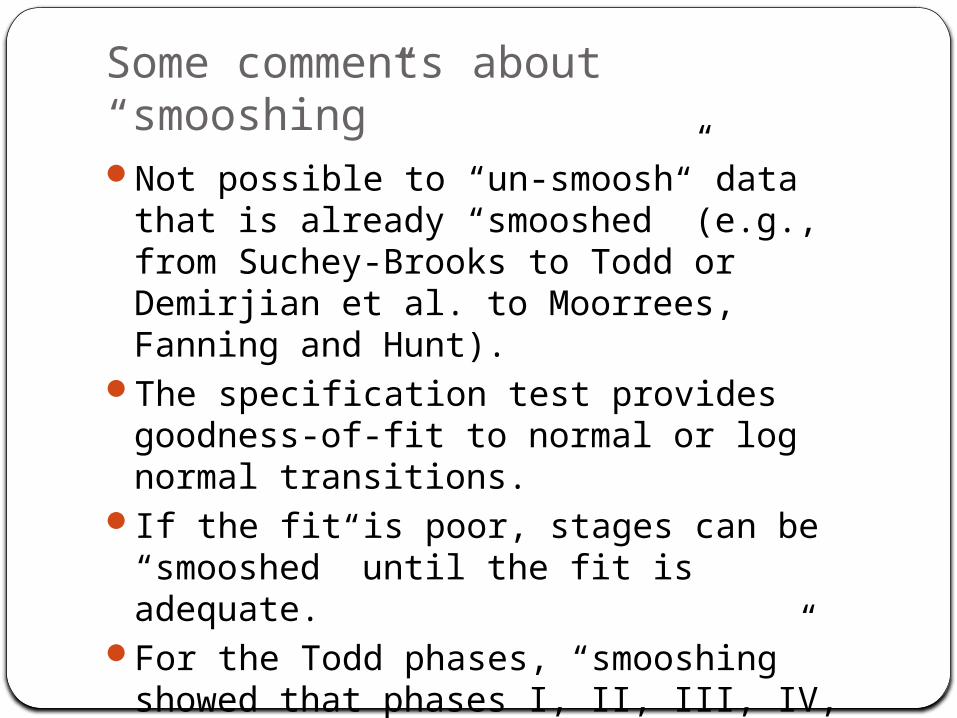
Some comments about “smooshing”Not possible to “un-smoosh” data that is
already “smooshed” (e.g., from Suchey-Brooks to Todd or Demirjian et al. to Moorrees, Fanning and Hunt).
The specification test provides goodness-of-fit to normal or log normal transitions.
If the fit is poor, stages can be “smooshed” until the fit is adequate.
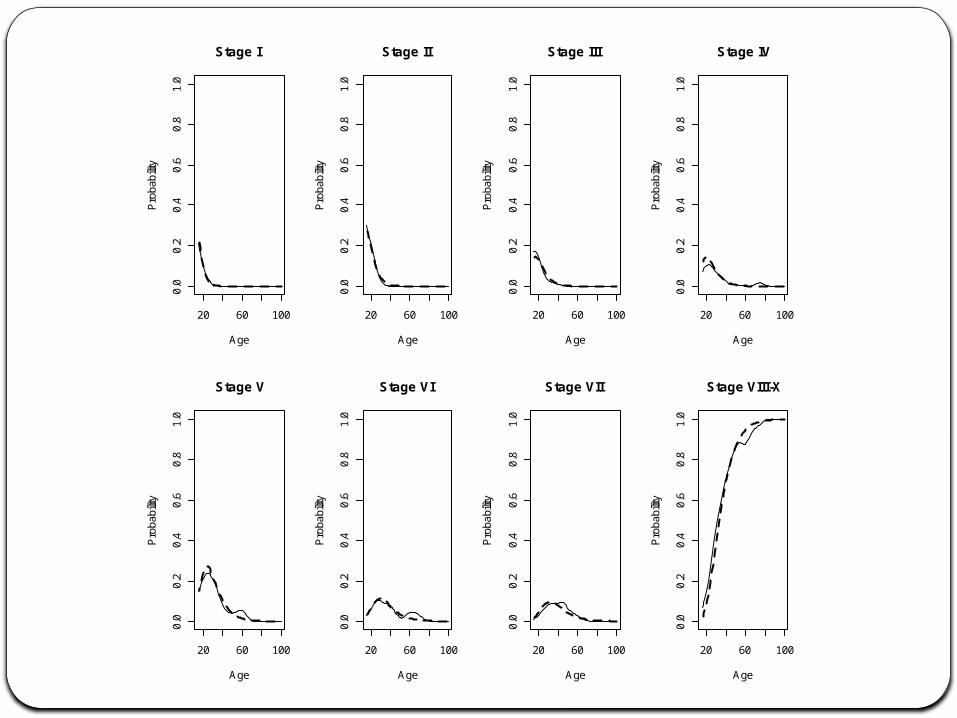
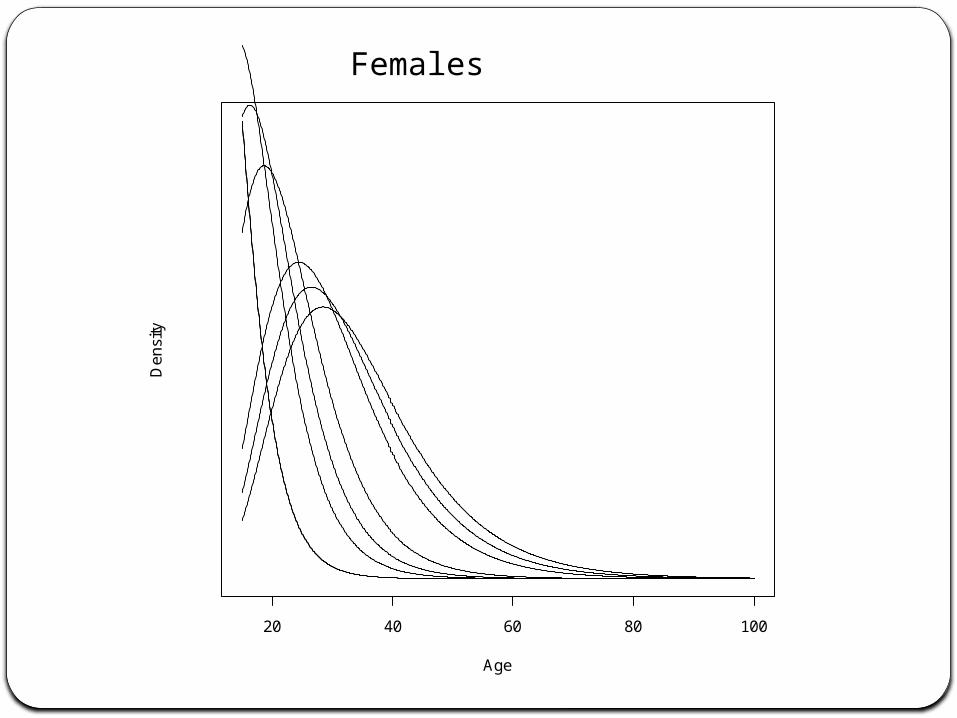
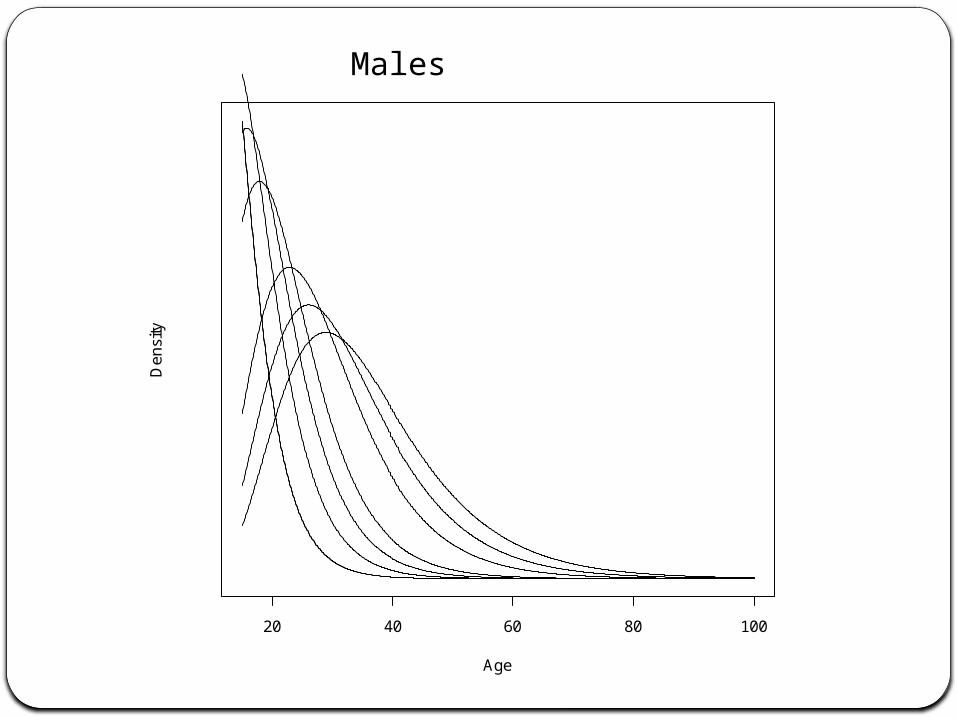
For the Todd phases, “smooshing” showed that phases I, II, III, IV, V, VI, VII, and VIII-X fit to log normal transitions with a common log variance.
AcknowledgmentData collection supported by NSF SBR-9727386 to LWK