Embed Size (px)
Citation preview

Optimal Synthesis of Integrated Gasification Combined Cycle (IGCC) Systems
R. S. Kamath, I. E. Grossmann, L. T. Biegler Department of Chemical Engineering
Carnegie Mellon University Pittsburgh, PA 15213
March, 2011

2
Problem Statement
Given Type of coal (quality, composition)
Power demand Mode of operation (with or without chemical/H2 production) Extent of CO2 capture Location of site Ambient conditions for utilities (air, water)
Determine Optimal structural configuration and operating conditions
Minimize Investment and operating costs
Additional constraints to be met Environmental emissions (current or more stringent future ones)

3
Superstructure for IGCC
C oal Handling Gas ifier
S team Generation
HeatR ecovery
S teamTurbine
GasTurbine
S yngas C ooling
P roces sC ondens ateTreatment
Ac id g asC leaning
&S ulfur
R ecovery
C O2
C aptureH2
P roduc tion
H2/C O R atioAdjus tment
(S hift)
C hemicalP roduc tion
C oal
R awS yngas
C ondensate
C ooledS yngas
S
S M
S S
PowerP roduc tion
C oal
M
TreatedWastewater
S ulfur
C hemical
To C O2 s torage
H2
C leanS yngas
E lectricalE nergy
InjectionS team
MechanicalP ower
Hot E xhaust gas
E xhaust gasAir
As hTreatment
Ash/S lag
TurbineF uel
T reatedAsh
WHB S team
WHB S team
Gas ifier S team
S uperheatedS team
Boiler F uel
P rocessS team
C ondensate
E lectricalE nergy
T reatedTailgas
C OAL GAS IF IC ATION S E C T ION
POWE R GE NE RATION S E C T ION
C oal Handling Gas ifier
A irS eparation
Unit
S team Generation
HeatR ecovery
S teamTurbine
GasTurbine
S yngas C ooling
P roces sC ondens ateTreatment
Ac id g asC leaning
&S ulfur
R ecovery
C O2
C aptureH2
P roduc tion
H2/C O R atioAdjus tment
(S hift)
C hemicalP roduc tion
C oal
R awS yngas
C ondensate
C ooledS yngas
S
S
S M
S S
PowerP roduc tion
C oal
M
TreatedWastewater
S ulfur
C hemical
To C O2 s torage
H2
C leanS yngas
E lectricalE nergy
InjectionS team
MechanicalP ower
Hot E xhaust gas
E xhaust gasAir
As hTreatment
Ash/S lag
TurbineF uel
T reatedAsh
Oxygen
WHB S team
WHB S team
Gas ifier S team
S uperheatedS team
Boiler F uel
P rocessS team
C ondensate
E lectricalE nergy
T reatedTailgas
C OAL GAS IF IC ATION S E C T ION
POWE R GE NE RATION S E C T ION

4
Methodology (Daichendt and Grossmann, 1997)
Step 1 : Input-Outlet Level Develop basic aggregate models for all sections Connect the models to form a simplified superstructure Optimize at I/O level by minimizing only operating costs (material & energy)
Further Steps: Optimizing superstructure at higher complexity levels Use results (initial point, bounds) from previous optimization runs Increase complexity of models for the sections, one at a time Repeat the procedure till superstructure of desired complexity is optimized

5
Aggregate Model for Coal Gasification
Model solved as an inner minimization problem (inside an outer optimization model)
Min
s. t.
Atomic balance for reacting species
Component mole balance for inerts
Non-negativity of molar flows
Evaluation of component Gibbs energy
Add equilibrium reactions
(temperature approach)
Restricted Gibbs Energy Minimization

6
Capability of restricted Gibbs model
Composition (mole %)
Shell entrained gasifier (Ni and Williams, 1995)
GE entrained gasifier (Klara, 2007)
CoP entrained gasifier (Klara, 2007)
Actual Model Actual Model Actual Model
N2 4.5 4.375 1.68 1.689 1.82 1.695
H2 28.5 28.474 33.49 32.844 27.38 27.735
CH4 --- 0.003 0.1 0.097 4.0 3.762
CO 62.5 62.207 34.42 34.779 38.51 38.504
CO2 1.6 1.657 15.11 15.287 14.68 14.63
H2O 1.8 2.013 14.29 14.389 12.51 12.568
H2S --- 0.897 0.72 0.723 0.79 0.784
COS --- 0.303 0.02 0.027 0.05 0.058
NH3 --- 0.001 0.17 0.164 0.26 0.264
Trace 1.1 --- --- --- --- ---
ΔTApproach
Shift -250 -500 -445
Reforming -100 70 375
COS hydrolysis 0 -575 -385
NH3 synthesis 0 -685 -797
7
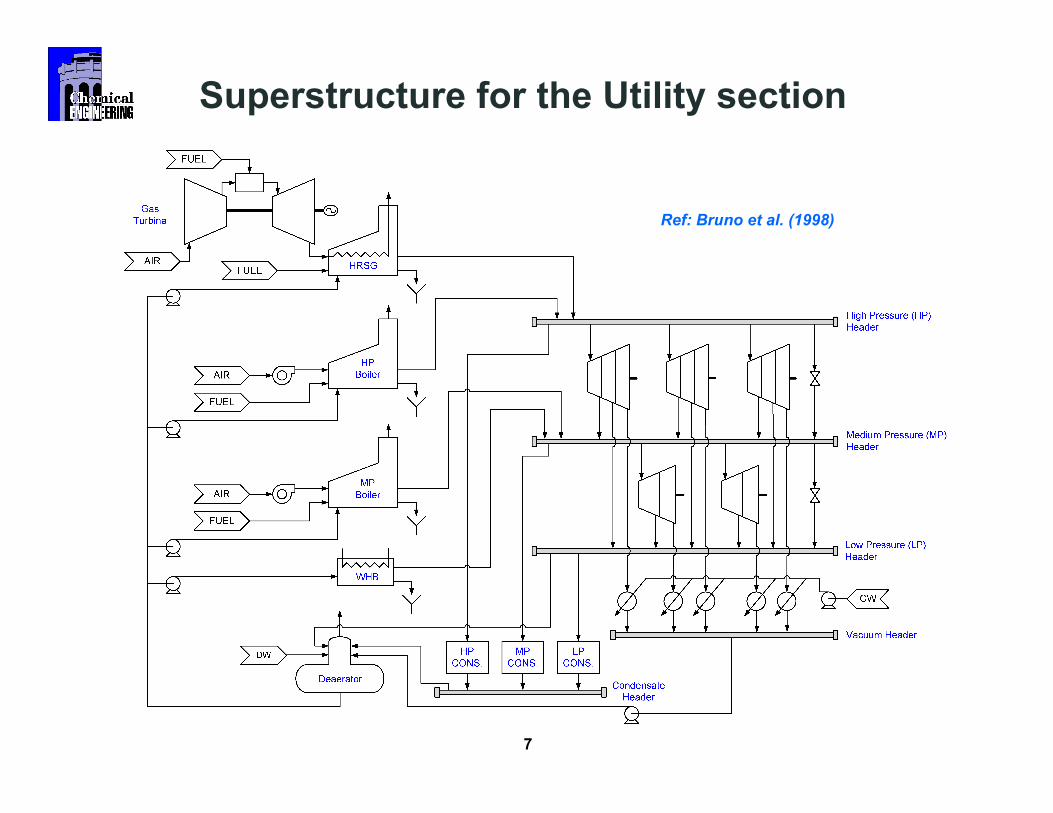
Superstructure for the Utility section
Ref: Bruno et al. (1998)

8
Numerical Example for Utility model
Electricity: 500 MW Mechanical Power No 1: 5 MW Mechanical Power No 2: 15 MW HP Heating: 5 MW MP Heating: 20 MW LP Heating: 50 MW
Demands
Pressure of Steam Headers HP: 45 bar MP: 20 bar LP: 7 bar 62 process streams
3 HP turbines (7 modes) 2 MP turbines (3 modes) 5 Headers (HP, MP, LP, Cond, Vac) 1 Gas turbine (compressor, expander) 3 Boilers (HP, MP, HRSG) 4 Combustors (GT, Boilers) 5 Liquid pumps 2 Air blowers 1 Deaerator
Superstructure
Non-convex MINLP problem Binary variables: 44 Continuous variables: 1275 Constraints: 1309
Modeled and solved using GAMS (Intel Core 2 Duo 2.4 GHz with 2 GB RAM)
Logic constraints 1 turbine Max 1 demand (mechanical or power) Mechanical demand Either electricity or turbine MP turbine can’t contribute power

9
Optimal Solution for Numerical Example
Operating cost = $307.27 Million/yr

10
Superstructure for Air Separation Unit
PPU
Was te Purge
L P GAN
L P GOX
HP GAN
Ambient A ir
A ir integ ration(Gas Turbine) H2O
C O2
Multi‐s treamheat exchanger
HighP res s ureC olumn
Integ ratedcondens erreboiler
L ow P res s ureC olumn
Multi‐s treamheat exchanger

11
Aggregate model for complex columns Cascade model for counter-current stages (Kremser method with Edmister approximation)
Performance
Recovery fractions
Effective Absorption/Stripping factors
Simulation-based (like rigorous models) Columns interconnected cascades and feed/side-draw stages Optional feeds/side-draws (may or may not exist) Cascades bypassed (disappear) if corresponding
feed/side-draw stages do not exist
E ntering liquid (L 0)
E xiting vapor (V1)
E xiting liquid (L N)
E ntering vapor (VN+1)
Poor Approximations removed
Better (realistic) constraints added Vapor outlet at dew point Liquid outlet at bubble point

12
Possible modes for LP column
S 1
S 2S 3
S 4
S 5
S 6
S 7S 8
S 10 S 12
1
1
S 18S 19
S 21S 23
S 26
S 27
S 29
S 30S 31
High Purity O2 produc t
Main F eed(always exis ts )
4
S 1
S 2S 3
S 4
S 5
S 6
S 7S 8
S 9 S 11
S 13 S 14
1
2
1
S 15
S 16S 17
2
S 18S 19
S 21S 23
S 26
S 27
S 29
S 30S 31
High Purity O2 produc t
Main F eed(always exis ts )
4
S 1
S 2S 3
S 4
S 5
S 6
S 7S 8
S 10 S 12
1
1
S 18S 19
S 20S 22
3
S 24S 25
S 26
S 27S 28
S 29
S 30S 31
High Purity O2 produc t
Vapor S ide‐draw(optional)
Main F eed(always exis ts )
4
S 1
S 2S 3
S 4
S 5
S 6
S 7S 8
S 9 S 11
S 13 S 14
1
2
1
S 15
S 16S 17
2
S 18S 19
S 20S 22
3
S 24S 25
S 26
S 27S 28
S 29
S 30S 31
High Purity O2 produc t
Vapor S ide‐draw(optional)
Main F eed(always exis ts )
4
Superstructure (LP column of ASU)
Only main feed exists
2 feeds exist
Main feed & Side-draw exist
Both feeds & Side-draw exist

13
Simulation of LP column
S 1
S 2S 3
S 4
S 5
S 6
S 7S 8
S 9 S 11
S 13 S 14
1
2
1
S 15
S 16S 17
2
S 18S 19
S 20S 22
3
S 24S 25
S 26
S 27S 28
S 29
S 30S 31
High Purity O2 produc t
Vapor S ide‐draw(optional)
Main F eed(always exis ts )
4 Column hardware configuration Stages (including reboiler) : 45 Number of feeds : 3 (Top + Main + 2nd) Stage location of main feed : 32 Stage location of 2nd feed : 21 Stage location of vapor side-draw : 9
Operating conditions Column Pressure : 5 bar Reboil Ratio : 3.5
Feed characteristics
Molar flowrate : 3 kmol/s Mol % N2 : 0.708155 Mol % O2 : 0.279439 Mol % Ar : 0.012407 Temperature : 96.7K
b) Top feed a) Main and 2nd feed Molar flowrate : 1 kmol/s Mol % N2 : 0.996717 Mol % O2 : 0.002687 Mol % Ar : 0.000596 Temperature : 93.8K

14
Simulation Results for LP Column
S 1
S 2S 3
S 4
S 5
S 6
S 7S 8
S 9 S 11
S 13 S 14
1
2
1
S 15
S 16S 17
2
S 18S 19
S 20S 22
3
S 24S 25
S 26
S 27S 28
S 29
S 30S 31
High Purity O2 produc t
Vapor S ide‐draw(optional)
Main F eed(always exis ts )
4 RADFRAC (Aspen Plus)
Aggregate Model (GAMS)
PercentageDeviation
Top Product
Flowrate kmol/s 3.655712 3.655495 -0.005959
N2 fraction 0.955236 0.9552676 0.003294
O2 fraction 0.040921 0.041131 0.510924
Ar fraction 0.003841 0.0036014 -6.260899
Temperature K 95.235956 95.237254 0.001362
Bottom Product
Flowrate kmol/s 1.344287 1.344505 0.016207
N2 fraction 6.82E-05 4.16E-04 509.7528
O2 fraction 0.965723 0.964031 -0.175294
Ar fraction 0.034207 3.56E-02 3.9319807
Temperature K 108.690204 108.677308 -0.011864
Reboiler Duty MW 28.517856 28.516891 -0.003386

15
Model for Multi-stream Heat Exchangers
H1
H2C 1
C 2
Almost no models in literature (Proprietary MHeatX model in Aspen Plus) MHeatX assumes all outlet streams have same Temperature if DOF > 1 Need an equation-oriented model suitable for optimization
Aggregate Model for MHEx Use Pinch technology to formulate an inverse problem
Given a MHEx (adiabatic black box), determine feasible temperatures and heat capacity flowrates for all inlet and outlet streams.
Use Duran & Grossmann (1986) model with no objective function and zero utility loads
Generates feasible points for outer problem in which model is embedded.
No temperature intervals (useful for simultaneous optimization and heat integration)
Can’t estimate capital cost (handy when emphasis is on energy/utility costs)
16
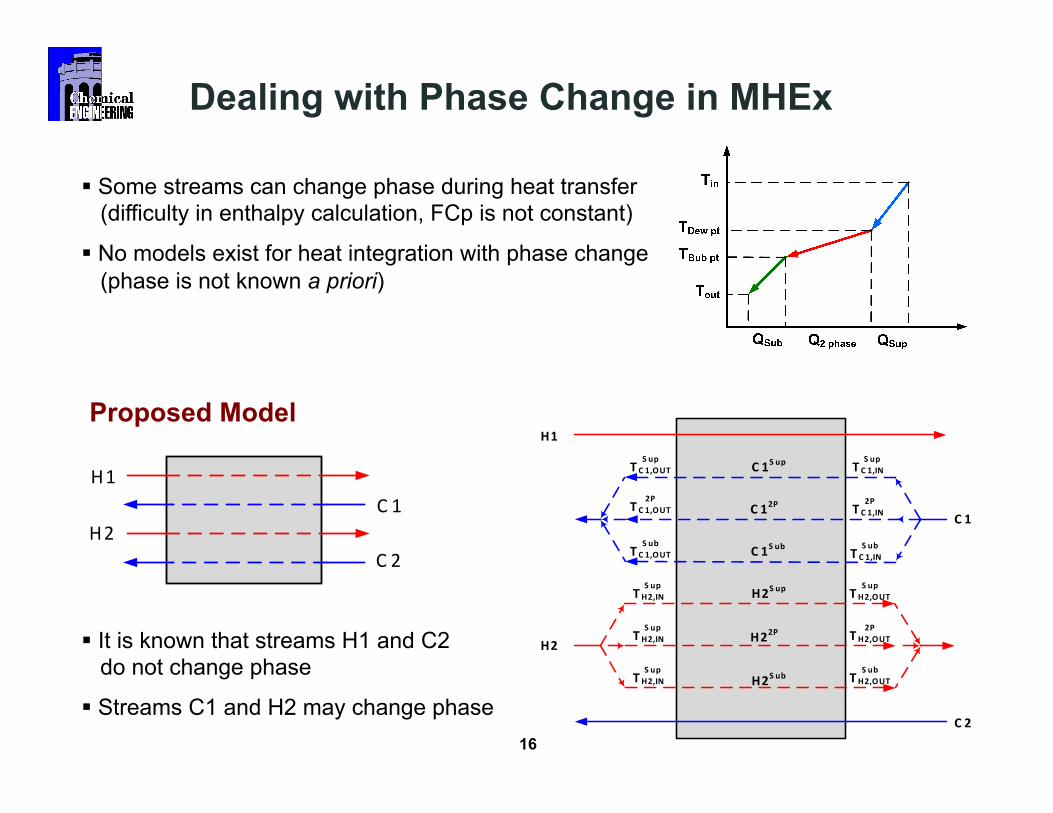
Dealing with Phase Change in MHEx
Some streams can change phase during heat transfer (difficulty in enthalpy calculation, FCp is not constant)
No models exist for heat integration with phase change (phase is not known a priori)
Proposed Model
H1
H2C 1
C 2
It is known that streams H1 and C2 do not change phase
Streams C1 and H2 may change phase
H1
C 1
H2
C 2
H2S up
H22P
H2S ub
C 1S up
C 12P
C 1S ub
T C 1,INS up
T C 1,OUTS up
T C 1,IN2P
T C 1,OUTS ub
T C 1,OUT2P
T C 1,INS ub
TH2,INS up
TH2,INS up
TH2,INS up
TH2,OUTS up
TH2,OUTS ub
TH2,OUT2P

17
Mathematical model for phase detection For both hot and cold streams
a) Region detection for inlet stream
b) Region detection for outlet stream
c) Equations for Flash calculation for 2-phase region
For hot streams
For cold streams

18
1
2
3
4
56
7
8
9
10
11
12
13
14
15
16HPC
SPLT1
MHEx1FLSH2
FLSH1
MXR1
LPC
Sample flowsheet for ASU
Aspen Plus (Rigorous) ~ 960 variables Aggregate Model (GAMS) ~ 280 variables
F = {4.353, 4.355} T = {114.167, 114.145}
F = {7.576, 7.577}
T = {109.201, 109.218}
T = {112.912, 112.916}
F = {1.419, 1.420} T = {124.935, 124.942}
T: Temperature (K) F: Flowrate (kmol/s)

19
Conclusions and Future Work
Conclusions Formulated the proposed superstructure for IGCC as MINLP model Methodology: solve large combinatorial problem with models of
various complexity levels Developed aggregate models for coal gasification, utility section,
complex distillation columns and Multi-stream Heat Exchangers in ASU Preliminary results show systematic topology optimization (Utility model)
accurate predictions (Gibbs model), and good match between aggregate and rigorous models (ASU)
Future Work Develop aggregate models for other sections of the IGCC plant
(e.g. acid gas cleaning, Sulfur recovery, CO2 capture) Optimize the superstructure at input-output level (considering only
operating costs) Based on previous optimization results, develop more rigorous
models and optimize the superstructure at next level of complexity


![DEAERATOR - powerhx.com · DEAERATOR General [ Typical Deaerator Connections and Accessories ] Principle of deaerating Classification by Shape The removal of dissolved gases from](https://img.pdfslide.us/doc/110x75/5e0656589a5fbe7d5a551d58/deaerator-deaerator-general-typical-deaerator-connections-and-accessories-.jpg)