Embed Size (px)
Citation preview

7/27/2019 Optimal Site Area for High-Density Housing
http://slidepdf.com/reader/full/optimal-site-area-for-high-density-housing 1/14
Habitat International 26 (2002) 539–552
Optimal site area for high-density housing development
Wing Suena, Bo-sin Tangb,*aSchool of Economics and Finance, The University of Hong Kong, Pokfulam, Hong Kong
bDepartment of Building & Real Estate, The Hong Kong Polytechnic University, Hung Hom, Kowloon, Hong Kong
Received 30 October 2001; received in revised form 23 January 2002; accepted 27 February 2002
Abstract
This study provides an empirical assessment of the optimal site area for master-planned high-density
housing development in Hong Kong. Conventional hedonic pricing methods are not used because they
cannot separate the amenity value of large sites from the price effects caused by market power. We obtain
our estimate from a unique data set containing the choice of applicants for public housing units in 128
housing estates in Hong Kong between 1990 and 1998. An inverted U-shaped relationship between site area
and popularity of the estate is revealed. We conclude that the land areas of most public housing estates in
Hong Kong are sub-optimal. Our estimated optimal site area serves as a quantitative benchmark for
the government in its future disposal of public as well as private housing land. r 2002 Elsevier Science Ltd.All rights reserved.
Keywords: Housing; Land development; Land policy; Town planning; Hong Kong
1. Introduction
Consider a town planner with a large piece of land to be developed. Should he allocate the
whole block of land to one single developer? Or should he divide the land into smaller plots for
different developers? If the piece of land is to be divided, what is the optimal size of each
development site? Planning practitioners routinely confront questions like these. In this paper, we
attempt to shed some light on these questions using empirical evidence from Hong Kong.
To accommodate some 6.8 million people within a territory of o1100 km2, housing in Hong
Kong primarily takes the form of high-rise building structures. A typical household occupies a
self-contained apartment unit within a building and shares the use of elevators and other common
facilities. The Hong Kong Special Administrative Region government is the monopoly supplier of
*Corresponding author. Tel.: +852-2766-5816; fax: +852-2764-5131.
E-mail address: [email protected] (B.-s. Tang).
0197-3975/02/$ - see front matterr 2002 Elsevier Science Ltd. All rights reserved.
PII: S 0 1 9 7 - 3 9 7 5 ( 0 2 ) 0 0 0 1 8 - 8

7/27/2019 Optimal Site Area for High-Density Housing
http://slidepdf.com/reader/full/optimal-site-area-for-high-density-housing 2/14
land. All private housing land is leasehold and is sold to housing developers by competitive means
through auctions and tenders. After obtaining the land titles, the developers are responsible for
the planning, layout design, and construction of the housing development subject to relevant
government regulations. However, the total area of each housing development site is essentially abureaucratic decision. In the fiscal year 1997–1998, for example, 19 plots of housing sites were
sold through public land sales. The size of these housing sites varies enormously, ranging from 88
to 91,265 m2. Depending on the size of the site, each development may contain one to many multi-
story building blocks.
Town planners are generally in favor of comprehensive planning (Cullingworth & Nadin, 1997;
Fainstein & Campbell, 1996).1 This idea is reflected, for instance, in the concept of ‘‘planned unit
developments’’ (PUDs) in the United States (Tomioka & Tomioka, 1984). Professional planners
consider that comprehensive development by a single agent has the advantages of providing
greater design flexibility, better neighborhood environment, exclusive open space, and community
facilities for the residents. Such planned development basically internalizes the externalities inland use (Fischel, 1994). Prospective homebuyers are attracted not only to these distinctive
physical features, but also to the possible higher value appreciation of these housing units than in
traditional sub-division type of housing development (Arendt, 1996).
Comprehensive development often requires a large land area.2 Pushed to the extreme, the
concept of comprehensive development would suggest that it is always optimal to allocate the
whole piece of land to a single developer. However, just as there are limits to scale economies in
the theory of the firm, there are limits to the gains from comprehensive development. Beyond a
certain site size, diseconomies of scale from large housing development emerge. Such
diseconomies arise principally from coordination and project management problems. The
economies and diseconomies of scale in residential housing development ultimately are reflected in
the overall quality, or ‘‘amenity value,’’ of housing. A better-planned housing developmentproduces a higher amenity value to its residents. If economies of scale dominate when the site area
is small while diseconomies of scale dominate when site area is large, we expect the amenity value
of housing to bear an inverted U-shaped relationship with the size of the development site. The
theory of production identifies the optimal firm size as one that minimizes the average cost of
production. In this paper, we identify the optimal site area as one that maximizes the amenity
value of the housing development.
The amenity value of housing affects the housing prices. In previous studies, lot size is an
attribute in explaining property values. Larger land lots are found to be proportionally more
expensive (Tabuchi, 1996). The value of a land lot is found to depend both on its absolute size and
1An early version of the US Standard State Zoning Enabling Act included the following note: ‘‘A comprehensive
plan: sound planning implies a comprehensive plan. The zoning should be applied to the whole municipality at once.
Piecemeal zoning is dangerous, because it treats the same kind of property differently in the same community.’’ (Bair,
1984, p. 120, footnote 1)2Land area requirements for planned unit developments vary from place to place. A minimum site area is normally
specified under the planning law (Levy, 1997, p. 131). For instance, San Francisco City Zoning Ordinance for planned
unit developments required the land parcel to comprise an area of at least 3 acres (about 12,000 m2.). In Lincoln of US,
the minimum size of the land tract for Open Space Residential Development was 25 acres (about 101,000 m2.) (Tomioka
& Tomioka, 1984, p. 154). In New York, large scale planned unit developments may extend up to 100 acres (about
405,000 m2.) or more (So, 1979, p. 455).
W. Suen, B.-s. Tang / Habitat International 26 (2002) 539–552540

7/27/2019 Optimal Site Area for High-Density Housing
http://slidepdf.com/reader/full/optimal-site-area-for-high-density-housing 3/14
on its size relative to the average lot size in its close neighborhood (Asabere & Colwell, 1985).
Optimal lot size and configuration are clearly important considerations from the property
developer’s perspective in maximizing profits from the development, both in the presence (Colwell
& Scheu, 1989; Colwell & Scheu, 1998) and in the absence of planning constraints (Cannaday &Colwell, 1990; Edelson, 1975).
Past research on site size tends to focus mainly on the impacts of minimum lot size zoning on
property values and on urban sprawl (see Pogodzinski & Sass, 1991 for a summary review).
Different model specifications, assumptions and case study areas have, however, led to mixed
findings. Some indicate that minimum lot size restrictions would lead to rising property prices
and, in some instances, to metropolitan expansion (e.g., Abelson, 1997; Bucovetsky, 1984; Fischel,
1996; Henderson, 1985; Moss, 1977; Pasha, 1995; Pasha, 1996; Pollakowski & Wachter, 1990).
Thorson (1997) also argues that increasing minimum lot size restrictions can decrease new housing
construction in the long run, and thus potentially lead to a higher housing price. In contrast,
others argue that the property value effects are ambiguous (Grieson & White, 1981; White, 1975).Ohls, Weisberg and White (1974) indicate that the effect of minimum lot size on the overall land
value cannot be determined a priori, but they assert that the authorities would, in practice, tend to
increase land supply and thus lower the costs of single-family properties. Jud’s (1980) empirical
findings confirm that minimum lot zoning has a negative impact on residential values.
Most of these studies are, however, not directly applicable to the case of Hong Kong. Urban
housing lot in Hong Kong refers to the whole development site, not a single-family housing plot as
in the North American setting. Our concern is thus about the area of the entire development,
rather than the size of its individual sub-division units. This empirical study seeks to derive the
optimal site area for planned housing development in Hong Kong using the data collected on the
preferences of public housing applicants. Following this introduction, the remainder of the paper
is divided into four sections. Section 2 discusses why the conventional method of examining the lotsize effects on property prices cannot give an answer to our case, and explains our alternative
approach to estimating the optimal size of housing site in Hong Kong. Section 3 gives our
statistical model and Section 4 discusses our empirical findings. Section 5 provides our conclusions
and discusses the policy implications.
2. Methodology
If both economies and diseconomies of scale are present in the development of residential
housing sites, we expect that there is an optimal site size that strikes the right balance between thetwo opposing factors. Housing located in excessively small or overly large sites will be relatively
unattractive to homebuyers. Tiny sites are unattractive because they lack the space to provide the
ancillary facilities, such as car parks, for the residents. Furthermore, in a compact city like Hong
Kong, they result in unsightly, tall pencil-like building blocks in contiguous sites, causing
undesirable overlooking with each other. However, huge housing developments are equally
unattractive due to monotony and lack of exclusivity. A housing development that is designed for
the average taste may end up pleasing no one. Overcrowding of residents in the use of the
communal facilities can reduce the sense of tranquillity and the amenity value of the housing
development (Lai, 1993). How can these different considerations be quantitatively measured?
W. Suen, B.-s. Tang / Habitat International 26 (2002) 539–552 541

7/27/2019 Optimal Site Area for High-Density Housing
http://slidepdf.com/reader/full/optimal-site-area-for-high-density-housing 4/14
The overall quality, or amenity value, of housing is reflected in housing prices. If the total site
area of a housing development affects the amenity value of housing, then property values are
systematically related to site area. A hedonic study of housing prices that includes site area as one
of the attributes will help reveal whether homebuyers prefer to live in large or small housingdevelopments. Such a hedonic analysis of private housing, however, suffers from at least two
problems.
First, the total area of a site may be systematically related to development cost. High prices in a
small housing development, for example, may reflect diseconomies in construction costs rather
than consumers’ preference for small sites. This is the classic identification problem pointed out by
Rosen (1974).
Second, site area may also be systematically related to the degree of competition in a housing
market. Suppose consumers have strong locational preferences, so that the relevant housing
market is confined to a relatively small geographical area. If land is auctioned in large lots, the
effective number of competing property developers within a geographical area will be small. Tothe extent that fewer competitors translate into higher prices, a positive relationship between
housing prices and total site area need not reflect consumers’ preference for large sites. In other
words, site area may affect property prices by its effect on amenity value and by its effect on
market power. These confounding effects are difficult to isolate.
We sidestep these problems by exploiting a unique data set provided by the Hong Kong
Housing Authority (hereafter referred to as Housing Authority) on the applications for publicly
subsidized sale flats in Hong Kong. Established as a statutory organization since 1973, the
Housing Authority is now the largest landlord in Hong Kong. It acts as the government’s agent in
implementing the public housing program and currently provides accommodation for over half of
the local population. It is responsible for planning, developing, allocating and managing public
sector housing, which includes both subsidized rental and sale units. The government providesland and financing to the Housing Authority on concessionary terms to meet the public housing
production targets. With the various forms of government subsidies, the housing rents and prices
of these public housing units are much lower than full market values. Households have to meet
certain demographic characteristics, income limits and resale restrictions before they are eligible
to apply for these public housing units. Table 1 shows some basic facts about public versus private
housing in Hong Kong.
Table 1
Housing characteristics in Hong Kong, 1998
Public permanent housing Private permanent housing All permanent housing
Number of dwellings (Â 103) 948 1056 2004
Population share (%)a 50.3 47.7 98.0
Average household size (persons) 3.5 3.1 —
Home ownership rate (%)b 29 72 52
Data source: Hong Kong Housing Authority, Housing in Figures, 1998 edition.aThese figures exclude population in temporary housing.bThe figures are provisional estimates in the Fiscal Year 1998/1999 of the government.
W. Suen, B.-s. Tang / Habitat International 26 (2002) 539–552542

7/27/2019 Optimal Site Area for High-Density Housing
http://slidepdf.com/reader/full/optimal-site-area-for-high-density-housing 5/14
Our estimate of optimal housing site area is based on the preferences indicated by the applicants
for the publicly subsidized sale units. All these units were sold at a discount from the full market
value. The majority of them came from the Home Ownership Scheme, but a few units belonged to
other subsidized sale housing programs such as the Private Sector Participation Schemeadministered by the Housing Authority. For all these programs, the Housing Authority
periodically conducts an allocation exercise (referred to as a ‘‘phase’’) of its housing stock. Flats
from several different housing estates are made available for application in each phase, and
applicants are requested to indicate their preferred choice of up to four estates. Successful
applicants are drawn by random lottery, and their final selection of flats does not depend on the
preferences stated on their application forms.
We assume that the preferences stated on the application forms are the applicants’ true
preferences. Since these priority orderings have no effect on the actual allocation of flats, there is
no strategic motive for the applicants to misrepresent their preferences in order to improve their
chances of success. Given our assumption, the popularity of an estate (i.e., the number of times anestate is cited as a preferred choice in the application forms) is directly related to factors that
enhance the value of housing. For example, if a larger site area of the estate increases the amenity
value of a housing unit, larger estate will be more popular. The subsequent analysis confirms that
more desirable housing sites (e.g., those in urban areas) tend to be more popular. This increases
our confidence that the stated preferences are not arbitrary, even though they do not directly
affect housing choice.
The pricing of these sale flats is determined in terms of a discount on the market value of
comparable private housing units. At its call for applications, the Housing Authority publicly
announces the rates of housing price discount. Development costs do not figure in this calculation.
Housing costs and hence the degree of public subsidies vary in accordance with the different types
of public housing, rather than the size of the estates (Chiu, 1997; Yu, 1997). Thus, even if there areeconomies or diseconomies in construction costs associated with large sites, they are not reflected
in prices and hence have no effect on the popularity of a public housing estate. The relationship
between site size and popularity primarily reveals the demand factor rather than the supply factor.
Using the popularity of these public sale housing estates instead of private housing prices as the
dependent variable of analysis therefore avoids the identification problem in hedonic pricing
studies.
Furthermore, the purpose of the Housing Authority is not to maximize profits, but to subsidize
homebuyers. Even if larger development sites do reduce the degree of competition, we do not
expect the Housing Authority to wield its market power by raising prices in larger estates. The
confounding effects of amenity value and market power are therefore isolated. If there is arelationship between site size and the popularity of subsidized housing sale estates, such a
relationship reflects the amenity value effect rather than the market power effect.
3. Statistical model
We have been provided with data on the preferences for the subsidized sale housing estates
indicated by the applicants for the period 1990–1998. Similar data for earlier periods are not
available in the Housing Authority. Let Y i be the number of times that estate i is cited as a
W. Suen, B.-s. Tang / Habitat International 26 (2002) 539–552 543

7/27/2019 Optimal Site Area for High-Density Housing
http://slidepdf.com/reader/full/optimal-site-area-for-high-density-housing 6/14
preferred choice by applicants in a certain phase of allocation. Because the total number of public
housing applicants varies greatly across different phases, we normalize this variable by calculating
the popularity share, yi ¼ Y i =P
j Y j ; where the summation is taken over all the housing estates
that are available within the same phase.We model popularity share as a function of the total site area and other variables. The unit of
observation is a public housing estate in a given phase of allocation. In particular, we let
yi ¼ f ðxi Þ þ zi bþ ei :
In this model, zi represents a vector of variables that are expected to affect popularity share, and b
is the corresponding vector of coefficients to be estimated. These variables include the average
price per square meters of floor area (in constant 1998 dollars), the percentage discount from
market value, and the number of flats from the estate available for allocation in a given phase (as
a fraction of the total number of flats available in that phase). To control for differences in
locational preferences, we also include three dummy variables for the location of the estates. Forexample, if a housing estate is located on Hong Kong Island, then the variable ‘‘Hong Kong
Island’’ gets a value of 1 while the other two locational dummy variables (‘‘Kowloon’’ and ‘‘New
Territories with rail’’) get a value of 0. Similarly, to control for any phase-specific or time-specific
factors that may affect popularity share, we introduce a dummy variable for each separate phase
of the allocation exercise.
The main variable of interest is xi ; the total area of the estate. Since a priori reasoning cannot
determine the relationship between site size and popularity share, we let this relationship be
represented by a sufficiently flexible function, represented by f ðxi Þ; and use the data to determine
the best fit. Empirically, this is implemented by estimating a polynomial of degree 5, and
successively removing the higher-order terms that are statistically insignificant. If the resulting
function is increasing in xi ; one would conclude that larger sites increase amenity value. If f ðxi Þ isdecreasing, one would conclude that larger sites reduce amenity value. If the function first
increases and then decreases, the optimal site size is identified by the point at which f ðxi Þ reaches
its peak.
Finally, note that the popularity shares of different housing estates in the same phase may be
correlated with each other. Since the independence assumption fails for the error term ei ; standard
errors from ordinary least-squares regressions are wrong. Based on the procedures developed by
White (1982), our statistical analysis will use robust standard errors that allow for correlation of
error terms within a phase.
4. Empirical data and findings
Table 2 displays the summary statistics of the variables used in the analysis. The data set
contains information on 130 housing estates over 24 phases of housing allocation. The site area
variable refers to the total area of the development site. In some cases, two or more housing
estates may share the same site. Records of these housing estates will be considered as separate
observations.
It is possible to obtain more disaggregated data on the preferences of different categories of
applicants. However, Table 3 shows that their preferences are highly similar, as indicated by a
W. Suen, B.-s. Tang / Habitat International 26 (2002) 539–552544

7/27/2019 Optimal Site Area for High-Density Housing
http://slidepdf.com/reader/full/optimal-site-area-for-high-density-housing 7/14
high degree of cross correlation in the popularity shares of different housing estates for different
groups of applicants. For this reason, our analysis focuses only on the popularity share computed
from all applicants of the Scheme.
Before estimating the statistical model, it is useful to take a look at the main variables of
interest, popularity share and site area. In Fig. 1, we show a scatter plot of these two variables. We
Table 2
Summary statistics of all variables in the model
Variable Mean Std. Dev. Min Max
Popularity share (%) 17.043 9.589 1 55
Site area (Â 103 m2) 20.244 15.975 2.724 87.800
Real price (HK$ Â 103 penm2) 19.261 5.392 9.322 35.393
Discount (%) 41.923 6.379 30 50
Share of flats (%) 17.692 10.631 1.812 56.279
Hong Kong Island 0.177 0.383 0 1
Kowloon 0.262 0.441 0 1
New territories with rail 0.177 0.383 0 1
New territories without rail 0.385 0.488 0 1
Table 3Correlation among the choice of different categories of applicants
Priority 1 Priority 2 Green White Non-white Total
Priority 1 1
Priority 2 0.7852 1
Green form 0.7106 0.8431 1
White form 0.6084 0.7328 0.7981 1
Non-white form 0.6241 0.7124 0.7973 0.9184 1
Total 0.6456 0.7534 0.8411 0.8661 0.8451 1
·
·
·
·
·
· ··
·
·
·
·
· ·
·
·
·
·
·
·
·
·
·
·
·
·
·
·
·
·
·
·
·
·
·
·
·
·
·
·
·
··
·
·
·
·
·
·
·
·
·
·
·
·
·
·
·
·
·
·
·
·
·
·
·
·
·
·
·
·
·
·
·
·
·
·
··
·
·
·
··
·
·
·
·
·
·
·
·
·
·
·
·
·
·
·
·
·
··
·
·
·
·
·
·
·
·
·
·
·
·
·
·
·
·
·
·
site area
p o p u l a r i t y
s h a r e
0 20 40 60 80
0
1 0
2 0
3 0
4 0
5 0
Fig. 1. Relationship between site area (in 103 m2) and popularity of housing estate.
W. Suen, B.-s. Tang / Habitat International 26 (2002) 539–552 545

7/27/2019 Optimal Site Area for High-Density Housing
http://slidepdf.com/reader/full/optimal-site-area-for-high-density-housing 8/14
have also added a smoothing spline to the plot to aid the visualization (Hastie & Tibshirani, 1990).
One can see that popularity share is loosely related to site area. An increase in site area tends to
raise popularity initially and lower it beyond a certain size. The peak of the inverted U-shaped
curve identifies the optimal (i.e., most popular) site area. Visual inspection of Fig. 1 illustrates thatthe peak is reached in the range between 20,000 and 40,000 m2. There are two obvious outliers in
the data set. Tin Shing Court (Phases I and II) has a total site area of about 87,800 m2, which
exceeds the next largest development site by 65 percent. Since these two outliers will have a large
leverage on the parametric estimation of the functional form of f ðxi Þ; they are dropped from most
of the subsequent analysis.
Table 4 shows the estimation results of our statistical model. In column (1), we specify f ðxi Þ as a
polynomial of degree 5. The hypothesis that a5 ¼ a4 ¼ a3 ¼ 0 is not rejected ( p ¼ 0:344), but the
hypothesis that a5 ¼ a4 ¼ a3 ¼ a2 ¼ 0 is rejected ( p ¼ 0:017). We therefore conclude that f ðxi Þ can
be approximated by a quadratic function. In column (2), we reestimate the model by removing
terms higher than the second order. This equation shows that both a1 and a2 are statisticallysignificant. The implied shape of the relationship between site area and popularity share is an
inverted U-shape.
Table 4
Estimation results
(1) (2)
Site (a1) 0.6025 0.6623
0.1790 2.4920
Site2 (a2) 0.0027 À0.0134
0.0080 À2.9080Site3 (a3) À0.0018
À0.1160
Site4 (a4) 6.1900E-05
0.2050
Site5 (a5) À6.5900E-07
À0.2980
Real price 0.3622 0.4580
1.1850 1.6250
Discount 0.7903 0.8942
1.0480 1.2320
Share of flats 0.2510 0.2601
2.7200 2.8600Hong Kong Island 7.7246 7.0794
2.2290 2.2190
Kowloon 12.3044 10.8984
5.3030 5.5740
New territories with rail 7.8840 7.1840
3.5330 3.4450
New territories without rail Omitted Omitted
Phase dummy variables Yes Yes
R2 0.4793 0.4655
N 128 128
W. Suen, B.-s. Tang / Habitat International 26 (2002) 539–552546

7/27/2019 Optimal Site Area for High-Density Housing
http://slidepdf.com/reader/full/optimal-site-area-for-high-density-housing 9/14
If f ðxi Þ ¼ a1xi þ a2x2i and if a2 is negative, this function reaches a peak at the point where
f ’ðxi Þ ¼ a1 þ 2a2xi ¼ 0: Thus, the optimal site size can be estimated by xÃi ¼ 2a1=2a2: This
expression is a non-linear function of the coefficient estimates, and standard errors can be
obtained by the delta method (Greene, 1997). Using the estimates obtained from column (2), theoptimal site size is calculated to be about 24,770 m2, with a 95 percent confidence interval of
20,690, 28,860 m2. Of the 128 housing estates, 25 estates have site areas that fall within the 95
percent confidence interval of the optimal size, 74 estates have site areas that are below the lower
limit, and 29 estates have areas that exceed the upper limit.
The effects of the other variables in the model are not difficult to understand. From Table 4, it
can be seen that more expensive estates are more popular. This is hardly surprising. All these
subsidized sale flats are sold at a substantial discount of their market value. Buying a more
expensive unit therefore implies getting a bigger subsidy in dollar terms. The percentage discount
from market value also has a positive effect on popularity, although the effects of both price and
discount are not statistically significant at conventional levels. Naturally, the applicants are morelikely to indicate a choice for housing estates which have more flats available for allocation. The
coefficient on the ‘‘share of flats’’ variable is positive and highly significant. Similarly, the
coefficients on the dummy variables for ‘‘Hong Kong Island,’’ ‘‘Kowloon,’’ and ‘‘New Territories
with rail’’ are all positive and significant. The first two locations are the central urban areas of Hong
Kong while the third enjoys the convenience of mass public transport. Housing estates in these three
locations are more desirable relative to those in the omitted category (viz., ‘‘New Territories without
rail’’). The fact that these variables have the expected effects on popularity share increases our
confidence that the dependent variable is measuring the housing applicants’ true preferences.
The statistical models in Table 4 are estimated with dummy variables for allocation phase. For
economy of space, the coefficients for these variables are not reported, but they are jointly
significant at the 1 percent level.Table 5 shows a number of variations of the basic model we have estimated to test the
robustness of our results. In column (1), the model is estimated with the outliers (Tin Shing Court
Phases I and II) included in the sample. Compared to column (2) of Table 4, the coefficients on the
site area variables retain the same signs, indicating an inverted U-shaped relationship between site
area and popularity share. Note, however, that the magnitudes of these coefficients change
dramatically, confirming that these two outlier observations have an unduly large effect on the
model estimates (Belsley, Kuh, & Welsch, 1980).
In column (2) of Table 5, we use popularity (Y i ) instead of popularity share ( yi ) as the
dependent variable. Most of the results are qualitatively the same as those reported in column (2)
of Table 4. The implied optimal site size estimated from this model is about 25,800 m
2
, very closeto the estimate of 24,770 m2 obtained earlier.
The relationship between site size and popularity share may be different in urban areas (Hong
Kong Island and Kowloon) than in the non-metropolitan New Territories. To test whether this is
the case, we introduce interaction terms between the size variables and a dummy variable for
urban areas. Column (3) of Table 5 displays the results (the dependent variable is popularity
share). These interaction terms are jointly insignificant with a p-value of 0.236. Using this
interaction model, the implied optimal site area for urban areas is 22,680 m2 and that for the non-
metropolitan districts in the New Territories is 27,470 m2. The difference between these two
estimates, however, is not statistically significant ( p ¼ 0:314).
W. Suen, B.-s. Tang / Habitat International 26 (2002) 539–552 547

7/27/2019 Optimal Site Area for High-Density Housing
http://slidepdf.com/reader/full/optimal-site-area-for-high-density-housing 10/14
If any reduction in the amenity value of housing resulting from sub-optimal site size is
compensated by a reduction in the real price of flats or by an increase in discount, then the
popularity of an estate will not fall even if site size is sub-optimal. For our methodology to work,
quality differences resulting from variations in site size must not be incorporated into the Housing
Authority’s pricing policies. We have checked that this is indeed the case. When we estimate aregression using the real price as the dependent variable, the coefficients on size and its square are
jointly insignificant, with a p-value of 0.877 (the other independent variables in this regression are
dummy variables for location and for allocation phase). A similar regression using percentage
discount from market value as the dependent variable indicates that site size is unrelated to
discount ( p ¼ 0:225). We also reestimate our basic model by excluding price and discount from
the set of independent variables. The resulting model coefficients shown in column (4) of Table 5
are quite similar to the original model coefficients shown in column (2) of Table 4. The optimal
site size implied by column (4) is about 25,710 m2, again very close to the original estimate of
24,770 m2.
Table 5
Estimation results (with different model specifications)
(1) (2) (3) (4)
Site (a1) 0.123 371.509 5583781 0.705
0.908 1.826 1.706 2.616
Site2 (a2) À0.002 À7.199 À0.010 À0.014
À1.029 À2.082 À1.867 À2.903
Urban*site 0.186
0.296
Urban*( site2) À0.006
À0.572
Real price 0.399 385.080 0.414
1.523 2.373 1.381
Discount 0.746 940.709 0.813
1.024 2.151 1.047
Share of flats 0.285 0.258 0.239
3.158 2.778 2.917
Number of flats 2.595
2.789
Hong Kong Island 7.212 3640.846 7.257 9.841
2.303 1.580 1.060 2.593
Kowloon 11.025 5835.521 11.370 13.387
4.546 4.193 1.941 5.053
New territories with rail 7.973 5075.404 7.841 7.644
3.459 2.738 3.577 3.334
New territories without rail Omitted Omitted Omitted Omitted
Phase dummy variables Yes Yes Yes Yes
R2 0.4167 0.6107 0.4734 0.4441N 130 128 128 128
W. Suen, B.-s. Tang / Habitat International 26 (2002) 539–552548

7/27/2019 Optimal Site Area for High-Density Housing
http://slidepdf.com/reader/full/optimal-site-area-for-high-density-housing 11/14
5. Conclusions and policy implications
This paper provides an empirical assessment of the optimal site area of planned high-density
housing development in Hong Kong. We argue that both tiny and excessively large housingestates are undesirable from the perspective of the households. In the private housing market,
market concentration produced by large development sites may cause housing units within larger
housing estates to command higher prices, although this does not necessarily imply greater
amenity value for such units. Conventional hedonic pricing technique cannot identify the optimal
site area, because it cannot distinguish whether its effect on housing price is caused by amenity
value or by market power. In this paper, we propose to get around this problem by using a data
set containing the choice of applicants for publicly subsidized sale housing units in Hong Kong.
After controlling other variables, our estimation does show an inverted U-shaped relationship
between site area and popularity of the housing estates among applicants. We conclude that the
optimal housing site area is about 24,770 m
2
, with a 95 percent confidence interval between 20,690and 28,860 m2. Only about 20 percent of the surveyed estates fall within this interval. We have
tried out different specifications and variations of our model but the estimation results have not
substantially departed from our initial estimates.
Identification of optimal site area of public housing estates has obvious relevance for the
planning of public housing developments. Although the size of a development site is often
constrained by topographical factors, planners do have a choice in determining the scale of the
housing development. Planners are generally in favor of comprehensively planned development
(Knox, 1991). However, our study shows that comprehensive development does not always
produce housing that people prefer: larger is not necessarily better. More importantly, this study
yields a quantitative estimate of an optimal site area of 25,000 m2 that may serve as a useful
benchmark for planning considerations.In terms of urban design, a typical 25,000 m2 public housing site in Hong Kong3 normally
comprises 6–7 domestic blocks each of around 35 storys, providing about 2500 flats in total and
other ancillary facilities such as kindergartens, parking spaces, neighborhood shops and
management offices. Design population level within the estate can reach up to 7500 persons,
giving a site density of about 300 persons per 1000 m2. All these planning criteria can be adjusted
depending upon the actual site conditions. For instance, fewer but taller housing blocks can be
built to reduce the coverage of ground level space. Larger dwelling units and more communal
space can also be provided to accommodate fewer families, reduce congestion and improve
quality of the living environment (Chan, Tang, & Wong, 2002).
Our findings also have relevance for the planning and development of private housing land.Two caveats have to be borne in mind, however. First, this study is based on the preferences of
public housing applicants, who may not be as well off as private housing homebuyers. To the
extent that tastes for large versus small housing estates differ systematically by income, the
optimal site size for private housing development may be different from the estimate obtained in
this study. For example, private housing estates often include better ancillary facilities than do
public housing. In this case, the optimal private lot size may be larger than our estimate. Second,
3This refers to the site for publicly subsidized sale housing such as Home Ownership Scheme and Private Sector
Participation Scheme in Hong Kong.
W. Suen, B.-s. Tang / Habitat International 26 (2002) 539–552 549
7/27/2019 Optimal Site Area for High-Density Housing
http://slidepdf.com/reader/full/optimal-site-area-for-high-density-housing 12/14
in the private housing market, the size of the development site may affect the degree of
competition in the localized property market, as well as the amenity value of the housing estate.
To the extent that larger sites reduces market competition by reducing the number of competing
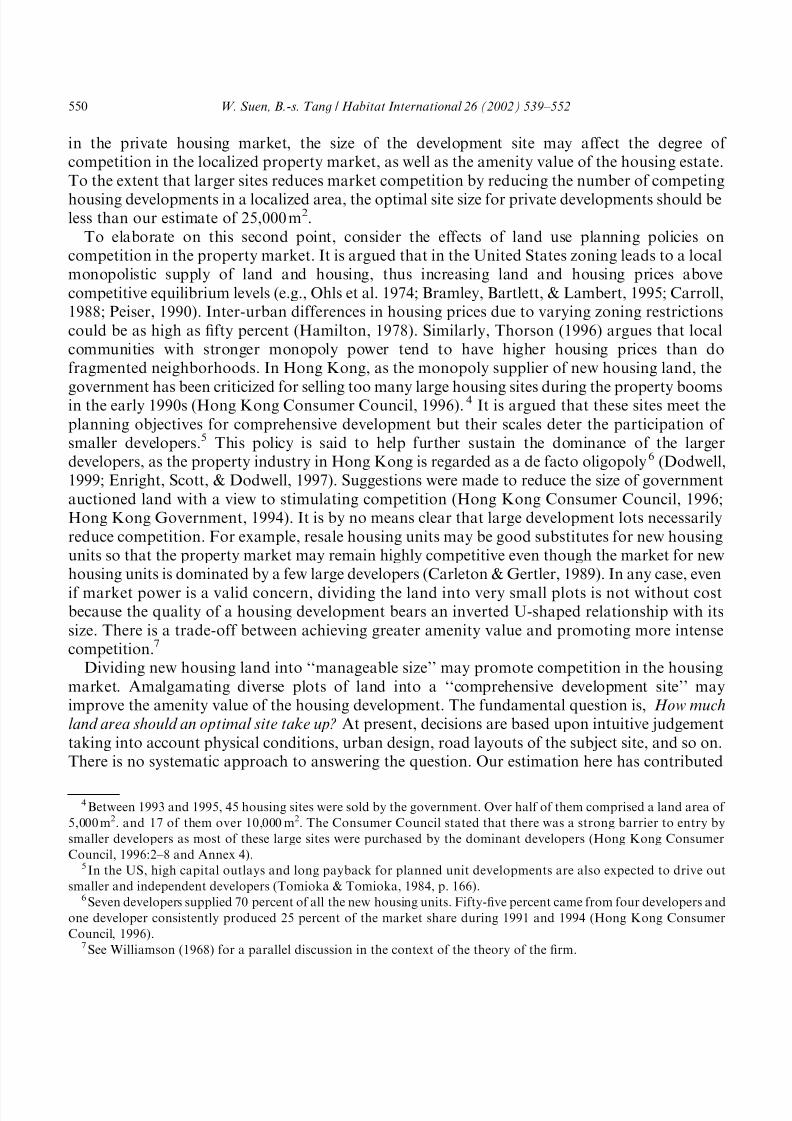
housing developments in a localized area, the optimal site size for private developments should beless than our estimate of 25,000 m2.
To elaborate on this second point, consider the effects of land use planning policies on
competition in the property market. It is argued that in the United States zoning leads to a local
monopolistic supply of land and housing, thus increasing land and housing prices above
competitive equilibrium levels (e.g., Ohls et al. 1974; Bramley, Bartlett, & Lambert, 1995; Carroll,
1988; Peiser, 1990). Inter-urban differences in housing prices due to varying zoning restrictions
could be as high as fifty percent (Hamilton, 1978). Similarly, Thorson (1996) argues that local
communities with stronger monopoly power tend to have higher housing prices than do
fragmented neighborhoods. In Hong Kong, as the monopoly supplier of new housing land, the
government has been criticized for selling too many large housing sites during the property boomsin the early 1990s (Hong Kong Consumer Council, 1996).4 It is argued that these sites meet the
planning objectives for comprehensive development but their scales deter the participation of
smaller developers.5 This policy is said to help further sustain the dominance of the larger
developers, as the property industry in Hong Kong is regarded as a de facto oligopoly6 (Dodwell,
1999; Enright, Scott, & Dodwell, 1997). Suggestions were made to reduce the size of government
auctioned land with a view to stimulating competition (Hong Kong Consumer Council, 1996;
Hong Kong Government, 1994). It is by no means clear that large development lots necessarily
reduce competition. For example, resale housing units may be good substitutes for new housing
units so that the property market may remain highly competitive even though the market for new
housing units is dominated by a few large developers (Carleton & Gertler, 1989). In any case, even
if market power is a valid concern, dividing the land into very small plots is not without costbecause the quality of a housing development bears an inverted U-shaped relationship with its
size. There is a trade-off between achieving greater amenity value and promoting more intense
competition.7
Dividing new housing land into ‘‘manageable size’’ may promote competition in the housing
market. Amalgamating diverse plots of land into a ‘‘comprehensive development site’’ may
improve the amenity value of the housing development. The fundamental question is, How much
land area should an optimal site take up? At present, decisions are based upon intuitive judgement
taking into account physical conditions, urban design, road layouts of the subject site, and so on.
There is no systematic approach to answering the question. Our estimation here has contributed
4Between 1993 and 1995, 45 housing sites were sold by the government. Over half of them comprised a land area of
5,000 m2. and 17 of them over 10,000 m2. The Consumer Council stated that there was a strong barrier to entry by
smaller developers as most of these large sites were purchased by the dominant developers (Hong Kong Consumer
Council, 1996:2–8 and Annex 4).5 In the US, high capital outlays and long payback for planned unit developments are also expected to drive out
smaller and independent developers (Tomioka & Tomioka, 1984, p. 166).6Seven developers supplied 70 percent of all the new housing units. Fifty-five percent came from four developers and
one developer consistently produced 25 percent of the market share during 1991 and 1994 (Hong Kong Consumer
Council, 1996).7See Williamson (1968) for a parallel discussion in the context of the theory of the firm.
W. Suen, B.-s. Tang / Habitat International 26 (2002) 539–552550

7/27/2019 Optimal Site Area for High-Density Housing
http://slidepdf.com/reader/full/optimal-site-area-for-high-density-housing 13/14
to offer a tentative answer in informing professional practices. Obviously, some adjustments have
to be made when we apply the answer to private housing land development. Nonetheless, as our
estimated optimal site area gives the highest amenity value of housing, we believe it serves as a
reasonable first benchmark for the government to consider in its future disposal of urban housingland.
Acknowledgements
The authors thank the Hong Kong Housing Authority and Housing Department for providing
the data used in this study, and the reviewers for their comments on this paper.
References
Abelson, P. (1997). House and land prices in Sydney from 1931 to 1989. Urban Studies, 34(9), 1381–1400.
Arendt, R. (1996). Conservation design for subdivisions: A practical guide to creating open space networks. Washington,
DC: Island Press.
Asabere, P. K., & Colwell, P. F. (1985). The relative lot size hypothesis: An empirical note. Urban Studies, 22(4),
355–357.
Bair, F. H. (1984). The zoning board manual . Chicago: Planners Press.
Belsley, D. A., Kuh, E., & Welsch, R. E. (1980). Regression diagnostics. New York: Wiley.
Bramley, G., Bartlett, W., & Lambert, C. (1995). Planning, the market and private housebuilding. London: UCL Press.
Bucovetsky, S. (1984). On the effects of minimum-lot-size zoning. Economics Letters, 15, 189–193.
Cannaday, R. E., & Colwell, P. F. (1990). Optimization of subdivision development. Journal of Real Estate Finance and
Economics, 3(2), 195–206.Carroll, B. W. (1988). Market concentration in a geographically segmented market: Housebuilding in Ontario 1978–
1984. Canadian Public PolicyAnalyse De Politiques, 1988(3), 295–306.
Carleton, D. W., Gertler, R. (1989) Market power and mergers in durable-good industries. Journal of Law and
Economics, Part 2, 32(2), S203–S226.
Chan, E. H.-W., Tang, B.-S., & Wong, W.-S. (2002). Density control and quality of living space. Habitat International ,
26 , 159–175.
Chiu, R. L. H. (1997). The promotion of home ownership in Hong Kong: Planning and policy issues. Asian Journal of
Business and Information System, 2(1), 89–110.
Colwell, P. F., & Scheu, T. (1989). Optimal lot size and configuration. Journal of Urban Economics, 26 (1), 90–109.
Colwell, P. F., & Scheu, T. F. (1998). Public land use constraints: Lot and house configuration. Journal of Real Estate
Research, 16 (2), 201–217.
Cullingworth, J. B., & Nadin, V. (1997). Town and country planning in the UK ((12th ed.)). London, New York:
Routledge.
Dodwell, D. (1999). Competition policy and competitiveness. Hong Kong: The Servicing Economy, 7 , 1.
Edelson, N. M. (1975). The developer’s problem, or how to divide a piece of land most profitably. Journal of Urban
Economics, 2(4), 349–365.
Enright, M. J., Scott, E. E., & Dodwell, D. (1997). The Hong Kong advantage. Oxford, New York: Oxford University
Press.
Fainstein, S. S., & Campbell, S. (Eds.), (1996). Readings in planning theory. Cambridge, MA, Oxford: Blackwell
Publishers.
Fischel, W. (1994). Zoning, nonconvexities, and T. Jack Foster’s city. Journal of Urban Economics, 35, 175–181.
Fischel, W. A. (1996). Limit the size of residential lots. The American Enterprise, 7 , 70.
Greene, W. (1997). Econometric analysis ((3rd ed.)). Upper Saddle River, NJ: Prentice Hall.
W. Suen, B.-s. Tang / Habitat International 26 (2002) 539–552 551
7/27/2019 Optimal Site Area for High-Density Housing
http://slidepdf.com/reader/full/optimal-site-area-for-high-density-housing 14/14
Grieson, R. E., & White, J. R. (1981). The effects of zoning on structure and land markets. Journal of Urban Economics,
10(3), 271–285.
Hamilton, B. W. (1978). Zoning and the exercise of monopoly power. Journal of Urban Economics, 5, 116–130.
Hastie, T. J., & Tibshirani, R. J. (1990). Generalized additive models. London: Chapman & Hall.Henderson, J. V. (1985). The impact of zoning policies which regulate housing quality. Journal of Urban Economics,
18(3), 302–312.
Hong Kong Consumer Council (1996). How competitive is the private residential property market? Consumer Council,
Hong Kong.
Hong Kong Government (1994). Review panel on land auction arrangement: Final report. Hong Kong: Hong Kong
Government Printer.
Jud, G. D. (1980). The effects of zoning on single-family residential property values: Charlotte, North Carolina. Land
Economics, 56 (2), 142–154.
Knox, P. L. (1991). The restless urban landscape: Economic and sociocultural change and the transformation of
metropolitan Washington, DC. Annals of the Association of American Geographers, 81(2), 181–209.
Lai, L. W.-C. (1993). Hong Kong’s density policy towards public housing: A theoretical and empirical review. Third
World Planning Review, 15(1), 63–85.
Levy, J. M. (1997). Contemporary urban planning ((4th ed.)). Upper Saddle River, NJ: Prentice-Hall.
Moss, W. G. (1977). Large lot zoning, property taxes, and metropolitan area. Journal of Urban Economics, 4(4),
408–427.
Ohls, J. C., Weisberg, R. C., & White, M. J. (1974). The effect of zoning on land value. Journal of Urban Economics,
1(4), 428–444.
Pasha, H. A. (1995). Comparative statics analysis of urban land values in the presence of government regulation. Urban
Studies, 32(9), 1505–1515.
Pasha, H. A. (1996). Suburban minimum lot zoning and spatial equilibrium. Journal of Urban Economics, 40(1), 1–12.
Peiser, R. (1990). Who plans America? planners or developers? Journal of American Planning Association, 56 (4),
496–503.
Pogodzinski, J. M., & Sass, T. R. (1991). Measuring the effects of municipal zoning regulations: A survey. Urban
Studies, 28(4), 597–621.
Pollakowski, H. O., & Wachter, S. M. (1990). The effects of land-use constraints on house prices. Land Economics,66 (3), 315–324.
Rosen, S. (1974). Hedonic prices and implicit markets: Product differentiation in pure competition. Journal of Political
Economy, 82, 34–55.
So, F. S. (1979). The practice of local government planning. Washington: American Planning Association and
International City Management Association.
Tabuchi, T. (1996). Quantity premia in real property markets. Land Economics, 72(2), 206–217.
Thorson, J. A. (1996). An examination of the monopoly zoning hypothesis. Land Economics, 72(1), 43–55.
Thorson, J. A. (1997). The effect of zoning on housing construction. Journal of Housing Economics, 6 (1), 81–91.
Tomioka, S., & Tomioka, E. M. (1984). Planned unit developments: Design and regional impact. New York: Wiley.
White, M. J. (1975). The effect of zoning on the size of metropolitan areas. Journal of Urban Economics, 2(4), 279–290.
White, H. (1982). Maximum likelihood estimation of misspecified models. Econometrica, 50, 1–25.
Williamson, O. E. (1968). Economies as an antitrust defense: The welfare tradeoffs. American Economic Review, 58(1),
18–36.
Yu, S. W.-K. (1997). The Hong Kong Government’s strategy for promoting home ownership—an approach to
reducing the decommodifying effects of public housing services. International Journal of Urban and Regional
Research, 21(4), 537–553.
W. Suen, B.-s. Tang / Habitat International 26 (2002) 539–552552