Embed Size (px)
Citation preview

2582IEICE TRANS. COMMUN., VOL.E94–B, NO.9 SEPTEMBER 2011
PAPER
Optimal Placement of Transparent Relay Stations in 802.16j MobileMultihop Relay Networks
Yongchul KIM†a), Member and Mihail L. SICHITIU†, Nonmember
SUMMARY WiMAX (IEEE 802.16) has emerged as a promising ra-dio access technology for providing high speed broadband connectivity tosubscribers over large geographic regions. New enhancements allow de-ployments of relay stations (RSs) that can extend the coverage of the basestation (BS), increase cell capacity, or both. In this paper, we consider theplacement of transparent RSs that maximize the cell capacity. We providea closed-form approximation for the optimal location of RS inside a cell.A numerical analysis of a number of case studies validates the closed-formapproximation. The numerical results show that the closed-form approxi-mation is reasonably accurate.key words: WiMAX, relay networks, optimal placement
1. Introduction
IEEE standard 802.16, often referred to as WiMAX, is con-sidered a “last mile” broadband wireless access alternativeto conventional DSL and Cable Internet. The initial stan-dard is focused on providing a point to multi-point (PMP)single hop service from a single base station (BS) to multi-ple stationary users with subscriber stations (SSs). However,several extensions have been standardized including a meshmode, several physical layers, as well as extensions for mo-bility. One such extension that is recently receiving a greatdeal of attention is the IEEE 802.16j Mobile Multi-hop Re-lay (MMR) amendment. The focus of this amendment is thedevelopment of simple and lower cost relay stations (RSs)that can enhance network coverage and capacity [1].
According to the published amendment [2], RSs areclassified into two categories, non-transparent mode andtransparent mode. A non-transparent RS operates as aBS for connected SSs, i.e., the RS transmits managementmessages and forwards data traffic, while a transparentRS forwards only data traffic to and from SSs based onthe frequency allocation information obtained from BS.Thus, transparent relays have to use a centralized schedul-ing mode. Additionally, the major difference between thetwo modes is that the frequency reuse is not allowed in thetransparent mode. Therefore, transparent RSs are suitablefor throughput improvement while non-transparent RSs areappropriate for coverage extension. We consider the place-ment of transparent RSs that maximize cell capacity.
There has been much research directed toward improv-
Manuscript received September 1, 2010.Manuscript revised April 15, 2011.†The authors are with the Department of Electrical and Com-
puter Engineering, North Carolina State University, Raleigh, NC27695, USA.
a) E-mail: [email protected]: 10.1587/transcom.E94.B.2582
ing the capacity of wireless networks on the physical layer.However, the achievable bit rate is still limited by the re-ceived signal strength due to the fact that wireless signalattenuates severely as it propagates between transmitter andreceiver. Also, in practice, there are certain intrinsic prob-lems such as coverage holes that exist due to shadowing andthe absence of line-of-sight connections, and non uniformlydistributed traffic in densely populated areas. To alleviatethese problems, deployment of relay stations are planned toenhance the achievable bit rate between a transmitter and areceiver leading to capacity enhancement [3].
A network operator always desires the most cost effec-tive solution with minimal deployment expenditure for theprovision of satisfactory service. Therefore, in order to pro-vide efficient multi-hop relay networks, we need to know theoptimal location of relay stations for maximizing networkcapacity. In this paper, we formulate optimal placements oftransparent RSs that maximize the cell capacity and we alsopropose a closed-form approximation of optimal location ofan RS in a cell. The validation section in this paper willshow how accurate the approximated results are in compar-ison to the numerical results. By using this closed-form ap-proximation, a network operator can easily determine whereto place the RSs that maximize cell capacity with predeter-mined network parameters in the most practical scenarios.
The WiMAX system studied here uses an air inter-face based on orthogonal frequency division multiplexing(OFDM) and adaptive modulation to enhance performancewhen the link quality varies. The WiMAX standard supportsboth Time Division Duplexing (TDD) and Frequency Divi-sion Duplexing (FDD) modes, however the TDD system isof interest as it allows a flexible asymmetric Downlink (DL)to Uplink (UL) assignment ratio that is suitable for futuregeneration wireless systems supporting multimedia servicesand high speed data transfers.
The balance of this paper is organized as follows. Inthe next section, we review related work in mobile multihoprelay networks. In Sect. 3, we present the system model in-cluding terrain model, SINR analysis, fading channel, andrelay strategy. In Sect. 4, we derive expressions for the op-timal placement of a relay station that maximizes the meancell capacity and the closed-form approximation solution.Numerical analysis of case studies validates the closed-formapproximation in Sect. 5. Section 6 concludes the paper.
Copyright c© 2011 The Institute of Electronics, Information and Communication Engineers

KIM and SICHITIU: OPTIMAL PLACEMENT OF TRANSPARENT RELAY STATIONS IN 802.16J MOBILE MULTIHOP RELAY NETWORKS2583
2. Related Work
The concept of using relays for communications has beenan active research topic for more than three decades. In [4],three terminals are considered when information is transmit-ted over a communication channel, and an achievable lowerbound to the capacity of the general relay channel is estab-lished in [5]; however, the underlying assumptions in [4],[5] are not realistic for the wireless medium. The wirelessrelay channel capacity was recently derived in [6]. Wire-less relay channels have been considered for many applica-tions, such as cellular networks, wireless sensor networks(WSNs), wireless local area networks (WLANs), and wire-less relay/mesh networks (WMNs).
A multihop cellular network (MCN) architecture wasintroduced and compared with single hop cellular network(SCN) in [7]; similar to ad-hoc networks, a key feature ofMCN is that mobile stations can directly communicate witheach other if they are mutually reachable. The results of thiswork showed that MCNs can reduce the required numberof base stations or improve the throughput performance byenabling a mobile station to relay data to the base station.
In [8], the problem of the optimal WSN deployment isexplored with the objective of minimizing the network costwith a lifetime constraint. Additionally, the optimal numberand placement of sensors that maximize the network life-time are discussed in [9]; minimizing the energy consump-tion is also studied in [10].
In WLANs, extensions to the IEEE 802.11 standardwere investigated to include extension points (EP) in orderto improve network throughput. The study in [11] examinedthe optimal placement of EPs such that the throughput ca-pacity of a rectilineal WLAN is maximized using a divideand conquer searching algorithm. For mesh networks, workin [12] focuses on minimizing the number of access pointsin a mesh network, while maintaining QoS constraints forall nodes.
Although related concepts have been extensively stud-ied for various applications, there has not been much workfor MMR networks. In [13], the RS deployment and relaytime allocation are formulated into an optimization problemby incorporating advanced cooperative relaying technologysuch as decode-and-forward or compress-and-forward. Thework in [14] introduced Dual-Relay MMR networks, whereall the SSs are connected to the BS via two active RSsthrough decoded-and-forwarding scheme, and demonstratedthat a Dual-Relay architecture can significantly increase net-work throughput. Considering the fact that WiMAX is de-ployed as a cellular network, [15] discussed an analyticalapproach for dimensioning cellular multihop WiMAX net-works that are based on OFDM technology. More specif-ically, achievable UL and DL carrier to interference andnoise ratios are examined.
In previous work, finding optimal locations of relay sta-tions with various constraints was the main objective, how-ever, none of those works provide a closed-form solution for
the optimal placement of the RSs. In this paper, we proposea closed-form approximation and validate its performanceby comparing it with numerical results. In addition, our sys-tem model is very detailed taking into account the most rel-evant characteristics of IEEE 802.16 systems.
3. System Model
3.1 Cellular Scenario
The considered network consists of several cells each servedby a fixed central BS. A cell is divided into one to six sec-tors. The network is clustered in groups of four to twelvefrequency channels. Each cell has a three-tiered MMR net-work architecture comprising a base station (BS), relay sta-tions (RSs), and subscriber stations (SSs). The BS is respon-sible for providing the air interface to the SSs and is the onlynetwork entity that is connected to the backhaul network.The RSs are expected to be simple and their scheduling andresource allocation are controlled by the BS. The main re-sponsibility of an RS is to relay data between the BS andthe SSs. Although the standard allows for RS to RS connec-tions, in this paper we assume that the SSs are at most twohops from the BS, i.e., the SSs can connect to the BS eitherdirectly or through one RS. The one-hop links between BSand RS are referred to as relay links, between RS and SS asaccess links, and between BS and SS as direct links. In addi-tion, we assume that all nodes have a single antenna and op-erate in half-duplex mode and only one node can be activeat a time, hence, the entire channel bandwidth is used by onenode at any given time. The DL and UL channels are sep-arated by TDD. We also assume that all channels have flatfading over one frame interval such that the channel gainsremain fixed over a frame interval but change independentlyfrom one frame interval to the next. The parameters used forthe analysis are listed in Table 1.
3.2 SINR Analysis
WiMAX supports a variety of modulation and codingschemes (MCS) according to channel variation. When thechannel is good, a 64 QAM modulation and a 5/6 convo-lutional coding scheme can be applied to achieve a highdata rate. For IEEE 802.16, there are 7 different physicallayer data rates specified by the standard [16], denoted asC1,C2, ...,C7. Each data rate can be realized only if the sig-nal to interference and noise ratio (SINR) is above a certainthreshold γ = {0, γ1, γ2, ..., γ7,∞}. That is, when the re-ceived SINR is in the range between γm and γm+1, data rateCm is achievable. The set of thresholds can be determinedby a bit error rate expression for M-QAM [17]. This ap-proximation provides a closed-form expression for the linkspectral efficiency of M-QAM as a function of the SINR andbit error rate:
S m = log2
(1 +
1.5γ− ln 5Pb
), (1)

2584IEICE TRANS. COMMUN., VOL.E94–B, NO.9 SEPTEMBER 2011
Table 1 Simulation parameters.
System ParametersOperating Frequency 3.5 GHzDuplex TDDChannel Bandwidth 10 MHzBS/RS Height 50 mSS Height 1.5 mBS/RS Antenna Gain 17 dBiSS Antenna Gain 0 dBiBS/RS Power 20 WSS Power 200 mWBS/RS Noise Figure 3 dBSS Noise Figure 7 dB
OFDMA ParametersFFT Size 1024Sub-carrier Frequency Spacing 10.94 kHzUseful Symbol Time 91.4 μsGuard Time 11.4 μsOFDM Symbol Duration 102.9 μsData Sub-carriers(DL/UL) 720/560Pilot Sub-carriers(DL/UL) 120/280Null Sub-carriers(DL/UL) 184/184Sub-channels(DL/UL) 30/35
where S m is the spectral efficiency, γ is SINR, and Pb isbit error rate. Table 2 shows the values of the threshold setγ when Pb is 10−6. Accordingly, when the total channelbandwidth is used for one node, the downlink achievabledata rate can be computed as:
Cm =34
720102.9 μs
S m, (2)
where 720 is the number of data sub-carriers, 102.9μs issymbol period, and 3/4 is the downlink bandwidth share oftotal bandwidth. For a given transmission power Pt, the av-erage received signal power Pr is given by:
Pr =GtGrPt
L, (3)
where Gt, Gr, and L represent the transmitting antenna gain,receiving antenna gain, and the path loss of the channel. Forthe path loss model, since we did not consider the mobilityof the SSs in this analysis, we used the Erceg-Greensteinmodel [18], which is also the model recommended by theIEEE 802.16 working group for fixed wireless applicationsystem. This model was initially designed to be used in thefrequency ranges close to 1.9 GHz, however, it has been ex-panded with a correction factor to cover higher frequencyranges from 1.9 GHz to 3.5 GHz. The basic path loss equa-tion with the correction factor is presented in [18]:
L = 20 log10
(4πd0
λ
)− 10.8 log10
(h2
)
+10α log10
(dd0
)+ s + 6 log10
(f
2000
), (4)
where d0=100 m, α is the path loss exponent dependent onterrain type [18], d is the distance between the transmit-ter and receiver, h is the receiver antenna height, f and λare the frequency and wavelength of the carrier signal, and
Table 2 SINR threshold set.
MCSDownlinkData RateCm [Mbps]
SpectralEfficiency
S m[bps/Hz]
Thresholdγm [dB]
QPSK 1/2 5.25 1.0 9.1QPSK 3/4 7.87 1.5 11.73
16 QAM 1/2 10.49 2.0 13.8716 QAM 3/4 15.74 3.0 17.5564 QAM 2/3 20.99 4.0 20.8664 QAM 3/4 23.61 4.5 22.4564 QAM 5/6 26.23 5.0 24.02
s is a zero mean shadow fading component. The Erceg-Greenstein model has three variants, depending upon terraintype, namely A, B, and C. Type A has the highest path lossand is applicable to hilly terrains with moderate to heavytree densities. Type C has the lowest path loss and appliesto flat terrains with light tree densities. Type B is suitablefor intermediate terrains. Using the propagation model, thepower of the co-channel interference can also be calculatedgiven the cluster size. Due to the assumption of a TDD syn-chronized network system, only co-channel SSs interfere inUL, while neighboring BSs only generate interference inDL. In the following analysis, the received SINR is deter-mined by:
SINR =Pr
PN + βPI, (5)
where β is the number of co-channel cells of the first tier, PN
is the noise power, Pr is the received signal power and PI isthe interference signal power from a neighboring cell on thesame frequency as the current cell.
3.3 Fading Channel
In addition to the propagation model, multipath fading mayhave a significant effect on reliable communications. Withthe assumption of a Rayleigh fading channel, the receivedSINR, γ, is an exponential random variable [19] with thefollowing probability density function (pdf):
p(γ) =1γ∗
exp
(− γγ∗
), γ ≥ 0, (6)
where γ∗ is the average SINR. Therefore, the probabilitythat a transmitter can achieve data rate Cm can be expressedas:
p(Cm) =∫ γm+1
γm
1γ∗
exp
(− γγ∗
)dγ. (7)
Consequently, the average achievable data rate, Css, can becomputed by:
Css =
7∑m=1
Cm · p(Cm). (8)
The Rician fading channel is assumed for the link betweenthe BS and RS as RS will likely be installed within line-of-sight (LOS) of the BS. For a LOS signal, the envelope dis-tribution of the received signal is more accurately modeled
KIM and SICHITIU: OPTIMAL PLACEMENT OF TRANSPARENT RELAY STATIONS IN 802.16J MOBILE MULTIHOP RELAY NETWORKS2585
by a Rician distribution:
p(ρ) =ρ
σ2exp
(−ρ
2 + ν2
2σ2
)I0
(ρν
σ2
), (9)
where In(·) is the nth-order modified Bessel function of thefirst kind, and 1
2ν2 and σ2 are the power of the LOS com-
ponent and the power of all other scattered components re-spectively. Thus, the total mean power of the received sig-nal, Ω, can be expressed asΩ = 1
2ν2+σ2. The ratio between
the signal power in dominant component and the local meanscattered power is defined as Rician K-factor [18], where
K =ν2
2σ2. (10)
When the K-factor is equal to zero, the Rician distributionbecomes a Rayleigh distribution; from the pdf of receivedsignal envelope (9), the pdf of received SINR, γ, can be de-rived by transforming random variable ρ into γ by consid-ering the relationship between amplitude and power of thesignal,
Ω =12ρ2. (11)
The pdf of received SINR can be expressed as:
p(γ) =(1 + K)e−K
γ∗exp
(− (1 + K)γ
γ∗
)
·I0
⎛⎜⎜⎜⎜⎜⎜⎝√
4K(1 + K)γγ∗
⎞⎟⎟⎟⎟⎟⎟⎠ , (12)
where γ∗ is the average SINR.
3.4 Relay Strategy
When RSs are deployed in a cell, the increase in cell ca-pacity can be determined by comparing the singlehop andmultihop cell capacities. We assume that an SS will use anRS to facilitate its communication with the BS only if suchusage increase its expected data rate. The relay data rate(BS-RS-SS) is influenced by the link capacities of both hopsinvolved. In order to utilize channel bandwidth efficiently,i.e., avoid wasting resource and overflowing data, the in-coming and outgoing data at the relays should be equal:
CBS−RS · tA = CRS−S S · tB, (13)
where CBS−RS and CRS−S S are the capacities of relay linkand access link respectively when each link is given thewhole bandwidth, and tA and tB are the durations of the re-lay link and access link respectively. Focusing on the DLtransmission, tA + tB should be equal to the total duration ofDL frame. The frame structure for transparent RS mode canbe found in [2]. The average data rate of an SS using a relayis equal to the amount of data received divided by the timerequired to receive it:
CBS−S S =CBS−RS · tA
tA + tB, (14)
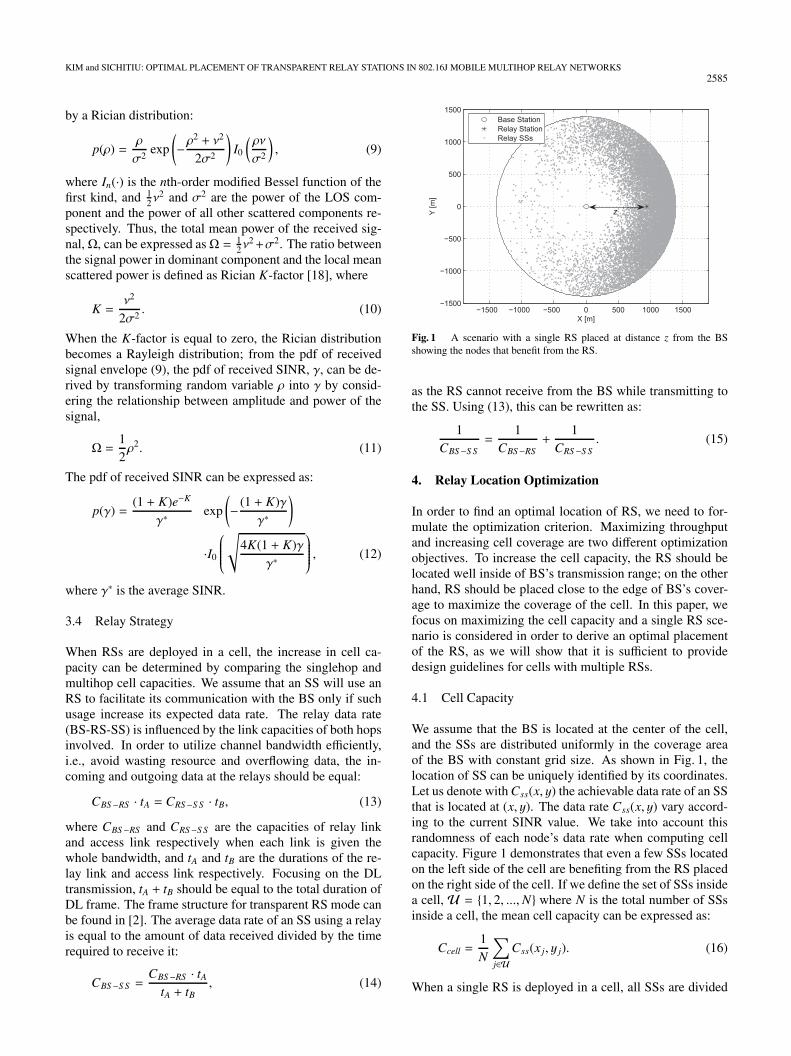
Fig. 1 A scenario with a single RS placed at distance z from the BSshowing the nodes that benefit from the RS.
as the RS cannot receive from the BS while transmitting tothe SS. Using (13), this can be rewritten as:
1CBS−S S
=1
CBS−RS+
1CRS−S S
. (15)
4. Relay Location Optimization
In order to find an optimal location of RS, we need to for-mulate the optimization criterion. Maximizing throughputand increasing cell coverage are two different optimizationobjectives. To increase the cell capacity, the RS should belocated well inside of BS’s transmission range; on the otherhand, RS should be placed close to the edge of BS’s cover-age to maximize the coverage of the cell. In this paper, wefocus on maximizing the cell capacity and a single RS sce-nario is considered in order to derive an optimal placementof the RS, as we will show that it is sufficient to providedesign guidelines for cells with multiple RSs.
4.1 Cell Capacity
We assume that the BS is located at the center of the cell,and the SSs are distributed uniformly in the coverage areaof the BS with constant grid size. As shown in Fig. 1, thelocation of SS can be uniquely identified by its coordinates.Let us denote with Css(x, y) the achievable data rate of an SSthat is located at (x, y). The data rate Css(x, y) vary accord-ing to the current SINR value. We take into account thisrandomness of each node’s data rate when computing cellcapacity. Figure 1 demonstrates that even a few SSs locatedon the left side of the cell are benefiting from the RS placedon the right side of the cell. If we define the set of SSs insidea cell, U = {1, 2, ...,N} where N is the total number of SSsinside a cell, the mean cell capacity can be expressed as:
Ccell =1N
∑j∈U
Css(x j, y j). (16)
When a single RS is deployed in a cell, all SSs are divided

2586IEICE TRANS. COMMUN., VOL.E94–B, NO.9 SEPTEMBER 2011
into two groups denoted as relay SSs and direct SSs. Therelay SSs are benefiting from the RS as the relayed data rateis higher than direct data rate from BS. However, none ofdirect SSs can take advantage of the RS since the direct datarate is greater than the relay data rate. We denote with CDirect
ss
and CRelayss the maximum achievable direct data rate and re-
lay data rate of an SS respectively when the whole channelbandwidth is used for the SS. Therefore, the mean cell ca-pacity (16) can be reformulated as:
Ccell =1N
∑j∈U
max(CDirect
ss (x j, y j),CRelayss (x j, y j)
). (17)
By using (1) and (15), CDirectss and CRelay
ss can be expressedas:
CDirectss =W log2
(1+
1.5− ln 5Pb
ψ1γ1
), (18)
CRelayss =W
log2
(1+ 1.5− ln 5Pb
ψ2γ2
)·log2
(1+ 1.5− ln 5Pb
ψ1γ3
)log2
(1+ 1.5− ln 5Pb
ψ2γ2
)+log2
(1+ 1.5− ln 5Pb
ψ1γ3
) ,where W represents the number of data sub-carriers dividedby OFDM symbol duration, Pb denotes bit error rate, ψ1
and ψ2 are the Rayleigh and Rician fading attenuation com-ponents respectively, and the γ1, γ2, and γ3 are the SINRvalues of BS to SS, BS to RS, and RS to SS respectively.From (3) and (5), γ1, γ2, and γ3 can also be expressed as:
γ1 =LIGBS GS S PBS
L1(LI PN + βGBS GS S PBS ),
γ2 =LIGBS GRS PBS
L2(LI PN + βGBS GRS PBS ), (19)
γ3 =LIGRS GS S PRS
L3(LI PN + βGBS GS S PBS ),
where L1, L2, and L3 are path loss values of BS to SS, BSto RS, and RS to SS respectively; LI is the path loss of co-channel interference, GBS , GRS , and GS S are antenna gainsof BS, RS, and SS respectively, and PBS and PRS are trans-mission powers of BS and RS. When all the network pa-rameters are known, only L1, L2, and L3 are a function ofthe distance between the transmitter and receiver. Equation(15) shows that both CBS−RS and CRS−S S affect CRelay
ss . Thus,for CRelay
ss to be maximized both CBS−RS and CRS−S S shouldbe high and approximately equal to each other. When eitherCBS−RS or CRS−S S is small, it is unlikely that CRelay
ss is greaterthan CDirect
ss .Our objective is to find the optimal placement of the RS
that maximizes the mean cell capacity. The optimal locationcan be determined numerically by maximizing the mean cellcapacity (17) with respect to z, the distance between BS andRS. However, a closed-form solution cannot be obtained bydirect differentiation. In the next subsection, we present aclosed-form approximation to find the optimal placement ofthe RS by using approximations.
Fig. 2 A one-dimensional scenario with an RS at distance z from the BS.
4.2 Approximation
To derive a closed-form solution for the optimal locationof RS, several approximations have to be made. Figure 2shows a simplified scenario, with a BS, RS, and SSs on aone-dimensional segment. All SSs are uniformly distributedwithin the coverage of BS. The distance z between BS andRS represents the location of the RS, and k represents thepoint where CRelay
ss is equal to CDirectss :
CDirectss (k) = CRelay
ss (k) (20)
Depending on the location of the RS, k can vary and canpossibly be outside the cell radius R. However, it is clearthat for our problem the region of interest is always withinthe cell since our objective is to maximize the cell capacity.When an RS is located near the BS or close to the cell edge,the locations Z and k are likely to be far away from eachother, and very few SSs are benefiting from the RS. In con-trast, when an RS is optimally deployed in a cell, the optimallocations Z and k are likely close to each other. Therefore,in this approximation, to facilitate the derivation, we assumethat the locations of Z and k are identical. We will show thatthis approximation will only minimally affect the accuracyof our results.
Relay data rates of relay SSs benefiting from the RS arean important factor for maximizing cell capacity. The upperbound of cell capacity can be derived when every relay SShas a maximum relay data rate. From (15), when both relayand access link capacities are the maximum data rates, therelay data rate is maximized, i.e., the maximum relay datarate that a relay SS can achieve is half of maximum directdata rate. The achievable relay data rates of relay SSs nearthe RS are most likely the maximum values when the loca-tion of RS is optimal. Thus, we assume that the relay datarate, CRelay
ss (k), is always maximum value when k is at the op-timal location of RS. By (18), (20) can be further simplifiedas:
log2
(1+
1.5− ln 5Pb
ψ1γ1
)=
D2, (21)
γ1 =LIGBS GS S PBS
L1(LI PN + βGBS GS S PBS ), (22)
where D is the maximum spectral efficiency that an SS canachieve within the cell. The direct link SINR γ1 is a functionof the path loss L1 that corresponds to the optimal locationof the RS. If we put (22) into (21), the path loss L1 can beexpressed as:

KIM and SICHITIU: OPTIMAL PLACEMENT OF TRANSPARENT RELAY STATIONS IN 802.16J MOBILE MULTIHOP RELAY NETWORKS2587
Fig. 3 Downlink and uplink edge SINR as a function of cell size for twodifferent terrain types.
L1 =1.5ψ1LIGBS GS S PBS
(√
2D−1)(− ln 5Pb)(LI PN+βGBS GS S PBS). (23)
Equation (23) can be considered as a closed-form approxi-mation solution for optimal location of RS. Once L1 is cal-culated from (23), the optimal location of RS can be easilycalculated from path loss model (4).
5. Validation
In this section, the closed-form approximation is comparedwith the numerical solution (17) and the results are ana-lyzed. The system is analyzed taking into account the ef-fects of the reuse factor, sectorization, terrain type, and RSgain. Multiple RSs are also studied for a basic system. Thebasic system has 7 cells grouped into a cluster, one sectorper cell, terrain type A, grid size 10 m, four RSs, Rician K-factor 10 dB, Rayleigh fading attenuation component −3 dBin addition to Table 1 parameters. Each of the above scenar-ios has a different cell size because different network param-eters affect the received SINR value at the SS. We assumethat the SINR values of SSs at the cell edge are greater thanthe minimum threshold value in Table 2, i.e., 9.1 dB. Fig-ure 3 shows how cell size can be determined for a specificscenario. As the distance between BS and SS increases, theSINR values on both downlink and uplink decrease. In mostrealistic scenarios, it is more likely that the uplink SINRvalue is smaller than the downlink SINR due to reducedtransmission power at the SSs. Once either the uplink ordownlink SINR value reaches the minimum threshold value,that distance from the BS is considered as a cell size.
Figure 4 shows both the numerical results and approx-imated results of optimal placement for the basic systemparameters. The difference between numerical value andapproximated value is about 2.16% of the radius cell (i.e.,30 m). To validate the approximated result more efficiently,we define the capacity gain parameter. If CRelay
cell and CDirectcell
are cell capacity with RS and without RS respectively, therelative capacity gain can be defined as:
Fig. 4 Numerical results and approximation results for the basic systemshowing the nodes benefiting from the four RSs.
Capacity Gain =CRelay
cell − CDirectcell
CDirectcell
. (24)
Therefore, the capacity gain difference between the numeri-cal result and approximation result for the basic system caseis only 0.11%. In the following subsections, we present theeffect of the system parameters on the optimal placement ofRS. In addition, we also evaluate the accuracy of the closed-form approximation.
5.1 Reuse Factor
The number of cells grouped in a cluster has an impact onthe interference power, that is, the larger the cluster sizethe smaller the interference power from neighboring cells.From (3), the interference power PI is a function of dis-tance between co-channel cells. The co-channel distancecan be expressed as R
√3τ, where τ is reuse factor, R is cell
size. The cell size can also be affected by the reuse factor.The smaller the reuse factor, the smaller the cell size due tohigher co-channel interference. When the cell size is small,most of the SSs do not benefit from the RSs since they areclose enough to the BS leading to the smaller capacity gain.In other words, it is not desirable to deploy RSs in a smallerreuse factor case. Therefore, the reuse factors considered inthis section are 7, 9, and 12. Figure 5 shows the cell ca-pacity gain as a function of the location of RS in each reusefactor scenarios. The maximum cell capacity gain 31.54% isachieved for a reuse factor of 12. It is interesting to note thata relay is increasing the capacity of the cell even if placednear the base station due to Rayleigh fading that may resultin SSs prefering the link to the RSs to the link to the BS. Thedifferences between numerical results and the approxima-tions of the position of the relay station are less than 6.94%(i.e., 100 m). From the cell capacity gain point of view, a6.94% difference is negligible since cell capacity gain dif-ferences are smaller than 0.34%. The exact cell capacitiesand relay locations are listed in Table 3.

2588IEICE TRANS. COMMUN., VOL.E94–B, NO.9 SEPTEMBER 2011
Table 3 Capacity and optimal relay position for the basic scenario and variations of the reuse factor,sectorization, terrain type, and RS antenna gain.
Scenario Radius CDirectcell
Numerical Results Approximation Results
[m] [Mbps]OptimalLocation
CRelaycell
[Mbps]
CapacityGain[%]
OptimalLocation
CRelaycell
[Mbps]
CapacityGain[%]
Reuse factor 4 930 16.6132 530 18.8094 13.22 740 18.0217 8.48Reuse factor 7 1390 12.9280 940 16.6804 29.03 910 16.6661 28.91Reuse factor 9 1420 12.6865 980 16.5553 30.50 920 16.5346 30.33Reuse factor 12 1440 12.5138 1020 16.4602 31.54 920 16.4186 31.20
Sector 3 1430 12.6306 1010 16.5222 30.81 920 16.4949 30.59Sector 6 1440 12.5515 1000 16.4837 31.33 920 16.4481 31.04Terrain B 1810 12.4314 1110 16.1237 29.70 1150 16.1193 29.67Terrain C 2120 12.2409 1250 15.7743 28.87 1320 15.7068 28.31
RS Gain 10 dB 1390 12.9272 940 15.7502 21.84 910 15.7474 21.82RS Gain 5 dB 1390 12.9266 890 14.7527 14.13 910 14.7449 14.07
Fig. 5 Cell capacity gain as a function of the position of the relay stationfor different reuse factors.
5.2 Sectorization
We study different sectorization scenarios for the basic sys-tem parameters. Sectorization is normally used to increasecell capacity by replacing the omni-directional antenna ateach BS with three or six sector antennas. Each sector canbe considered as a new cell with its own frequency chan-nels. The use of sector antennas reduces the number ofco-channel interferences. For example, when three sectorantennas are used in a cell, the number of co-channel inter-ferences is reduced from 6 to 2. Figure 6 shows the effectof sectorization on the optimal placement of RSs as well asthe differences between numerical results and approximatedresults. It is obvious that the higher the number of sectorsthe higher the capacity gain. The distances between optimalpoints from numerical results and approximation results areless than 6.25% (i.e., 90 m) and the corresponding cell ca-pacity gain differences are less than 0.29%.
5.3 Terrain Types
Terrain types mentioned in Sect. 3.2 are studied in this sub-section to validate the closed-form approximation results
Fig. 6 Cell capacity gain as a function of the position of the relay stationfor different sectorizations.
Fig. 7 Cell capacity gain as a function of the position of the relay stationfor different terrain types.
with numerical results. Since terrain type A has the high-est path loss, the cell size will be the smallest (at 1390 m),while terrain type C has the lowest path loss and the largestcell size (at 2120 m). Figure 7 shows achievable capacitygains with respect to the location of RS for different terraintype scenarios. The ratio of optimal location of RS to eachcell radius is decreasing as terrain type is changing from A

KIM and SICHITIU: OPTIMAL PLACEMENT OF TRANSPARENT RELAY STATIONS IN 802.16J MOBILE MULTIHOP RELAY NETWORKS2589
Fig. 8 Cell capacity gain as a function of the position of the relay stationfor different RS antenna gains.
to C. When terrain type is A, the optimal location of RS is67.63% of the cell radius, while optimal location of RS forterrain type C is 58.96%. However, the maximum capacitygains for each scenario are very similar to each other, 29.7%is achieved for terrain type B and 28.87% is achieved for ter-rain type C. The distances between optimal points from nu-merical results and approximation results are less than 3.3%(i.e., 70 m) and the corresponding cell capacity gain differ-ences are less than 0.56%.
5.4 RS Antenna Gain
From the basic system parameters listed in Table 1, the RSantenna gain is 17 dBi as same as BS antenna gain. We studyhow RS antenna gain can affect the optimal placement of theRS and cell capacity by varying the antenna gain of the RS.Although RSs are expected to be less expensive to deploythan a BS, the antenna gain of RS does not always have to belower than BS antenna gain. Figure 8 shows that the lowerthe RS antenna gain the lower the capacity gain achieved. Itis also shown that the different antenna gains of RS had nosignificant impact on the optimal placement of RS, but theachievable capacity gain differences are nearly proportionalto the antenna gain of RS. The maximum capacity gain is29.03% when RS gain is 17 dBi and the lowest capacity gainis 14.13% when RS gain is 5 dBi. The capacity gain differ-ences between numerical results and approximation resultsare exceedingly small in all cases. The largest difference isonly 0.12% when the RS gain is 17 dBi.
5.5 Multiple RSs
As shown in Fig. 4, multiple RSs can be used to increasethe capacity gain. Considering the objective of minimiz-ing the network cost, it is worthwhile to know how manyRSs would be appropriate to maximize cell capacity gain.Figure 9 shows how much capacity gain can be achievedwith respect to the number of RS when the RSs are arrangedin a circular pattern at the optimal distance from the BS.
Fig. 9 Cell capacity gain as a function of number of RS for different RSantenna gains.
When the RS antenna gain is 17 dBi, capacity gain is almostlinearly increasing until the number of RS is three, and af-ter that the increase of capacity gain is diminishing as thenumber of RS is growing. Therefore, there is no use to de-ploy more than six RSs in this particular network scenario.When the RS antenna gains are 10 dBi and 5 dBi, the capac-ity gains converge around 31% and 25% respectively. A cellmay include any number of relay stations of antenna gain of5 dBi, but the achievable capacity gain is less than that of asystem with five RSs of antenna gain 10 dBi or three RSs ofantenna gain 17 dBi. In order to maximize the cell capacitygain, RS antenna gain is more important than the number ofRSs.
5.6 Outage Probability
Addition of RSs can significantly reduce the outage prob-ability of communication systems. The outage probabilityis defined as the probability that the instantaneous receivedSINR is below a minimum threshold value. The direct path(BS-SS) outage probability can be expressed as:
Pout(Direct path) = p(γ1 < γmin
), (25)
where γ1 is the SINR value of BS to SS and γmin is the min-imum threshold SINR value. When a single RS is placedat the optimal location, the relay path (BS-RS-SS) outageprobability can be computed by:
Pout (Relay path)=1−{p (γ2>γmin
) · p (γ3>γmin
)},(26)
where γ2 and γ3 are SINR values of BS to RS and RS to SS.Due to the fact that BS can opportunistically choose bettercommunication channel between the direct path and relaypath, the transmission will fail only if both direct and relaylink fail simultaneously. Therefore, the outage probabilityof using RS is Pout = Pout(Direct path) × Pout(Relay path).As shown in Fig. 10, the outage probability of using RS issignificantly reduced at all positions. The largest outageprobability is around 50% in the direct path case, while it

2590IEICE TRANS. COMMUN., VOL.E94–B, NO.9 SEPTEMBER 2011
Fig. 10 Outage probability as a function of distance from BS with andwithout an RS.
Fig. 11 Outage probability contour graph with a single RS.
is only 0.11% when an RS is used. Figure 11 shows con-tour plot of outage probability when a single RS is optimallyplaced inside a cell.
6. Conclusion
This paper presents the optimal placement of RS in MMRnetworks. The results show how various network parame-ters such as reuse factor, sectorization, terrain type, numberof RSs, and their antenna gain affect the optimal placementsof RSs. The main contribution of this work is presenting anaccurate model for the cell capacity of 802.16 MMR sys-tems. We also present a closed-form approximation for theoptimal placement of an RS. The closed-form expressioncan be used by network designers to compute the optimalplacements of RSs in most practical cases. From the nu-merical analysis, we have shown that approximation resultsfrom closed-form are reasonably accurate.
References
[1] J. Sydir, “Harmonized contribution 802.16j (Mobile MultihopRelay) usage models,” http://grouper.ieee.org/groups/802/16/relay/
docs/80216j-06-015.pdf, 2006.[2] “IEEE Std 802.16j, amendment to IEEE standard for local and
metropolitan area networks,” 2009.[3] N. Esseling, B. Walke, and R. Pabst, Fixed Relays For Next Gen-
eration Wirelss Systems, Springer Science+Buisness Media, NewYork, USA, 2005.
[4] E.C.V.D. Meulen, “Three-terminal communication channels,” Adv.Appl. Probab., vol.3, no.1, pp.120–154, 1971.
[5] T. Cover and A. Gamal, “Capacity theorems for the relay channel,”IEEE Trans. Inf. Theory, vol.25, no.5, pp.572–584, Sept. 1979.
[6] A. Host-Madsen and J. Zhang, “Capacity bounds and power alloca-tion for wireless relay channels,” IEEE Trans. Inf. Theory, vol.51,no.6, pp.2020–2040, June 2005.
[7] Y.D. Lin and Y.C. Hsu, “Multihop cellular: a new architecture forwireless communications,” Proc. IEEE INFOCOM. Nineteenth An-nual Joint Conference of the IEEE Computer and CommunicationsSocieties, vol.3, pp.1273–1282, March 2000.
[8] K. Xu, Q. Wang, H. Hassanein, and G. Takahara, “Optimal wirelesssensor networks (WSNs) deployment: Minimum cost with lifetimeconstraint,” Proc. IEEE International Conference on Wireless AndMobile Computing, Networking And Communications (WiMob),vol.3, pp.454–461, Aug 2005.
[9] Y. Chen, C.N. Chuah, and Q. Zhao, “Sensor placement for maxi-mizing lifetime per unit cost in wireless sensor networks,” MilitaryCommunications Conference, vol.2, pp.1097–1102, Oct. 2005.
[10] M. Patel, R. Chandrasekaran, and S. Venkatesan, “Energy efficientsensor, relay and base station placements for coverage, connectiv-ity and routing,” Proc. 24th IEEE International Conference on Per-formance, Computing, and Communications (IPCCC), pp.581–586,April 2005.
[11] A. So and B. Liang, “An efficient algorithm for the optimal place-ment of wireless extension points in rectilineal wireless Local AreaNetworks,” Proc. International Conference on Quality of Service inHeterogeneous Wired/Wireless Networks, p.25, 2005.
[12] Y. Bejerano, “Efficient integration of multi-hop wireless and wirednetworks with QoS constraints,” Proc. International Conferenceon Mobile Computing and Networking (MobiCom), pp.215–226,ACM, 2002.
[13] B. Lin, P.H. Ho, L.L. Xie, and X. Shen, “Optimal relay station place-ment in IEEE 802.16j networks,” Proc. International Conferenceon Wireless Communications and Mobile Computing (IWCMC),pp.25–30, Aug. 2007.
[14] B. Lin, P.H. Ho, L.L. Xie, and X. Shen, “Relay station placementin IEEE 802.16j Dual-Relay MMR Networks,” Proc. IEEE Interna-tional Conference on Communications (ICC), pp.3437–3441, May2008.
[15] C. Hoymann, M. Dittrich, and S. Goebbels, “Dimensioning cellularmultihop WiMAX networks,” IEEE Mobile WiMAX Symposium,pp.150–157, 2007.
[16] J.G. Andrews, A. Ghosh, and R. Muhamed, Fundamentals ofWiMAX: Understanding Broadband Wireless Networking, PrenticeHall PTR, Upper Saddle River, NJ, USA, 2007.
[17] G.J. Foschini and J. Salz, “Digital communications over fading radiochannels,” Bell Syst. Tech. J., pp.429–456, Feb. 1983.
[18] V. Erceg and K.V.S. Hari, “Channel models for fixed wireless appli-cations,” IEEE 802.16 Broadband Wireless Access Working Group,Technical Report, 2001.
[19] Q. Zhang and S. Kassam, “Finite-state markov model for Rayleighfading channels,” IEEE Trans. Commun., vol.47, no.11, pp.1688–1692, Nov. 1999.

KIM and SICHITIU: OPTIMAL PLACEMENT OF TRANSPARENT RELAY STATIONS IN 802.16J MOBILE MULTIHOP RELAY NETWORKS2591
Yongchul Kim was bone in Sungnam, SouthKorea. He received a B.E. from Korea MilitaryAcademy in 1998 and an M.S. from the univer-sity of Surrey (Surrey, UK) in 2001. He was afull time instructor in Korea Military Academyuntil 2007 and he is currently a Ph.D. candidateat the North Carolina State University (Raleigh,USA) with research interests in wireless net-working and WiMAX.
Mihail L. Sichitiu born in Bucharest, Ro-mania. He received a B.E. and an M.S. in Elec-trical Engineering from the Polytechnic Univer-sity of Bucharest in 1995 and 1996 respectively.In May 2001, he received a Ph.D. degree inElectrical Engineering from the University ofNotre Dame. He is currently employed as anassociate professor in the Department of Elec-trical and Computer Engineering at North Car-olina State University. His primary research in-terest is in Wireless Networking with emphasis
on multi-hop networking and wireless local area networks.


![High Efficient Link Schedule with Spatial Reuse in Relay ...Among all those IEEE 802.16 technologies, the 802.16j[1]defines a new mobile air interface between the base station(BS)](https://img.pdfslide.us/doc/110x75/611843e3231c4016ea2ffc02/high-efficient-link-schedule-with-spatial-reuse-in-relay-among-all-those-ieee.jpg)