Embed Size (px)
Citation preview
124 | P a g e
OPTIMAL PLACEMENT OF STATIC VOLTAGE
COMPENSATOR
Nandilla Sowjanya1, K.S.Spandana
1,2Electrical and Electronics Department, M.V.G.R College of Engineering (India)
ABSTRACT
In developing countries, a pressure associated with economical and environmental constraints has
forced the power utilities to meet the future demand by fully utilizing the existing resource of
transmission facilities without building new lines. Flexible alternating current transmission systems
(FACTS) devices are used to control the phase angle, voltage and impedance of high voltage AC
lines. By using FACTS devices maximum benefits of transmission systems can be managed i.e.
utilization of existing transmission assets; increased transmission system availability and enabling
environmental benefits.
The main requirement in power transmission systems is the precise control of active and reactive
power flow to maintain the system voltage stability. The active power and reactive power changes
continuously with the variation in the load. This in turn varies the voltage and results in either high
voltage or low voltage. It is known fact that high voltage results in insulation damage and low
voltage results in decreasing the life period of the equipment. A static VAR compensator (SVC) is a
power quality device, which employs power electronics to control the reactive power flow of the
system where it is connected. As a result, it is able to provide fast- acting reactive power
compensation on electrical systems. The SVC is an automated impedance matching device, designed
to bring the system closer to unity power factor. This paper mainly deals with the optimal placement
of static VAR compensator (SVC) to improve voltage profile.
Keywords: TSC-TCR type SVC, FACTS controllers, Microcontroller based control of Reactive
power, Automatic control of SVC, TCR control, Voltage stability Enhancement and P-V curves.
I. INTRODUCTION
Today‟s changing electric power systems create a growing need for flexibility, reliability, fast response and
accuracy in the fields of electric power generation, transmission, distribution and consumption. Flexible
Alternation Current Transmission Systems (FACTS) are new devices emanating from recent innovative
technologies that are capable of altering voltage, phase angle and/or impedance at particular points in power
systems. Their fast response offers a high potential for power system stability enhancement apart from steady
state flow control. Among the FACTS controllers, Static Var Compensator (SVC) provides fast acting dynamic
reactive compensation for voltage support during contingency events which would otherwise depress the voltage
125 | P a g e
for a significant length of time. SVC also dampens power swings and reduces system losses by optimized
reactive power control.
II. PROBLEMS IN THE POWER SYSTEM
Now a day‟s power system are undergoing numerous changes and becoming more complex in operation, control
and stability maintenance standpoints when they meet ever – increasing load demand. Voltage stability is
concerned with the ability of a power system to maintain acceptable voltage at all buses in the system under
normal conditions and after being subjected to a disturbance. A system enters a state of voltage instability when
a disturbance, increase in load demand or change in system condition causes a progressive and uncontrollable
decline in voltage. Power flow in Electrical Power System can be improved by adjusting reactance parameter of
the transmission line. It can also be enhanced by adding a new transmission line in parallel with the existing
one. The transmission line in parallel with the existing one. The main factor causing voltage instability is the
inability of the power system to meet the demand for the reactive power. In power system applications the
equivalen t impedance control that maintain the equivalent impedance of the transmission line maybe be the
preferred method from the operating stand point.
III. VOLTAGE STABILITY
The stability of an interconnected power system is its ability to return to its normal or stable operation after
having been subjected to some form of disturbance. The tendency of synchronous machine to develop forces so
as to maintain synchronism and equilibrium is called stability. The stability limit represents the maximum
steady state power flow possible when the synchronous machine is operating with stability. There are three
forms of stability viz. steady state stability, Transient stability and Dynamic Stability and small signal or
steady- state stability. Frequency stability is closely related to angle stability. Voltage stability mainly involves
the dynamic characteristics of loads and reactive power. Voltage collapse is perhaps the most wildly
recognized form of voltage instability.
Voltage stability Improvement Devices:
Various kinds of stability improvement are:
1. Use of double circuit lines and bundle conductors,
2. HVDC links,
3. Fast acting circuit breakers
4. FACTS controllers
5. Load shedding.
3.1 Introduction of Flexible AC Transmission System (FACTS):
The series devices compensate reactive power with their influence on the effective impedance on the line. They
have an influence on stability and power flow. The SVC is a device which has so far not been built on
transmission level because series compensation and TCSC are fulfilling all the today‟s requirements with more
cost, efficiency. But series applications of Voltage Source Converters have been implemented for power quality
applications on distribution level for instance to secure factory in feeds against dips and flicker. These devices
126 | P a g e
and called Dynamic Voltage Restorer (SVR). A capacitive reactance compensator which consists of a series
capacitor bank shunted by a thyristor controlled reactor in order to provide smoothly variable series capacitive
reactance.
The basic applications and advantages of FACTS devices are
1. Power flow control
2. Increase of transmission capability.
3. Voltage control.
4. Reactive power compensation
5. Stability improvement
6. Power quality improvement
7. Power conditioning
8. Flicker mitigation
9. Interconnection of renewable and distributed generation and storages
10. Rapid, continuous control of the transmission line reactance.
3.2 Reactive power compensation methods
1. Shunt Compensation
2. Series compensation
3. Synchronous condensers
4. Static VAR compensators
5. Static compensators
3.2.1 Shunt Compensation
The device that is connected in parallel with the transmission line is called the shunt compensator. A shunt
compensator is always connected in the middle of the transmission line.
An ideal shunt compensator provides the reactive power to the system. Shunt-connected reactors are used to
reduce the line over voltages by consuming the reactive power, while shunt connected capacitors are used to
maintain the voltage levels by compensating the reactive power to transmission line.
3.2.2 Series Compensation
When a device is connected in series with the transmission line it is called a series compensator. A series
compensator can be connected anywhere in the line. There are two modes of operation – capacitive mode of
operation and inductive mode of operation.
3.2.3 Synchronous Condenser
By controlling the field excitation of a synchronous machine running without a prime mover(synchronous
condenser), it can be made to either generate or absorb reactive power. Because of their high purchase and
operating costs, they have been superseded by static var compensators. Their advantage is that, their reactive
power generation is independent of the system voltage.
3.2.4 Static Var Compensators
A practical static war compensator with the desired control range can be formed by using combinations of
mechanically switched capacitor, thyristor-switched capacitor, thyristor-controlled reactor, mechanically
127 | P a g e
switched reactor. These are capable of controlling individual phase voltages of the buses to which they are
connected.
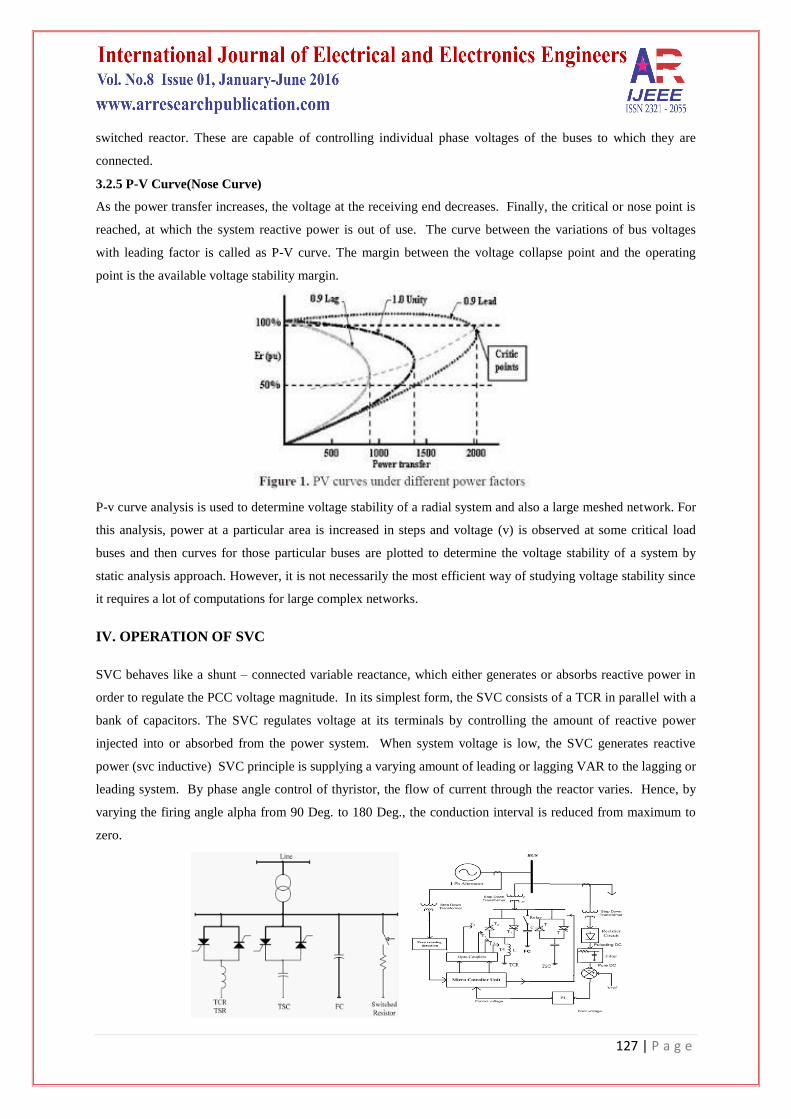
3.2.5 P-V Curve(Nose Curve)
As the power transfer increases, the voltage at the receiving end decreases. Finally, the critical or nose point is
reached, at which the system reactive power is out of use. The curve between the variations of bus voltages
with leading factor is called as P-V curve. The margin between the voltage collapse point and the operating
point is the available voltage stability margin.
P-v curve analysis is used to determine voltage stability of a radial system and also a large meshed network. For
this analysis, power at a particular area is increased in steps and voltage (v) is observed at some critical load
buses and then curves for those particular buses are plotted to determine the voltage stability of a system by
static analysis approach. However, it is not necessarily the most efficient way of studying voltage stability since
it requires a lot of computations for large complex networks.
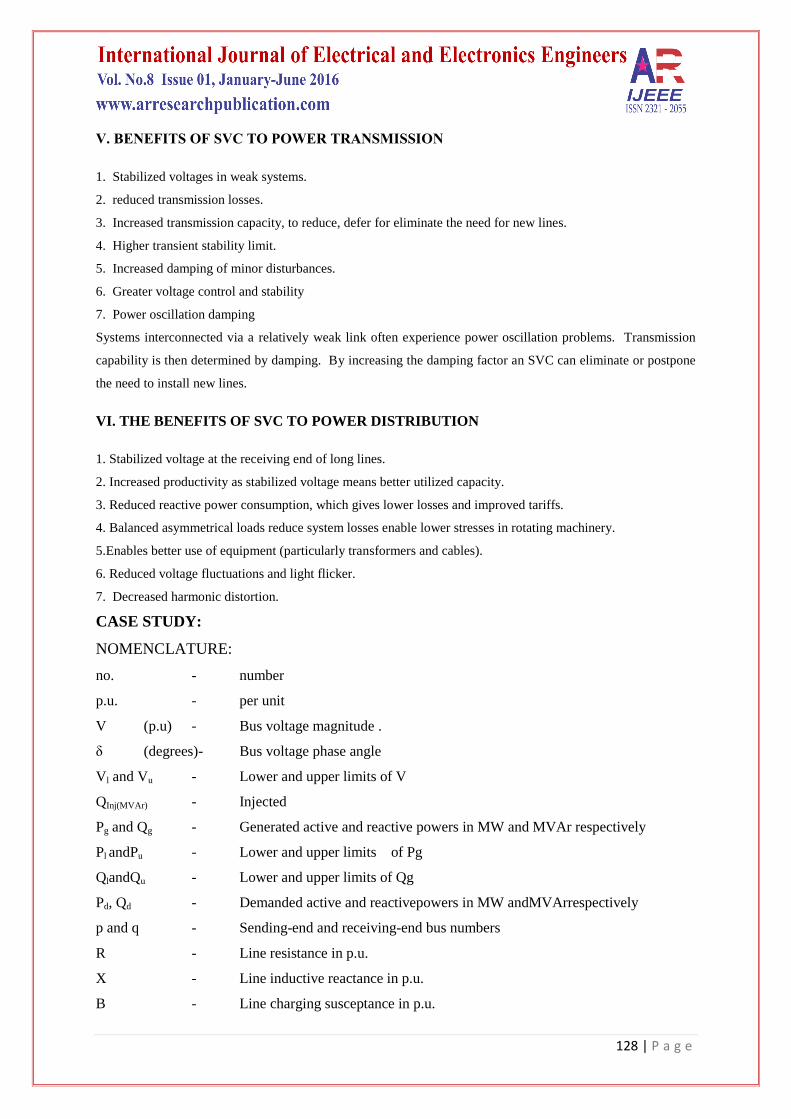
IV. OPERATION OF SVC
SVC behaves like a shunt – connected variable reactance, which either generates or absorbs reactive power in
order to regulate the PCC voltage magnitude. In its simplest form, the SVC consists of a TCR in parallel with a
bank of capacitors. The SVC regulates voltage at its terminals by controlling the amount of reactive power
injected into or absorbed from the power system. When system voltage is low, the SVC generates reactive
power (svc inductive) SVC principle is supplying a varying amount of leading or lagging VAR to the lagging or
leading system. By phase angle control of thyristor, the flow of current through the reactor varies. Hence, by
varying the firing angle alpha from 90 Deg. to 180 Deg., the conduction interval is reduced from maximum to
zero.
128 | P a g e
V. BENEFITS OF SVC TO POWER TRANSMISSION
1. Stabilized voltages in weak systems.
2. reduced transmission losses.
3. Increased transmission capacity, to reduce, defer for eliminate the need for new lines.
4. Higher transient stability limit.
5. Increased damping of minor disturbances.
6. Greater voltage control and stability
7. Power oscillation damping
Systems interconnected via a relatively weak link often experience power oscillation problems. Transmission
capability is then determined by damping. By increasing the damping factor an SVC can eliminate or postpone
the need to install new lines.
VI. THE BENEFITS OF SVC TO POWER DISTRIBUTION
1. Stabilized voltage at the receiving end of long lines.
2. Increased productivity as stabilized voltage means better utilized capacity.
3. Reduced reactive power consumption, which gives lower losses and improved tariffs.
4. Balanced asymmetrical loads reduce system losses enable lower stresses in rotating machinery.
5.Enables better use of equipment (particularly transformers and cables).
6. Reduced voltage fluctuations and light flicker.
7. Decreased harmonic distortion.
CASE STUDY:
NOMENCLATURE:
no. - number
p.u. - per unit
V (p.u) - Bus voltage magnitude .
δ (degrees)- Bus voltage phase angle
Vl and Vu - Lower and upper limits of V
QInj(MVAr) - Injected
Pg and Qg - Generated active and reactive powers in MW and MVAr respectively
Pl andPu - Lower and upper limits of Pg
QlandQu - Lower and upper limits of Qg
Pd, Qd - Demanded active and reactivepowers in MW andMVArrespectively
p and q - Sending-end and receiving-end bus numbers
R - Line resistance in p.u.
X - Line inductive reactance in p.u.
B - Line charging susceptance in p.u.
129 | P a g e
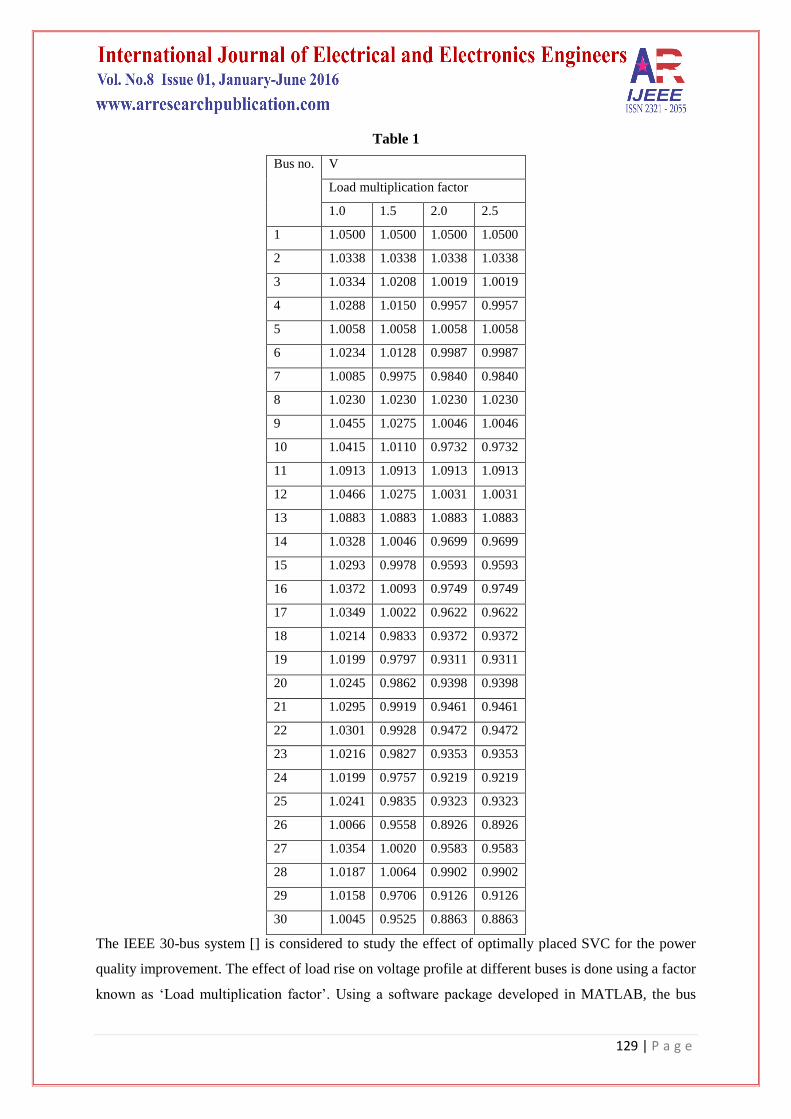
Table 1
Bus no. V
Load multiplication factor
1.0 1.5 2.0 2.5
1 1.0500 1.0500 1.0500 1.0500
2 1.0338 1.0338 1.0338 1.0338
3 1.0334 1.0208 1.0019 1.0019
4 1.0288 1.0150 0.9957 0.9957
5 1.0058 1.0058 1.0058 1.0058
6 1.0234 1.0128 0.9987 0.9987
7 1.0085 0.9975 0.9840 0.9840
8 1.0230 1.0230 1.0230 1.0230
9 1.0455 1.0275 1.0046 1.0046
10 1.0415 1.0110 0.9732 0.9732
11 1.0913 1.0913 1.0913 1.0913
12 1.0466 1.0275 1.0031 1.0031
13 1.0883 1.0883 1.0883 1.0883
14 1.0328 1.0046 0.9699 0.9699
15 1.0293 0.9978 0.9593 0.9593
16 1.0372 1.0093 0.9749 0.9749
17 1.0349 1.0022 0.9622 0.9622
18 1.0214 0.9833 0.9372 0.9372
19 1.0199 0.9797 0.9311 0.9311
20 1.0245 0.9862 0.9398 0.9398
21 1.0295 0.9919 0.9461 0.9461
22 1.0301 0.9928 0.9472 0.9472
23 1.0216 0.9827 0.9353 0.9353
24 1.0199 0.9757 0.9219 0.9219
25 1.0241 0.9835 0.9323 0.9323
26 1.0066 0.9558 0.8926 0.8926
27 1.0354 1.0020 0.9583 0.9583
28 1.0187 1.0064 0.9902 0.9902
29 1.0158 0.9706 0.9126 0.9126
30 1.0045 0.9525 0.8863 0.8863
The IEEE 30-bus system [] is considered to study the effect of optimally placed SVC for the power
quality improvement. The effect of load rise on voltage profile at different buses is done using a factor
known as „Load multiplication factor‟. Using a software package developed in MATLAB, the bus
130 | P a g e
voltage variations for different Load multiplication factor values are observed and they are shown in
the Table 1.
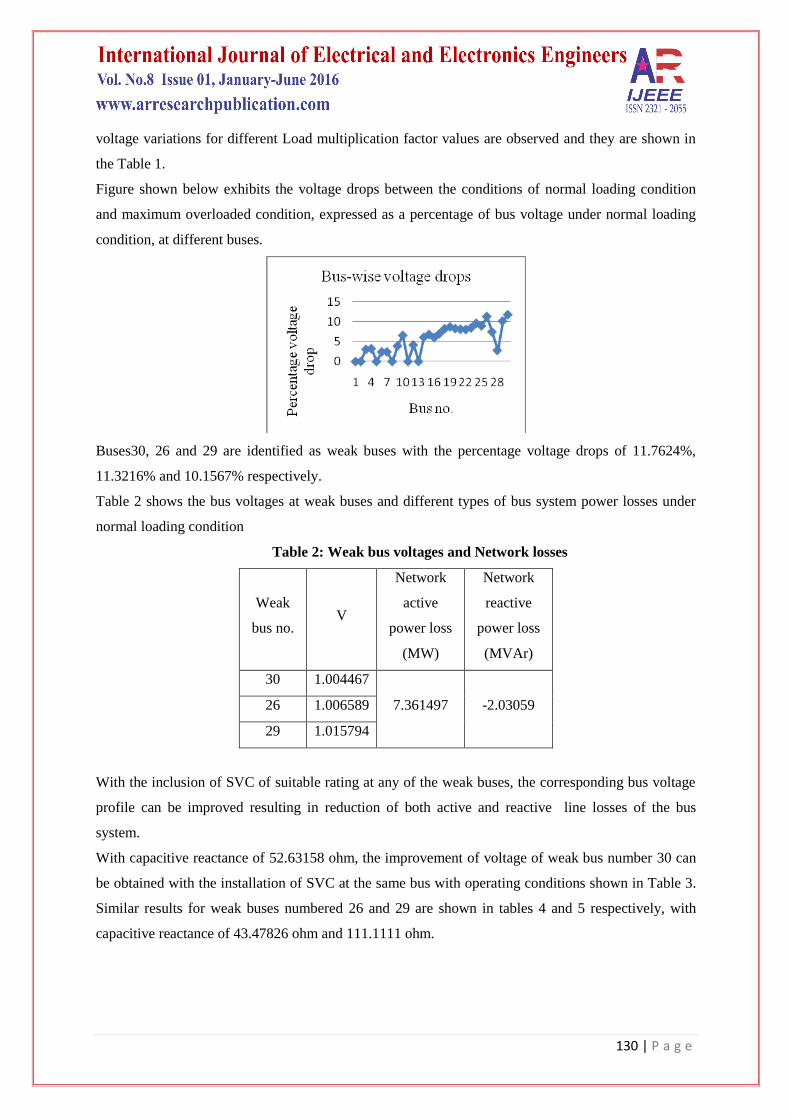
Figure shown below exhibits the voltage drops between the conditions of normal loading condition
and maximum overloaded condition, expressed as a percentage of bus voltage under normal loading
condition, at different buses.
Buses30, 26 and 29 are identified as weak buses with the percentage voltage drops of 11.7624%,
11.3216% and 10.1567% respectively.
Table 2 shows the bus voltages at weak buses and different types of bus system power losses under
normal loading condition
Table 2: Weak bus voltages and Network losses
Weak
bus no. V
Network
active
power loss
(MW)
Network
reactive
power loss
(MVAr)
30 1.004467
7.361497 -2.03059 26 1.006589
29 1.015794
With the inclusion of SVC of suitable rating at any of the weak buses, the corresponding bus voltage
profile can be improved resulting in reduction of both active and reactive line losses of the bus
system.
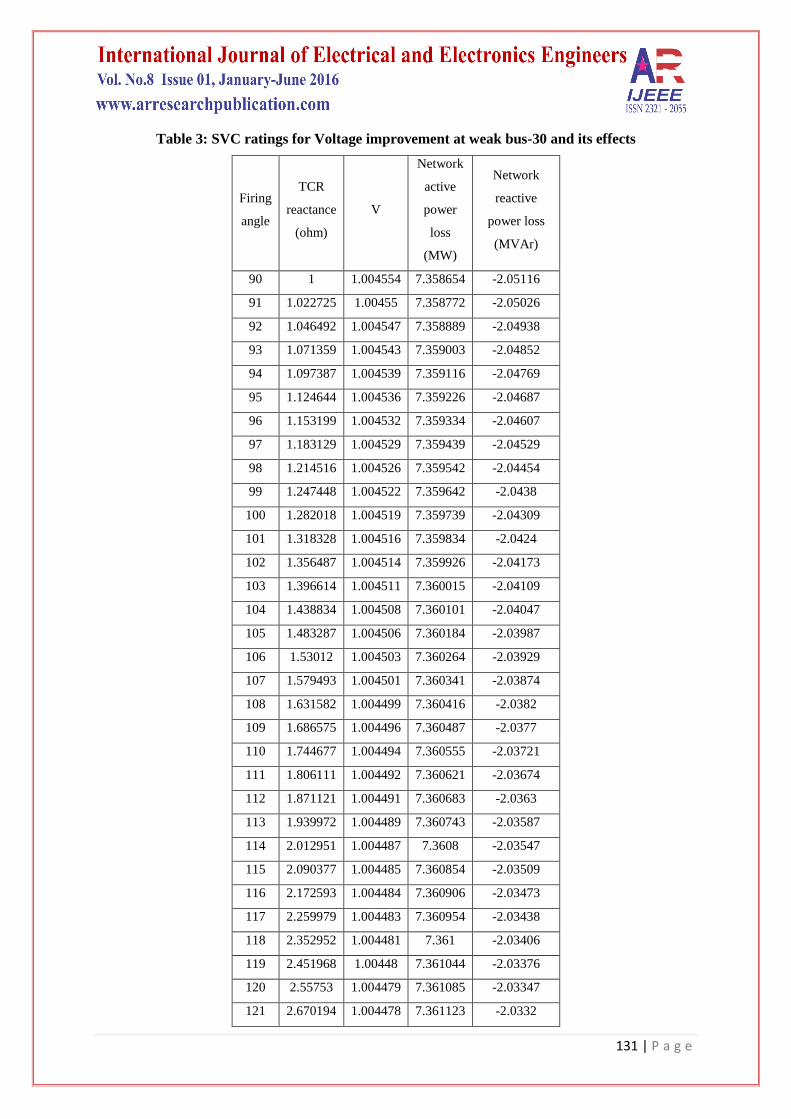
With capacitive reactance of 52.63158 ohm, the improvement of voltage of weak bus number 30 can
be obtained with the installation of SVC at the same bus with operating conditions shown in Table 3.
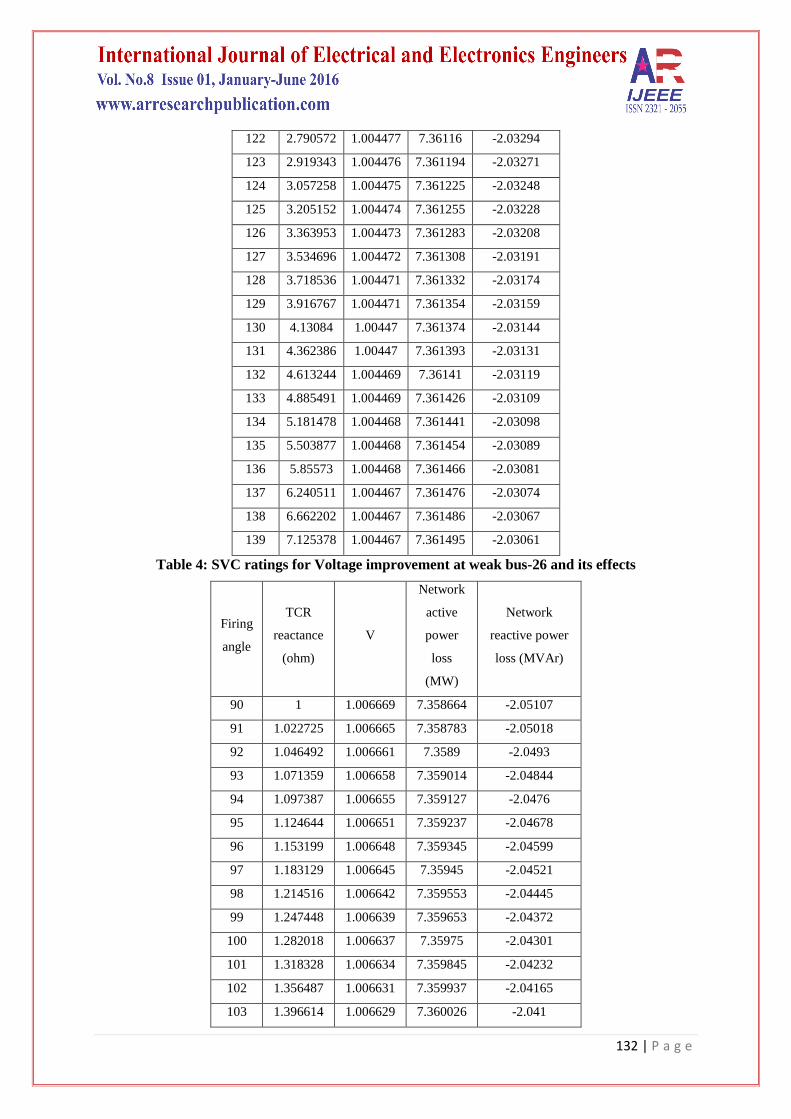
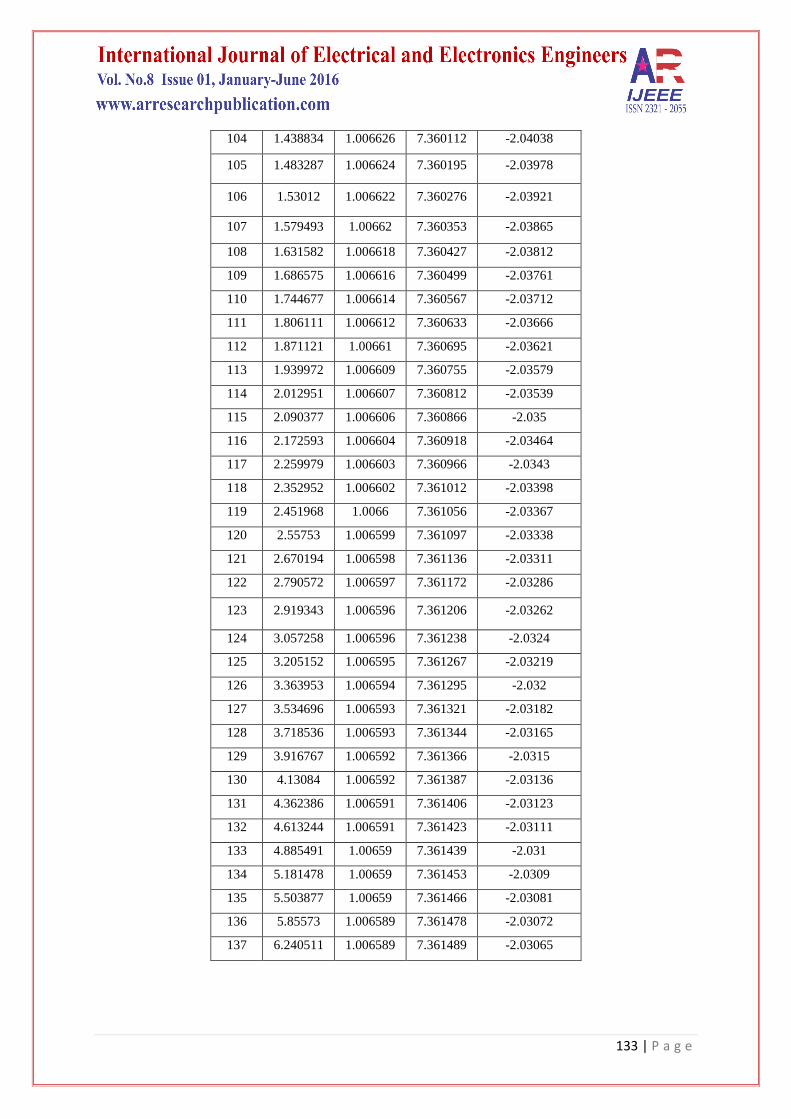
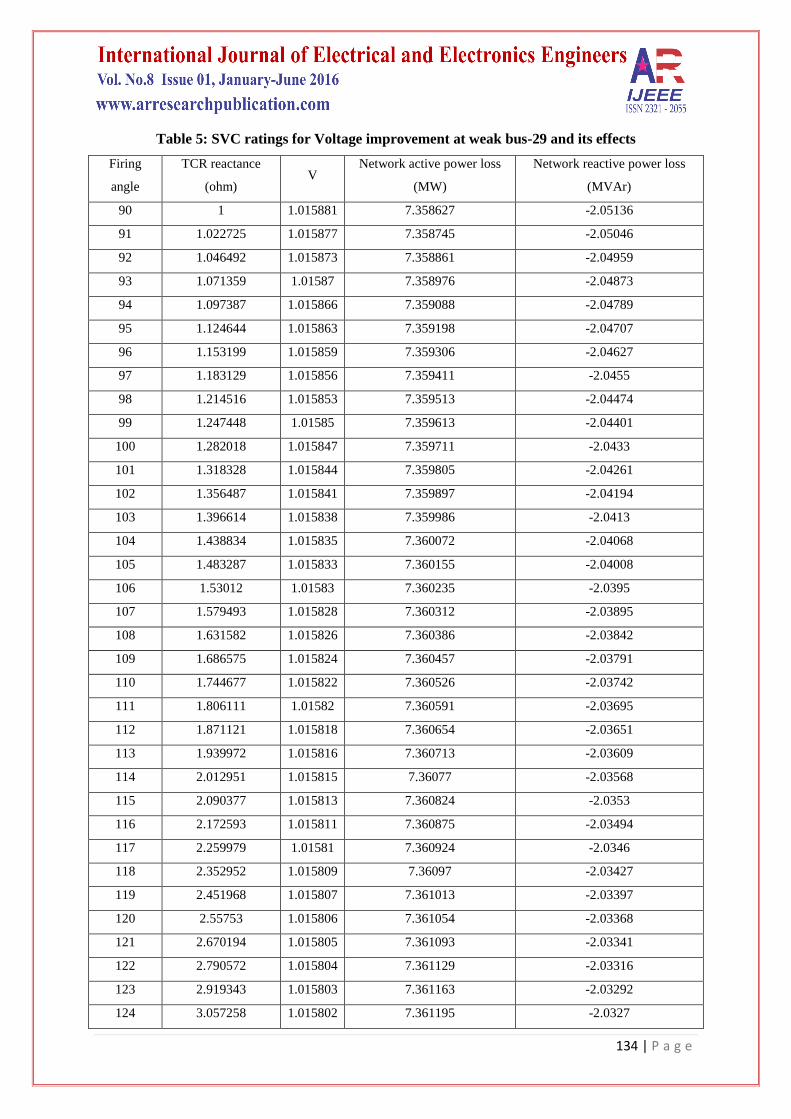
Similar results for weak buses numbered 26 and 29 are shown in tables 4 and 5 respectively, with
capacitive reactance of 43.47826 ohm and 111.1111 ohm.
131 | P a g e
Table 3: SVC ratings for Voltage improvement at weak bus-30 and its effects
Firing
angle
TCR
reactance
(ohm)
V
Network
active
power
loss
(MW)
Network
reactive
power loss
(MVAr)
90 1 1.004554 7.358654 -2.05116
91 1.022725 1.00455 7.358772 -2.05026
92 1.046492 1.004547 7.358889 -2.04938
93 1.071359 1.004543 7.359003 -2.04852
94 1.097387 1.004539 7.359116 -2.04769
95 1.124644 1.004536 7.359226 -2.04687
96 1.153199 1.004532 7.359334 -2.04607
97 1.183129 1.004529 7.359439 -2.04529
98 1.214516 1.004526 7.359542 -2.04454
99 1.247448 1.004522 7.359642 -2.0438
100 1.282018 1.004519 7.359739 -2.04309
101 1.318328 1.004516 7.359834 -2.0424
102 1.356487 1.004514 7.359926 -2.04173
103 1.396614 1.004511 7.360015 -2.04109
104 1.438834 1.004508 7.360101 -2.04047
105 1.483287 1.004506 7.360184 -2.03987
106 1.53012 1.004503 7.360264 -2.03929
107 1.579493 1.004501 7.360341 -2.03874
108 1.631582 1.004499 7.360416 -2.0382
109 1.686575 1.004496 7.360487 -2.0377
110 1.744677 1.004494 7.360555 -2.03721
111 1.806111 1.004492 7.360621 -2.03674
112 1.871121 1.004491 7.360683 -2.0363
113 1.939972 1.004489 7.360743 -2.03587
114 2.012951 1.004487 7.3608 -2.03547
115 2.090377 1.004485 7.360854 -2.03509
116 2.172593 1.004484 7.360906 -2.03473
117 2.259979 1.004483 7.360954 -2.03438
118 2.352952 1.004481 7.361 -2.03406
119 2.451968 1.00448 7.361044 -2.03376
120 2.55753 1.004479 7.361085 -2.03347
121 2.670194 1.004478 7.361123 -2.0332
132 | P a g e
122 2.790572 1.004477 7.36116 -2.03294
123 2.919343 1.004476 7.361194 -2.03271
124 3.057258 1.004475 7.361225 -2.03248
125 3.205152 1.004474 7.361255 -2.03228
126 3.363953 1.004473 7.361283 -2.03208
127 3.534696 1.004472 7.361308 -2.03191
128 3.718536 1.004471 7.361332 -2.03174
129 3.916767 1.004471 7.361354 -2.03159
130 4.13084 1.00447 7.361374 -2.03144
131 4.362386 1.00447 7.361393 -2.03131
132 4.613244 1.004469 7.36141 -2.03119
133 4.885491 1.004469 7.361426 -2.03109
134 5.181478 1.004468 7.361441 -2.03098
135 5.503877 1.004468 7.361454 -2.03089
136 5.85573 1.004468 7.361466 -2.03081
137 6.240511 1.004467 7.361476 -2.03074
138 6.662202 1.004467 7.361486 -2.03067
139 7.125378 1.004467 7.361495 -2.03061
Table 4: SVC ratings for Voltage improvement at weak bus-26 and its effects
Firing
angle
TCR
reactance
(ohm)
V
Network
active
power
loss
(MW)
Network
reactive power
loss (MVAr)
90 1 1.006669 7.358664 -2.05107
91 1.022725 1.006665 7.358783 -2.05018
92 1.046492 1.006661 7.3589 -2.0493
93 1.071359 1.006658 7.359014 -2.04844
94 1.097387 1.006655 7.359127 -2.0476
95 1.124644 1.006651 7.359237 -2.04678
96 1.153199 1.006648 7.359345 -2.04599
97 1.183129 1.006645 7.35945 -2.04521
98 1.214516 1.006642 7.359553 -2.04445
99 1.247448 1.006639 7.359653 -2.04372
100 1.282018 1.006637 7.35975 -2.04301
101 1.318328 1.006634 7.359845 -2.04232
102 1.356487 1.006631 7.359937 -2.04165
103 1.396614 1.006629 7.360026 -2.041
133 | P a g e
104 1.438834 1.006626 7.360112 -2.04038
105 1.483287 1.006624 7.360195 -2.03978
106 1.53012 1.006622 7.360276 -2.03921
107 1.579493 1.00662 7.360353 -2.03865
108 1.631582 1.006618 7.360427 -2.03812
109 1.686575 1.006616 7.360499 -2.03761
110 1.744677 1.006614 7.360567 -2.03712
111 1.806111 1.006612 7.360633 -2.03666
112 1.871121 1.00661 7.360695 -2.03621
113 1.939972 1.006609 7.360755 -2.03579
114 2.012951 1.006607 7.360812 -2.03539
115 2.090377 1.006606 7.360866 -2.035
116 2.172593 1.006604 7.360918 -2.03464
117 2.259979 1.006603 7.360966 -2.0343
118 2.352952 1.006602 7.361012 -2.03398
119 2.451968 1.0066 7.361056 -2.03367
120 2.55753 1.006599 7.361097 -2.03338
121 2.670194 1.006598 7.361136 -2.03311
122 2.790572 1.006597 7.361172 -2.03286
123 2.919343 1.006596 7.361206 -2.03262
124 3.057258 1.006596 7.361238 -2.0324
125 3.205152 1.006595 7.361267 -2.03219
126 3.363953 1.006594 7.361295 -2.032
127 3.534696 1.006593 7.361321 -2.03182
128 3.718536 1.006593 7.361344 -2.03165
129 3.916767 1.006592 7.361366 -2.0315
130 4.13084 1.006592 7.361387 -2.03136
131 4.362386 1.006591 7.361406 -2.03123
132 4.613244 1.006591 7.361423 -2.03111
133 4.885491 1.00659 7.361439 -2.031
134 5.181478 1.00659 7.361453 -2.0309
135 5.503877 1.00659 7.361466 -2.03081
136 5.85573 1.006589 7.361478 -2.03072
137 6.240511 1.006589 7.361489 -2.03065
134 | P a g e
Table 5: SVC ratings for Voltage improvement at weak bus-29 and its effects
Firing
angle
TCR reactance
(ohm) V
Network active power loss
(MW)
Network reactive power loss
(MVAr)
90 1 1.015881 7.358627 -2.05136
91 1.022725 1.015877 7.358745 -2.05046
92 1.046492 1.015873 7.358861 -2.04959
93 1.071359 1.01587 7.358976 -2.04873
94 1.097387 1.015866 7.359088 -2.04789
95 1.124644 1.015863 7.359198 -2.04707
96 1.153199 1.015859 7.359306 -2.04627
97 1.183129 1.015856 7.359411 -2.0455
98 1.214516 1.015853 7.359513 -2.04474
99 1.247448 1.01585 7.359613 -2.04401
100 1.282018 1.015847 7.359711 -2.0433
101 1.318328 1.015844 7.359805 -2.04261
102 1.356487 1.015841 7.359897 -2.04194
103 1.396614 1.015838 7.359986 -2.0413
104 1.438834 1.015835 7.360072 -2.04068
105 1.483287 1.015833 7.360155 -2.04008
106 1.53012 1.01583 7.360235 -2.0395
107 1.579493 1.015828 7.360312 -2.03895
108 1.631582 1.015826 7.360386 -2.03842
109 1.686575 1.015824 7.360457 -2.03791
110 1.744677 1.015822 7.360526 -2.03742
111 1.806111 1.01582 7.360591 -2.03695
112 1.871121 1.015818 7.360654 -2.03651
113 1.939972 1.015816 7.360713 -2.03609
114 2.012951 1.015815 7.36077 -2.03568
115 2.090377 1.015813 7.360824 -2.0353
116 2.172593 1.015811 7.360875 -2.03494
117 2.259979 1.01581 7.360924 -2.0346
118 2.352952 1.015809 7.36097 -2.03427
119 2.451968 1.015807 7.361013 -2.03397
120 2.55753 1.015806 7.361054 -2.03368
121 2.670194 1.015805 7.361093 -2.03341
122 2.790572 1.015804 7.361129 -2.03316
123 2.919343 1.015803 7.361163 -2.03292
124 3.057258 1.015802 7.361195 -2.0327
135 | P a g e
VII. CONCLUSIONS
In this paper, the analysis of power flow control between two ends of the transmission line to maintain the
voltage magnitude, phase angle and line impedance is performed. The role of static voltage controller in
controlling the power flow through the transmission line by changing the reactance of the system is studied.
This paper work can be extended in future for SVC modeling with a number of bus system and determine the
method for controlling the power flow.
REFERENCES
[1] N. G. Hingorani and L. Gyugyi, “Understanding FACTS”, IEEE Press, New York, USA, (1999).
[2] R. M. Mathur and R. K. Varma, “Thyristor-Based FACTS Controllers for Electrical Transmission
Systems”, IEEE Press and Wiley Interscience, New York, USA, (2002) February.
[3] IEEE Power Engg. Society/CIGRE, “FACTS Overview”, Publication 95 TP 108, IEEE Press, New York,
(1995).
[4] P. Kundur, “Power System Stability and Control”, McGraw-Hill, Inc., New York, (1994).
[5] I EEE Power Engineering Society, “FACTS Applications”, Publication 96 TP 116