Embed Size (px)
Citation preview
The Centers for Medicare & Medicaid Services' Office of Research, Development, and Information (ORDI) strives to make
information available to all. Nevertheless, portions of our files including charts, tables, and graphics may be difficult to
read using assistive technology.
Persons with disabilities experiencing pro
blems accessing portions of any file should contact ORDI through e‐mail at
Acumen, LLC
500 Airport Blvd., Suite 365
Burlingame, CA 94010
The Centers for Medicare & Medicaid Services' Office of Research, Development, and Information (ORDI) strives to make
information available to all. Nevertheless, portions of our files including charts, tables, and graphics may be difficult to
read using assistive technology.
Persons with disabilities experiencing pro
blems accessing portions of any file should contact ORDI through e‐mail at
Optimal Pay-for-Performance Scores: How to Incentivize Physicians to Behave Efficiently Using Episode-Based Measures February 2011 Thomas MaCurdy Jason Shafrin Diana Zheng
CMS Project Officer Frederick Thomas
Acumen, LLC
500 Airport Blvd., Suite 365
Burlingame, CA 94010

This page is intentionally left blank.
Acumen, LLC Optimal Pay-for-Performance Scores i
EXECUTIVE SUMMARY
Implementing a pay-for-performance (P4P) program holds the promise of stemming the
tide of rapidly-rising Medicare costs. By penalizing inefficient physicians and rewarding
efficient ones, Medicare could potentially save millions or billions of dollars each year. The
successful realization of such a system requires not only that efficiency ratings are
comprehensible to both providers and policymakers, but also that they affect provider behavior
as intended. Additionally, to be valid and compelling, a physician efficiency rating system
should evaluate providers on factors under their direct control.
To advance our understanding of the incentives created by alternative structures of P4P
systems, this analysis evaluates options for how to measure efficiencies in these systems and
how to translate these measures into payments. The framework considered in this report first
utilizes episodes of care produced by commercial grouping software as the basis for creating
condition efficiency scores. Using these episode scores, a single ―composite score‖ of relative
efficiency is then calculated for each provider based on attributed episodes of care. Finally, this
P4P framework develops an ―incentive factor‖ to translate these scores into meaningful financial
incentives. The question addressed here is how these different elements translating a physician’s
cost efficiency into fee schedules interact to influence this provider’s behavior.
Within this general framework, policymakers should focus on designing a system that
achieves two basic goals. First, physicians should be incentivized to maximize their efficiency
scores by reducing episode cost. These efforts should attempt to most drastically reduce the
costs of treating high-cost episodes. Second, providers should reallocate their efforts to
specialize in the conditions they treat most efficiently. The remainder of this paper focuses on
implementing an episode-based scoring methodology to achieve these two aims. This report
finds that although composite scores can be used to incentivize some physicians to decrease
resource utilization, many physicians will not engage in any cost-saving behaviors unless the
levels of penalties and bonuses are unusually high.
Constructing Condition Scores
Implementing an episode-based P4P initiative requires policymakers to decide the exact
program specifications needed for the creation of condition scores. For instance, the Centers for
ii Executive Summary Acumen, LLC
Medicare & Medicaid Services (CMS) must first decide which grouping software to use to
aggregate cost information on Medicare claims into episodes of care. Since beneficiaries often
visit many providers during a single episode, one must create rules for attributing episode cost to
the relevant providers. After the episode cost is allocated, one must decide on the exact
efficiency-scoring specification, including whether to compare providers against all their peers or
against only other providers in the same specialty. Only after these issues are resolved can
policymakers evaluate provider performance in treating each medical condition.
Weighting Condition Scores by Both Cost and Frequency is Optimal
Within the P4P framework outlined above, this report relies on a single composite-score
measure of efficiency for each individual provider. Because this framework rewards and
punishes providers through adjustments to future claims payments, using condition scores
without aggregation is not feasible under the current Medicare payment structure. When a claim
is initially received, the episode or condition to which that claim is grouped often depends on
subsequent health events. Thus, distinguishing prospective reimbursement for each condition is
infeasible.
This report examines four methods of aggregating condition scores into a single
composite score for adjusting future provider payments. The commonly-used ―frequency‖
method simply weights each condition score by the frequency with which the physician is
attributed episodes of that condition. The ―expected-cost-per-episode‖ weighting scheme
weights condition scores only by the expected cost for each condition and ignores the number of
patients with that illness the physician treated. Weighting condition scores by ―expected total
cost‖ utilizes both the frequency with which the physician treats patients with each condition and
the expected cost of treating each illness. Similarly, the ―total-cost‖ method weights condition
scores using both frequency and cost, but uses the physician’s actual – rather than expected –
cost for each condition. Empirical analysis of physician efficiency scores for 2003 Oregon
Medicare providers shows that the choice of weighting scheme significantly affects the rankings
of individual physicians.
Based on the provider incentives it creates, this report advocates using the expected-total-
cost weighting scheme to construct composite scores. Weighting by frequency alone fails to
Acumen, LLC Optimal Pay-for-Performance Scores iii
emphasize typically expensive conditions, and cost weighting alone does not encourage
physicians to specialize in the conditions they treat most. The expected-total-cost weighting
scheme and the total-cost weighting scheme are the only frameworks that satisfy both aims. Of
these two, however, the expected-total-cost weighting method is preferable. Unlike using the
actual episode cost for weighting, using the expected cost for a condition does not place greater
weight on the conditions the physician treats inefficiently.
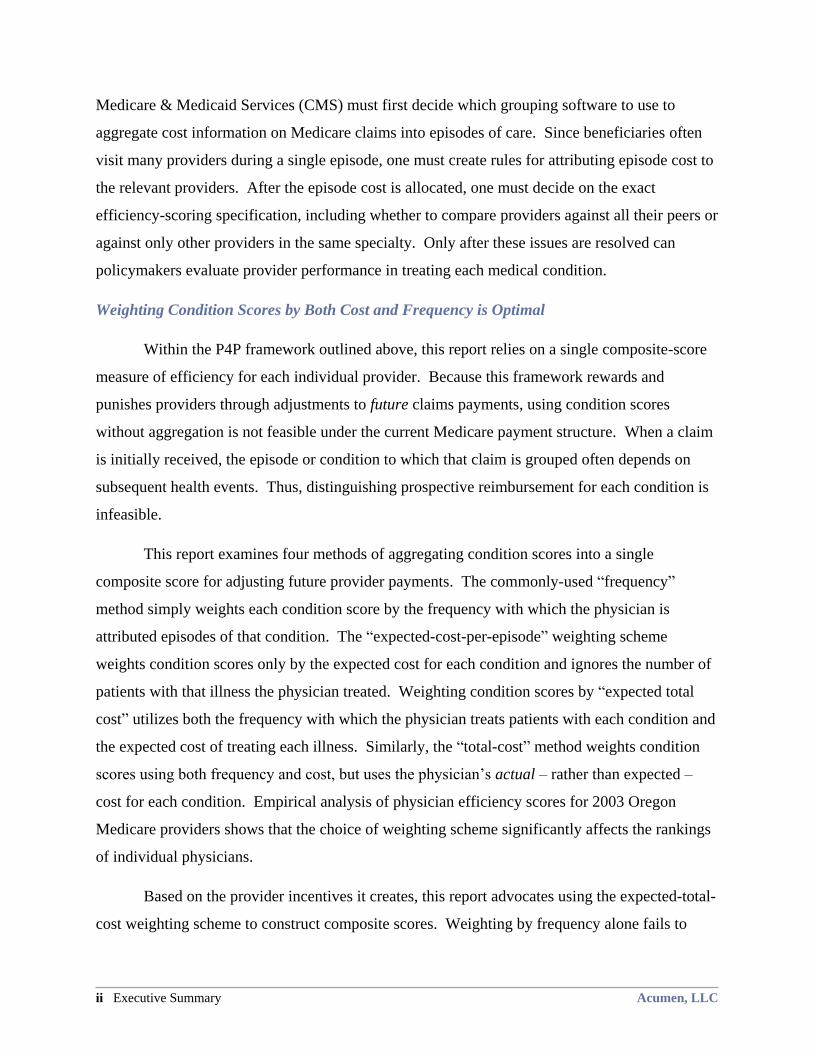
Table 1: Summary of Weighting Schemes and Incentives
Physician Efficiency
Incentives Frequency
Expected
Cost per Episode
Expected
Total Cost Total Cost
Target high-cost episodes No Yes Yes Yes
Specialize in efficiently-
treated conditions Yes No Yes Yes
Payment Scheme Promotes Different Incentives for Different Types of Physicians
Although this report endorses weighting the composite score by expected total cost, the
incentives provided to physicians depend greatly on how CMS translates the scores into financial
rewards and penalties. To stimulate the greatest change in physician behavior toward the more
efficient use of resources, Medicare must increase the income of efficient physicians relative to
the inefficient ones. In this report, the physician’s penalty or reward is proportional to the
deviation between his score and that of a physician of average efficiency (i.e., has a composite
score of 1.0). Let us call the strength of the financial incentive the ―incentive factor.‖ As the
incentive factor increases, so does a physician’s motivation to improve his score. For example, if
a physician has a score of 1.2, his costs will be 20% higher than the typical physician. When an
incentive factor of 50% is applied, every one of the physician’s future payments from Medicare
would be divided by 1.1 (i.e., about a 9% decrease in payment). On the other hand, if the
incentive factor is 25%, the physician’s future payments will be divided by only 1.05 (i.e., about
a 5% decrease).
Although the comprehensive score and associated payment scheme theoretically
encourage reductions in resource use, the incentives a physician actually faces depend on
whether the physician acts as a ―gatekeeper‖ or a ―direct supplier.‖ Under this paradigm, the
gatekeeper treats the patient in an office setting and receives a standard rate for each of his
iv Executive Summary Acumen, LLC
attributed episodes. The gatekeeper also directs his patients’ courses of treatment through
referrals to other physicians for treatments. Although Medicare does not currently assign
patients to gatekeepers, recent reform efforts have focused on instituting accountable care
organizations (ACOs), which use gatekeepers as a major tenet.
When prompted with the right incentives, the gatekeeper could use two methods to
improve his efficiency score. First, he could seek to reduce costs for his episodes as much as
possible. Because the gatekeeper only receives a standard rate for each episode regardless of the
episode’s cost, he increases his income by selecting less expensive treatments or eliminating
treatments, thus increasing his bonus from CMS. Second, he could shift his activities toward the
conditions he already treats efficiently, which will also increase his bonus payment. If the
physician receives a standard rate for every episode, shifting treatment activities will not change
his raw claims revenue, but will increase the bonuses CMS pays him.
Under the recommended expected-total-cost weighting system, although gatekeeper
physicians always face incentives to adopt these cost-saving behaviors, the magnitude of these
financial incentives may not be sufficient to induce large behavioral changes. With an incentive
factor greater than 0%, the gatekeeper has some positive incentive to increase his efficiency
score. However, as the gatekeeper only receives a fixed rate for each episode he treats, he often
does not reap benefits proportional to the cost savings he passes on to Medicare. For instance, if
a gatekeeper decides to send a patient to physical therapy rather than prescribing a similarly-
effective surgery, Medicare will save thousands of dollars. However, if the gatekeeper only
receives $50 for an office visit, a bonus that doubled his payment might not provide a strong
enough incentive to change the gatekeeper’s behavior if he is used to referring patients to a
surgeon. Thus, an incentive factor greater than 100% might be necessary to incentivize
gatekeepers to improve efficiency.
On the other end of the spectrum, physicians who directly supply all of the medical
treatment for a patient face different incentives. Direct suppliers provide most, or all, of the care
during an episode. To clearly illustrate the physician’s incentives, this report assumes that these
direct-supplier physicians provide all of the care in an episode and, hence, receive all of the
revenue from claims for that episode. Empirically, physicians tend to act as direct suppliers
when treating conditions with lower average costs.
Acumen, LLC Optimal Pay-for-Performance Scores v
Unlike gatekeepers, direct supplier physicians stand to lose revenue by increasing their
cost efficiency under expected-total-cost weighting. Furthermore, the bonus they receive for
increased efficiency may not cover that loss, depending on the incentive factor. More so than for
gatekeepers, the incentive factor is critical to what incentives the direct supplier will face. First,
decreasing resource utilization for any condition causes a drop in the physician’s claims revenue
that may not be offset by increased efficiency bonuses. An incentive factor of greater than 100%
will incentivize these physicians to reduce resource utilization for any given condition, but CMS
will be paying more money in bonuses than the agency itself is saving. Secondly, the direct
supplier generally seeks to treat more cases of the most profitable conditions, regardless of his
efficiency levels for those conditions. The efficiency reward structure has a limited ability to
offset this motivation. Only an incentive factor of well over 100% would incentivize all direct
suppliers to specialize in treating conditions they are efficient at treating. For example, even if a
direct supplier acts very inefficiently when providing care for an expensive condition, it is not in
his interest to reduce costs because the increased bonus he will receive may not offset his loss in
revenue. Therefore, one must invoke severe punishments and pay large bonuses to convince
direct suppliers to act more efficiently.
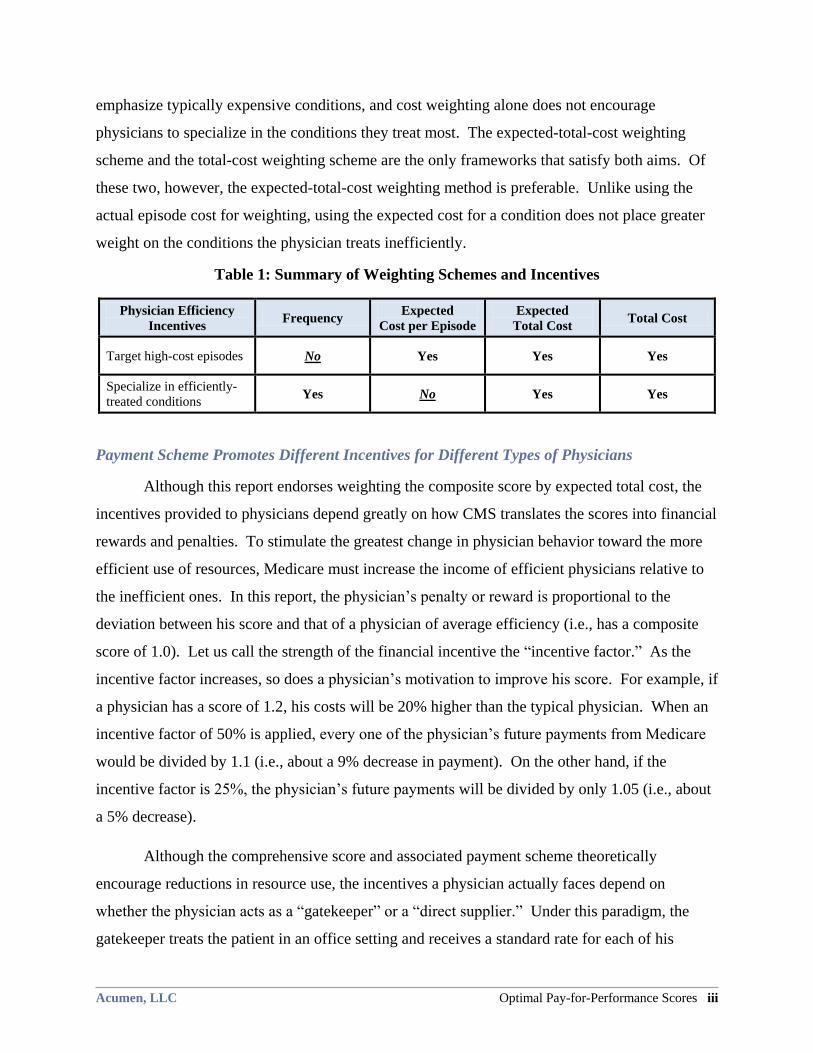
Table 2: Incentives for Physicians by Incentive factor
Physician
Role Physician Efficiency Incentives
Incentive factor
0% <100% >100% >>100%
Gatekeeper
Target high-cost episodes No Yes Yes Yes
Specialize in efficiently-treated conditions No Yes Yes Yes
Direct
Supplier
Target high-cost episodes No No Yes Yes
Specialize in efficiently-treated conditions No No No Yes, if incentive factor
is large enough
Recommendations and Areas for Future Research
If CMS introduces an episode-based P4P system, this report recommends that this system
have the following three characteristics:
1. Composite physician efficiency scores should be constructed from condition
scores based on resource utilization;
vi Executive Summary Acumen, LLC
2. These condition scores should be aggregated into a composite score using the
expected-total-cost weighting method; and
3. An incentive factor greater than 100% should be considered for translating
composite scores to payment rates.
Acumen, LLC Optimal Pay-for-Performance Scores vii
TABLE OF CONTENTS
Executive Summary ....................................................................................................................... i
1 Introduction ........................................................................................................................... 1
2 Constructing Episodes and Condition Scores .................................................................... 3 2.1 Using Episodes as the Basis for Physician Scores ............................................................ 3
2.2 Creating Episodes and Attributing Episode Costs to Physicians ...................................... 4
2.3 Considerations in Designing a Physician Scoring System ............................................... 5
2.3.1 Using Absolute vs. Relative Physician Scores ........................................................... 5
2.3.2 Scoring Physicians Across vs. Within Specialty ........................................................ 6
2.3.3 Scoring Individuals vs. Practice Groups ..................................................................... 9
2.4 Creating Condition Scores ................................................................................................ 9
3 Weighting Schemes for Composite Physician Scores ...................................................... 11 3.1 Frequency Weights ......................................................................................................... 11
3.2 Expected Cost-per-Episode Weights .............................................................................. 12
3.3 Expected-Total-Cost Weights ......................................................................................... 13
3.4 Total-Cost Weights ......................................................................................................... 14
3.5 Comparing the Four Schemes’ Physician Incentives ...................................................... 14
4 Physician Tradeoffs between Efficiency and Revenue .................................................... 16 4.1 Two Strategies for Improving Efficiency ....................................................................... 16
4.1.1 Increasing Episode Efficiency .................................................................................. 17
4.1.2 Changing the Composition of Episodes Treated....................................................... 18
4.2 Converting Efficiency Scores to a Payment Structure .................................................... 20
4.3 Financial Incentives for Physicians Acting as Gatekeepers ........................................... 22
4.3.1 Increasing Efficiency in One Condition.................................................................... 23
4.3.2 Increasing Efficiency by Changing Composition of Episodes Treated .................... 24
4.4 Financial Incentives for Physicians Acting as Direct Suppliers ..................................... 25
4.4.1 Increasing Efficiency in One Condition.................................................................... 25
4.4.2 Increasing Efficiency by Changing the Composition of Episodes Treated .............. 26
4.5 Choosing an Incentive Factor ......................................................................................... 27
5 Empirical Applications of Scoring to Medicare Physicians ............................................ 30 5.1 Physician Score Distributions Using the Four Weighting Schemes ............................... 30
5.2 Change in Physician Scores under Different Weight Schemes ...................................... 31
5.3 Challenges in Identifying the Decision-making Physician ............................................. 33
6 Conclusion ........................................................................................................................... 35 6.1 Weighting Condition Scores by Expected Total Cost .................................................... 35
6.2 P4P May Create Tradeoff between Efficiency and Revenue for Some Physicians ........ 35
6.3 Other Issues with Episode-Based Efficiency Scoring .................................................... 36
References .................................................................................................................................... 38
Appendix A : Supplementary Tables ........................................................................................ 40
Appendix B : Explanation of Calculations ............................................................................... 44
viii Acumen, LLC
LIST OF TABLES AND FIGURES
Table 1: Summary of Weighting Schemes and Incentives ............................................................ iii
Table 2: Incentives for Physicians by Incentive factor ................................................................... v
Figure 2.1: Cost Distributions of ETG Non-malignant Neoplasm by Specialty ............................. 8
Figure 2.2: Cost Distributions of MEG Fracture: Femur, head or neck by Specialty ................... 8
Table 3.1: Hypothetical Example of Calculating Composite Efficiency Scores .......................... 12
Table 3.2: Summary of Weighting Schemes and Incentives ........................................................ 15
Figure 4.1: Change in Composite Score Resulting from a 10% Decrease in Costs in Treating a
Condition..................................................................................................................... 18
Figure 4.2: Change in Composite Score from Dropping One Episode ......................................... 20
Table 4.1: Affect of Incentive Factor on Provider Payments ....................................................... 22
Table 4.2: Gatekeeper Physicians’ Cost Breakdown .................................................................... 24
Table 4.3: Changes in the Revenue of Gatekeeper Physician 1 ................................................... 25
Table 4.4: Changes in the Revenue of Gatekeeper Physician 2 ................................................... 25
Table 4.5: Direct Supplier Physicians’ Cost Breakdown .............................................................. 27
Table 4.6: Changes in Revenue of Direct Supplier Physician 1 ................................................... 27
Table 4.7: Changes in Revenue of Direct Supplier Physician 2 ................................................... 27
Table 4.8: Incentives for Physicians by Incentive factor .............................................................. 29
Table 5.1: Physician Score Distributions for Four Weighting Schemes for ETG ........................ 31
Table 5.2: Physician Score Distributions for Four Weighting Schemes for MEG ....................... 31
Table 5.3: Changes in Physician Score Categories with Weighting Scheme Changes for ETG .. 33
Table 5.4: Changes in Physician Score Categories with Weighting Scheme Changes for MEG . 33
Table A.1: Cross-Tabulation for ETG, Frequency-weighted vs. Expected-cost-per-episode
weighting Scores ......................................................................................................... 41
Table A.2: Cross-Tabulation for ETG, Frequency-weighted vs. Expected-total-cost-weighted
Scores .......................................................................................................................... 41
Table A.3: Cross-Tabulation for ETG, Frequency-weighted vs. Total-cost-weighted Scores ..... 42
Table A.4: Cross-Tabulation for MEG, Frequency-Weighted vs. Cost-Weighted Scores ........... 42
Table A.5: Cross-Tabulation for MEG, Frequency-weighted vs. Expected-total-cost-weighted
Scores .......................................................................................................................... 43
Table A.6: Cross-Tabulation for MEG, Frequency-weighted vs. Total-cost-weighted Scores .... 43
Table B.7: Direct Supplier Physician 1’s Original Cost Breakdown ............................................ 44
Table B.8: Direct Supplier Physician 1’s Subsequent Cost Breakdown ...................................... 44
Acumen, LLC Optimal Pay-for-Performance Scores 1
1 INTRODUCTION
Medicare pay-for-performance (P4P) seeks to avoid unnecessary costs while still holding
quality constant. A physician’s efficiency score, which reflects his resource-use level relative to
that of his peers, would determine the value of his reward or penalty. However, for the P4P
system to be effective in cutting Medicare waste, the efficiency-scoring system must create
incentives for providers to alter their behavior in a manner that reduces Medicare’s overall costs.
Although research on small groups of physicians suggests that financially rewarding doctors
based on their relative performance levels leads to some positive changes in physician behavior,
there is little conclusive research on the impact of physician efficiency ratings, particularly on
the Medicare physician population.1,2,3
To create an incentive structure that maximizes provider efficiency, this analysis relies on
episodes of care, created by commercial grouping software, as the basis of physician scores.
Using these episodes of care, this report creates a single ―composite score‖ of relative efficiency
for each provider. While the calculation of the composite efficiency score is theoretically
straightforward, there exist multiple calculation methodologies involving different weighting
schemes. Policymakers must then choose an ―incentive factor‖ to control the strength of the
financial incentive for the physician to improve efficiency. Together, these elements determine
the degree to which the physician’s past cost-efficiency track record will affect his future
payment rates.
This paper explores and evaluates a variety of physician scoring schemes based on the
goal of improving physician cost efficiency. The remainder of this report contains five chapters.
Section 2 provides information on the construction of episodes and condition-efficiency scores.
Section 3 investigates four methods for weighting these condition scores to create a single
composite measure and explores the incentives provided to physicians under each of the four
weighting schemes. Section 4 details the tradeoffs that physicians face between improving
1 Richard Winickoff, Kathy Coltin, Mary Morgan, Robert Buxbaum, and G. Octo Barnett. ―Improving Physician
Performance through Peer Comparison Feedback,‖ Medical Care 22, no. 6 (1984). 2 Andrew E. Balas, Suzanne Boren, Gordon Brown, Bernard Ewigman, Joyce Mitchell, and Gerald Perkoff. 1996.
―Effect of Physician Profiling on Utilization: Meta-analysis of Randomized Clinical Trials.‖ Journal of General
Internal Medicine 11, no. 10 (1996). 3 Paul St. Jacques, Nimesh Patel, and Michael Higgins. ―Improving Anesthesiologist Performance through Profiling
and Incentives.‖ Journal of Clinical Anesthesia 16 (2004): 523-528.
2 Introduction Acumen, LLC
efficiency and maximizing revenue. Section 5 provides empirical applications of scoring to
actual Medicare providers. Lastly, Section 6 presents our conclusions.
Acumen, LLC Optimal Pay-for-Performance Scores 3
2 CONSTRUCTING EPISODES AND CONDITION SCORES
Before creating a physician efficiency program, one must choose a basis for comparison
that fairly represents the cost factors under physicians’ control. This analysis bases physician
scores on episodes created by commercial grouping software to ensure physicians are not
penalized for factors beyond their power – such as illness severity and prior patient health
conditions – that affect episode costs. Episodes, in theory, encompass all care and costs related
to an illness or health condition. Once episode costs have been risk adjusted, all cost difference
should be due to physician choice. Section 2.1 further elaborates on the rationale behind using
grouping software to create episodes of care.
Once episodes have been established as the unit of observation, creating composite
physician efficiency scores from claims data requires four steps. The first step assigns the
episodes of care – and their corresponding cost – to providers. In the second step, policymakers
must make important decisions regarding the peer groups that physicians are compared against,
as well as whether physicians should be scored as individual doctors or as practice groups. As
the third step, one must determine a method for calculating efficiency scores for individual
conditions that the physician treats. Sections 2.2 through 2.4 discuss each of these three steps in
turn. The fourth and final step toward creating physician efficiency scores is aggregating these
condition scores into a single composite score. This final step is discussed in great detail in the
subsequent chapter.
2.1 Using Episodes as the Basis for Physician Scores
Valid physician efficiency scores should measure factors over which providers have
control. Therefore, the chosen scoring mechanism should not penalize physicians simply for
treating conditions that are, on average, more expensive to treat. If this were the case, physicians
who are actually highly efficient in treating serious conditions would have incentives to stop
treating those illnesses. Likewise, a scoring system should not penalize doctors who treat a high
volume of patients but are low-cost on a per-patient basis. Further, even after one controls for
physician case type and case load, a scoring mechanism must take into account the fact that
sicker patients typically require more resources.
In hopes of accomplishing this goal, this analysis uses episodes of care as the basic unit
of analysis in developing efficiency scores. Episodes of care capture costs related to a given
4 Constructing Episodes and Condition Scores Acumen, LLC
illness or acute health condition. Using episodes as the unit of analysis allows one to control for
the fact that some physicians treat more costly conditions. An episode-based approach to
constructing a composite score also makes it possible to provide physicians with information on
their efficiency levels for specific episode types. Further detail on how groupers construct these
episodes follows in the subsequent sections.
2.2 Creating Episodes and Attributing Episode Costs to Physicians
Building episodes of care requires using commercial episode groupers to arrange raw
Medicare claims into episodes. Episode-grouping technology assigns claims to episodes
representing courses of treatment for specific illnesses. Once the groupers create episodes, the
costs associated with the claims in the episodes a physician treats can be used to assess his
efficiency level. In developing efficiency scores, this report uses Medicare episodes from two
prominent commercial groupers: Ingenix’s Symmetry Episode Treatment Groups (ETG) and
Thomson Reuters’ Medstat Medical Episode Grouper (MEG). Both groupers build episodes by
relying primarily on diagnoses to aggregate claims to episodes, and ―close‖ episodes only when a
sufficient period of time (a ―clean period‖) passes with no claims related to the illness. MaCurdy
et al. (2008a) provide detailed information on how the ETG and MEG groupers construct
episodes of care.4 According to MaCurdy et al. (2010b), both groupers assign about 95% of raw
claims costs into episodes.
After the groupers have allocated claims to episodes, one must assign costs to those
episodes. An episode’s cost is equal to the aggregate cost of the claims assigned to the episode.
For ETG, which can assign an institutional claim to more than one episode, this report allocates
the claim’s cost to the episode assigned the plurality of the claim's service-level input records. In
the case of a tie, this report distributes the parent-claim cost equally among episodes tied with the
highest assignments. The MEG grouper, on the other hand, matches each claim to one episode.
Thus, the costs of the episode’s claims are simply summed for MEG. Keeping in mind that
4 For the ETG grouper (version 7.0.1), this analysis considers 679 episode types. Each episode type corresponds to a
base episode type (condition) and, in cases where ETG further separates the base type into up to four severity levels,
a severity level. When creating episodes, Thomson Reuters’ Medstat MEG grouper (version 7.1) assigns each
episode to one of 560 base disease classifications. In addition, MEG can allot up to four ―disease stages‖ to a base
disease classification. Unlike ETG, subdividing base MEGs by their disease stages would create thousands of
classifications. To maintain a like comparison between MEGs and ETGs in terms of the number of episode types,
this analysis uses only base disease classifications for MEG episode types.
Acumen, LLC Optimal Pay-for-Performance Scores 5
scores should only reflect costs that are within physicians’ control, episode costs are risk-
adjusted using the model reported in MaCurdy et al. (2010a). This risk adjustment controls for
the influence of patient age/gender and patient health conditions for each episode type.5
The next step to scoring physician efficiency is attributing episodes to providers. This
report attributes each episode to the provider with the highest total Part B (PB) payments. If only
one provider is listed on the PB claims in an episode, he is attributed the episode. If there are no
positive costs on PB claims assigned to an episode, then the episode is not attributed to a
physician. In the case where the payments from PB claims to two or more providers are equal,
breaking the tie between the physicians requires attributing the episode to the provider with the
highest costs from Evaluation and Management (E&M) claims. MaCurdy et al. (2010b) show
that for both groupers, this attribution rule assigns about 70% of Medicare episodes and
approximately 80% of associated episode costs to physicians.
2.3 Considerations in Designing a Physician Scoring System
In creating efficiency scores for physicians, the exact methodological specifications often
greatly affect how physicians are evaluated. This section examines three important dimensions
to consider when constructing condition scores. First, Section 2.3.1 explains that a score may
either reflect a physician’s efficiency level relative to others in his peer group, or show a
physician’s absolute efficiency. If physicians are scored on a relative basis, meaningful
physician-comparison groups must be specified. Section 2.3.2 discusses the advantages and
disadvantages of scoring physicians across specialties rather than within specialties. Finally,
Section 2.3.3 describes the choice between evaluating physicians as individuals or at the
practice-group level. Based on the analysis in the subsequent sections, the analysis going
forward compares each provider (based on Tax ID number) against a minimum of ten peers in
the same specialty.
2.3.1 Using Absolute vs. Relative Physician Scores
One consideration in designing a scoring mechanism is deciding whether scores will be
based on absolute or relative resource use. Absolute scores are evaluated or benchmarked
5 To measure health conditions, the risk adjustment uses patients’ CMS HCC risk scores, which are used to calculate
the premiums paid in Medicare’s managed care systems.
6 Constructing Episodes and Condition Scores Acumen, LLC
against some absolute standard of efficiency, rather than a measure relative to other physicians in
a peer group. Absolute scores can detect cases where all physicians in a peer group are efficient
or inefficient, whereas relative scores cannot. However, a difficulty in using absolute scores
arises in establishing an absolute standard of ―efficiency.‖ This can be a challenging task as
gathering the data to calculate such a standard would be time-consuming and costly. This task is
further complicated by changing standards over time.
This report chooses to measure a physician’s resource use with a relative score, which
reflects a physician’s efficiency compared to other physicians in his peer group. A score that
illustrates a physician’s resource use benchmarked against the average spending in his peer
group is one example of a relative score. An advantage of relative scores is that they are easy to
compute; one only needs to know the distribution of episode costs attributed to all physicians in a
given peer group. Furthermore, many studies6,7,8
suggest that comparing physicians to their
peers motivates physicians to modify their behavior.
2.3.2 Scoring Physicians Across vs. Within Specialty
When using relative scores, one must choose whether to compare a provider solely
against physicians within his specialty or against all physicians. Comparing physicians across
specialties implies that if one specialty is more efficient than another at treating a condition, the
scoring mechanism would recognize this efficiency difference and encourage physicians in the
less expensive specialty to treat that disease. On the other hand, different specialties may treat
very different types of cases within an episode type. In other words, some episode types contain
episodes only involving physical therapy, tests, or office visits, but other episodes also include
emergency or hospital care. These two classes of episodes within a single condition likely
represent different underlying events. MaCurdy et al. (2010a and 2010c) find numerous
examples of this heterogeneous resource use within episode types. Because some specialties
may be more likely to encounter patients requiring only x-rays, while other specialties are more
likely to encounter patients requiring hospitalization, comparing physicians within a specialty
group mitigates some of this cost heterogeneity. A within-specialty scoring system would mean
6 Winickoff et al. 1984 7 Balas et al. 1996 8 St. Jacques et al. 2004
Acumen, LLC Optimal Pay-for-Performance Scores 7
that a physician could receive one composite score per specialty if he practices in multiple
specialties.
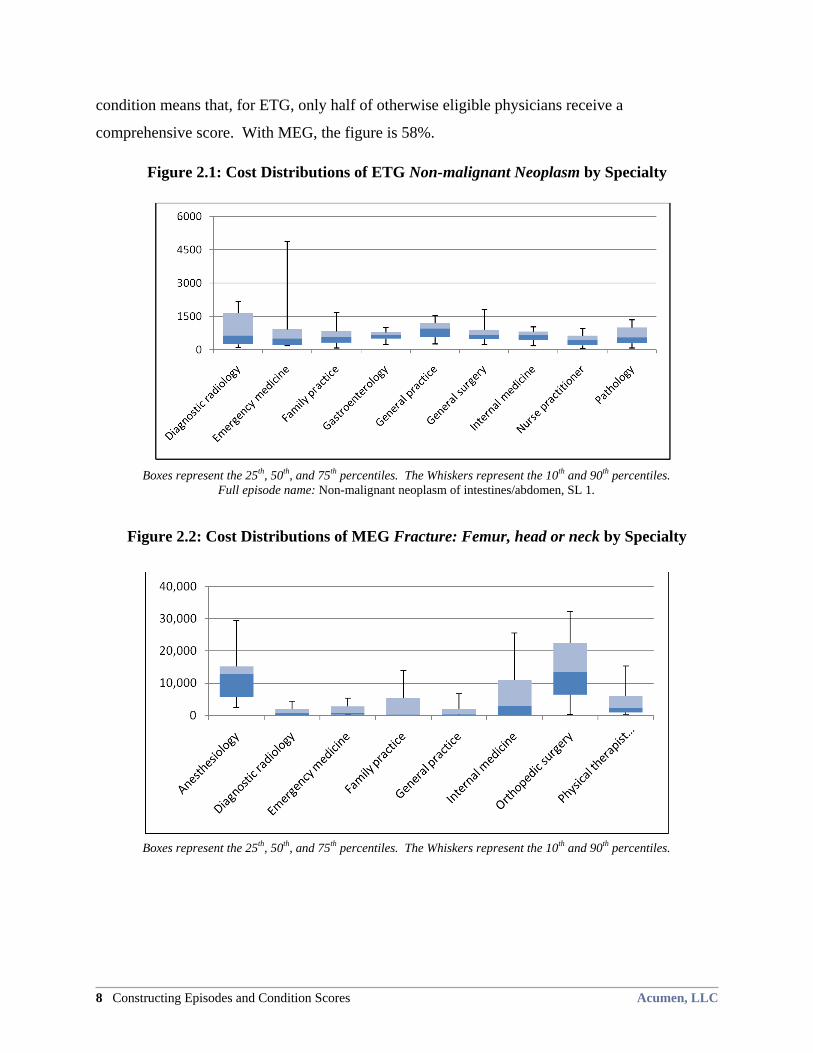
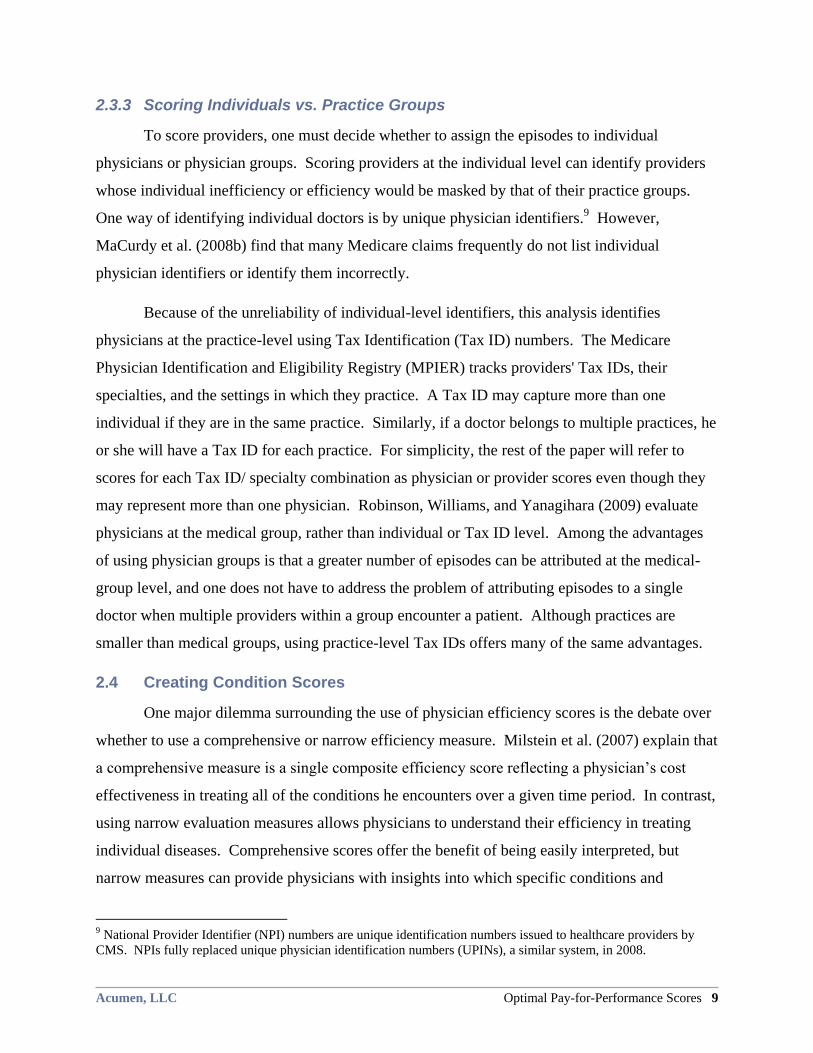
Examining the cost distributions across specialties for episode types provides greater
insight into how using within-specialty or across-specialty peer group comparisons would affect
provider efficiency scores. For instance, the ETG episode type Non-malignant neoplasm of
intestines & abdomen, Severity Level 1 (SL1) is one example where scoring physicians across
specialties would be feasible. As shown in Figure 2.1, all of the nine specialties of physicians
treating this episode type have medians between $450 and $950, and the cost at the 75th
percentile is under $1,000 for six of the specialties. The MEG episode type Fracture: Femur,
head or neck, on the other hand, presents a scenario where scoring within specialties would be
necessary. Figure 2.2 shows that providers with the specialties of anesthesiology and orthopedic
surgery have much higher costs than physicians in the other six specialties. If these differences
are due to variation in physician efficiency, then scoring across specialties would still create an
accurate portrayal of relative efficiency. However, as described above, MaCurdy et al. (2010a)
find the presence of heterogeneous episodes costs episodes within this episode type. If
physicians were scored across specialties for hip fractures, nearly all anesthesiologists and
orthopedic surgeons would be inefficient compared to family practice physicians, even though
their cost differences are likely due to treating different underlying medical events. With the
refinement of groupers in the future, scoring across specialties may become an option. However,
given groupers’ current capabilities, scoring physicians across specialties based on episodes
would be inaccurate.
Acknowledging the existence of heterogeneous cost distributions across specialties, this
report scores physicians within specialty-based peer groups. In constructing condition scores,
the analysis imposes the restriction that there be ten physicians of a specialty treating a given
episode type to ensure that peer groups contain an adequate number of physicians for meaningful
scoring. This report does not impose a limitation on the number of episodes of a given type that
a physician must be attributed before receiving a score for that episode type. Although imposing
an episode minimum decreases score volatility, it also substantially decreases the number of
physicians receiving composite scores. For the sample of 2003 Oregon Medicare episodes,
adding the requirement that a physician have ten episodes of a type before being scored for that
8 Constructing Episodes and Condition Scores Acumen, LLC
condition means that, for ETG, only half of otherwise eligible physicians receive a
comprehensive score. With MEG, the figure is 58%.
Figure 2.1: Cost Distributions of ETG Non-malignant Neoplasm by Specialty
Boxes represent the 25
th, 50
th, and 75
th percentiles. The Whiskers represent the 10
th and 90
th percentiles.
Full episode name: Non-malignant neoplasm of intestines/abdomen, SL 1.
Figure 2.2: Cost Distributions of MEG Fracture: Femur, head or neck by Specialty
Boxes represent the 25
th, 50
th, and 75
th percentiles. The Whiskers represent the 10
th and 90
th percentiles.
Acumen, LLC Optimal Pay-for-Performance Scores 9
2.3.3 Scoring Individuals vs. Practice Groups
To score providers, one must decide whether to assign the episodes to individual
physicians or physician groups. Scoring providers at the individual level can identify providers
whose individual inefficiency or efficiency would be masked by that of their practice groups.
One way of identifying individual doctors is by unique physician identifiers.9 However,
MaCurdy et al. (2008b) find that many Medicare claims frequently do not list individual
physician identifiers or identify them incorrectly.
Because of the unreliability of individual-level identifiers, this analysis identifies
physicians at the practice-level using Tax Identification (Tax ID) numbers. The Medicare
Physician Identification and Eligibility Registry (MPIER) tracks providers' Tax IDs, their
specialties, and the settings in which they practice. A Tax ID may capture more than one
individual if they are in the same practice. Similarly, if a doctor belongs to multiple practices, he
or she will have a Tax ID for each practice. For simplicity, the rest of the paper will refer to
scores for each Tax ID/ specialty combination as physician or provider scores even though they
may represent more than one physician. Robinson, Williams, and Yanagihara (2009) evaluate
physicians at the medical group, rather than individual or Tax ID level. Among the advantages
of using physician groups is that a greater number of episodes can be attributed at the medical-
group level, and one does not have to address the problem of attributing episodes to a single
doctor when multiple providers within a group encounter a patient. Although practices are
smaller than medical groups, using practice-level Tax IDs offers many of the same advantages.
2.4 Creating Condition Scores
One major dilemma surrounding the use of physician efficiency scores is the debate over
whether to use a comprehensive or narrow efficiency measure. Milstein et al. (2007) explain that
a comprehensive measure is a single composite efficiency score reflecting a physician’s cost
effectiveness in treating all of the conditions he encounters over a given time period. In contrast,
using narrow evaluation measures allows physicians to understand their efficiency in treating
individual diseases. Comprehensive scores offer the benefit of being easily interpreted, but
narrow measures can provide physicians with insights into which specific conditions and
9 National Provider Identifier (NPI) numbers are unique identification numbers issued to healthcare providers by
CMS. NPIs fully replaced unique physician identification numbers (UPINs), a similar system, in 2008.
10 Constructing Episodes and Condition Scores Acumen, LLC
treatments should be targeted for cost-cutting. Even though narrow measures provide far more
valuable information to the physician, it is not always possible to pay physicians based on
condition measures. For instance, in any episode-based P4P system, the condition a claim
belongs to may depend on subsequent health events. Distinguishing prospective reimbursement
for each narrow measure would thus be infeasible. To focus on a P4P system that Medicare can
operationalize, this paper explores the physician incentives created by various comprehensive
scoring systems.
In calculating composite scores by aggregating condition measures, however, a system
can reap the benefits of both comprehensive and narrow scores. Condition scores can be
reported in conjunction with the composite measure to provide physicians with the information
necessary to focus their efforts on improving the efficiency of treating specific diseases. In this
analysis, condition scores are constructed based on a physician’s relative scores evaluated within
specialty. A condition score describes how efficient a physician is in treating a given episode
type relative to other physicians in his specialty also attributed that episode type.
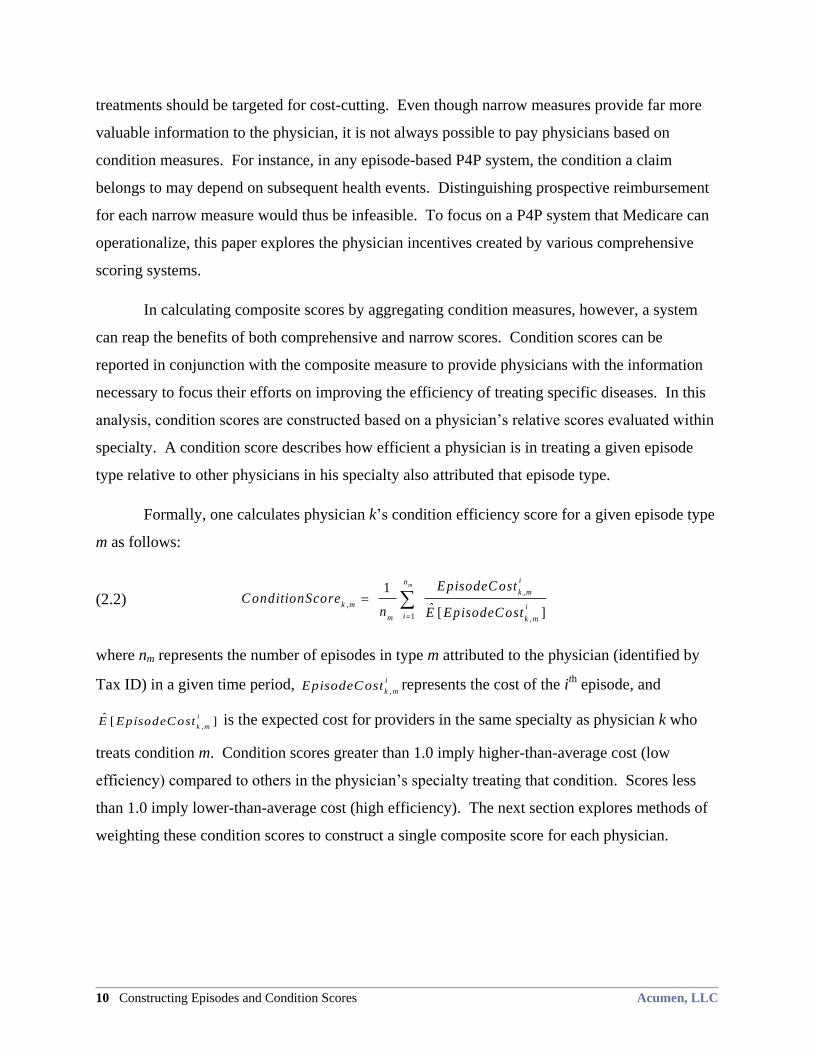
Formally, one calculates physician k’s condition efficiency score for a given episode type
m as follows:
,
,
1 ,
1
ˆ [ ]
min
k m
k m i
im k m
EpisodeC ostC onditionScore
n E EpisodeC ost
where nm represents the number of episodes in type m attributed to the physician (identified by
Tax ID) in a given time period, ,
i
k mEpisodeCost represents the cost of the i
th episode, and
,ˆ [ ]
i
k mE EpisodeC ost is the expected cost for providers in the same specialty as physician k who
treats condition m. Condition scores greater than 1.0 imply higher-than-average cost (low
efficiency) compared to others in the physician’s specialty treating that condition. Scores less
than 1.0 imply lower-than-average cost (high efficiency). The next section explores methods of
weighting these condition scores to construct a single composite score for each physician.
(2.2)
Acumen, LLC Optimal Pay-for-Performance Scores 11
3 WEIGHTING SCHEMES FOR COMPOSITE PHYSICIAN SCORES
Although condition scores are useful for describing physician efficiency, Medicare must
use composite scores to translate physician performance into payment. Implementing condition
scores would be impractical. Medicare pays physicians on a per-claim basis and, at the time of
payment, it is difficult to determine what type of episode a claim belongs to. A composite score
based on a physician’s condition scores provides a simpler route to adjusting physician
reimbursement. Sections 3.1 through 3.4 describe four methods for creating composite physician
efficiency scores by aggregating condition measures according to different weighting schemes.
Section 3.5 compares the incentives for physicians under each of the four schemes.
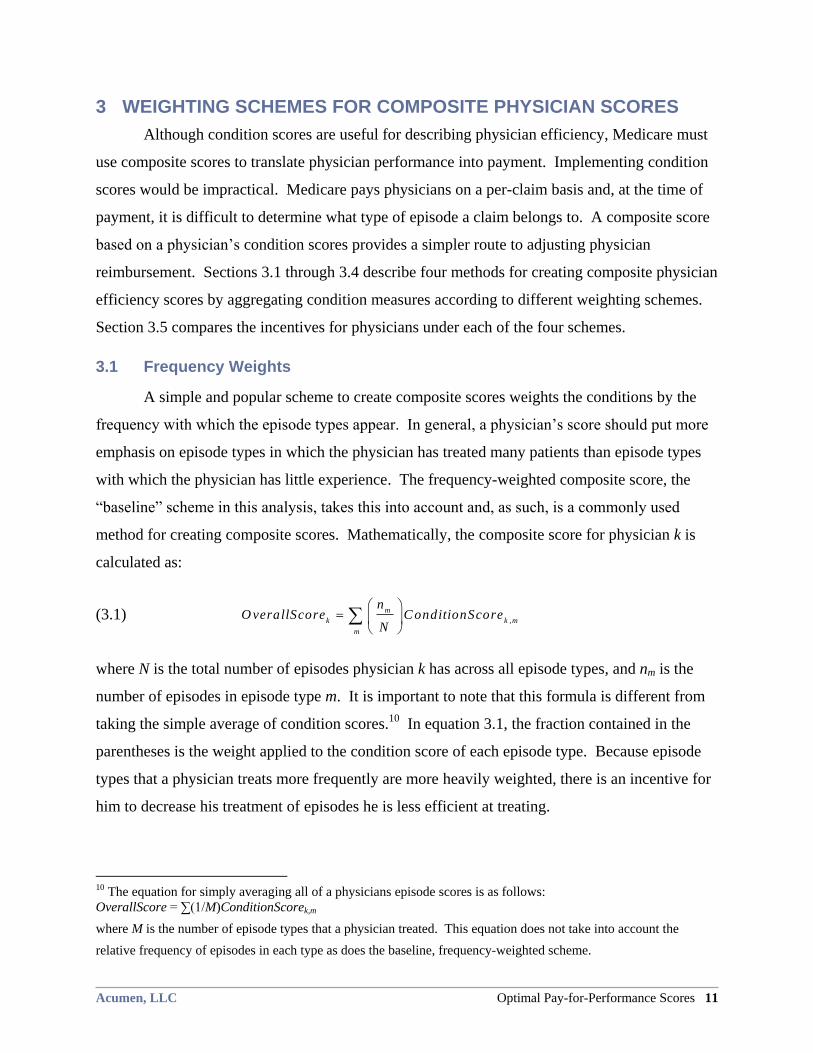
3.1 Frequency Weights
A simple and popular scheme to create composite scores weights the conditions by the
frequency with which the episode types appear. In general, a physician’s score should put more
emphasis on episode types in which the physician has treated many patients than episode types
with which the physician has little experience. The frequency-weighted composite score, the
―baseline‖ scheme in this analysis, takes this into account and, as such, is a commonly used
method for creating composite scores. Mathematically, the composite score for physician k is
calculated as:
(3.1) ,
m
k k m
m
nO verallScore C onditionScore
N
where N is the total number of episodes physician k has across all episode types, and nm is the
number of episodes in episode type m. It is important to note that this formula is different from
taking the simple average of condition scores.10
In equation 3.1, the fraction contained in the
parentheses is the weight applied to the condition score of each episode type. Because episode
types that a physician treats more frequently are more heavily weighted, there is an incentive for
him to decrease his treatment of episodes he is less efficient at treating.
10 The equation for simply averaging all of a physicians episode scores is as follows:
OverallScore = ∑(1/M)ConditionScorek,m
where M is the number of episode types that a physician treated. This equation does not take into account the
relative frequency of episodes in each type as does the baseline, frequency-weighted scheme.
12 Weighting Schemes for Composite Physician Scores Acumen, LLC
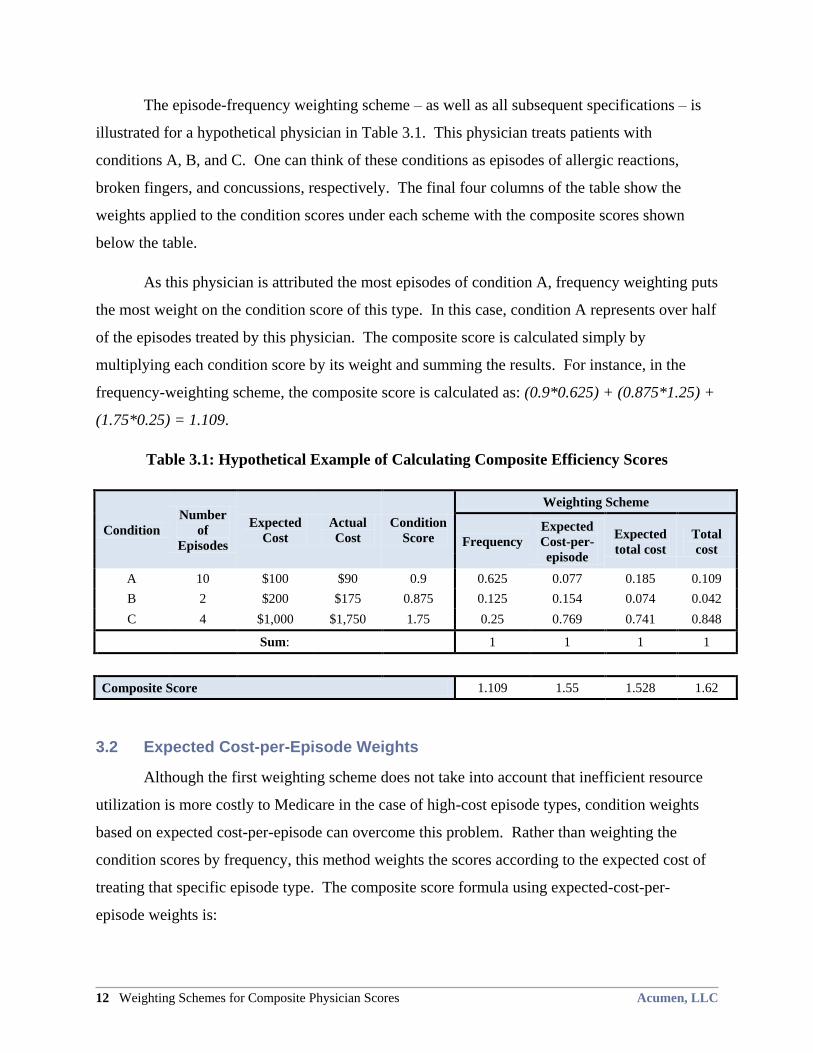
The episode-frequency weighting scheme – as well as all subsequent specifications – is
illustrated for a hypothetical physician in Table 3.1. This physician treats patients with
conditions A, B, and C. One can think of these conditions as episodes of allergic reactions,
broken fingers, and concussions, respectively. The final four columns of the table show the
weights applied to the condition scores under each scheme with the composite scores shown
below the table.
As this physician is attributed the most episodes of condition A, frequency weighting puts
the most weight on the condition score of this type. In this case, condition A represents over half
of the episodes treated by this physician. The composite score is calculated simply by
multiplying each condition score by its weight and summing the results. For instance, in the
frequency-weighting scheme, the composite score is calculated as: (0.9*0.625) + (0.875*1.25) +
(1.75*0.25) = 1.109.
Table 3.1: Hypothetical Example of Calculating Composite Efficiency Scores
Condition
Number
of
Episodes
Expected
Cost
Actual
Cost
Condition
Score
Weighting Scheme
Frequency
Expected
Cost-per-
episode
Expected
total cost
Total
cost
A 10 $100 $90 0.9 0.625 0.077 0.185 0.109
B 2 $200 $175 0.875 0.125 0.154 0.074 0.042
C 4 $1,000 $1,750 1.75 0.25 0.769 0.741 0.848
Sum: 1 1 1 1
Composite Score 1.109 1.55 1.528 1.62
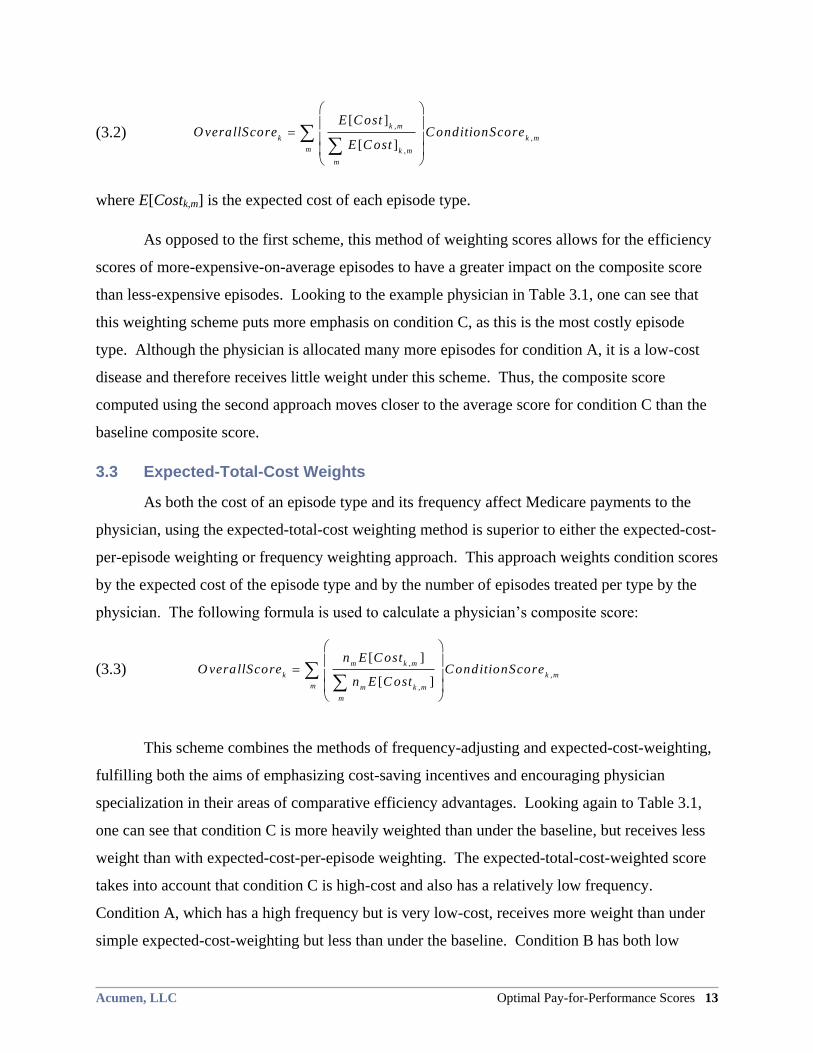
3.2 Expected Cost-per-Episode Weights
Although the first weighting scheme does not take into account that inefficient resource
utilization is more costly to Medicare in the case of high-cost episode types, condition weights
based on expected cost-per-episode can overcome this problem. Rather than weighting the
condition scores by frequency, this method weights the scores according to the expected cost of
treating that specific episode type. The composite score formula using expected-cost-per-
episode weights is:
Acumen, LLC Optimal Pay-for-Performance Scores 13
(3.2) ,
,
,
[ ]
[ ]
k m
k k m
m k m
m
E C ostO verallScore C onditionScore
E C ost
where E[Costk,m] is the expected cost of each episode type.
As opposed to the first scheme, this method of weighting scores allows for the efficiency
scores of more-expensive-on-average episodes to have a greater impact on the composite score
than less-expensive episodes. Looking to the example physician in Table 3.1, one can see that
this weighting scheme puts more emphasis on condition C, as this is the most costly episode
type. Although the physician is allocated many more episodes for condition A, it is a low-cost
disease and therefore receives little weight under this scheme. Thus, the composite score
computed using the second approach moves closer to the average score for condition C than the
baseline composite score.
3.3 Expected-Total-Cost Weights
As both the cost of an episode type and its frequency affect Medicare payments to the
physician, using the expected-total-cost weighting method is superior to either the expected-cost-
per-episode weighting or frequency weighting approach. This approach weights condition scores
by the expected cost of the episode type and by the number of episodes treated per type by the
physician. The following formula is used to calculate a physician’s composite score:
(3.3)
,
,
,
[ ]
[ ]
m k m
k k m
m m k m
m
n E C ostO verallScore C onditionScore
n E C ost
This scheme combines the methods of frequency-adjusting and expected-cost-weighting,
fulfilling both the aims of emphasizing cost-saving incentives and encouraging physician
specialization in their areas of comparative efficiency advantages. Looking again to Table 3.1,
one can see that condition C is more heavily weighted than under the baseline, but receives less
weight than with expected-cost-per-episode weighting. The expected-total-cost-weighted score
takes into account that condition C is high-cost and also has a relatively low frequency.
Condition A, which has a high frequency but is very low-cost, receives more weight than under
simple expected-cost-weighting but less than under the baseline. Condition B has both low
frequency and fairly low cost, and hence receives a lower weight than was the case under both of
the previous weighting specifications. The resulting composite score falls between the
composite scores for the baseline and expected-cost-per-episode weighting schemes.
3.4 Total-Cost Weights
14 Weighting Schemes for Composite Physician Scores Acumen, LLC
Instead of weighting condition scores by the physician’s expected cost, one could also
weight the scores by the costs directly incurred by the physician. Though this is similar to the
previous weighting scheme, it takes into account the physician’s actual costs as opposed to
expected costs. As actual costs for an episode type get higher, the condition score receives more
weight. Mathematically, the formula is:
(3.4) ,
,
,
k m i
k k m
m k m
m
TotalC ostO verallScore C onditionScore
TotalC ost
The fraction in parentheses is simply the share of the physician’s total cost across all
episode types represented by episode type m. The variable TotalCostk,m represents the total
actual cost that was attributed to physician k in episode type m. For the physician in Table 3.1,
the majority of his actual Medicare costs are in condition C, so his composite score under this
scheme is heavily weighted by that condition score. His actual costs for condition C exceed the
expected costs, so more weight is placed there under this scheme than under the expected-total-
cost scheme. Although condition A occurs much more frequently, its actual cost is very low, so
it receives little weight. For this physician, condition B is both inexpensive compared to
condition C and the least-frequently treated condition, so little emphasis is placed on it. As such,
the physician’s composite score moves closer to the condition score of C and farther from those
of conditions A and B.
3.5 Comparing the Four Schemes’ Physician Incentives
In summary, each of the four proposed weighting schemes involves different components
and promotes distinct incentives for physicians. Table 3.2 reviews each of these weighting
methods and the aims they fulfill. The final three schemes – expected-cost-per-episode
weighting, expected-total-cost weighting, and total-cost weighting – all promote the first aim of
targeting a physician’s cost-saving efforts towards high-cost episodes. Conditions that are
Acumen, LLC Optimal Pay-for-Performance Scores 15
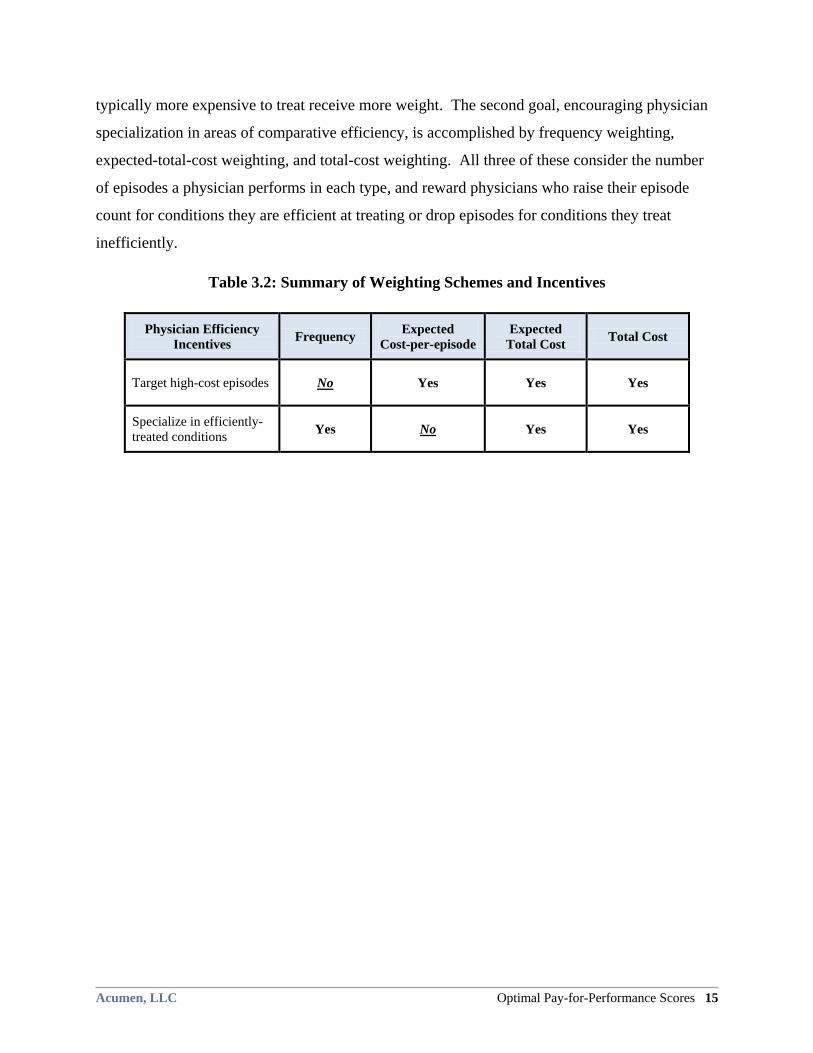
typically more expensive to treat receive more weight. The second goal, encouraging physician
specialization in areas of comparative efficiency, is accomplished by frequency weighting,
expected-total-cost weighting, and total-cost weighting. All three of these consider the number
of episodes a physician performs in each type, and reward physicians who raise their episode
count for conditions they are efficient at treating or drop episodes for conditions they treat
inefficiently.
Table 3.2: Summary of Weighting Schemes and Incentives
Physician Efficiency
Incentives Frequency
Expected
Cost-per-episode
Expected
Total Cost Total Cost
Target high-cost episodes No Yes Yes Yes
Specialize in efficiently-
treated conditions Yes No Yes Yes
16 Physician Tradeoffs Between Efficiency and Revenue Acumen, LLC
4 PHYSICIAN TRADEOFFS BETWEEN EFFICIENCY AND REVENUE
Any efficiency-profiling system should incentivize providers to take the following two
actions: increase their efficiency level for any given condition, and shift their workload to
conditions that they treat more efficiently. For the first action, a P4P program should ideally
incentivize physicians to focus cost-saving efforts on high-cost conditions, as this will save
Medicare the most money. With respect to the second action, Medicare stands to save the most
money if physicians specialize by shifting all of their episodes to the condition they treat most
efficiently. Which strategy, if any, physicians use and which conditions they focus their efforts
on, however, depend on how the efficiency ratings are translated into financial incentives by the
P4P system. Section 4.1 elaborates on the two general strategies physicians can apply to
improve their composite scores. Section 4.2 then introduces a method for translating efficiency
scores in to a payment scheme that incentivizes physicians to apply the two strategies in a way
that creates the most cost savings for Medicare. Sections 4.3 and 4.4 explore the financial
incentives physicians face under this payment plan depending on whether they act as a
―gatekeeper‖ or ―direct supplier.‖ Finally, Section 4.5 describes how to choose an optimal
incentive factor to translate scores into changes in revenue for each physician.
4.1 Two Strategies for Improving Efficiency
To optimize cost savings, CMS should ideally adopt a scoring system that incentivizes
physicians to:
1. Target score-maximizing efforts to the highest cost episodes, and
2. Specialize in the conditions that they treat efficiently.
In addressing the first aim, the system should encourage physicians to actively assess their own
resource utilization for a condition and evaluate whether resource use could realistically be cut,
particularly for treating high-cost conditions. A physician could, for example, perform fewer
tests when diagnosing a patient if the problem is already apparent. He could also refer his clients
to more efficient specialists to keep total episode costs low. Under the second aim, the scoring
system should encourage physicians to change the frequency with which they treat certain
conditions. If a provider uses resources efficiently when treating diabetes, but not pneumonia,
then he should choose to refer his patients with pneumonia to another doctor and focus on
treating diabetic patients. In doing so, he would decrease the share of his episodes that he treats
Acumen, LLC Optimal Pay-for-Performance Scores 17
inefficiently and increase his overall score. For both techniques, this analysis assumes that the
physician always holds the number of episodes he treats constant. The following sections
illustrate the effects of these two changes using the same hypothetical physician from Section 3.
Sections 4.1.1 and 4.1.2 depict how these changes would affect the example physician’s
composite score and impact Medicare expenditures.
4.1.1 Increasing Episode Efficiency
Increasing efficiency within any condition is the most straightforward means for a
physician to better his composite score. By utilizing fewer resources on a per-episode basis, a
physician improves his episode efficiency scores; this in turn leads to an improvement in his
composite score. Using the same example physician from the previous section, Figure 4.1
depicts the changes in his composite score by the weighting scheme that was used to create the
composite score. Recall that the hypothetical physician treats many patients with the low-cost
condition A, very few patients for the moderate-cost condition B, and a moderate amount of
patients for the high-cost condition C. Figure 4.1 displays the effect of a 10% improvement in
efficiency in each of the conditions. Each bar corresponds to improving efficiency in only one
condition. The dollar figure in the legend shows the cost change to Medicare under each
scenario. A positive number indicates an increase in Medicare spending while a negative
number shows the savings to Medicare.
Although an increase in efficiency always yields a more efficient (i.e., lower) composite
score, the magnitude of this increased efficiency depends on the weighting scheme used. As
seen in Figure 4.1, when using the baseline frequency weighting scheme, the largest change in
the physician’s composite score occurs when he improves his condition A efficiency score. This
occurs because condition A is the most frequently treated condition for this doctor and the
baseline method considers only the number of episodes in creating a composite score. The
physician would maximize his bonus in this scenario by focusing on condition A. This is
contrary to the incentives CMS wants to promote, as focusing on condition C would lead to the
greatest cost savings for Medicare.
Under the latter three weighing schemes, improving his condition C score creates the
greatest composite score improvement. The reason for the large composite score change in these
weighting schemes is that condition C has the highest average cost of the conditions and the
18 Physician Tradeoffs Between Efficiency and Revenue Acumen, LLC
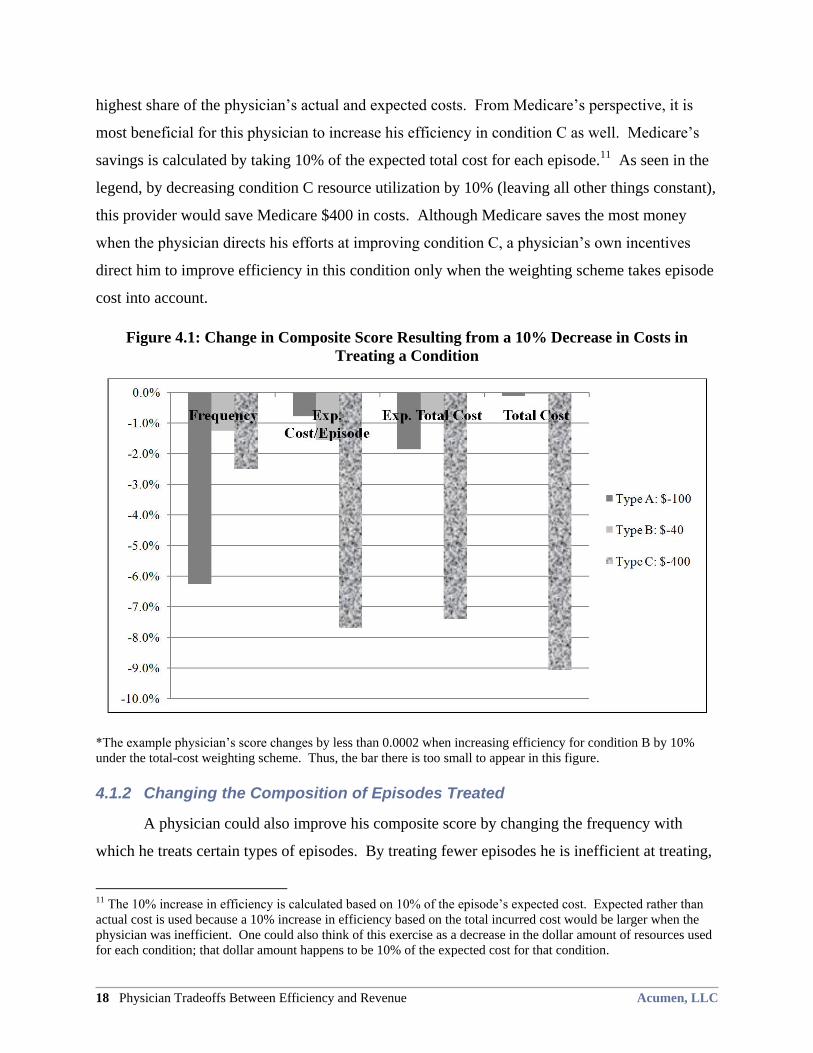
highest share of the physician’s actual and expected costs. From Medicare’s perspective, it is
most beneficial for this physician to increase his efficiency in condition C as well. Medicare’s
savings is calculated by taking 10% of the expected total cost for each episode.11
As seen in the
legend, by decreasing condition C resource utilization by 10% (leaving all other things constant),
this provider would save Medicare $400 in costs. Although Medicare saves the most money
when the physician directs his efforts at improving condition C, a physician’s own incentives
direct him to improve efficiency in this condition only when the weighting scheme takes episode
cost into account.
Figure 4.1: Change in Composite Score Resulting from a 10% Decrease in Costs in
Treating a Condition
*The example physician’s score changes by less than 0.0002 when increasing efficiency for condition B by 10%
under the total-cost weighting scheme. Thus, the bar there is too small to appear in this figure.
4.1.2 Changing the Composition of Episodes Treated
A physician could also improve his composite score by changing the frequency with
which he treats certain types of episodes. By treating fewer episodes he is inefficient at treating,
11 The 10% increase in efficiency is calculated based on 10% of the episode’s expected cost. Expected rather than
actual cost is used because a 10% increase in efficiency based on the total incurred cost would be larger when the
physician was inefficient. One could also think of this exercise as a decrease in the dollar amount of resources used
for each condition; that dollar amount happens to be 10% of the expected cost for that condition.
Acumen, LLC Optimal Pay-for-Performance Scores 19
he can increase his efficiency. A physician could theoretically maximize his score by shifting all
of his episodes to the condition he treats most efficiently. For the example physician, this would
mean treating 16 episodes of condition B. In this scenario, his composite score would shift to
0.875 regardless of which weighting scheme is used as there is only one condition.
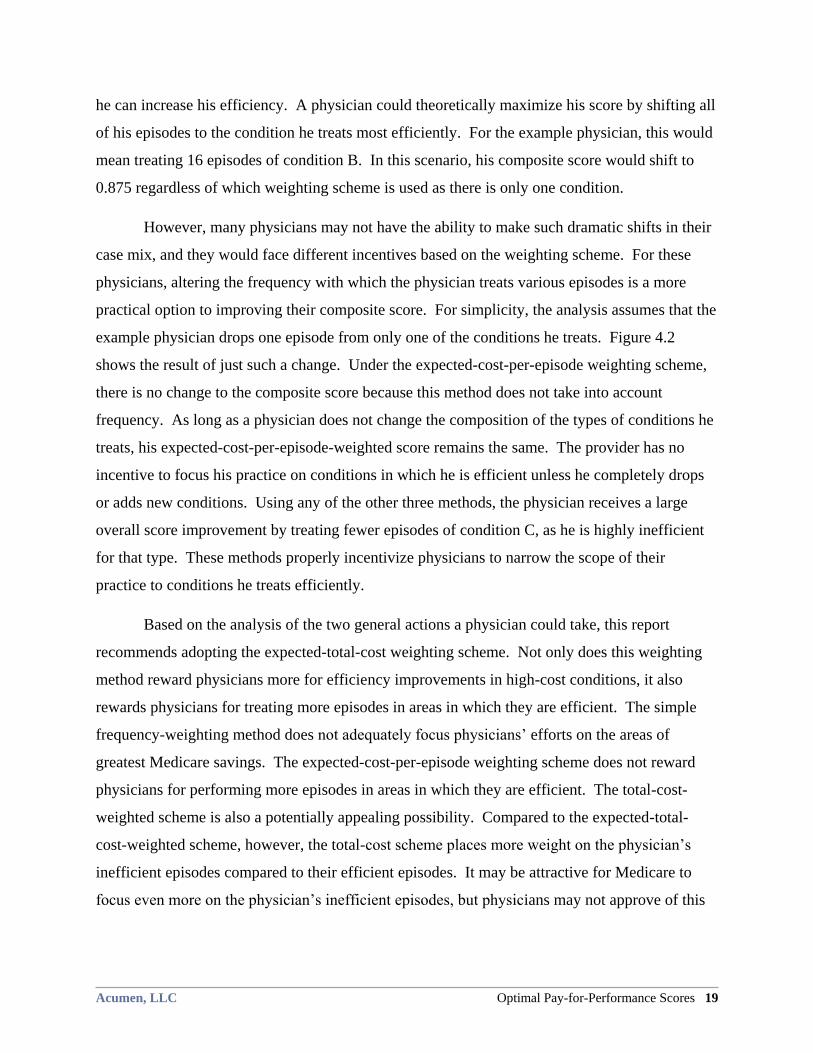
However, many physicians may not have the ability to make such dramatic shifts in their
case mix, and they would face different incentives based on the weighting scheme. For these
physicians, altering the frequency with which the physician treats various episodes is a more
practical option to improving their composite score. For simplicity, the analysis assumes that the
example physician drops one episode from only one of the conditions he treats. Figure 4.2
shows the result of just such a change. Under the expected-cost-per-episode weighting scheme,
there is no change to the composite score because this method does not take into account
frequency. As long as a physician does not change the composition of the types of conditions he
treats, his expected-cost-per-episode-weighted score remains the same. The provider has no
incentive to focus his practice on conditions in which he is efficient unless he completely drops
or adds new conditions. Using any of the other three methods, the physician receives a large
overall score improvement by treating fewer episodes of condition C, as he is highly inefficient
for that type. These methods properly incentivize physicians to narrow the scope of their
practice to conditions he treats efficiently.
Based on the analysis of the two general actions a physician could take, this report
recommends adopting the expected-total-cost weighting scheme. Not only does this weighting
method reward physicians more for efficiency improvements in high-cost conditions, it also
rewards physicians for treating more episodes in areas in which they are efficient. The simple
frequency-weighting method does not adequately focus physicians’ efforts on the areas of
greatest Medicare savings. The expected-cost-per-episode weighting scheme does not reward
physicians for performing more episodes in areas in which they are efficient. The total-cost-
weighted scheme is also a potentially appealing possibility. Compared to the expected-total-
cost-weighted scheme, however, the total-cost scheme places more weight on the physician’s
inefficient episodes compared to their efficient episodes. It may be attractive for Medicare to
focus even more on the physician’s inefficient episodes, but physicians may not approve of this
20 Physician Tradeoffs Between Efficiency and Revenue Acumen, LLC
biased scoring system.12
Thus, this report proposes using the expected-total-cost-weighted
scoring scheme.
Figure 4.2: Change in Composite Score from Dropping One Episode
4.2 Converting Efficiency Scores to a Payment Structure
Based on the scores derived above, Medicare can implement a system of monetary
rewards and penalties to encourage efficiency. In a pure homo economicus framework, Medicare
can only change physician behavior by making it in their financial interest.13
Although the
effectiveness of physician profiling is mixed in reality,14,15
this report focuses exclusively on the
how efficiency scores will affect provider incentives from a strict monetary point of view. In
addition, this report calculates the physician’s incentives to improve efficiency from a pure
12 Assume that a physician was attributed two episodes of two different types. Both have an expected cost of $100.
In the first episode, the cost was $50 and in the second episode, the cost was $150. Total actual costs and total
expected costs are both $200. Under the expected-total-cost weighting scheme, the physician’s composite score is
1.0. However, under the total-cost system, the physician’s score is 1.25. This means that the physician receives an
inefficient score even though his total costs are identical to the total expected episode costs. 13 St. Jacques et al., ―Improving Anesthesiologist Performance through Profiling and Incentives.‖ 14 Winickoff et al., ―Improving Physician Performance through Peer Comparison Feedback.‖ 15 Balas et al., ―Effect of Physician Profiling on Utilization.‖
Acumen, LLC Optimal Pay-for-Performance Scores 21
revenue perspective, ignoring provider costs (i.e., cost to provide medical services and costs to
comply with P4P reporting) as well the psychological or motivational effect of P4P on provider
performance.16
Without sufficient monetary incentives to encourage efficient resource
utilization, the response of inefficient providers to any scoring system will be minor.
To stimulate change in provider behavior, this report translates the composite efficiency
scores into a single payment-adjustment factor. A provider’s future payments depend on the
following specification:
(4.1) PHCPCS(t) =θi(t) * FHCPCS(t)
Here, FHCPCS(t) is the rate according to the physician fee schedule, PHCPCS(t) is the P4P rate
actually paid, and θi(t) is the ―payment adjustment‖ common across all HCPCS codes.
The size of the payment adjustment θi(t) depends on two parameters: the physician’s
composite efficiency score and the incentive factor. One can express this relationship
mathematically using the following formula:
(4.2) θi(t)=1/(1+[Scorei(t)-1]* )
As one can readily observe, higher (i.e., less efficient) scores decrease provider payments. The
larger the incentive factor (), the more the composite score will influence payment. For
instance, efficient providers will receive much larger bonuses and inefficient providers will
receive much larger penalties when incentive factors are large than when incentive factors are
small.
To better explain how the incentive factor () allows the physician composite scores to
affect future payments, consider the case where a physician uses 20% more resources than the
average physician. In this example, the inefficient physician will have a score of 1.2. Table 4.1
shows how illustrative incentive factors affect the ultimate payment adjustment (θ). For instance,
when there is an incentive factor of 50%, every one of the physician’s future payments from
Medicare would be divided by 1.1. This would result in a payment decrease of about 9%, as
16 For instance, Berwick 1995 claims that P4P schemes disrupt provider incentives for collaboration and improved
teamwork.
22 Physician Tradeoffs Between Efficiency and Revenue Acumen, LLC
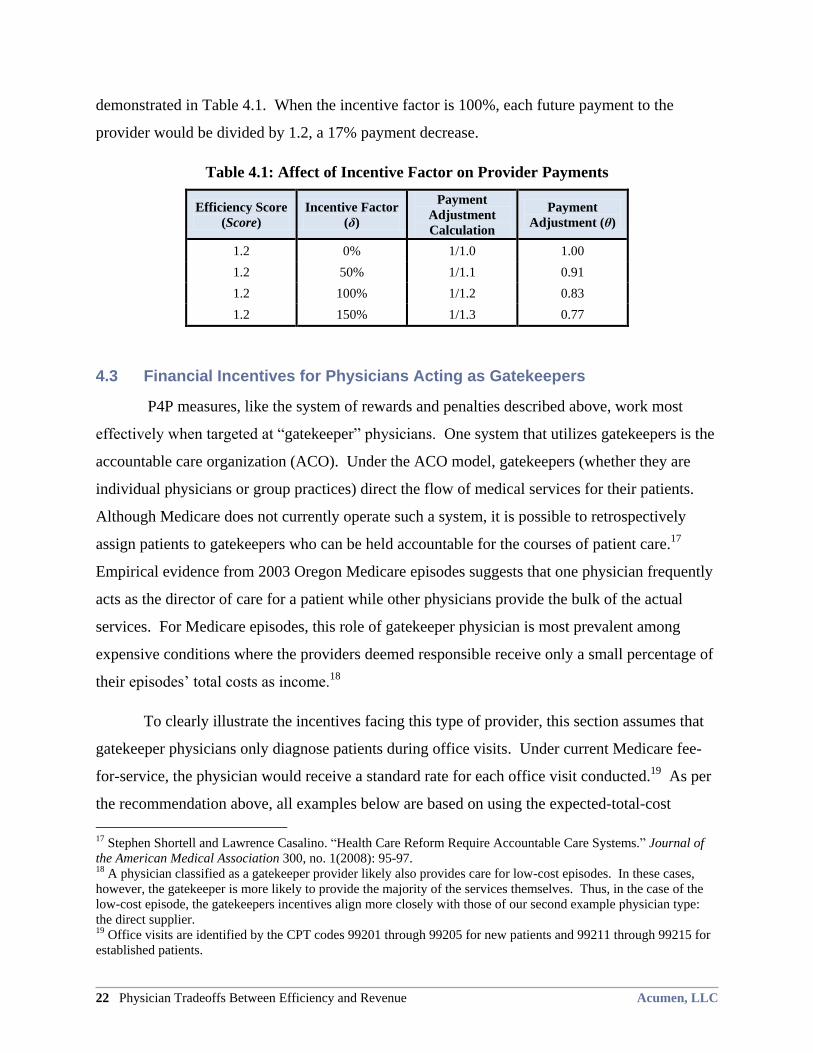
demonstrated in Table 4.1. When the incentive factor is 100%, each future payment to the
provider would be divided by 1.2, a 17% payment decrease.
Table 4.1: Affect of Incentive Factor on Provider Payments
Efficiency Score
(Score)
Incentive Factor
(δ)
Payment
Adjustment
Calculation
Payment
Adjustment (θ)
1.2 0% 1/1.0 1.00
1.2 50% 1/1.1 0.91
1.2 100% 1/1.2 0.83
1.2 150% 1/1.3 0.77
4.3 Financial Incentives for Physicians Acting as Gatekeepers
P4P measures, like the system of rewards and penalties described above, work most
effectively when targeted at ―gatekeeper‖ physicians. One system that utilizes gatekeepers is the
accountable care organization (ACO). Under the ACO model, gatekeepers (whether they are
individual physicians or group practices) direct the flow of medical services for their patients.
Although Medicare does not currently operate such a system, it is possible to retrospectively
assign patients to gatekeepers who can be held accountable for the courses of patient care.17
Empirical evidence from 2003 Oregon Medicare episodes suggests that one physician frequently
acts as the director of care for a patient while other physicians provide the bulk of the actual
services. For Medicare episodes, this role of gatekeeper physician is most prevalent among
expensive conditions where the providers deemed responsible receive only a small percentage of
their episodes’ total costs as income.18
To clearly illustrate the incentives facing this type of provider, this section assumes that
gatekeeper physicians only diagnose patients during office visits. Under current Medicare fee-
for-service, the physician would receive a standard rate for each office visit conducted.19
As per
the recommendation above, all examples below are based on using the expected-total-cost
17 Stephen Shortell and Lawrence Casalino. ―Health Care Reform Require Accountable Care Systems.‖ Journal of
the American Medical Association 300, no. 1(2008): 95-97. 18 A physician classified as a gatekeeper provider likely also provides care for low-cost episodes. In these cases,
however, the gatekeeper is more likely to provide the majority of the services themselves. Thus, in the case of the
low-cost episode, the gatekeepers incentives align more closely with those of our second example physician type:
the direct supplier. 19 Office visits are identified by the CPT codes 99201 through 99205 for new patients and 99211 through 99215 for
established patients.
Acumen, LLC Optimal Pay-for-Performance Scores 23
weighting scheme.20
Sections 4.3.1 and 4.3.2 return to our example physician from Section 3
and also include a second example physician with different condition scores. These sections
illustrate how the two hypothetical physicians’ revenues change when they increase efficiency in
one condition by 10% and when they shift the composition of episodes they treat21
.
4.3.1 Increasing Efficiency in One Condition
When acting as a gatekeeper, physicians face incentives to maximize their composite
efficiency score. Returning to our simple example from Section 3, Table 4.2 shows the same
example physician (Physician 1) and an additional example, Physician 2, whose condition
efficiency scores differ from those of Physician 1. The table includes columns showing average
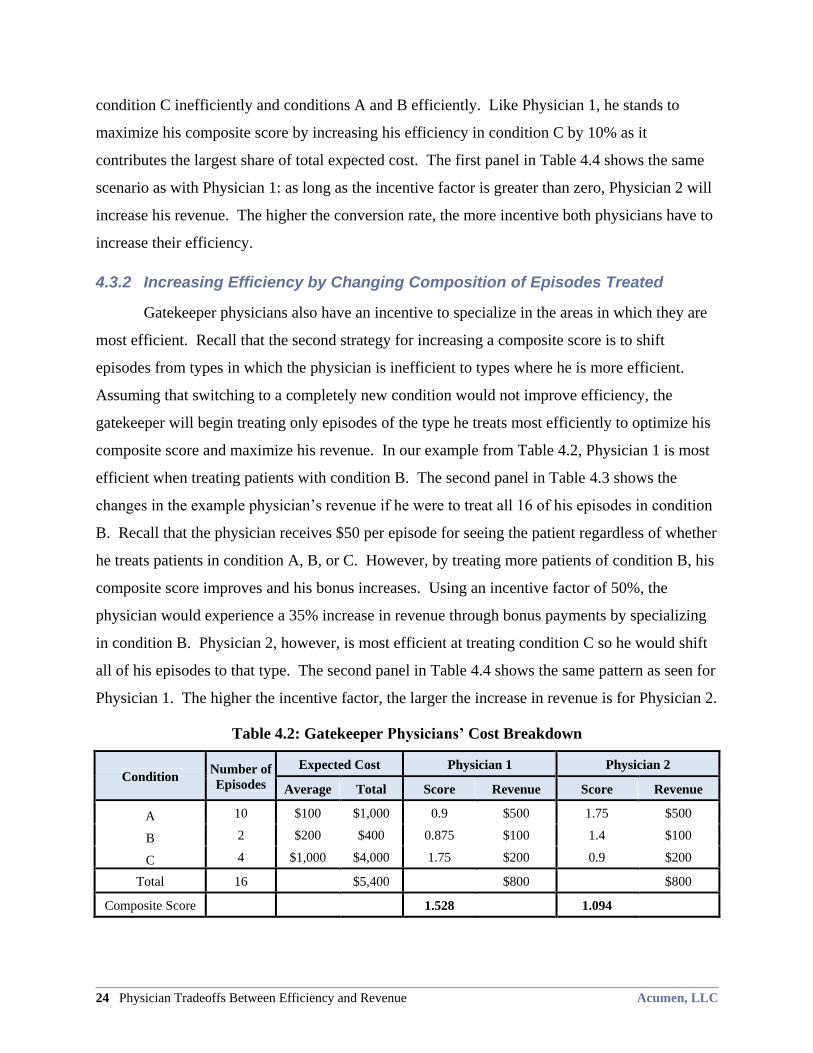
and total expected costs and each physician’s score and revenue. Both physicians earn a
standard fee of $50 for each episode they treat regardless of the condition. Because the
physicians each treat ten episodes of condition A, they each receive $500 in total revenue from
these episodes. The reader can think of the standard fee as the basic payment for an office visit.
The remainder of the episode cost will be incurred when the patient undergoes diagnostic tests or
receives treatment from other physicians.
To maximize his revenue, the gatekeeper will attempt to decrease resource utilization.
For this example, assume the physician can increase one of his condition efficiency scores by
10%. The analysis first focuses on Physician 1, who is efficient at treating condition A and B,
but inefficiently treats condition C. Holding the composition of episodes that he treats constant,
Physician 1 would maximize his revenue by targeting the efficiency increase on condition C
because it comprises the largest portion of his expected cost and thus will have the greatest effect
on his composite score. The first panel in Table 4.3 presents the changes in the example
physician’s revenue if he were to improve his condition C score by 10%. As long as the
incentive factor is greater than 0%, the physician will see an increase in his revenue. The larger
the incentive factor, the higher the monetary incentive for this physician to increase his score.
Moving to Physician 2, Table 4.2 shows that he is inefficient at treating conditions A and
B and efficient at treating condition C. This is in sharp contrast to Physician 1, who treats
20 A expected total cost scoring system is used throughout the remainder of Section 4.
21 Appendix B provides a more detailed explanation of how the numbers in Tables 4.2-4.7 were calculated.
24 Physician Tradeoffs Between Efficiency and Revenue Acumen, LLC
condition C inefficiently and conditions A and B efficiently. Like Physician 1, he stands to
maximize his composite score by increasing his efficiency in condition C by 10% as it
contributes the largest share of total expected cost. The first panel in Table 4.4 shows the same
scenario as with Physician 1: as long as the incentive factor is greater than zero, Physician 2 will
increase his revenue. The higher the conversion rate, the more incentive both physicians have to
increase their efficiency.
4.3.2 Increasing Efficiency by Changing Composition of Episodes Treated
Gatekeeper physicians also have an incentive to specialize in the areas in which they are
most efficient. Recall that the second strategy for increasing a composite score is to shift
episodes from types in which the physician is inefficient to types where he is more efficient.
Assuming that switching to a completely new condition would not improve efficiency, the
gatekeeper will begin treating only episodes of the type he treats most efficiently to optimize his
composite score and maximize his revenue. In our example from Table 4.2, Physician 1 is most
efficient when treating patients with condition B. The second panel in Table 4.3 shows the
changes in the example physician’s revenue if he were to treat all 16 of his episodes in condition
B. Recall that the physician receives $50 per episode for seeing the patient regardless of whether
he treats patients in condition A, B, or C. However, by treating more patients of condition B, his
composite score improves and his bonus increases. Using an incentive factor of 50%, the
physician would experience a 35% increase in revenue through bonus payments by specializing
in condition B. Physician 2, however, is most efficient at treating condition C so he would shift
all of his episodes to that type. The second panel in Table 4.4 shows the same pattern as seen for
Physician 1. The higher the incentive factor, the larger the increase in revenue is for Physician 2.
Table 4.2: Gatekeeper Physicians’ Cost Breakdown
Condition Number of
Episodes
Expected Cost Physician 1 Physician 2
Average Total Score Revenue Score Revenue
A 10 $100 $1,000 0.9 $500 1.75 $500
B 2 $200 $400 0.875 $100 1.4 $100
C 4 $1,000 $4,000 1.75 $200 0.9 $200
Total 16
$5,400
$800
$800
Composite Score
1.528
1.094
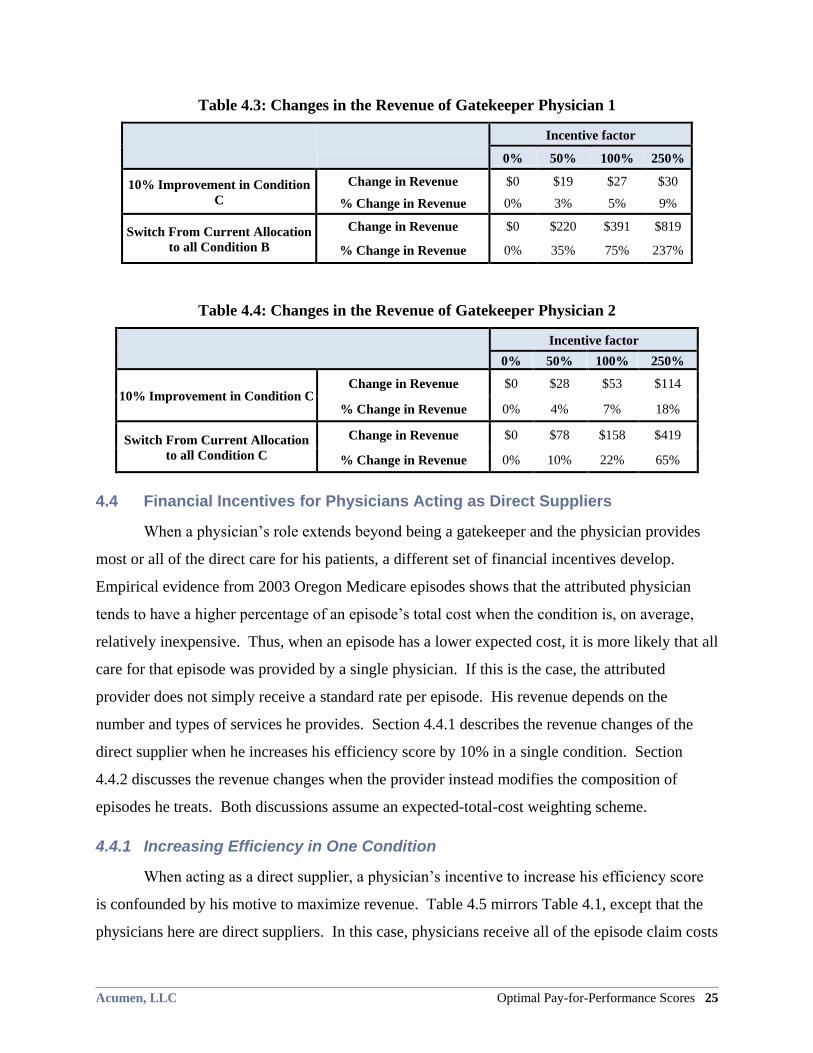
Acumen, LLC Optimal Pay-for-Performance Scores 25
Table 4.3: Changes in the Revenue of Gatekeeper Physician 1
Incentive factor
0% 50% 100% 250%
10% Improvement in Condition
C
Change in Revenue $0 $19 $27 $30
% Change in Revenue 0% 3% 5% 9%
Switch From Current Allocation
to all Condition B
Change in Revenue $0 $220 $391 $819
% Change in Revenue 0% 35% 75% 237%
Table 4.4: Changes in the Revenue of Gatekeeper Physician 2
Incentive factor
0% 50% 100% 250%
10% Improvement in Condition C Change in Revenue $0 $28 $53 $114
% Change in Revenue 0% 4% 7% 18%
Switch From Current Allocation
to all Condition C
Change in Revenue $0 $78 $158 $419
% Change in Revenue 0% 10% 22% 65%
4.4 Financial Incentives for Physicians Acting as Direct Suppliers
When a physician’s role extends beyond being a gatekeeper and the physician provides
most or all of the direct care for his patients, a different set of financial incentives develop.
Empirical evidence from 2003 Oregon Medicare episodes shows that the attributed physician
tends to have a higher percentage of an episode’s total cost when the condition is, on average,
relatively inexpensive. Thus, when an episode has a lower expected cost, it is more likely that all
care for that episode was provided by a single physician. If this is the case, the attributed
provider does not simply receive a standard rate per episode. His revenue depends on the
number and types of services he provides. Section 4.4.1 describes the revenue changes of the
direct supplier when he increases his efficiency score by 10% in a single condition. Section
4.4.2 discusses the revenue changes when the provider instead modifies the composition of
episodes he treats. Both discussions assume an expected-total-cost weighting scheme.
4.4.1 Increasing Efficiency in One Condition
When acting as a direct supplier, a physician’s incentive to increase his efficiency score
is confounded by his motive to maximize revenue. Table 4.5 mirrors Table 4.1, except that the
physicians here are direct suppliers. In this case, physicians receive all of the episode claim costs
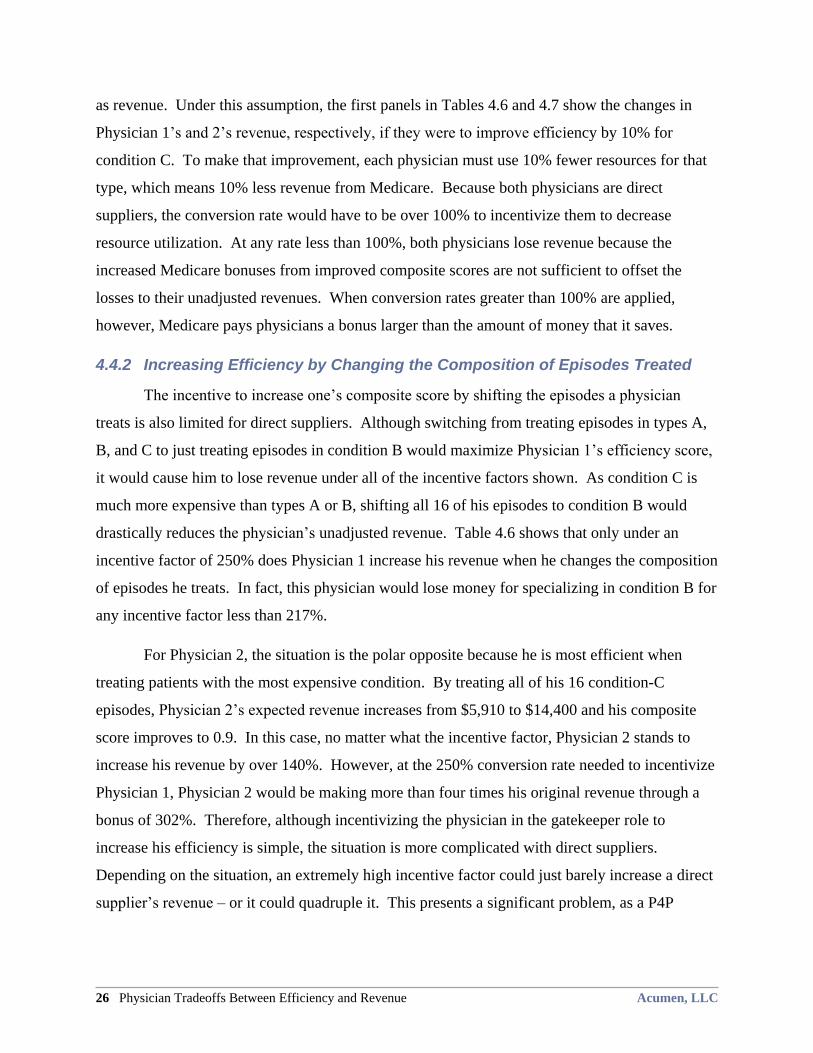
26 Physician Tradeoffs Between Efficiency and Revenue Acumen, LLC
as revenue. Under this assumption, the first panels in Tables 4.6 and 4.7 show the changes in
Physician 1’s and 2’s revenue, respectively, if they were to improve efficiency by 10% for
condition C. To make that improvement, each physician must use 10% fewer resources for that
type, which means 10% less revenue from Medicare. Because both physicians are direct
suppliers, the conversion rate would have to be over 100% to incentivize them to decrease
resource utilization. At any rate less than 100%, both physicians lose revenue because the
increased Medicare bonuses from improved composite scores are not sufficient to offset the
losses to their unadjusted revenues. When conversion rates greater than 100% are applied,
however, Medicare pays physicians a bonus larger than the amount of money that it saves.
4.4.2 Increasing Efficiency by Changing the Composition of Episodes Treated
The incentive to increase one’s composite score by shifting the episodes a physician
treats is also limited for direct suppliers. Although switching from treating episodes in types A,
B, and C to just treating episodes in condition B would maximize Physician 1’s efficiency score,
it would cause him to lose revenue under all of the incentive factors shown. As condition C is
much more expensive than types A or B, shifting all 16 of his episodes to condition B would
drastically reduces the physician’s unadjusted revenue. Table 4.6 shows that only under an
incentive factor of 250% does Physician 1 increase his revenue when he changes the composition
of episodes he treats. In fact, this physician would lose money for specializing in condition B for
any incentive factor less than 217%.
For Physician 2, the situation is the polar opposite because he is most efficient when
treating patients with the most expensive condition. By treating all of his 16 condition-C
episodes, Physician 2’s expected revenue increases from $5,910 to $14,400 and his composite
score improves to 0.9. In this case, no matter what the incentive factor, Physician 2 stands to
increase his revenue by over 140%. However, at the 250% conversion rate needed to incentivize
Physician 1, Physician 2 would be making more than four times his original revenue through a
bonus of 302%. Therefore, although incentivizing the physician in the gatekeeper role to
increase his efficiency is simple, the situation is more complicated with direct suppliers.
Depending on the situation, an extremely high incentive factor could just barely increase a direct
supplier’s revenue – or it could quadruple it. This presents a significant problem, as a P4P
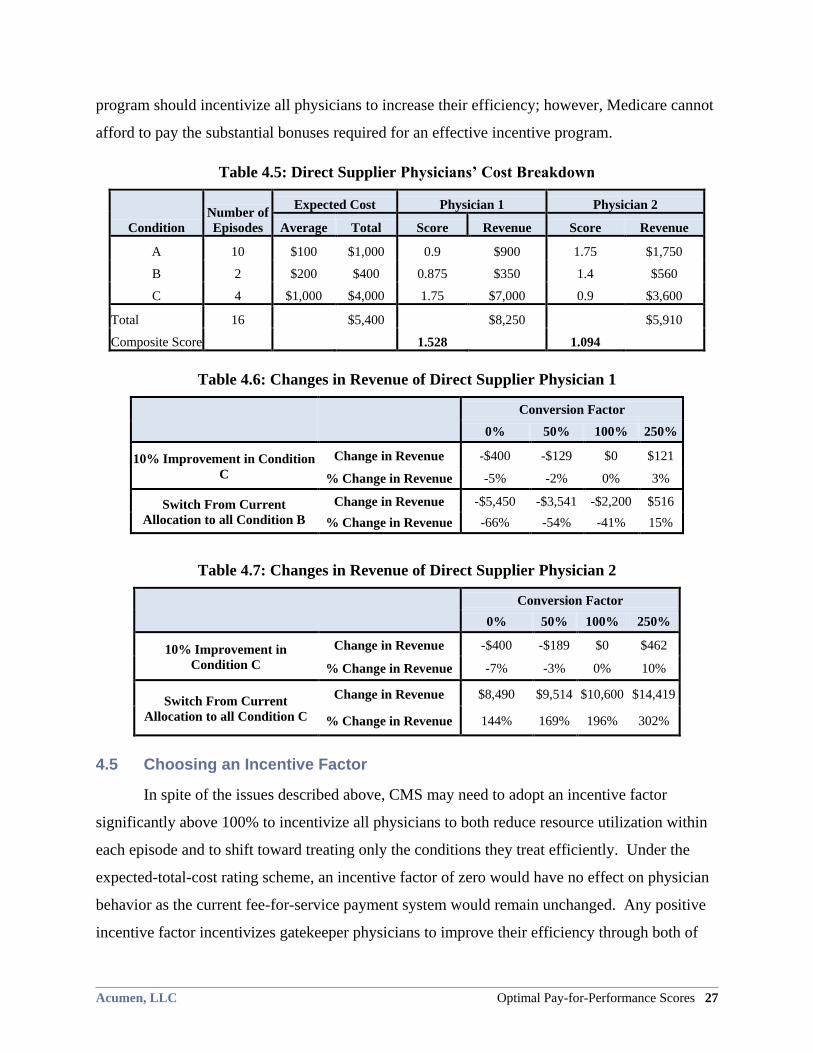
Acumen, LLC Optimal Pay-for-Performance Scores 27
program should incentivize all physicians to increase their efficiency; however, Medicare cannot
afford to pay the substantial bonuses required for an effective incentive program.
Table 4.5: Direct Supplier Physicians’ Cost Breakdown
Condition
Number of
Episodes
Expected Cost Physician 1 Physician 2
Average Total Score Revenue Score Revenue
A 10 $100 $1,000 0.9 $900 1.75 $1,750
B 2 $200 $400 0.875 $350 1.4 $560
C 4 $1,000 $4,000 1.75 $7,000 0.9 $3,600
Total 16 $5,400 $8,250 $5,910
Composite Score 1.528 1.094
Table 4.6: Changes in Revenue of Direct Supplier Physician 1
Conversion Factor
0% 50% 100% 250%
10% Improvement in Condition
C
Change in Revenue -$400 -$129 $0 $121
% Change in Revenue -5% -2% 0% 3%
Switch From Current
Allocation to all Condition B
Change in Revenue -$5,450 -$3,541 -$2,200 $516
% Change in Revenue -66% -54% -41% 15%
Table 4.7: Changes in Revenue of Direct Supplier Physician 2
Conversion Factor
0% 50% 100% 250%
10% Improvement in
Condition C
Change in Revenue -$400 -$189 $0 $462
% Change in Revenue -7% -3% 0% 10%
Switch From Current
Allocation to all Condition C
Change in Revenue $8,490 $9,514 $10,600 $14,419
% Change in Revenue 144% 169% 196% 302%
4.5 Choosing an Incentive Factor
In spite of the issues described above, CMS may need to adopt an incentive factor
significantly above 100% to incentivize all physicians to both reduce resource utilization within
each episode and to shift toward treating only the conditions they treat efficiently. Under the
expected-total-cost rating scheme, an incentive factor of zero would have no effect on physician
behavior as the current fee-for-service payment system would remain unchanged. Any positive
incentive factor incentivizes gatekeeper physicians to improve their efficiency through both of
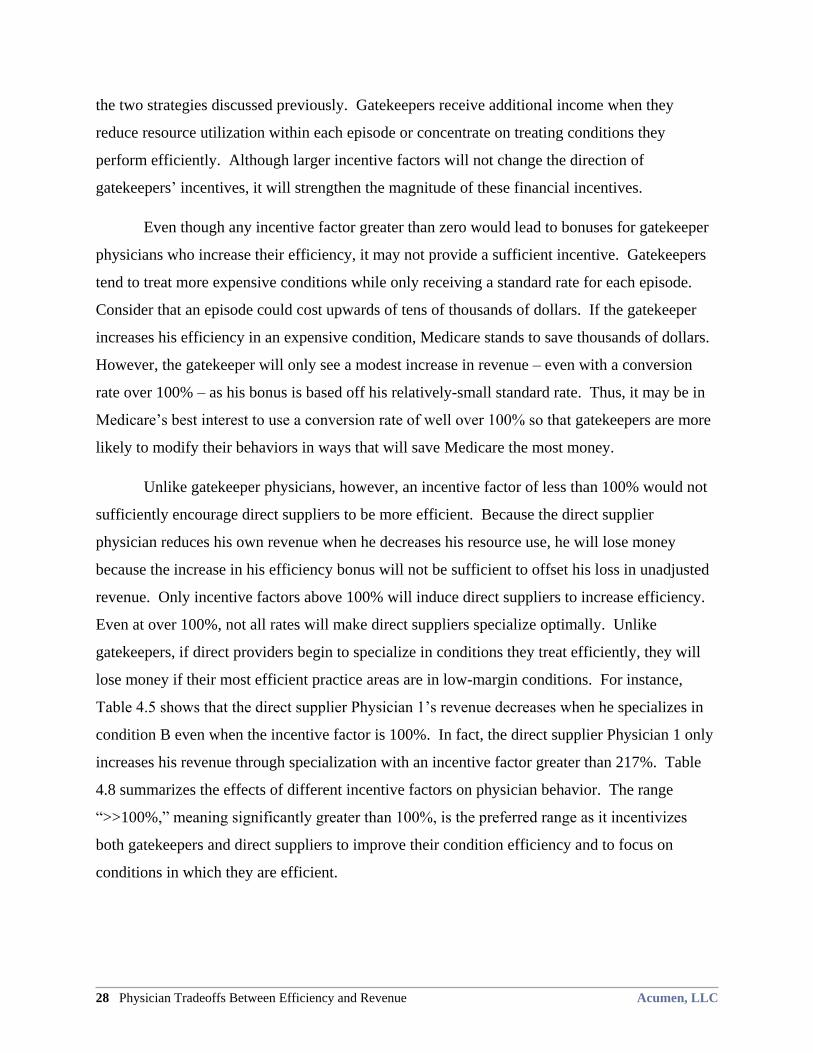
28 Physician Tradeoffs Between Efficiency and Revenue Acumen, LLC
the two strategies discussed previously. Gatekeepers receive additional income when they
reduce resource utilization within each episode or concentrate on treating conditions they
perform efficiently. Although larger incentive factors will not change the direction of
gatekeepers’ incentives, it will strengthen the magnitude of these financial incentives.
Even though any incentive factor greater than zero would lead to bonuses for gatekeeper
physicians who increase their efficiency, it may not provide a sufficient incentive. Gatekeepers
tend to treat more expensive conditions while only receiving a standard rate for each episode.
Consider that an episode could cost upwards of tens of thousands of dollars. If the gatekeeper
increases his efficiency in an expensive condition, Medicare stands to save thousands of dollars.
However, the gatekeeper will only see a modest increase in revenue – even with a conversion
rate over 100% – as his bonus is based off his relatively-small standard rate. Thus, it may be in
Medicare’s best interest to use a conversion rate of well over 100% so that gatekeepers are more
likely to modify their behaviors in ways that will save Medicare the most money.
Unlike gatekeeper physicians, however, an incentive factor of less than 100% would not
sufficiently encourage direct suppliers to be more efficient. Because the direct supplier
physician reduces his own revenue when he decreases his resource use, he will lose money
because the increase in his efficiency bonus will not be sufficient to offset his loss in unadjusted
revenue. Only incentive factors above 100% will induce direct suppliers to increase efficiency.
Even at over 100%, not all rates will make direct suppliers specialize optimally. Unlike
gatekeepers, if direct providers begin to specialize in conditions they treat efficiently, they will
lose money if their most efficient practice areas are in low-margin conditions. For instance,
Table 4.5 shows that the direct supplier Physician 1’s revenue decreases when he specializes in
condition B even when the incentive factor is 100%. In fact, the direct supplier Physician 1 only
increases his revenue through specialization with an incentive factor greater than 217%. Table
4.8 summarizes the effects of different incentive factors on physician behavior. The range
―>>100%,‖ meaning significantly greater than 100%, is the preferred range as it incentivizes
both gatekeepers and direct suppliers to improve their condition efficiency and to focus on
conditions in which they are efficient.
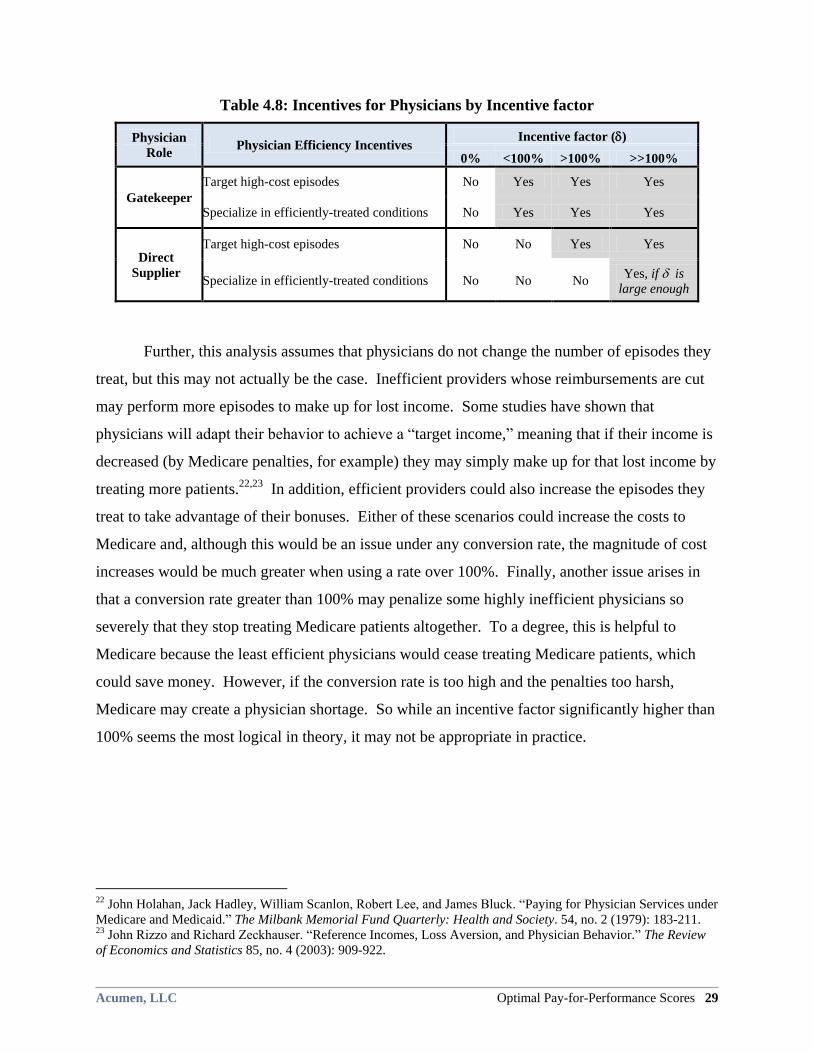
Acumen, LLC Optimal Pay-for-Performance Scores 29
Table 4.8: Incentives for Physicians by Incentive factor
Physician
Role Physician Efficiency Incentives
Incentive factor ()
0% <100% >100% >>100%
Gatekeeper
Target high-cost episodes No Yes Yes Yes
Specialize in efficiently-treated conditions No Yes Yes Yes
Direct
Supplier
Target high-cost episodes No No Yes Yes
Specialize in efficiently-treated conditions No No No Yes, if is
large enough
Further, this analysis assumes that physicians do not change the number of episodes they
treat, but this may not actually be the case. Inefficient providers whose reimbursements are cut
may perform more episodes to make up for lost income. Some studies have shown that
physicians will adapt their behavior to achieve a ―target income,‖ meaning that if their income is
decreased (by Medicare penalties, for example) they may simply make up for that lost income by
treating more patients.22,23
In addition, efficient providers could also increase the episodes they
treat to take advantage of their bonuses. Either of these scenarios could increase the costs to
Medicare and, although this would be an issue under any conversion rate, the magnitude of cost
increases would be much greater when using a rate over 100%. Finally, another issue arises in
that a conversion rate greater than 100% may penalize some highly inefficient physicians so
severely that they stop treating Medicare patients altogether. To a degree, this is helpful to
Medicare because the least efficient physicians would cease treating Medicare patients, which
could save money. However, if the conversion rate is too high and the penalties too harsh,
Medicare may create a physician shortage. So while an incentive factor significantly higher than
100% seems the most logical in theory, it may not be appropriate in practice.
22 John Holahan, Jack Hadley, William Scanlon, Robert Lee, and James Bluck. ―Paying for Physician Services under
Medicare and Medicaid.‖ The Milbank Memorial Fund Quarterly: Health and Society. 54, no. 2 (1979): 183-211. 23 John Rizzo and Richard Zeckhauser. ―Reference Incomes, Loss Aversion, and Physician Behavior.‖ The Review
of Economics and Statistics 85, no. 4 (2003): 909-922.
30 Empirical Applications of Scoring to Medicare Physicians Acumen, LLC
5 EMPIRICAL APPLICATIONS OF SCORING TO MEDICARE PHYSICIANS
To examine how these scoring systems and incentive factors would function in practice,
this section constructs composite efficiency scores from Medicare claims data. As this report has
established the responses of hypothetical physicians to P4P, it now turns to scoring the actual
Oregon Medicare provider population. By comparing the four scoring schemes empirically, the
analysis demonstrates that the choice of weighting method considerably affects how individual
physicians are scored. Section 5.1 describes and compares physician score distributions under
each of the four proposed composite score weighting schemes. Although the overall score
distributions are similar across the four weighting mechanisms, Section 5.2 provides evidence
that the choice of the weighting scheme greatly affects the scores of a large share of physicians.
Finally, Section 5.3 discusses empirical issues with identifying the provider responsible for
directing patient care in Medicare episodes.
5.1 Physician Score Distributions Using the Four Weighting Schemes
This analysis applies the four weighting schemes to score Oregon Medicare physicians
and finds that the resulting score distributions are similar across all methods. The scores in this
report are calculated from 2003 complete episodes created by the ETG and MEG groupers from
100% of 2002-2004 Oregon Medicare claims.24
These scores are constructed using the
methodology described in Section 2, which assigns responsibility for an episode to the provider
with the most PB claims costs.
Table 5.1 provides the mean, 10th
percentile, median, and 90th
percentile scores, as well
as the ratio of the 90th
percentile score to the 10th
percentile score, for all scored physicians in all
specialties under the four weighting schemes for ETG. The number of physicians receiving
scores is almost the same for both groupers (4,646 for ETG and 4,641 for MEG).25
The
expected-cost-per-episode weighting scores have the highest dispersion, as measured by the
90/10 ratio, but the distributions are similar for all schemes. In all four cases, score distributions
24 A 2003 complete episode is defined as ending 2003. These episodes can begin at any time in 2002 or 2003. The
analysis also uses claims data from 2004 to verify that episodes are closed by the groupers. Beneficiaries had to
reside in Oregon and be continuously enrolled in Parts A and B fee-for-service while alive.
25 These numbers and the score distributions do not consider two ETG physicians and three MEG physicians who
received extremely high scores (over 40).
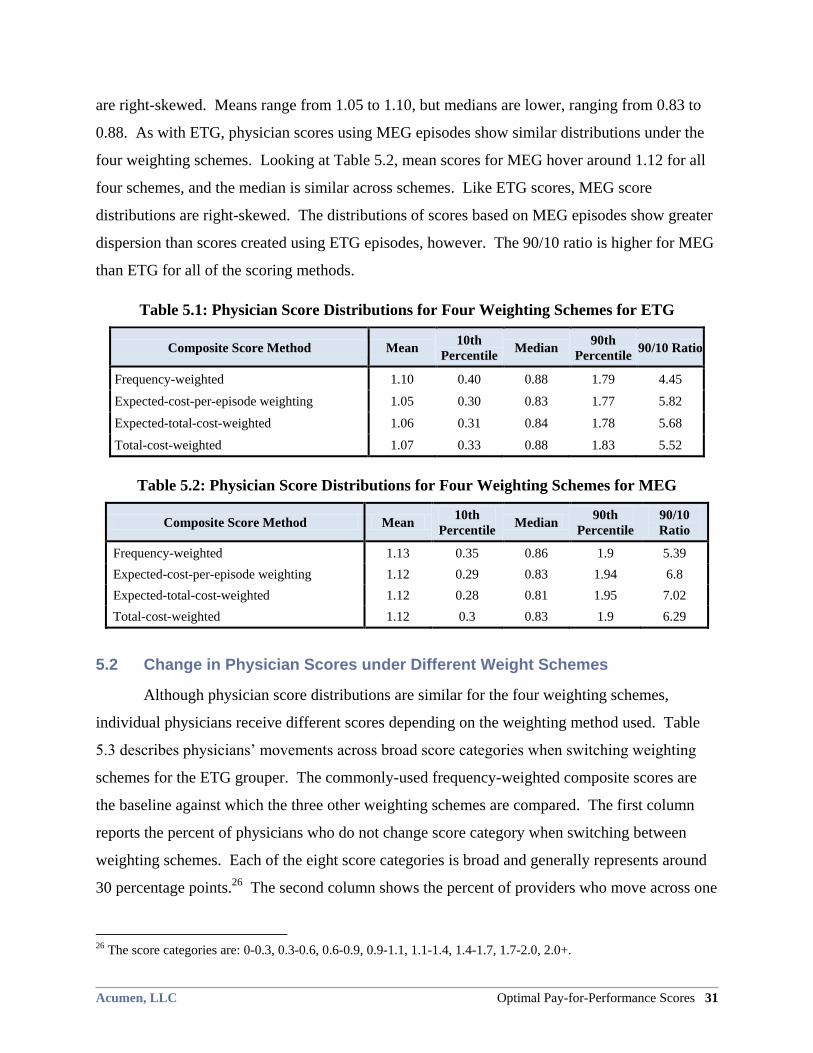
Acumen, LLC Optimal Pay-for-Performance Scores 31
are right-skewed. Means range from 1.05 to 1.10, but medians are lower, ranging from 0.83 to
0.88. As with ETG, physician scores using MEG episodes show similar distributions under the
four weighting schemes. Looking at Table 5.2, mean scores for MEG hover around 1.12 for all
four schemes, and the median is similar across schemes. Like ETG scores, MEG score
distributions are right-skewed. The distributions of scores based on MEG episodes show greater
dispersion than scores created using ETG episodes, however. The 90/10 ratio is higher for MEG
than ETG for all of the scoring methods.
Table 5.1: Physician Score Distributions for Four Weighting Schemes for ETG
Composite Score Method Mean 10th
Percentile Median
90th
Percentile 90/10 Ratio
Frequency-weighted 1.10 0.40 0.88 1.79 4.45
Expected-cost-per-episode weighting 1.05 0.30 0.83 1.77 5.82
Expected-total-cost-weighted 1.06 0.31 0.84 1.78 5.68
Total-cost-weighted 1.07 0.33 0.88 1.83 5.52
Table 5.2: Physician Score Distributions for Four Weighting Schemes for MEG
Composite Score Method Mean 10th
Percentile Median
90th
Percentile
90/10
Ratio
Frequency-weighted 1.13 0.35 0.86 1.9 5.39
Expected-cost-per-episode weighting 1.12 0.29 0.83 1.94 6.8
Expected-total-cost-weighted 1.12 0.28 0.81 1.95 7.02
Total-cost-weighted 1.12 0.3 0.83 1.9 6.29
5.2 Change in Physician Scores under Different Weight Schemes
Although physician score distributions are similar for the four weighting schemes,
individual physicians receive different scores depending on the weighting method used. Table
5.3 describes physicians’ movements across broad score categories when switching weighting
schemes for the ETG grouper. The commonly-used frequency-weighted composite scores are
the baseline against which the three other weighting schemes are compared. The first column
reports the percent of physicians who do not change score category when switching between
weighting schemes. Each of the eight score categories is broad and generally represents around
30 percentage points.26
The second column shows the percent of providers who move across one
26 The score categories are: 0-0.3, 0.3-0.6, 0.6-0.9, 0.9-1.1, 1.1-1.4, 1.4-1.7, 1.7-2.0, 2.0+.
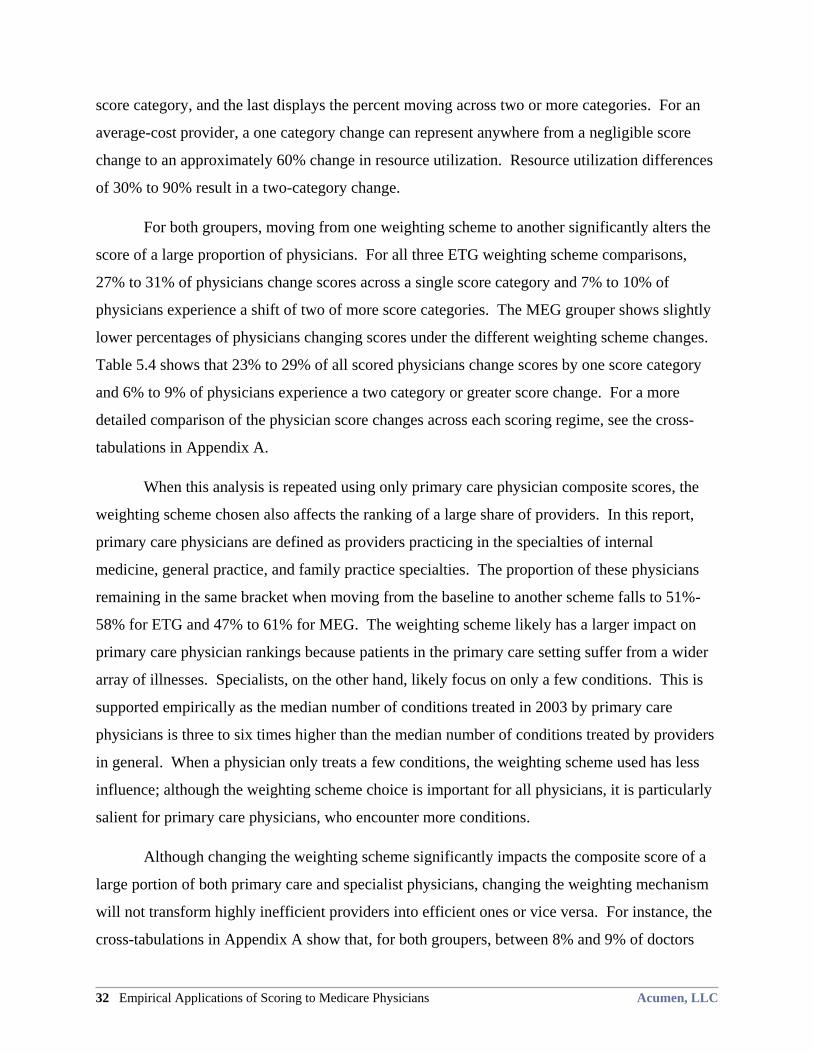
32 Empirical Applications of Scoring to Medicare Physicians Acumen, LLC
score category, and the last displays the percent moving across two or more categories. For an
average-cost provider, a one category change can represent anywhere from a negligible score
change to an approximately 60% change in resource utilization. Resource utilization differences
of 30% to 90% result in a two-category change.
For both groupers, moving from one weighting scheme to another significantly alters the
score of a large proportion of physicians. For all three ETG weighting scheme comparisons,
27% to 31% of physicians change scores across a single score category and 7% to 10% of
physicians experience a shift of two of more score categories. The MEG grouper shows slightly
lower percentages of physicians changing scores under the different weighting scheme changes.
Table 5.4 shows that 23% to 29% of all scored physicians change scores by one score category
and 6% to 9% of physicians experience a two category or greater score change. For a more
detailed comparison of the physician score changes across each scoring regime, see the cross-
tabulations in Appendix A.
When this analysis is repeated using only primary care physician composite scores, the
weighting scheme chosen also affects the ranking of a large share of providers. In this report,
primary care physicians are defined as providers practicing in the specialties of internal
medicine, general practice, and family practice specialties. The proportion of these physicians
remaining in the same bracket when moving from the baseline to another scheme falls to 51%-
58% for ETG and 47% to 61% for MEG. The weighting scheme likely has a larger impact on
primary care physician rankings because patients in the primary care setting suffer from a wider
array of illnesses. Specialists, on the other hand, likely focus on only a few conditions. This is
supported empirically as the median number of conditions treated in 2003 by primary care
physicians is three to six times higher than the median number of conditions treated by providers
in general. When a physician only treats a few conditions, the weighting scheme used has less
influence; although the weighting scheme choice is important for all physicians, it is particularly
salient for primary care physicians, who encounter more conditions.
Although changing the weighting scheme significantly impacts the composite score of a
large portion of both primary care and specialist physicians, changing the weighting mechanism
will not transform highly inefficient providers into efficient ones or vice versa. For instance, the
cross-tabulations in Appendix A show that, for both groupers, between 8% and 9% of doctors
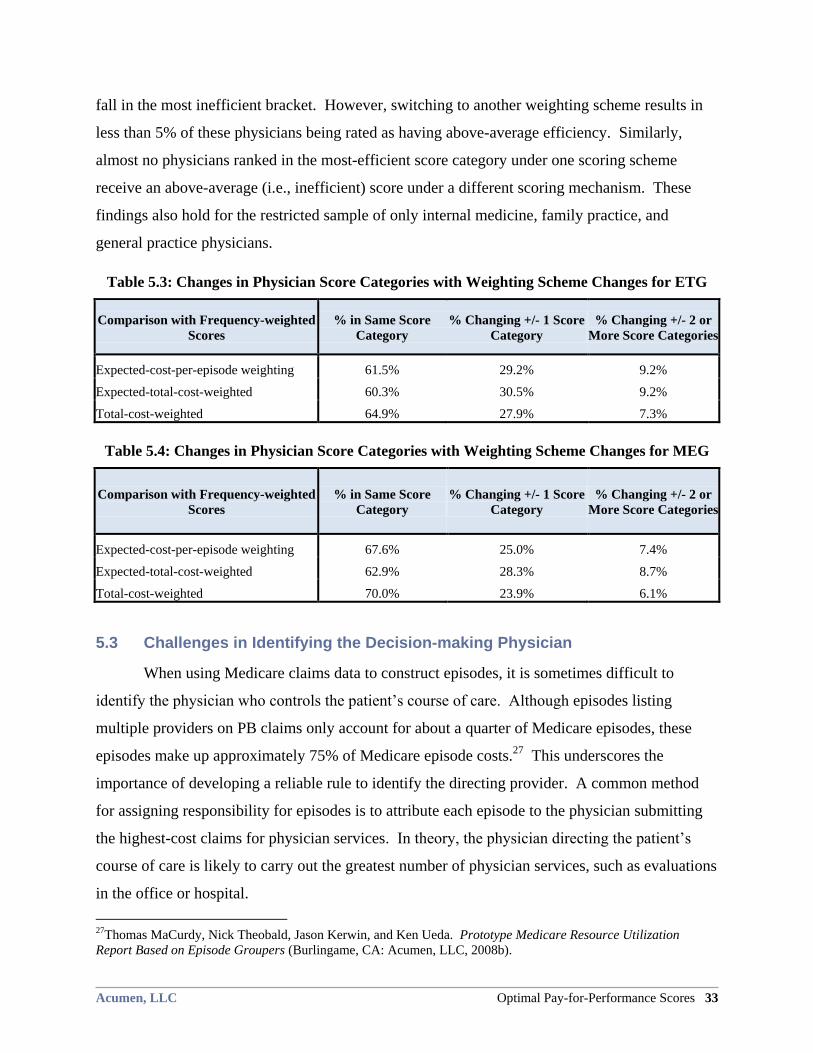
Acumen, LLC Optimal Pay-for-Performance Scores 33
fall in the most inefficient bracket. However, switching to another weighting scheme results in
less than 5% of these physicians being rated as having above-average efficiency. Similarly,
almost no physicians ranked in the most-efficient score category under one scoring scheme
receive an above-average (i.e., inefficient) score under a different scoring mechanism. These
findings also hold for the restricted sample of only internal medicine, family practice, and
general practice physicians.
Table 5.3: Changes in Physician Score Categories with Weighting Scheme Changes for ETG
Comparison with Frequency-weighted
Scores
% in Same Score
Category
% Changing +/- 1 Score
Category
% Changing +/- 2 or
More Score Categories
Expected-cost-per-episode weighting 61.5% 29.2% 9.2%
Expected-total-cost-weighted 60.3% 30.5% 9.2%
Total-cost-weighted 64.9% 27.9% 7.3%
Table 5.4: Changes in Physician Score Categories with Weighting Scheme Changes for MEG
Comparison with Frequency-weighted
Scores
% in Same Score
Category
% Changing +/- 1 Score
Category
% Changing +/- 2 or
More Score Categories
Expected-cost-per-episode weighting 67.6% 25.0% 7.4%
Expected-total-cost-weighted 62.9% 28.3% 8.7%
Total-cost-weighted 70.0% 23.9% 6.1%
5.3 Challenges in Identifying the Decision-making Physician
When using Medicare claims data to construct episodes, it is sometimes difficult to
identify the physician who controls the patient’s course of care. Although episodes listing
multiple providers on PB claims only account for about a quarter of Medicare episodes, these
episodes make up approximately 75% of Medicare episode costs.27
This underscores the
importance of developing a reliable rule to identify the directing provider. A common method
for assigning responsibility for episodes is to attribute each episode to the physician submitting
the highest-cost claims for physician services. In theory, the physician directing the patient’s
course of care is likely to carry out the greatest number of physician services, such as evaluations
in the office or hospital.
27Thomas MaCurdy, Nick Theobald, Jason Kerwin, and Ken Ueda. Prototype Medicare Resource Utilization
Report Based on Episode Groupers (Burlingame, CA: Acumen, LLC, 2008b).
34 Empirical Applications of Scoring to Medicare Physicians Acumen, LLC
However, assigning episodes to the provider with the most PB claims costs may result in
attributing episodes to providers with little or no role in directing patient care. The physician
who actually directs patient care may not have the most PB costs, particularly if he is a
gatekeeper physician who only collects a modest standard fee for each episode. For example,
anesthesiologists are attributed 2% of 2003 Oregon ETG Cholelithiasis, SL 2 episodes and 1% of
MEG Fracture: femur, head or neck episodes when using PB claims costs to assign episodes.28
It is very unlikely, however, that anesthesiologists actually direct the course of care; their role is
more likely limited to administering anesthesia to the patient before surgery. These
anesthesiologists probably have little or no influence over the costs of these episodes and the
treatments that other doctors perform.
Assigning episodes to the provider with the most Evaluation and Management (E&M)
payments may more accurately identify the decision-making physician, but this method
substantially reduces the number of score-eligible episodes. E&M claims are a subset of PB
claims that are submitted when the physician performs evaluation and management services, and
therefore participates in directing the patient’s course of care. Researchers such as Houchens et
al. (2009) use only E&M claims costs to attribute episodes. However, attributing episodes using
E&M costs decreases both the number and costs of the episodes that can be attributed.29
For
2003-2005 Oregon Medicare episodes, attribution using E&M costs assigns 52% of episodes and
74% of total episode costs to providers for ETG, compared to 71% and 81% using PB costs.30
For MEG, attribution based on E&M costs assigns 56% of episodes and 74% of episode cost to
providers. However, using PB costs with MEG matches 73% of episodes and over 81% of
associated episode costs to providers.31
The findings in this section suggest that Medicare needs
to either secure additional physician information or make changes to its payment structure or
patient care model before implementing such a scoring system.
28 To assign episodes using PB costs, this report attributes an episode to the provider with the most PB payments,
and, in the case of a tie, assigns the episode to the provider with more E&M payments.
29 When attributing episodes using E&M costs, this analysis matches an episode to the physician with the most
E&M costs, but if two providers have the same amount of E&M payments, the tie is broken by assigning the episode
to the provider with higher PB payments.
30 Thomas MaCurdy, Jason Shafrin, Elizabeth Hartmann, Maria Ho, Lauren Talbot, Ken Ueda, and Zhihao Zhang.
Evaluating the Stability of Physician Efficiency Scores. Acumen, LLC Report prepared for the Centers for Medicare
& Medicaid Services (Burlingame, CA: Acumen, LLC, 2010b).
31 MaCurdy et. al., Evaluating the Stability of Physician Efficiency Scores.
Acumen, LLC Optimal Pay-for-Performance Scores 35
6 CONCLUSION
Implementing a physician P4P system based on physician resource use, requires both
creating a system for scoring provider performance and developing financial incentives based on
these scores. This report considers a specific type of scoring mechanism, the composite score.
The composite efficiency scores by aggregating physician performance measures for treating a
variety of conditions into a single metric. The composite score and the accompanying payments
should incentivize providers to both reduce cost within any episode type and to shift their
practice toward treating conditions they treat more efficiently. This report evaluates potential
specifications to make these goals come to fruition.
6.1 Weighting Condition Scores by Expected Total Cost
This report proposes weighting the condition measures by both frequency and expected
cost to maximize potential Medicare savings. Assigning weights solely by the frequency with
which a physician treats a condition does not encourage physicians to focus their efforts on the
costliest conditions. On the other hand, weighting scores only using each condition’s expected
cost does not sufficiently reward physicians for decreasing the relative volumes of conditions
they treat inefficiently. By applying both frequency and expected cost weighting, however,
physicians are encouraged to shift their practices away from conditions for which they have
efficiency disadvantages. In addition, conditions that are typically expensive receive more
attention. Expected-total-cost weighting therefore aligns physician incentives with CMS’ cost
saving goals.
6.2 P4P May Create Tradeoff between Efficiency and Revenue for Some Physicians
This analysis finds that P4P always creates cost-saving incentives for gatekeeper
physicians though they may not be induced to change their behavior depending on the magnitude
of the incentive. Gatekeepers are providers who direct resource utilization despite being
responsible for only a small percentage of the costs of the episodes they are attributed. In the
stylized example in this report, the gatekeeper is reimbursed a modest standard fee for each
episode he treats regardless of the condition, but receives no revenue from the rest of the services
in the episode. The gatekeeper is the director of the patient’s care, determining the medical
services provided by other physicians. As the gatekeeper reduces the cost or volume of the
36 Conclusion Acumen, LLC
services to which he refers his patients, his efficiency score improves without any reduction in
his claims revenue. Furthermore, the gatekeeper faces incentives to specialize in treating the
conditions where he is most efficient. In any CMS P4P system, the gatekeepers who engage in
behaviors that save Medicare money receive a net revenue gain through efficiency bonuses.
However, gatekeepers receive modest standard rates per episode and their episodes tend to be
more expensive on average. Thus, their willingness to adapt their behavior may be highly
dependent on the magnitude of the bonuses they receive as even twice their standard rate may be
a miniscule amount compared to the money they are saving Medicare.
In contrast, providers who perform the vast majority of the medical services in their
episodes face a tradeoff when reducing resource use. Although reducing services to their
patients increases their efficiency scores and efficiency rewards, this gain may be offset by the
loss in claims revenue. One dollar of cost savings to CMS is equivalently one dollar less of
revenue for the direct supplier physician. Furthermore, it is difficult to induce these direct
suppliers to specialize in conditions that they treat efficiently. In general, direct suppliers have
strong incentives to focus on the conditions that are most profitable, regardless of their efficiency
levels for those conditions. In order to incentivize direct supplier physicians to optimally
specialize, P4P penalties and rewards must be exceedingly high.
6.3 Other Issues with Episode-Based Efficiency Scoring
It is often difficult to identify the physician directing patient care in an episode-based
physician scoring system. In some episodes, the attributed provider is neither a gatekeeper
physician nor a direct provider. Instead, the attributed provider may have little or no control over
the patient’s course of care. For example, one common method of attributing episodes to
providers is assigning responsibility for an episode to the physician with the highest costs from
Part B claims. This attribution method allocates gallstone and hip fracture episodes to
anesthesiologists despite the fact that these physicians likely have negligible influence over the
costs of these episodes.
Furthermore, episode-based efficiency scores are only as reliable as the diagnoses on
claims. Because episode grouping software primarily uses diagnoses to assign claims to
episodes, physicians may attempt to improve their efficiency scores by deliberately misreporting
diagnoses. For example, a physician may report a diagnosis for stroke, which is relatively costly
Acumen, LLC Optimal Pay-for-Performance Scores 37
to treat, when the patient is receiving treatment for a cataract, a condition that is usually
inexpensive to treat. Physicians may also ―upcode‖ by, for instance, reporting a more serious
spinal trauma when the patient only has neck soreness. Even if effective fraud prevention is
implemented, physicians may have little incentive to ensure that diagnosis information on claims
is accurate and complete as Medicare physician payments are determined at the procedure, rather
than diagnosis, level.32
Additionally, our previous research shows that episodes are not always clinically-
coherent units of analysis. For the efficiency scoring system to be reliable, episodes of care for
the same condition must be comparable across providers. However, our earlier research33,34
finds that episodes within some conditions are heterogeneous in resource use and reflect
fundamentally different underlying events. For example, hip fractures include both full courses
of care for new hip fractures and episodes that only capture follow-up care for earlier fractures.
Physicians treating heterogeneous episode types could unfairly receive rewards or penalties,
depending on the events underlying their attributed episodes.
Lastly, any P4P system that only rewards providers on cost efficiency measures ignores
potential tradeoffs between cost efficiency and quality of care. One option is to integrate quality
or outcome measures into the P4P scheme. Currently, most medical conditions do not have
widely accepted quality process or outcome measures. However, further investigation into
developing physician scores based on both efficiency and quality is needed.
32 Fred Thomas, Craig Caplan, Jesse Levy, Marty Cohen, James Leonard, Todd Caldis, and Curt Mueller. Clinician
Feedback on Using Episode Groupers with Medicare Claims Data. Health Care Financing Review: Web Exclusive,
accessed 2009 <http://www4.cms hhs.gov/HealthCareFinancingReview/Downloads/Thomas WE Sep 2009.pdf>. 33 Thomas MaCurdy, Elizabeth Hartmann, Maria Ho, Jason Shafrin, Lauren Talbot and Zhihao Zhang, Challenges
in the Risk Adjustment of Episode Costs. Acumen, LLC Report prepared for the Centers for Medicare & Medicaid
Services (Burlingame, CA: Acumen, LLC, 2010a). 34 Thomas MaCurdy, Jason Shafrin, Elizabeth Hartmann, Maria Ho, Lauren Talbot, Jonathan Wong, Sajid Zaidi,
and Zhihao Zhang, Issues in the Construction of Medicare Episodes. Acumen, LLC Report prepared for the Centers
for Medicare & Medicaid Services (Burlingame, CA: Acumen, LLC, 2010c).
38 References Acumen, LLC
REFERENCES
Balas, E. Andrew, Suzanne Boren, Gordon Brown, Bernard Ewigman, Joyce Mitchell, and
Gerald Perkoff. ―Effect of Physician Profiling on Utilization: Meta-analysis of
Randomized Clinical Trials.‖ Journal of General Internal Medicine 11, no. 10 (1996).
Berwick DM. The toxicity of pay for performance. Quality Management in Health Care. vol. 4,
no. 1 (1995)):27-33.
Holahan, John, Jack Hadley, William Scanlon, Robert Lee, and James Bluck. ―Paying for
Physician Services under Medicare and Medicaid.‖ The Milbank Memorial Fund
Quarterly: Health and Society 54, no. 2 (1979): 183-211.
Houchens, Robert L., Scott McCracken, William Marder and Robert Kelley. The Use of an
Episode Grouper for Physician Profiling in Medicare: A Preliminary Investigation.
Washington, DC: Thomson Healthcare for MedPAC, 2009.
MaCurdy, Thomas, Jason Kerwin, Jonathan Gibbs, Eugene Lin, Carolyn Cotterman, Margaret
O’Brien-Strain, and Nick Theobald. 2008a. Evaluating the Functionality of the Symmetry
ETG and Medstat MEG Software in Forming Episodes of Care Using Medicare Data.
Acumen, LLC Report prepared for the Centers for Medicare & Medicaid Services.
Burlingame, CA: Acumen, LLC, 2008a.
MaCurdy, Thomas, Nick Theobald, Jason Kerwin, and Ken Ueda. Prototype Medicare Resource
Utilization Report Based on Episode Groupers. Acumen, LLC Report prepared for the
Centers for Medicare & Medicaid Services. Burlingame, CA: Acumen, LLC, 2008b.
MaCurdy, Thomas, Elizabeth Hartmann, Maria Ho, Jason Shafrin, Lauren Talbot and Zhihao
Zhang. Challenges in the Risk Adjustment of Episode Costs. Acumen, LLC Report
prepared for the Centers for Medicare & Medicaid Services. Burlingame, CA: Acumen,
LLC, 2010a.
MaCurdy, Thomas, Jason Shafrin, Elizabeth Hartmann, Maria Ho, Lauren Talbot, Ken Ueda,
and Zhihao Zhang. Evaluating the Stability of Physician Efficiency Scores. Acumen,
LLC Report prepared for the Centers for Medicare & Medicaid Services. Burlingame,
CA: Acumen, LLC, 2010b.
MaCurdy, Thomas, Jason Shafrin, Elizabeth Hartmann, Maria Ho, Lauren Talbot, Jonathan
Wong, Sajid Zaidi, and Zhihao Zhang. Issues in the Construction of Medicare Episodes.
Acumen, LLC Report prepared for the Centers for Medicare & Medicaid Services.
Burlingame, CA: Acumen, LLC, 2010c.
McGuire, Thomas, and Mark Pauly. ―Physician response to fee changes with multiple payers.‖
Journal of Health Economics 10, no. 4 (1991): 385-410.
Milstein, Arnold, and Thomas Lee. ―Comparing Physicians on Efficiency.‖ The New England
Journal of Medicine 357, no. 26 (2007): 2649-2652.
Rizzo, John and Richard Zeckhauser. ―Reference Incomes, Loss Aversion, and Physician
Behavior.‖ The Review of Economics and Statistics 85, no. 4 (2003): 909-922.
Acumen, LLC Optimal Pay-for-Performance Scores 39
Robinson, James, Thomas Williams, and Dolores Yanagihara. ―Measurement of and Reward for
Efficiency in California’s Pay-for-Performance Program.‖ Health Affairs 28, no. 5
(2009): 1438-1447.
Shortell, Stephen, Lawrence Casalino. ―Health Care Reform Require Accountable Care
Systems.‖ Journal of the American Medical Association: 300, no. 1 (2008): 95-97.
St. Jacques, Paul, Nimesh Patel, and Michael Higgins. ―Improving Anesthesiologist Performance
through Profiling and Incentives.‖ Journal of Clinical Anesthesia: 16 (2004): 523-528.
Thomas, Fred, Craig Caplan, Jesse Levy, Marty Cohen, James Leonard, Todd Caldis, and Curt
Mueller. ―Clinician Feedback on Using Episode Groupers with Medicare Claims Data.‖
Health Care Financing Review: Web Exclusive, accessed 2009
<http://www4.cms.hhs.gov/HealthCareFinancingReview/Downloads/Thomas_WE_Sep_
2009.pdf>.
Winickoff, Richard, Kathy Coltin, Mary Morgan, Robert Buxbaum, and G. Octo Barnett.
―Improving Physician Performance through Peer Comparison Feedback.‖ Medical Care
22, no. 6 (1984).
40 Appendix A: Supplementary Tables Acumen, LLC
APPENDIX A: SUPPLEMENTARY TABLES
This section provides supplemental information comparing the four scoring methods
described in Section 3.7. Included in this appendix are cross-tabulations detailing the differences
in physician scores constructed from both ETG and MEG episodes. These cross-tabulations
present each possible score category combination between two weighting schemes and the
percentage of providers whose scores follow that sequence. For example, Table A.1 compares
the ETG baseline frequency-weighted scores with ETG expected-cost-per-episode weighting
scores. Each dark square on the diagonal is shaded for emphasis to highlight the score sequences
with no category changes when switching between the two schemes. The dark square in the
lower right hand corner represents the sum of the diagonal. This value is the total percentage of
providers with no score category change. Looking at the example of Table A.1, 62% of ETG
providers are in the same category under frequency weighting and expected-cost-per-episode
weighting. This value is also in the first column of Table 3.5 (ETG) or Table 3.6 (MEG). The
light gray square to the left is the percentage of physicians in total who rise by one score
category when switching schemes, while the one above it is the total percentage who drop by one
score category. In the case of Table A.1, these values are 19% and 10% respectively. The
second column of Table 3.5 or Table 3.6 reports the sum of these values. Adding the
percentages found in these three shaded boxes and subtracting them from 100% yields the
percentage of physician scores that change by two or more categories (the last column of Table
3.5 or Table 3.6 gives this percentage). In the case of Table A.1, 9% (100%-62%-19%-10%) of
providers change score category when shifting from ETG frequency-weighted scores to
expected-cost-per-episode-weighted scores.
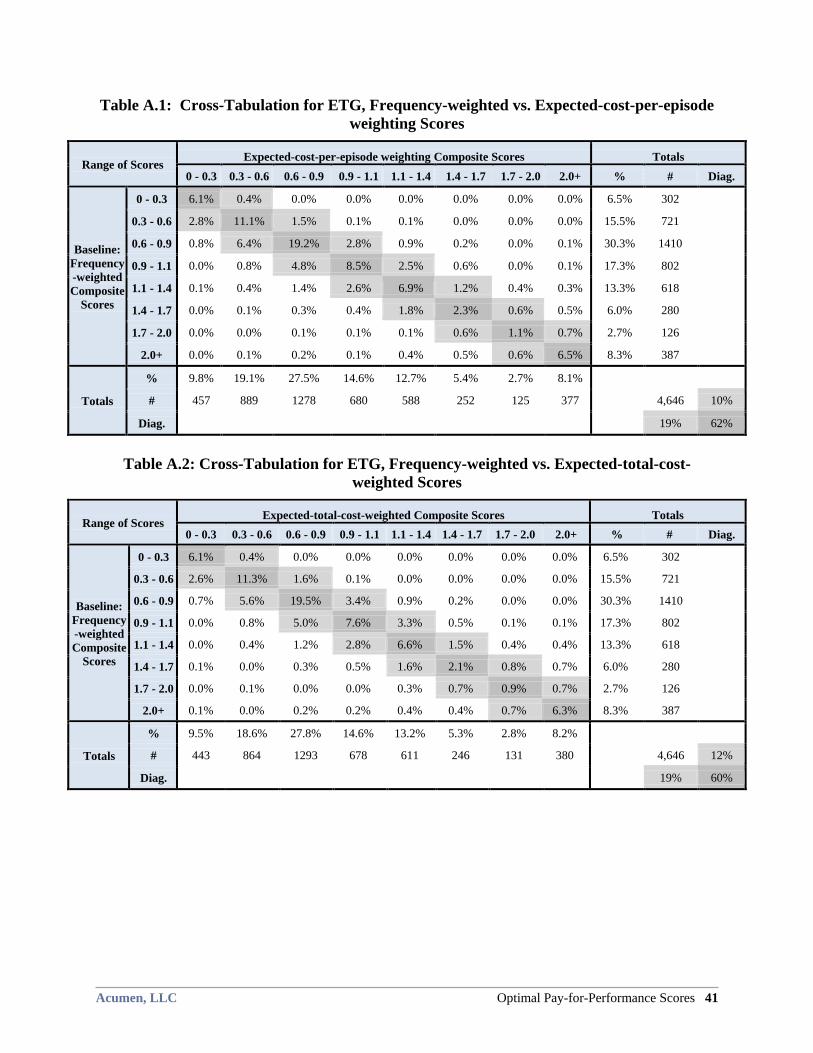
Acumen, LLC Optimal Pay-for-Performance Scores 41
Table A.1: Cross-Tabulation for ETG, Frequency-weighted vs. Expected-cost-per-episode
weighting Scores
Range of Scores Expected-cost-per-episode weighting Composite Scores Totals
0 - 0.3 0.3 - 0.6 0.6 - 0.9 0.9 - 1.1 1.1 - 1.4 1.4 - 1.7 1.7 - 2.0 2.0+ % # Diag.
Baseline:
Frequency
-weighted
Composite
Scores
0 - 0.3 6.1% 0.4% 0.0% 0.0% 0.0% 0.0% 0.0% 0.0% 6.5% 302
0.3 - 0.6 2.8% 11.1% 1.5% 0.1% 0.1% 0.0% 0.0% 0.0% 15.5% 721
0.6 - 0.9 0.8% 6.4% 19.2% 2.8% 0.9% 0.2% 0.0% 0.1% 30.3% 1410
0.9 - 1.1 0.0% 0.8% 4.8% 8.5% 2.5% 0.6% 0.0% 0.1% 17.3% 802
1.1 - 1.4 0.1% 0.4% 1.4% 2.6% 6.9% 1.2% 0.4% 0.3% 13.3% 618
1.4 - 1.7 0.0% 0.1% 0.3% 0.4% 1.8% 2.3% 0.6% 0.5% 6.0% 280
1.7 - 2.0 0.0% 0.0% 0.1% 0.1% 0.1% 0.6% 1.1% 0.7% 2.7% 126
2.0+ 0.0% 0.1% 0.2% 0.1% 0.4% 0.5% 0.6% 6.5% 8.3% 387
Totals
% 9.8% 19.1% 27.5% 14.6% 12.7% 5.4% 2.7% 8.1%
# 457 889 1278 680 588 252 125 377 4,646 10%
Diag. 19% 62%
Table A.2: Cross-Tabulation for ETG, Frequency-weighted vs. Expected-total-cost-
weighted Scores
Range of Scores Expected-total-cost-weighted Composite Scores Totals
0 - 0.3 0.3 - 0.6 0.6 - 0.9 0.9 - 1.1 1.1 - 1.4 1.4 - 1.7 1.7 - 2.0 2.0+ % # Diag.
Baseline:
Frequency
-weighted
Composite
Scores
0 - 0.3 6.1% 0.4% 0.0% 0.0% 0.0% 0.0% 0.0% 0.0% 6.5% 302
0.3 - 0.6 2.6% 11.3% 1.6% 0.1% 0.0% 0.0% 0.0% 0.0% 15.5% 721
0.6 - 0.9 0.7% 5.6% 19.5% 3.4% 0.9% 0.2% 0.0% 0.0% 30.3% 1410
0.9 - 1.1 0.0% 0.8% 5.0% 7.6% 3.3% 0.5% 0.1% 0.1% 17.3% 802
1.1 - 1.4 0.0% 0.4% 1.2% 2.8% 6.6% 1.5% 0.4% 0.4% 13.3% 618
1.4 - 1.7 0.1% 0.0% 0.3% 0.5% 1.6% 2.1% 0.8% 0.7% 6.0% 280
1.7 - 2.0 0.0% 0.1% 0.0% 0.0% 0.3% 0.7% 0.9% 0.7% 2.7% 126
2.0+ 0.1% 0.0% 0.2% 0.2% 0.4% 0.4% 0.7% 6.3% 8.3% 387
Totals
% 9.5% 18.6% 27.8% 14.6% 13.2% 5.3% 2.8% 8.2%
# 443 864 1293 678 611 246 131 380 4,646 12%
Diag. 19% 60%
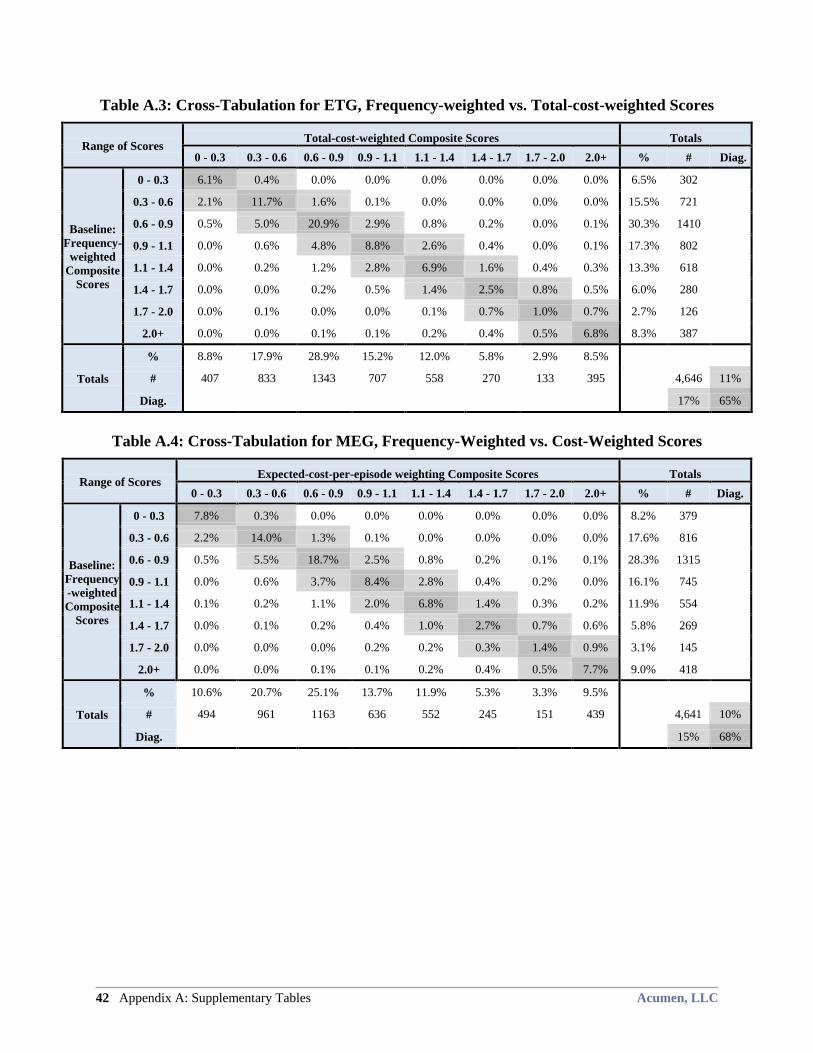
42 Appendix A: Supplementary Tables Acumen, LLC
Table A.3: Cross-Tabulation for ETG, Frequency-weighted vs. Total-cost-weighted Scores
Range of Scores Total-cost-weighted Composite Scores Totals
0 - 0.3 0.3 - 0.6 0.6 - 0.9 0.9 - 1.1 1.1 - 1.4 1.4 - 1.7 1.7 - 2.0 2.0+ % # Diag.
Baseline:
Frequency-
weighted
Composite
Scores
0 - 0.3 6.1% 0.4% 0.0% 0.0% 0.0% 0.0% 0.0% 0.0% 6.5% 302
0.3 - 0.6 2.1% 11.7% 1.6% 0.1% 0.0% 0.0% 0.0% 0.0% 15.5% 721
0.6 - 0.9 0.5% 5.0% 20.9% 2.9% 0.8% 0.2% 0.0% 0.1% 30.3% 1410
0.9 - 1.1 0.0% 0.6% 4.8% 8.8% 2.6% 0.4% 0.0% 0.1% 17.3% 802
1.1 - 1.4 0.0% 0.2% 1.2% 2.8% 6.9% 1.6% 0.4% 0.3% 13.3% 618
1.4 - 1.7 0.0% 0.0% 0.2% 0.5% 1.4% 2.5% 0.8% 0.5% 6.0% 280
1.7 - 2.0 0.0% 0.1% 0.0% 0.0% 0.1% 0.7% 1.0% 0.7% 2.7% 126
2.0+ 0.0% 0.0% 0.1% 0.1% 0.2% 0.4% 0.5% 6.8% 8.3% 387
Totals
% 8.8% 17.9% 28.9% 15.2% 12.0% 5.8% 2.9% 8.5%
# 407 833 1343 707 558 270 133 395 4,646 11%
Diag. 17% 65%
Table A.4: Cross-Tabulation for MEG, Frequency-Weighted vs. Cost-Weighted Scores
Range of Scores Expected-cost-per-episode weighting Composite Scores Totals
0 - 0.3 0.3 - 0.6 0.6 - 0.9 0.9 - 1.1 1.1 - 1.4 1.4 - 1.7 1.7 - 2.0 2.0+ % # Diag.
Baseline:
Frequency
-weighted
Composite
Scores
0 - 0.3 7.8% 0.3% 0.0% 0.0% 0.0% 0.0% 0.0% 0.0% 8.2% 379
0.3 - 0.6 2.2% 14.0% 1.3% 0.1% 0.0% 0.0% 0.0% 0.0% 17.6% 816
0.6 - 0.9 0.5% 5.5% 18.7% 2.5% 0.8% 0.2% 0.1% 0.1% 28.3% 1315
0.9 - 1.1 0.0% 0.6% 3.7% 8.4% 2.8% 0.4% 0.2% 0.0% 16.1% 745
1.1 - 1.4 0.1% 0.2% 1.1% 2.0% 6.8% 1.4% 0.3% 0.2% 11.9% 554
1.4 - 1.7 0.0% 0.1% 0.2% 0.4% 1.0% 2.7% 0.7% 0.6% 5.8% 269
1.7 - 2.0 0.0% 0.0% 0.0% 0.2% 0.2% 0.3% 1.4% 0.9% 3.1% 145
2.0+ 0.0% 0.0% 0.1% 0.1% 0.2% 0.4% 0.5% 7.7% 9.0% 418
Totals
% 10.6% 20.7% 25.1% 13.7% 11.9% 5.3% 3.3% 9.5%
# 494 961 1163 636 552 245 151 439 4,641 10%
Diag. 15% 68%
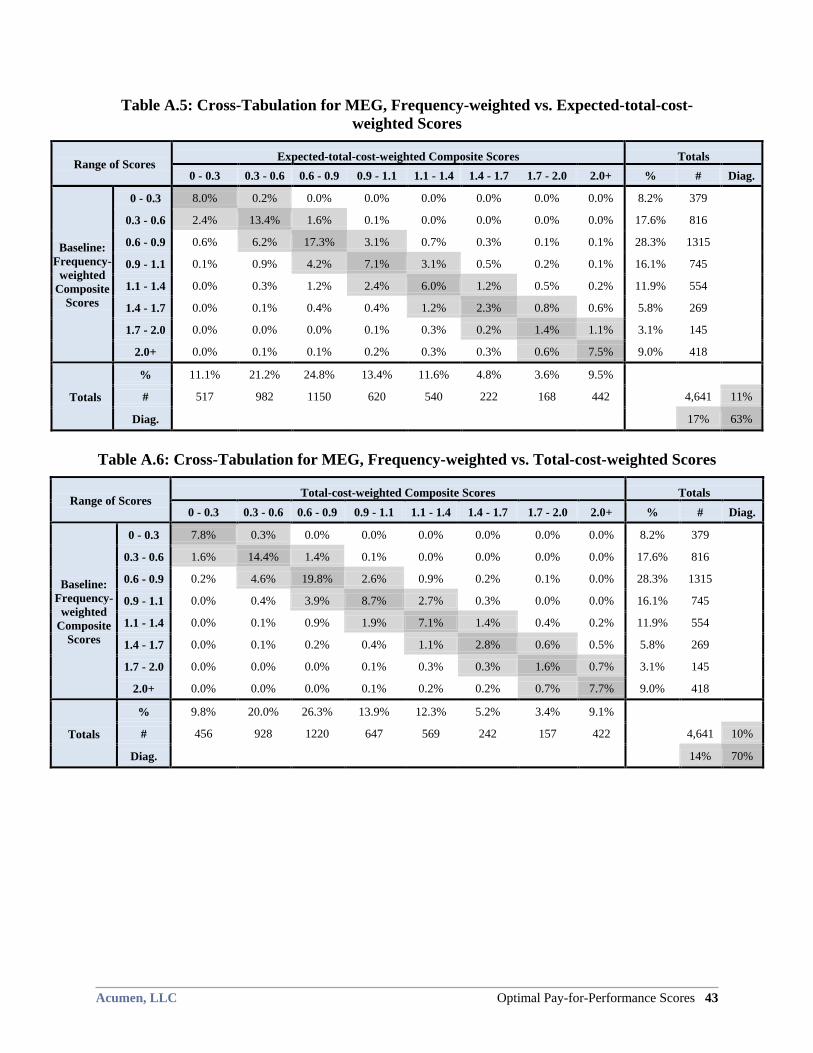
Acumen, LLC Optimal Pay-for-Performance Scores 43
Table A.5: Cross-Tabulation for MEG, Frequency-weighted vs. Expected-total-cost-
weighted Scores
Range of Scores Expected-total-cost-weighted Composite Scores Totals
0 - 0.3 0.3 - 0.6 0.6 - 0.9 0.9 - 1.1 1.1 - 1.4 1.4 - 1.7 1.7 - 2.0 2.0+ % # Diag.
Baseline:
Frequency-
weighted
Composite
Scores
0 - 0.3 8.0% 0.2% 0.0% 0.0% 0.0% 0.0% 0.0% 0.0% 8.2% 379
0.3 - 0.6 2.4% 13.4% 1.6% 0.1% 0.0% 0.0% 0.0% 0.0% 17.6% 816
0.6 - 0.9 0.6% 6.2% 17.3% 3.1% 0.7% 0.3% 0.1% 0.1% 28.3% 1315
0.9 - 1.1 0.1% 0.9% 4.2% 7.1% 3.1% 0.5% 0.2% 0.1% 16.1% 745
1.1 - 1.4 0.0% 0.3% 1.2% 2.4% 6.0% 1.2% 0.5% 0.2% 11.9% 554
1.4 - 1.7 0.0% 0.1% 0.4% 0.4% 1.2% 2.3% 0.8% 0.6% 5.8% 269
1.7 - 2.0 0.0% 0.0% 0.0% 0.1% 0.3% 0.2% 1.4% 1.1% 3.1% 145
2.0+ 0.0% 0.1% 0.1% 0.2% 0.3% 0.3% 0.6% 7.5% 9.0% 418
Totals
% 11.1% 21.2% 24.8% 13.4% 11.6% 4.8% 3.6% 9.5%
# 517 982 1150 620 540 222 168 442
4,641 11%
Diag.
17% 63%
Table A.6: Cross-Tabulation for MEG, Frequency-weighted vs. Total-cost-weighted Scores
Range of Scores Total-cost-weighted Composite Scores Totals
0 - 0.3 0.3 - 0.6 0.6 - 0.9 0.9 - 1.1 1.1 - 1.4 1.4 - 1.7 1.7 - 2.0 2.0+ % # Diag.
Baseline:
Frequency-
weighted
Composite
Scores
0 - 0.3 7.8% 0.3% 0.0% 0.0% 0.0% 0.0% 0.0% 0.0% 8.2% 379
0.3 - 0.6 1.6% 14.4% 1.4% 0.1% 0.0% 0.0% 0.0% 0.0% 17.6% 816
0.6 - 0.9 0.2% 4.6% 19.8% 2.6% 0.9% 0.2% 0.1% 0.0% 28.3% 1315
0.9 - 1.1 0.0% 0.4% 3.9% 8.7% 2.7% 0.3% 0.0% 0.0% 16.1% 745
1.1 - 1.4 0.0% 0.1% 0.9% 1.9% 7.1% 1.4% 0.4% 0.2% 11.9% 554
1.4 - 1.7 0.0% 0.1% 0.2% 0.4% 1.1% 2.8% 0.6% 0.5% 5.8% 269
1.7 - 2.0 0.0% 0.0% 0.0% 0.1% 0.3% 0.3% 1.6% 0.7% 3.1% 145
2.0+ 0.0% 0.0% 0.0% 0.1% 0.2% 0.2% 0.7% 7.7% 9.0% 418
Totals
% 9.8% 20.0% 26.3% 13.9% 12.3% 5.2% 3.4% 9.1%
# 456 928 1220 647 569 242 157 422
4,641 10%
Diag.
14% 70%
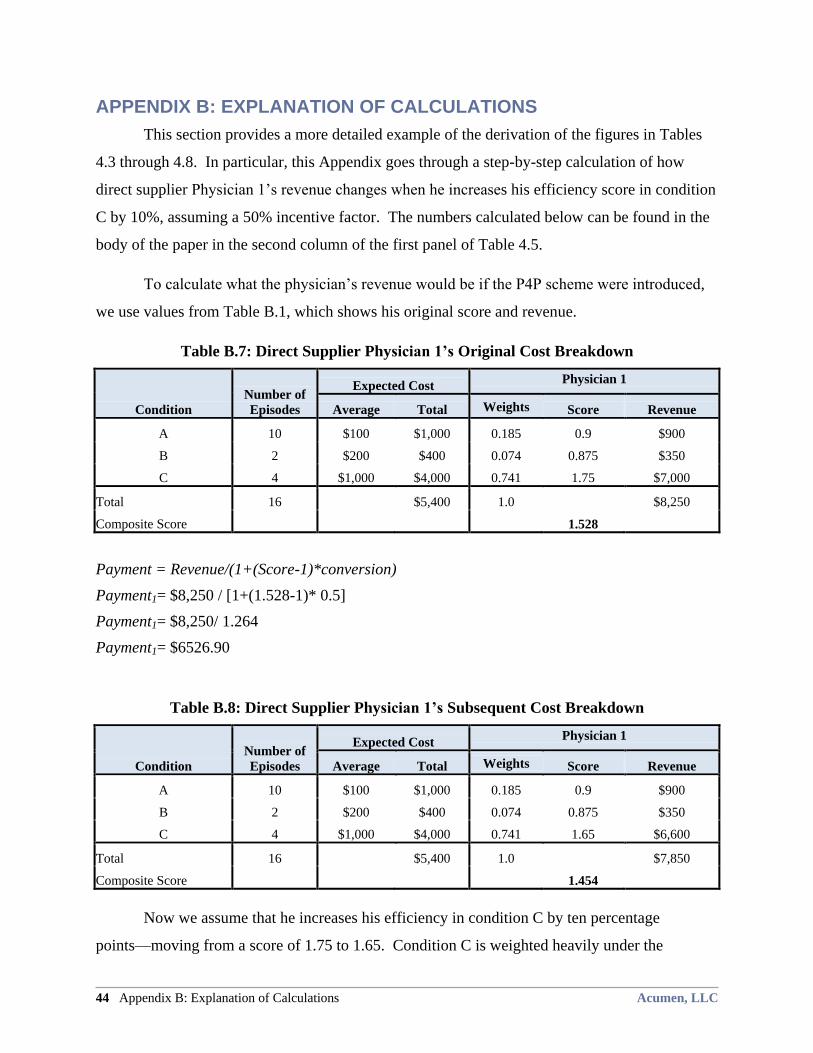
44 Appendix B: Explanation of Calculations Acumen, LLC
APPENDIX B: EXPLANATION OF CALCULATIONS
This section provides a more detailed example of the derivation of the figures in Tables
4.3 through 4.8. In particular, this Appendix goes through a step-by-step calculation of how
direct supplier Physician 1’s revenue changes when he increases his efficiency score in condition
C by 10%, assuming a 50% incentive factor. The numbers calculated below can be found in the
body of the paper in the second column of the first panel of Table 4.5.
To calculate what the physician’s revenue would be if the P4P scheme were introduced,
we use values from Table B.1, which shows his original score and revenue.
Table B.7: Direct Supplier Physician 1’s Original Cost Breakdown
Condition
Number of
Episodes
Expected Cost Physician 1
Average Total Weights Score Revenue
A 10 $100 $1,000 0.185 0.9 $900
B 2 $200 $400 0.074 0.875 $350
C 4 $1,000 $4,000 0.741 1.75 $7,000
Total 16 $5,400 1.0 $8,250
Composite Score 1.528
Payment = Revenue/(1+(Score-1)*conversion)
Payment1= $8,250 / [1+(1.528-1)* 0.5]
Payment1= $8,250/ 1.264
Payment1= $6526.90
Table B.8: Direct Supplier Physician 1’s Subsequent Cost Breakdown
Condition
Number of
Episodes
Expected Cost Physician 1
Average Total Weights Score Revenue
A 10 $100 $1,000 0.185 0.9 $900
B 2 $200 $400 0.074 0.875 $350
C 4 $1,000 $4,000 0.741 1.65 $6,600
Total 16 $5,400 1.0 $7,850
Composite Score 1.454
Now we assume that he increases his efficiency in condition C by ten percentage
points—moving from a score of 1.75 to 1.65. Condition C is weighted heavily under the
Acumen, LLC Optimal Pay-for-Performance Scores 45
expected-total-cost scheme, so this leads to a change of overall score from 1.528 to 1.454, as
seen in Table B.2. Using his new composite score, we calculate what his new payment from
Medicare would be. Although he improves his efficiency score, which increases his bonus, he
also loses revenue in the process.
Payment2 = $7,850/ [1+(1.454-1)0*0.5]
Payment2 = $7,850/1.227
Payment2 = $6397.72
ChangeinPayment = Payment2 – Payment1
ChangeinPayment = $6397.72- $6526.90
ChangeinPayment = -$129.18
%ChangeinPayment = (Payment2 – Payment1)/ Payment1
%ChangeinPayment = $6397.72- $6526.90/ $6526.90
%ChangeinPayment = -1.98%