Embed Size (px)
Citation preview
Optimal methods approaches in Existing Data: Lessons from
OMOP and OHDSI communities
Patrick Ryan, PhDJanssen Research and DevelopmentColumbia University Medical Center
19 October 2016
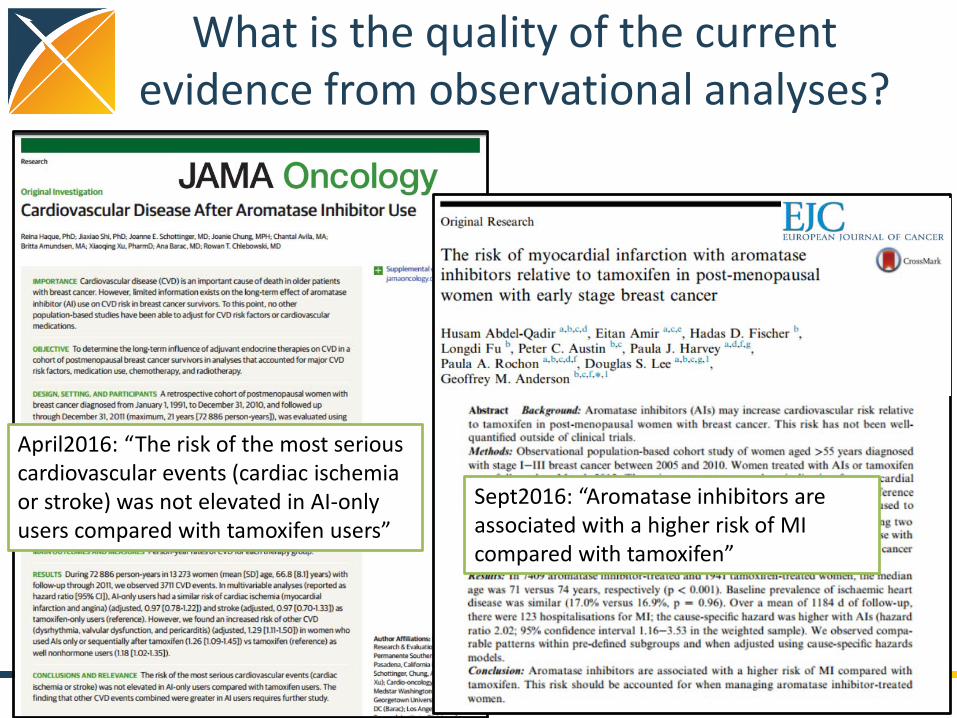
April2016: “The risk of the most serious cardiovascular events (cardiac ischemia or stroke) was not elevated in AI-only users compared with tamoxifen users”
What is the quality of the current evidence from observational analyses?
2
Sept2016: “Aromatase inhibitors are associated with a higher risk of MI compared with tamoxifen”


How do you judge what is a ‘good’ observational analysis?
• Validity of pre-specified protocol?
• Choice of study design?• Selection of database?• Quality of research team?• Precision of confidence
interval?
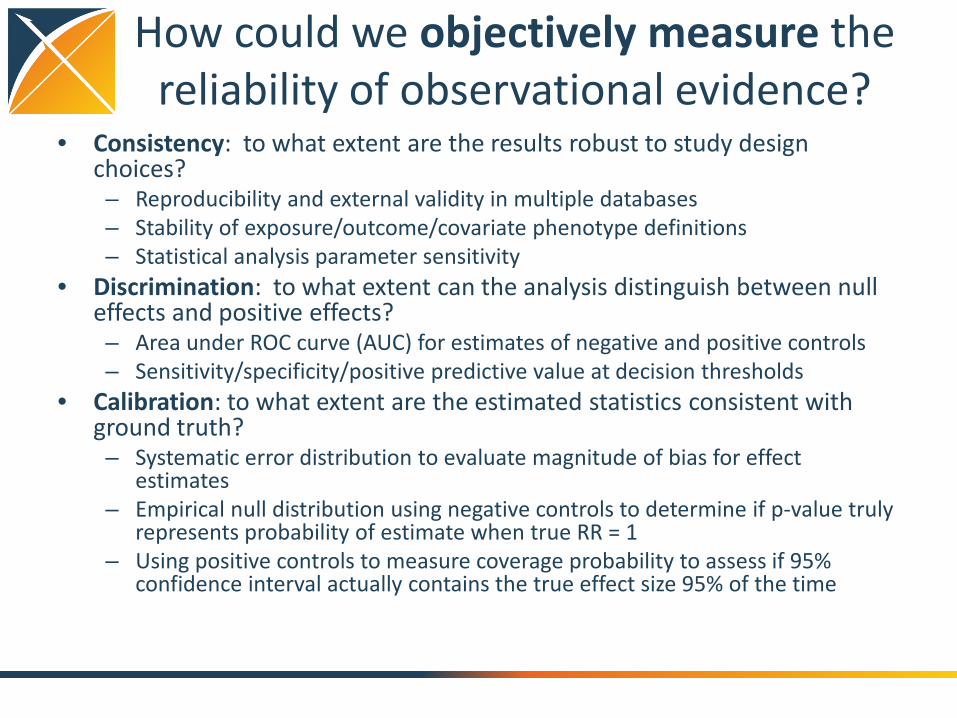
How could we objectively measure the reliability of observational evidence?
• Consistency: to what extent are the results robust to study design choices?– Reproducibility and external validity in multiple databases– Stability of exposure/outcome/covariate phenotype definitions – Statistical analysis parameter sensitivity
• Discrimination: to what extent can the analysis distinguish between null effects and positive effects?– Area under ROC curve (AUC) for estimates of negative and positive controls– Sensitivity/specificity/positive predictive value at decision thresholds
• Calibration: to what extent are the estimated statistics consistent with ground truth?– Systematic error distribution to evaluate magnitude of bias for effect
estimates– Empirical null distribution using negative controls to determine if p-value truly
represents probability of estimate when true RR = 1– Using positive controls to measure coverage probability to assess if 95%
confidence interval actually contains the true effect size 95% of the time
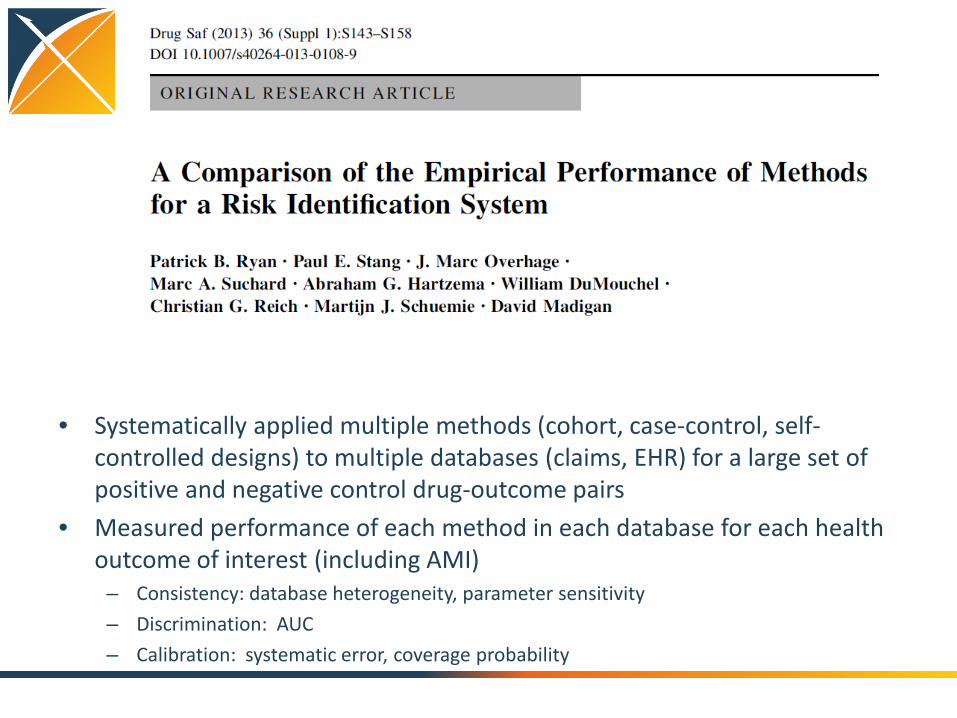
• Systematically applied multiple methods (cohort, case-control, self-controlled designs) to multiple databases (claims, EHR) for a large set of positive and negative control drug-outcome pairs
• Measured performance of each method in each database for each health outcome of interest (including AMI)
– Consistency: database heterogeneity, parameter sensitivity– Discrimination: AUC– Calibration: systematic error, coverage probability

Performance of analysis varies by database and outcome, but self-controlled designs showed
highest discrimination for AMI
Ryan et al, Drug Safety 2013

Lessons from the OMOP experiments
1. Database heterogeneity:Holding analysis constant, different data may yield different estimates
2. Parameter sensitivity:Holding data constant, different analytic design choices may yield different estimates
3. Empirical performance:Most observational methods do not have nominal statistical operating characteristics
4. Empirical calibration can help restore interpretation of study findings
Madigan D, Ryan PB, Schuemie MJ et al, American Journal of Epidemiology, 2013“Evaluating the Impact of Database Heterogeneity on Observational Study Results”
Madigan D, Ryan PB, Scheumie MJ, Therapeutic Advances in Drug Safety, 2013: “Does design matter? Systematic evaluation of the impact of analytical choices on effect estimates in observational studies”
Ryan PB, Stang PE, Overhage JM et al, Drug Safety, 2013: “A Comparison of the Empirical Performance of Methods for a Risk Identification System”
Schuemie MJ, Ryan PB, DuMouchel W, et al, Statistics in Medicine, 2013:“Interpreting observational studies: why empirical calibration is needed to correct p-values”

OHDSI best practices for population-level effect estimation
EvidenceGeneration
• Write and share protocol
• Open source study code
• Use validated software
• Replicate across databases
EvidenceEvaluation
• Produce standard diagnostics
• Include negative controls
• Create positive controls
• Calibrate confidence interval and p-value
EvidenceDissemination
• Don’t provide only the effect estimate
• Also share protocol, study code, diagnostics and evaluation
• Produce evidence at scale

Methodological researchOpen-source
analytics development
Clinical applications
Observational data management
Population-level estimation
Patient-level prediction
• Data quality assessment• Common Data Model evaluation• ATHENA for standardized
vocabularies
• WhiteRabbit for CDM ETL• Usagi for code mapping• Vocabulary exploration• Database profiling
• CohortMethod• SelfControlledCaseSeries• SelfControlledCohort• TemporalPatternDiscovery
• PatientLevelPrediction• APHRODITE for predictive
phenotyping
• Empirical calibration• LAERTES for evidence synthesis
• PENELOPE for patient-centered product labeling
• Chronic disease therapy pathways
• Large-scale causality assessment
Clinical characterization
• Standardized cohort definition• Study feasibility assessment• Cohort characterization
• Phenotype evaluation
• Evaluation framework and benchmarking
OHDSI’s collaborative journey to reliable evidence generation
Anal
ytic
al u
se c
ase What is an ‘optimal’ method for population-level effect
estimation in observational data?
Any approach that is transparent, fully reproducible, and empirically demonstrated across multiple databases to discriminate between true effects with unbiased and well-calibrated estimates.

Join the journey
http://ohdsi.org