Embed Size (px)
Citation preview

69
OptimalDebtRatioforayoung,growthfirm:Baidu
Aswath Damodaran
The optimal debt ratio for Baidu is between 0 and 10%, close to its current debt ratio of 5.23%, and much lower than the optimal debt ratios computed for Disney, Vale and Tata Motors.

70
ExtensiontoaprivatebusinessOptimalDebtRatioforBookscape
Aswath Damodaran
The firm value is maximized (and the cost of capital is minimized) at a debt ratio of 30%. At its existing debt ratio of 27.81%, Bookscape is at its optimal.
Debt value of leases = $12,136 million (only debt)Estimated market value of equity = Net Income * Average PE for Publicly Traded Book Retailers = 1.575 * 20 = $31.5 million Debt ratio = 12,136/(12,136+31,500) = 27.81%
71
LimitationsoftheCostofCapitalapproach
Aswath Damodaran
71
¨ Itisstatic:Themostcriticalnumberintheentireanalysisistheoperatingincome.Ifthatchanges,theoptimaldebtratiowillchange.
¨ Itignoresindirectbankruptcycosts:Theoperatingincomeisassumedtostayfixedasthedebtratioandtheratingchanges.
¨ BetaandRatings:Itisbaseduponrigidassumptionsofhowmarketriskanddefaultriskgetborneasthefirmborrowsmoremoneyandtheresultingcosts.
72
II.EnhancedCostofCapitalApproach
Aswath Damodaran
72
¨ Distresscostaffectedoperatingincome:Intheenhancedcostofcapitalapproach,theindirectcostsofbankruptcyarebuiltintotheexpectedoperatingincome.Astheratingofthefirmdeclines,theoperatingincomeisadjustedtoreflectthelossinoperatingincomethatwilloccurwhencustomers,suppliersandinvestorsreact.
¨ Dynamicanalysis:Ratherthanlookatasinglenumberforoperatingincome,youcandrawfromadistributionofoperatingincome(thusallowingfordifferentoutcomes).

73
EstimatingtheDistressEffect- Disney
Aswath Damodaran
73
Rating Drop in EBITDA (Low)
Drop in EBITDA (Medium)
Drop in EBITDA (High)
To A No effect No effect 2.00% To A- No effect 2.00% 5.00% To BBB 5.00% 10.00% 15.00% To BB+ 10.00% 20.00% 25.00% To B- 15.00% 25.00% 30.00% To C 25.00% 40.00% 50.00% To D 30.00% 50.00% 100.00%
74
TheOptimalDebtRatiowithIndirectBankruptcyCosts
Aswath Damodaran
74
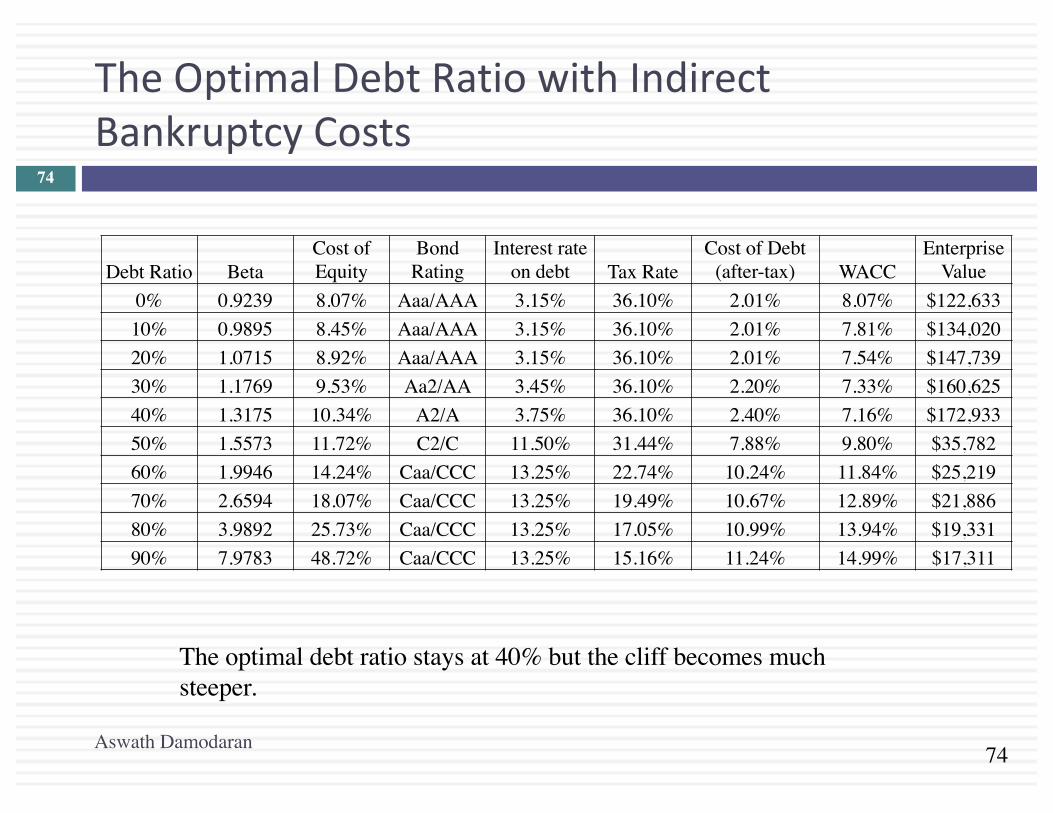
The optimal debt ratio stays at 40% but the cliff becomes much steeper.
Debt Ratio BetaCost of Equity
Bond Rating
Interest rate on debt Tax Rate
Cost of Debt (after-tax) WACC
Enterprise Value
0% 0.9239 8.07% Aaa/AAA 3.15% 36.10% 2.01% 8.07% $122,633 10% 0.9895 8.45% Aaa/AAA 3.15% 36.10% 2.01% 7.81% $134,020 20% 1.0715 8.92% Aaa/AAA 3.15% 36.10% 2.01% 7.54% $147,739 30% 1.1769 9.53% Aa2/AA 3.45% 36.10% 2.20% 7.33% $160,625 40% 1.3175 10.34% A2/A 3.75% 36.10% 2.40% 7.16% $172,933 50% 1.5573 11.72% C2/C 11.50% 31.44% 7.88% 9.80% $35,782 60% 1.9946 14.24% Caa/CCC 13.25% 22.74% 10.24% 11.84% $25,219 70% 2.6594 18.07% Caa/CCC 13.25% 19.49% 10.67% 12.89% $21,886 80% 3.9892 25.73% Caa/CCC 13.25% 17.05% 10.99% 13.94% $19,331 90% 7.9783 48.72% Caa/CCC 13.25% 15.16% 11.24% 14.99% $17,311

75
ExtendingthisapproachtoanalyzingFinancialServiceFirms
Aswath Damodaran
75
¨ Interestcoverageratiospreads,whicharecriticalindeterminingthebondratings,havetobeestimatedseparatelyforfinancialservicefirms;applyingmanufacturingcompanyspreadswillresultinabsurdlylowratingsforeventhesafestbanksandverylowoptimaldebtratios.
¨ Itisdifficulttoestimatethedebtonafinancialservicecompany’sbalancesheet.Giventhemixofdeposits,repurchaseagreements,short-termfinancing,andotherliabilitiesthatmayappearonafinancialservicefirm’sbalancesheet,onesolutionistofocusonlyonlong-termdebt,definedtightly,andtouseinterestcoverageratiosdefinedusingonlylong-terminterestexpenses.
¨ Financialservicefirmsareregulatedandhavetomeetcapitalratiosthataredefinedintermsofbookvalue.If,intheprocessofmovingtoanoptimalmarketvaluedebtratio,thesefirmsviolatethebookcapitalratios,theycouldputthemselvesinjeopardy.

76
CapitalStructureforabank:ARegulatoryCapitalApproach¨ Considerabankwith$100millioninloansoutstandingandabookvalueof
equityof$6million.Furthermore,assumethattheregulatoryrequirementisthatequitycapitalbemaintainedat5%ofloansoutstanding.Finally,assumethatthisbankwantstoincreaseitsloanbaseby$50millionto$150millionandtoaugmentitsequitycapitalratioto7%ofloansoutstanding.LoansoutstandingafterExpansion =$150millionEquityafterexpansion =7%of$150 =$10.5millionExistingEquity =$6.0millionNewEquityneeded =$4.5million
¨ Yourneedfor“external”equityasabank/financialservicecompanywilldependupona.Yourgrowthrate:Highergrowth->Moreexternalequityb.ExistingcapitalizationvsTargetcapitalization:Undercapitalized->Moreexternalequityc.Currentearnings:Lessearnings->Moreexternalequityd.Currentdividends:Moredividends->Moreexternalequity
Aswath Damodaran

77
DeutscheBank’sFinancialMix
Current 1 2 3 4 5Asset Base 439,851 € 453,047 € 466,638 € 480,637 € 495,056 € 509,908 €Capital ratio 15.13% 15.71% 16.28% 16.85% 17.43% 18.00%Tier 1 Capital 66,561 € 71,156 € 75,967 € 81,002 € 86,271 € 91,783 €Change in regulatory capital 4,595 € 4,811 € 5,035 € 5,269 € 5,512 €Book Equity 76,829 € 81,424 € 86,235 € 91,270 € 96,539 € 102,051 €
ROE -1.08% 0.74% 2.55% 4.37% 6.18% 8.00%Net Income -716 € 602 € 2,203 € 3,988 € 5,971 € 8,164 €- Investment in Regulatory Capital 4,595 € 4,811 € 5,035 € 5,269 € 5,512 €FCFE -3,993 € -2,608 € -1,047 € 702 € 2,652 €
Aswath Damodaran
77
The cumulative FCFE over the next 5 years is -4,294 million Euros. Clearly, it does not make the sense to pay dividends or buy back stock.

78
FinancingStrategiesforafinancialinstitution
Aswath Damodaran
78
¨ TheRegulatoryminimumstrategy:Inthisstrategy,financialservicefirmstrytostaywiththebareminimumequitycapital,asrequiredbytheregulatoryratios.Inthemostaggressiveversionsofthisstrategy,firmsexploitloopholesintheregulatoryframeworktoinvestinthosebusinesseswhereregulatorycapitalratiosaresettoolow(relativetotheriskofthesebusinesses).
¨ TheSelf-regulatorystrategy:Theobjectiveforabankraisingequityisnottomeetregulatorycapitalratiosbuttoensurethatlossesfromthebusinesscanbecoveredbytheexistingequity.Ineffect,financialservicefirmscanassesshowmuchequitytheyneedtoholdbyevaluatingtheriskinessoftheirbusinessesandthepotentialforlosses.
¨ Combinationstrategy:Inthisstrategy,theregulatorycapitalratiosoperateasafloorforestablishedbusinesses,withthefirmaddingbuffersforsafetywhereneeded..

79
DeterminantsoftheOptimalDebtRatio:1.Themarginaltaxrate
Aswath Damodaran
79
¨ Theprimarybenefitofdebtisataxbenefit.Thehigherthemarginaltaxrate,thegreaterthebenefittoborrowing:
80
2.Pre-taxCashflowReturn
Aswath Damodaran
80
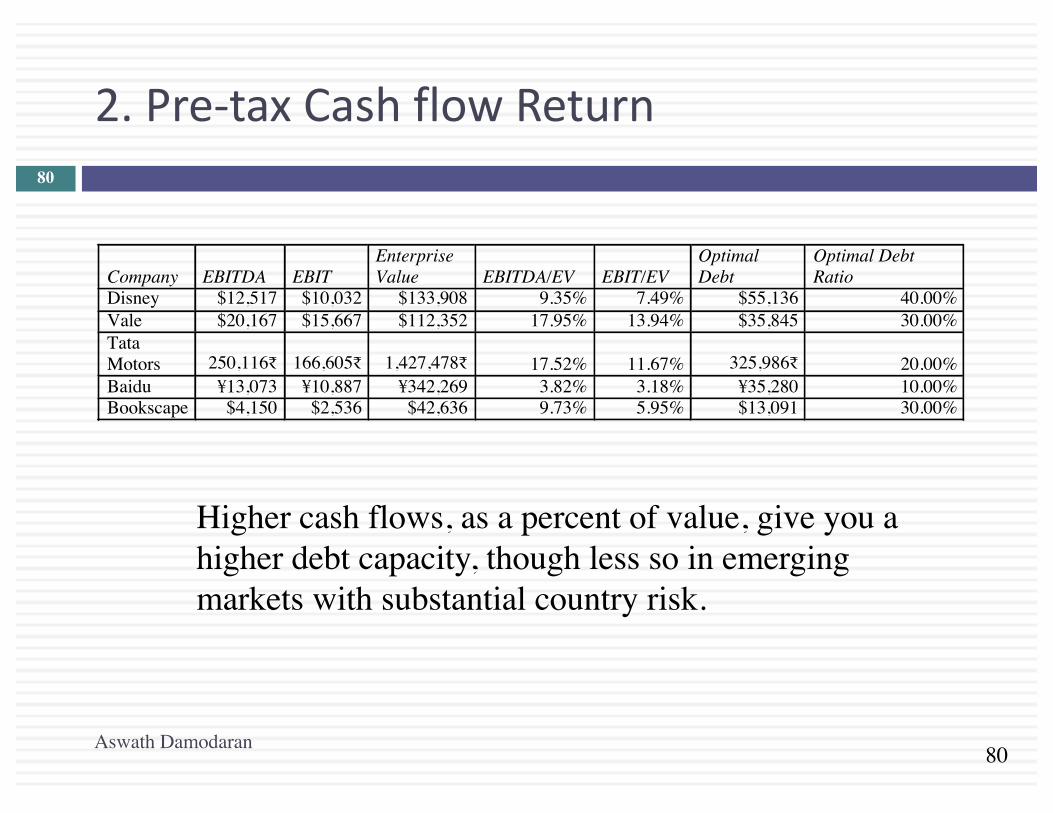
Company EBITDA EBIT Enterprise Value EBITDA/EV EBIT/EV
Optimal Debt
Optimal Debt Ratio
Disney $12,517 $10,032 $133,908 9.35% 7.49% $55,136 40.00% Vale $20,167 $15,667 $112,352 17.95% 13.94% $35,845 30.00% Tata Motors 250,116₹ 166,605₹ 1,427,478₹ 17.52% 11.67% 325,986₹ 20.00% Baidu ¥13,073 ¥10,887 ¥342,269 3.82% 3.18% ¥35,280 10.00% Bookscape $4,150 $2,536 $42,636 9.73% 5.95% $13,091 30.00%
Higher cash flows, as a percent of value, give you a higher debt capacity, though less so in emerging markets with substantial country risk.

81
3.OperatingRisk
Aswath Damodaran
81
¨ Firmsthatfacemoreriskoruncertaintyintheiroperations(andmorevariableoperatingincomeasaconsequence)willhaveloweroptimaldebtratiosthanfirmsthathavemorepredictableoperations.
¨ Operatingriskentersthecostofcapitalapproachintwoplaces:¤ Unleveredbeta:Firmsthatfacemoreoperatingriskwilltendtohavehigherunleveredbetas.Astheyborrow,debtwillmagnifythisalreadylargeriskandpushupcostsofequitymuchmoresteeply.
¤ Bondratings:Foranygivenlevelofoperatingincome,firmsthatfacemoreriskinoperationswillhavelowerratings.Theratingsarebaseduponnormalizedincome.

82
4.Theonlymacrodeterminant:EquityvsDebtRiskPremiums
Aswath Damodaran
82
0.00
1.00
2.00
3.00
4.00
5.00
6.00
7.00
8.00
9.00
0.00%
1.00%
2.00%
3.00%
4.00%
5.00%
6.00%
7.00%
1960
1962
1964
1966
1968
1970
1972
1974
1976
1978
1980
1982
1984
1986
1988
1990
1992
1994
1996
1998
2000
2002
2004
2006
2008
2010
2012
2014
2016
ERP
/ Baa
Spr
ead
Pre
miu
m (
Sp
read
)
Equity Risk Premiums and Bond Default Spreads
ERP/Baa Spread Baa - T.Bond Rate ERP
AverageERP/Baa Spreadduringperiod=2.02

83
6 ApplicationTest:Yourfirm’soptimalfinancingmix
Aswath Damodaran
83
¨ Usingtheoptimalcapitalstructurespreadsheetprovided:1. Estimatetheoptimaldebtratioforyourfirm2. Estimatethenewcostofcapitalattheoptimal3. Estimatetheeffectofthechangeinthecostofcapitalon
firmvalue4. Estimatetheeffectonthestockprice
¨ Intermsofthemechanics,whatwouldyouneedtodotogettotheoptimalimmediately?
84
III.TheAPVApproachtoOptimalCapitalStructure
Aswath Damodaran
84
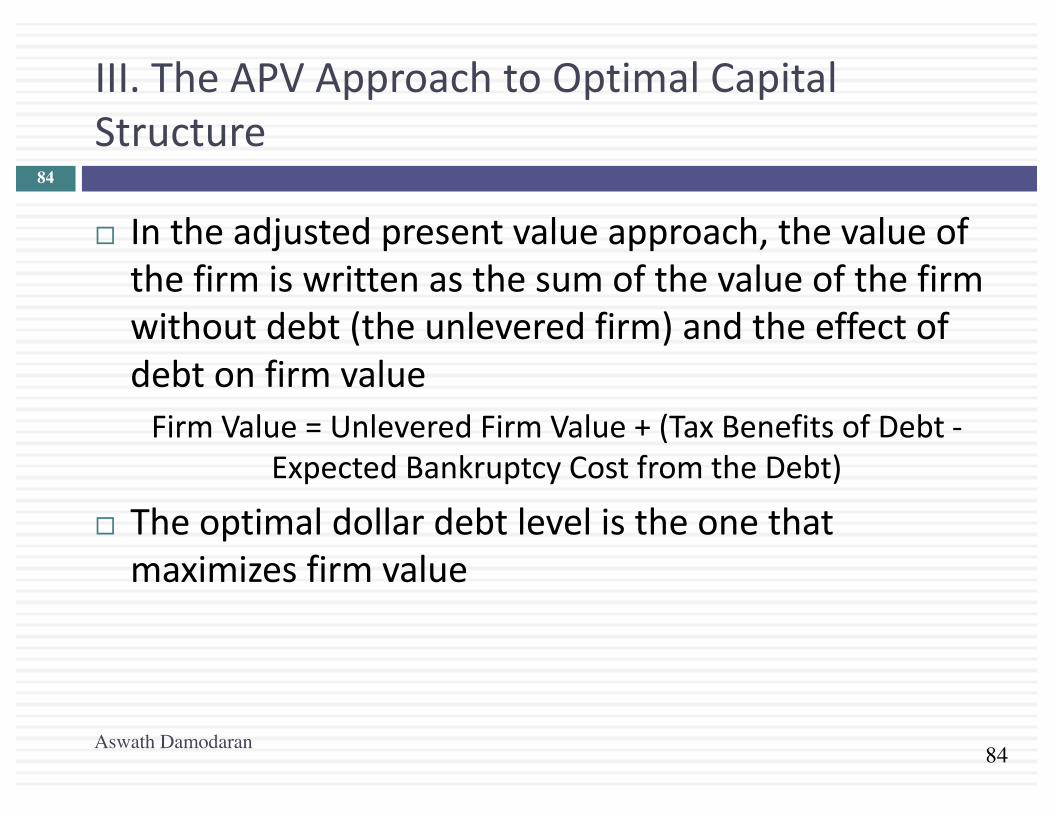
¨ Intheadjustedpresentvalueapproach,thevalueofthefirmiswrittenasthesumofthevalueofthefirmwithoutdebt(theunleveredfirm)andtheeffectofdebtonfirmvalueFirmValue=UnleveredFirmValue+(TaxBenefitsofDebt-
ExpectedBankruptcyCostfromtheDebt)
¨ Theoptimaldollardebtlevelistheonethatmaximizesfirmvalue

85
ImplementingtheAPVApproach
Aswath Damodaran
85
¨ Step1:Estimatetheunleveredfirmvalue.Thiscanbedoneinoneoftwoways:¤ Estimatingtheunleveredbeta,acostofequitybasedupontheunlevered
betaandvaluingthefirmusingthiscostofequity(whichwillalsobethecostofcapital,withanunleveredfirm)
¤ Alternatively,UnleveredFirmValue=CurrentMarketValueofFirm- TaxBenefitsofDebt(Current)+ExpectedBankruptcycostfromDebt
¨ Step2:Estimatethetaxbenefitsatdifferentlevelsofdebt.Thesimplestassumptiontomakeisthatthesavingsareperpetual,inwhichcase¤ Taxbenefits=DollarDebt*TaxRate
¨ Step3:Estimateaprobabilityofbankruptcyateachdebtlevel,andmultiplybythecostofbankruptcy(includingbothdirectandindirectcosts)toestimatetheexpectedbankruptcycost.

86
EstimatingExpectedBankruptcyCost
Aswath Damodaran
86
¨ ProbabilityofBankruptcy¤ Estimatethesyntheticratingthatthefirmwillhaveateachlevelof
debt¤ Estimatetheprobabilitythatthefirmwillgobankruptovertime,at
thatlevelofdebt(Usestudiesthathaveestimatedtheempiricalprobabilitiesofthisoccurringovertime- Altmandoesanupdateeveryyear)
¨ CostofBankruptcy¤ Thedirectbankruptcycostistheeasiercomponent.Itisgenerally
between5-10%offirmvalue,baseduponempiricalstudies¤ Theindirectbankruptcycostismuchtougher.Itshouldbehigherfor
sectorswhereoperatingincomeisaffectedsignificantlybydefaultrisk(likeairlines)andlowerforsectorswhereitisnot(likegroceries)
87
RatingsandDefaultProbabilities:ResultsfromAltmanstudyofbonds
Aswath Damodaran
87
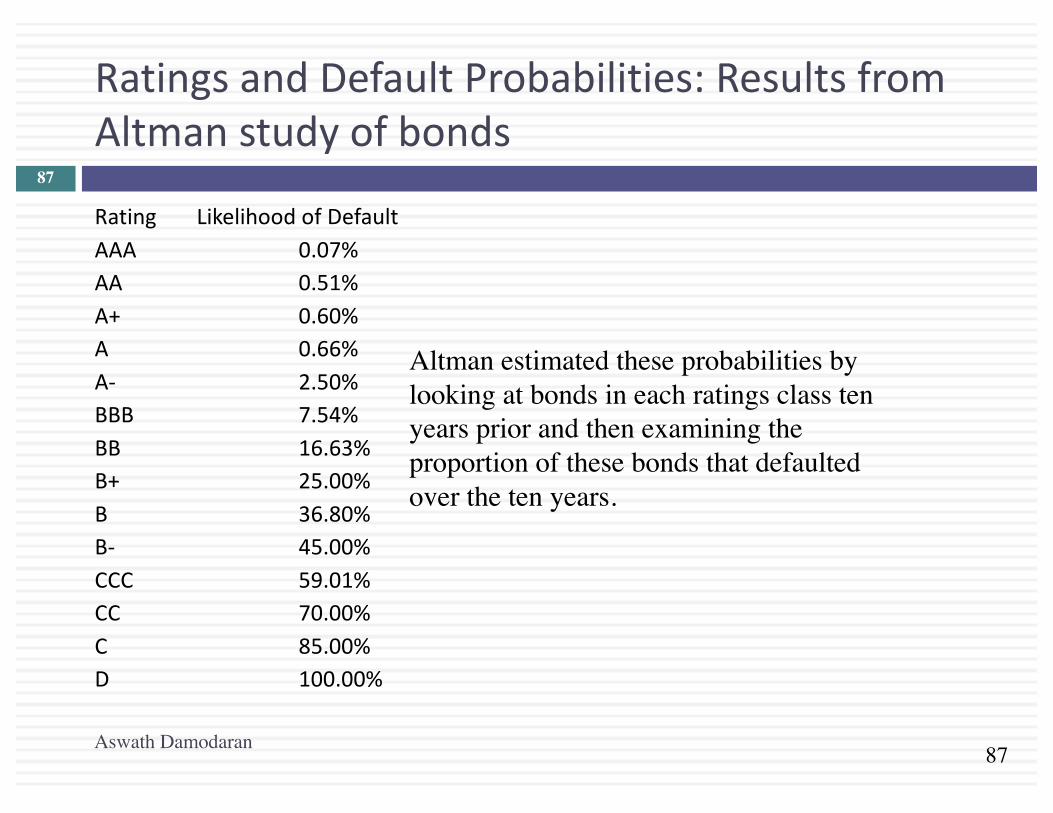
Rating LikelihoodofDefaultAAA 0.07%AA 0.51%A+ 0.60%A 0.66%A- 2.50%BBB 7.54%BB 16.63%B+ 25.00%B 36.80%B- 45.00%CCC 59.01%CC 70.00%C 85.00%D 100.00%
Altman estimated these probabilities by looking at bonds in each ratings class ten years prior and then examining the proportion of these bonds that defaulted over the ten years.

88
Disney:EstimatingUnleveredFirmValue
Aswath Damodaran
88
CurrentValueoffirm=$121,878+$15,961 =$137,839- TaxBenefitonCurrentDebt=$15,961*0.361 =$5,762+ExpectedBankruptcyCost=0.66%*(0.25*137,839)=$227UnleveredValueofFirm= =$132,304
¤ CostofBankruptcyforDisney=25%offirmvalue¤ ProbabilityofBankruptcy=0.66%,basedonfirm’scurrentratingofA
¤ TaxRate=36.1%

89
Disney:APVatDebtRatios
Aswath Damodaran
89
The optimal debt ratio is 40%, which is the point at which firm value is maximized.
Debt Ratio $ Debt Tax RateUnlevered Firm Value Tax Benefits Bond Rating
Probability of Default
Expected Bankruptcy
Cost
Value of Levered
Firm0% $0 36.10% $132,304 $0 AAA 0.07% $23 $132,281 10% $13,784 36.10% $132,304 $4,976 Aaa/AAA 0.07% $24 $137,256 20% $27,568 36.10% $132,304 $9,952 Aaa/AAA 0.07% $25 $142,231 30% $41,352 36.10% $132,304 $14,928 Aa2/AA 0.51% $188 $147,045 40% $55,136 36.10% $132,304 $19,904 A2/A 0.66% $251 $151,957 50% $68,919 36.10% $132,304 $24,880 B3/B- 45.00% $17,683 $139,501 60% $82,703 36.10% $132,304 $29,856 C2/C 59.01% $23,923 $138,238 70% $96,487 32.64% $132,304 $31,491 C2/C 59.01% $24,164 $139,631 80% $110,271 26.81% $132,304 $29,563 Ca2/CC 70.00% $28,327 $133,540 90% $124,055 22.03% $132,304 $27,332 Caa/CCC 85.00% $33,923 $125,713

90
IV.RelativeAnalysis
Aswath Damodaran
90
¨ The“safest” placeforanyfirmtobeisclosetotheindustryaverage
¨ Subjectiveadjustmentscanbemadetotheseaveragestoarriveattherightdebtratio.¤ Highertaxrates->Higherdebtratios(Taxbenefits)¤ Lowerinsiderownership->Higherdebtratios(Greaterdiscipline)
¤ Morestableincome->Higherdebtratios(Lowerbankruptcycosts)
¤ Moreintangibleassets->Lowerdebtratios(Moreagencyproblems)

91
Comparingtoindustryaverages
Aswath Damodaran
91
Debt to Capital Ratio
Net Debt to Capital Ratio Debt to Capital
Ratio Net Debt to Capital
Ratio
Company Book value
Market value
Book value
Market value
Comparable group
Book value
Market value
Book value
Market value
Disney 22.88% 11.58% 17.70% 8.98% US Entertainment 39.03% 15.44% 24.92% 9.93%
Vale 39.02% 35.48% 34.90% 31.38%
Global Diversified Mining & Iron Ore (Market cap> $1 b)
34.43% 26.03% 26.01% 17.90%
Tata Motors 58.51% 29.28% 22.44% 19.25%
Global Autos (Market Cap> $1 b)
35.96% 18.72% 3.53% 0.17%
Baidu 32.93% 5.23% 20.12% 2.32% Global Online Advertising 6.37% 1.83% -27.13% -2.76%

92
Gettingpastsimpleaverages
Aswath Damodaran
92
Step1:Runaregressionofdebtratiosonthevariablesthatyoubelievedeterminedebtratiosinthesector.Forexample,
DebtRatio=a+b(Taxrate)+c(EarningsVariability)+d(EBITDA/FirmValue)
Checkthisregressionforstatisticalsignificance(tstatistics)andpredictiveability(Rsquared)Step2:Estimatethevaluesoftheproxiesforthefirmunderconsideration.Pluggingintothecrosssectionalregression,wecanobtainanestimateofpredicteddebtratio.Step3:Comparetheactualdebtratiotothepredicteddebtratio.

93
ApplyingtheRegressionMethodology:GlobalAutoFirms
Aswath Damodaran
93
¨ Usingasampleof56globalautofirms,wearrivedatthefollowingregression:
Debttocapital=0.09+0.63(EffectiveTaxRate)+1.01(EBITDA/EnterpriseValue)- 0.93(CapEx/EnterpriseValue)¨ TheRsquaredoftheregressionis21%.ThisregressioncanbeusedtoarriveatapredictedvalueforTataMotorsof:
PredictedDebtRatio=0.09+0.63(0.252)+1.01(0.1167)- 0.93(0.1949)=.1854or18.54%¨ Baseduponthecapitalstructureofotherfirmsintheautomobileindustry,TataMotorsshouldhaveamarketvaluedebtratioof18.54%.Itisoverleveredatitsexistingdebtratioof29.28%.

94
Extendingtotheentiremarket
Aswath Damodaran
94
¨ Using2014dataforUSlistedfirms,welookedatthedeterminantsofthemarketdebttocapitalratio.Theregressionprovidesthefollowingresults–
DFR= 0.27- 0.24ETR-0.10g– 0.065INST-0.338CVOI+0.59E/V(15.79) (9.00) (2.71) (3.55) (3.10)(6.85)
DFR =Debt/(Debt+MarketValueofEquity)ETR=EffectivetaxrateinmostrecenttwelvemonthsINST=%ofSharesheldbyinstitutionsCVOI=StddevinOIinlast10years/AverageOIinlast10yearsE/V =EBITDA/(MarketValueofEquity+Debt- Cash)
TheregressionhasanR-squaredof8%.

95
ApplyingtheRegression
Aswath Damodaran
95
¨ Disneyhadthefollowingvaluesfortheseinputsin2014.Estimatetheoptimaldebtratiousingthedebtregression.EffectiveTaxRate(ETR) =31.02%ExpectedRevenueGrowth =6.45%InstitutionalHolding%(INST) =70.2%Coeff ofVariationinOI(CVOI) =0.0296EBITDA/Valueoffirm(E/V) =9.35%
OptimalDebtRatio=0.27- 0.24(.3102)-0.10(.0645)– 0.065(.702)-0.338(.0296)+0.59(.0935)=0.1886or18.86%¨ Whatdoesthisoptimaldebtratiotellyou?
¨ Whymightitbedifferentfromtheoptimalcalculatedusingtheweightedaveragecostofcapital?

96
Summarizingtheoptimaldebtratios…
Aswath Damodaran
96
Disney Vale Tata Motors Baidu
Actual Debt Ratio 11.58% 35.48% 29.28% 5.23%
Optimal
I. Operating income 35.00% — -
II. Standard Cost of capital 40.00% 30.00% (actual)
50.00% (normalized)
20.00% 10.00%
III. Enhanced Cost of Capital 40.00% 30.00% (actual)
40.00% (normalized)
10.00% 10.00%
IV. APV 40.00% 30.00% 20.00% 20.00%
V. Comparable
To industry 28.54% 26.03% 18.72% 1.83%
To market 18.86% — -