Embed Size (px)
Citation preview
A KTEC Center of Excellence 1
Optimal Communications Systems and Network Design for Cargo Monitoring
Daniel T. FokumPh.D. dissertation oral defense
Department of Electrical Engineering & Computer ScienceUniversity of KansasDecember 3, 2010

A KTEC Center of Excellence 2
Outline
• Acknowledgements• Introduction• Modeling• System Trade-offs• Heuristic• Conclusion• Questions?
A KTEC Center of Excellence 3
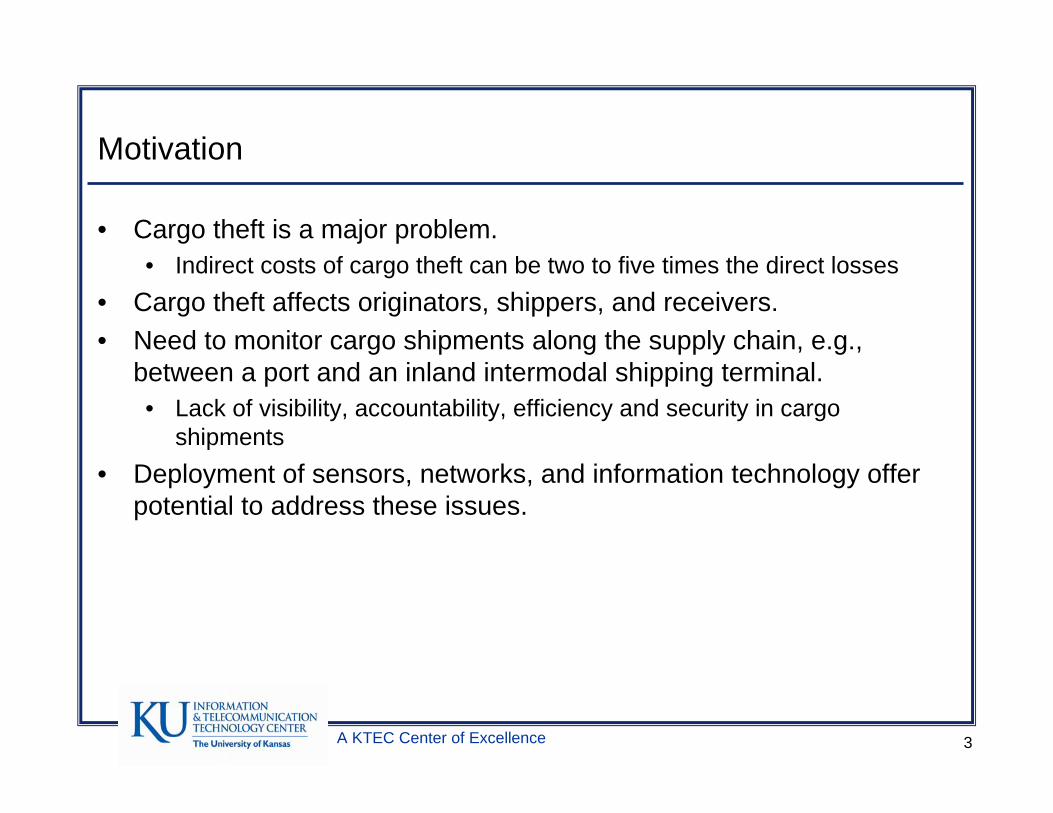
Motivation
• Cargo theft is a major problem.• Indirect costs of cargo theft can be two to five times the direct losses
• Cargo theft affects originators, shippers, and receivers.• Need to monitor cargo shipments along the supply chain, e.g.,
between a port and an inland intermodal shipping terminal.• Lack of visibility, accountability, efficiency and security in cargo
shipments• Deployment of sensors, networks, and information technology offer
potential to address these issues.
A KTEC Center of Excellence 4
Objectives
• Design the sensing, networks, and associated information technology systems to provide cost-effective visibility into shipments.
• Test viability of a transportation security sensor network for cargo monitoring
• Develop models to find the “best” system design including:• Communications network design• Locations for sensors in a rail-based sensor network.
• Determine system trade-offs when monitoring cargo in motion.• Guide the design of future cargo monitoring systems.
A KTEC Center of Excellence 5
New Definition of Visibility
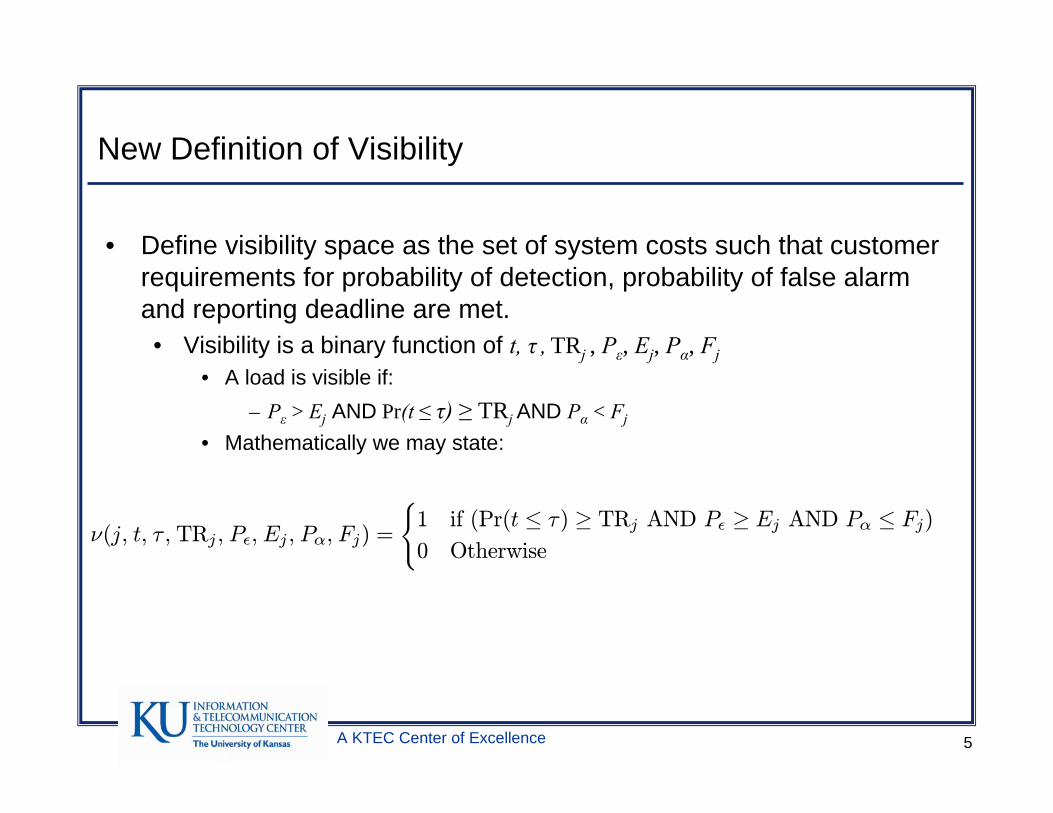
• Define visibility space as the set of system costs such that customer requirements for probability of detection, probability of false alarm and reporting deadline are met.• Visibility is a binary function of t, τ , TRj , Pε, Ej, Pα, Fj
• A load is visible if:– Pε > Ej AND Pr(t ≤ τ) ≥ TRj AND Pα < Fj
• Mathematically we may state:
ν(j, t, τ , TRj, P², Ej, Pα, Fj) =
(1 if (Pr(t ≤ τ) ≥ TRj AND P² ≥ Ej AND Pα ≤ Fj)0 Otherwise
A KTEC Center of Excellence 6
Problem Statement
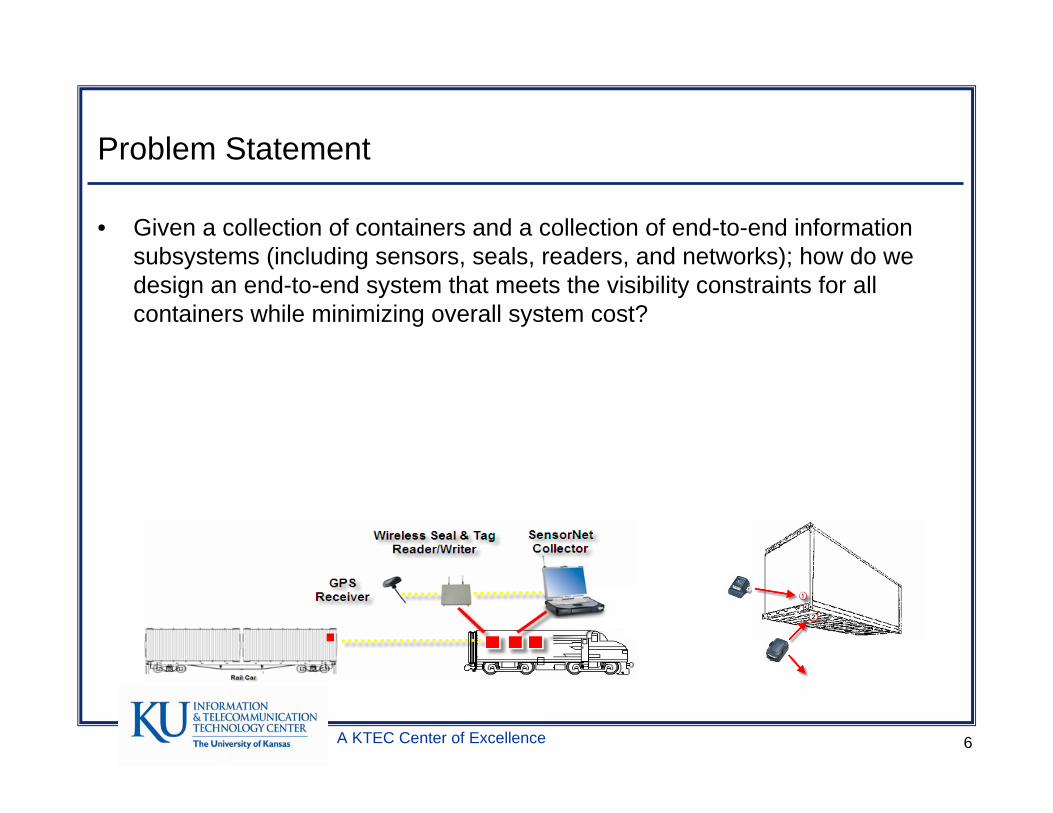
• Given a collection of containers and a collection of end-to-end information subsystems (including sensors, seals, readers, and networks); how do we design an end-to-end system that meets the visibility constraints for all containers while minimizing overall system cost?
A KTEC Center of Excellence 7
Problem Statement
• For rail scenario we may restate the problem as follows:1. How to map (analyze) a “system” description of containers on railcars,
train scenario and associated communications infrastructure into the visibility space? Thus, an appropriate system model needs to be developed.
2. How to assign a cost to every position in the visibility space?3. Use 1. and 2. to find minimum “cost” systems for providing visibility into
a rail shipment.4. Use 1. and 2. to determine important system trade-offs when seeking
visibility into rail shipments.
A KTEC Center of Excellence 8
Contributions
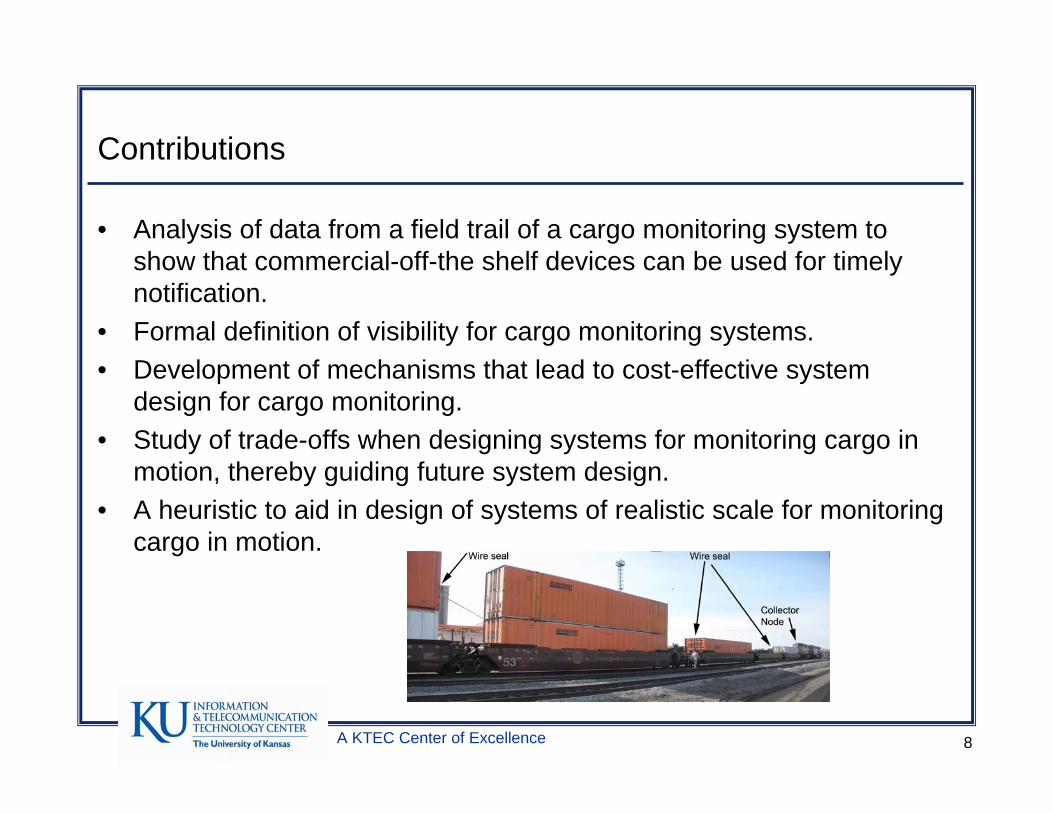
• Analysis of data from a field trail of a cargo monitoring system to show that commercial-off-the shelf devices can be used for timely notification.
• Formal definition of visibility for cargo monitoring systems.• Development of mechanisms that lead to cost-effective system
design for cargo monitoring.• Study of trade-offs when designing systems for monitoring cargo in
motion, thereby guiding future system design.• A heuristic to aid in design of systems of realistic scale for monitoring
cargo in motion.

A KTEC Center of Excellence 9
Outline
• Acknowledgements• Introduction• Modeling• System Trade-offs• Heuristic• Conclusion• Questions?
A KTEC Center of Excellence 10
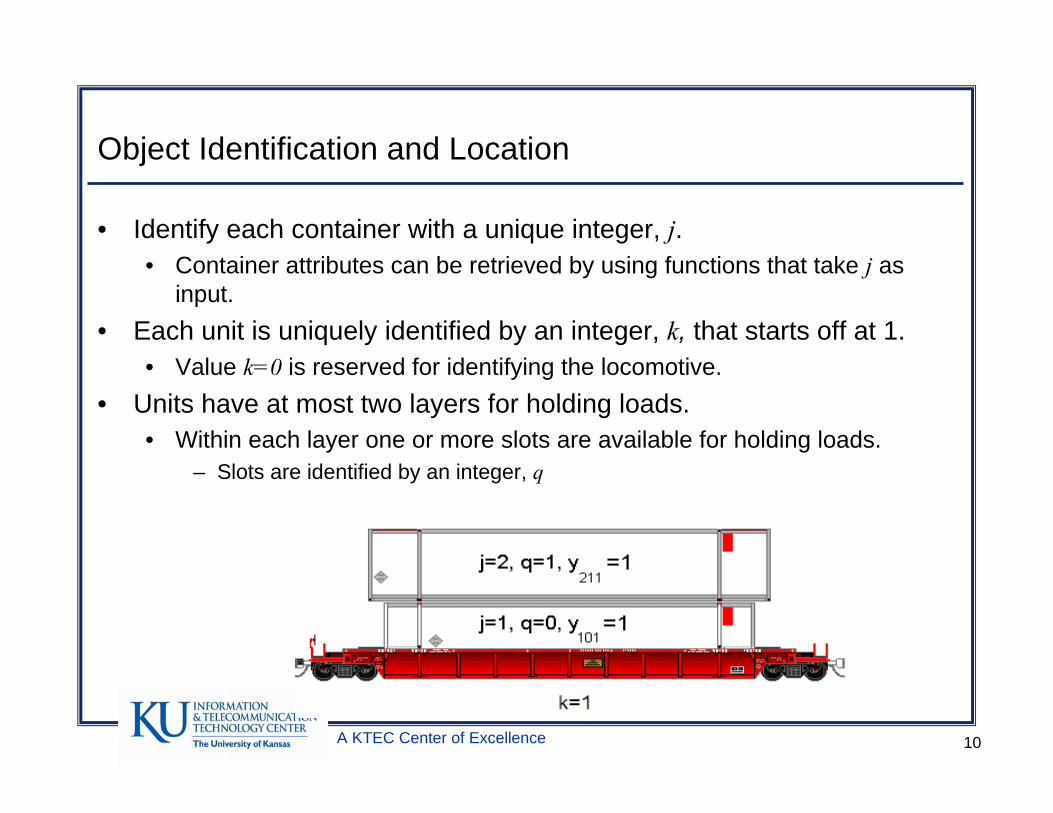
Object Identification and Location
• Identify each container with a unique integer, j.• Container attributes can be retrieved by using functions that take j as
input.• Each unit is uniquely identified by an integer, k, that starts off at 1.
• Value k=0 is reserved for identifying the locomotive.• Units have at most two layers for holding loads.
• Within each layer one or more slots are available for holding loads.– Slots are identified by an integer, q
A KTEC Center of Excellence 11
Model Descriptions
• Problem can be split into two main cases:• Train-mounted deployment
– Containers assigned to fixed slots on the train– Sensors are on train– Backhaul communications device is on train
• Trackside deployment– Containers assigned to fixed slots on the train– Sensors are on train– Sensor readers are at trackside at regular intervals
• Objective in each case is to place sensors and communications systems to minimize the operational cost of monitoring cargo in motion.
A KTEC Center of Excellence 12
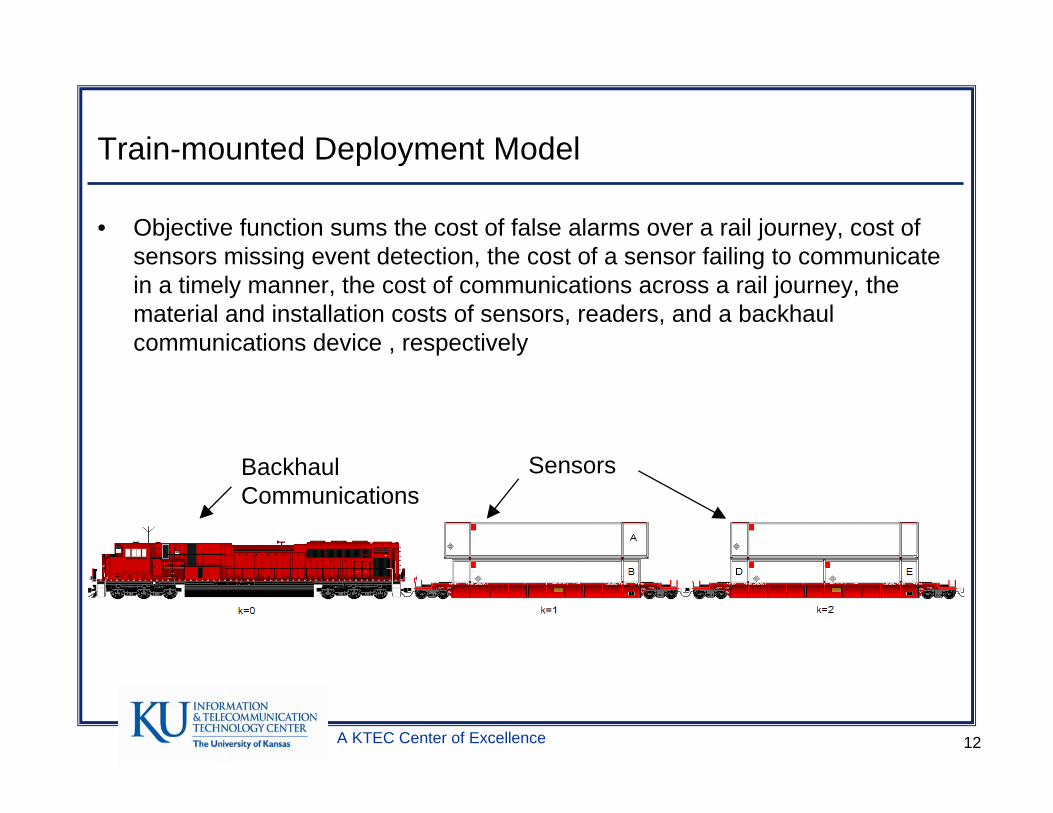
Train-mounted Deployment Model
• Objective function sums the cost of false alarms over a rail journey, cost of sensors missing event detection, the cost of a sensor failing to communicate in a timely manner, the cost of communications across a rail journey, the material and installation costs of sensors, readers, and a backhaul communications device , respectively
Backhaul Communications
Sensors
A KTEC Center of Excellence 13
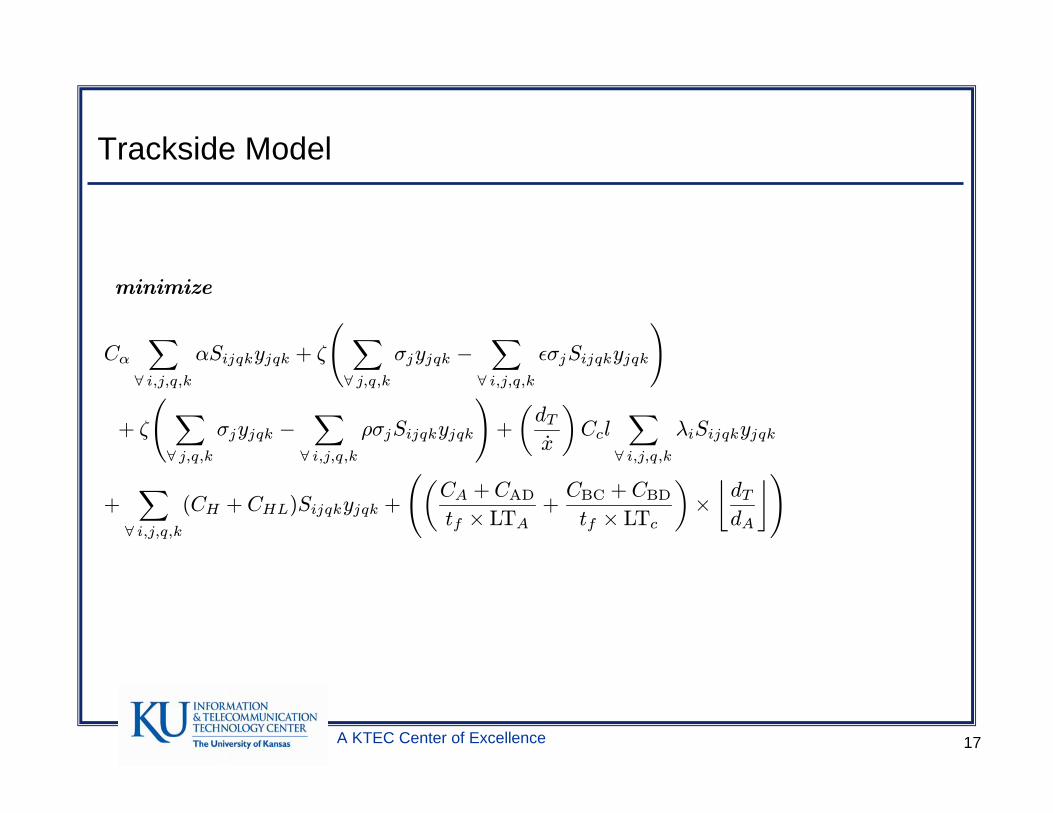
Trackside Deployment Model
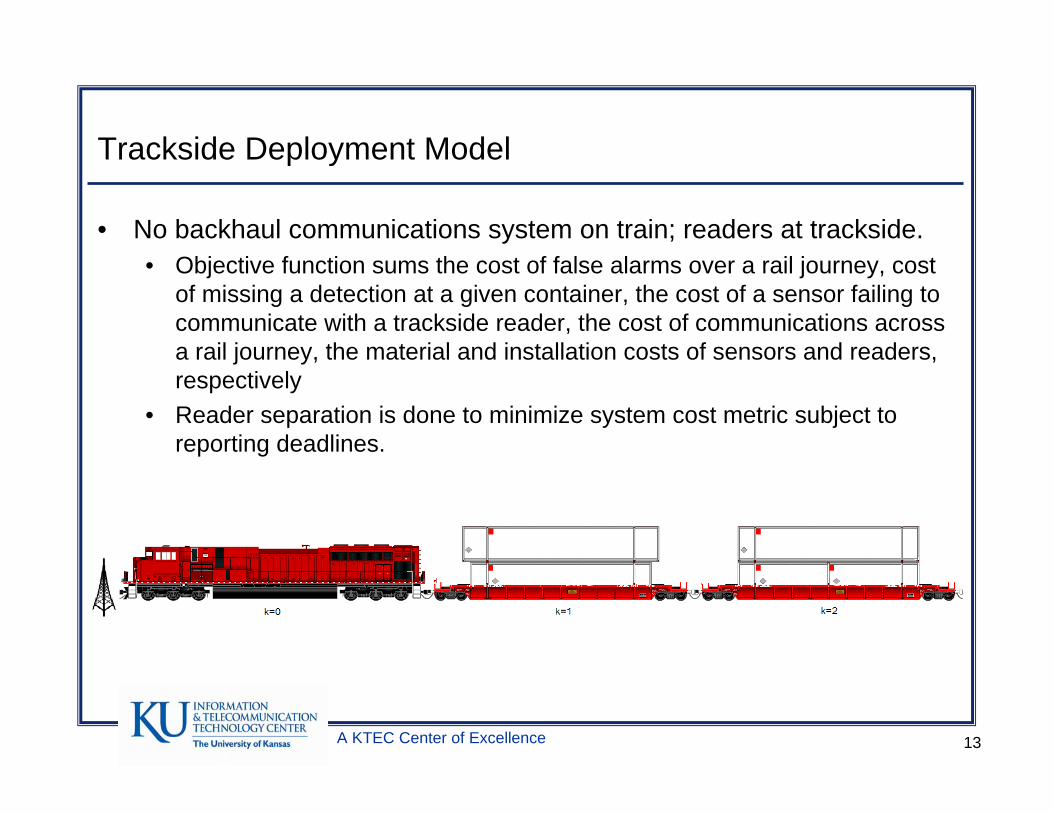
• No backhaul communications system on train; readers at trackside.• Objective function sums the cost of false alarms over a rail journey, cost
of missing a detection at a given container, the cost of a sensor failing to communicate with a trackside reader, the cost of communications across a rail journey, the material and installation costs of sensors and readers, respectively
• Reader separation is done to minimize system cost metric subject to reporting deadlines.
A KTEC Center of Excellence 14
Parameters
• Values need to be given to system designer to solve the problem.• Container placement parameters
• Include:– The set of units (railcars) to be used in the problem with each unit’s
characteristics, i.e., weight limits and length limits for the different layers in the unit
– Container values and savings resulting from detecting events at containers• Information system placement parameters
• Include:– A set of sensors to be assigned– Message generation rates for sensors
A KTEC Center of Excellence 15
Variables
• Goal is to have optimization solver determine appropriate variable values.
• Examples of variables:• A binary variable indicating sensor placement on a container, slot, and
unit.• Sensor transmission range• Trackside reader separation
A KTEC Center of Excellence 16
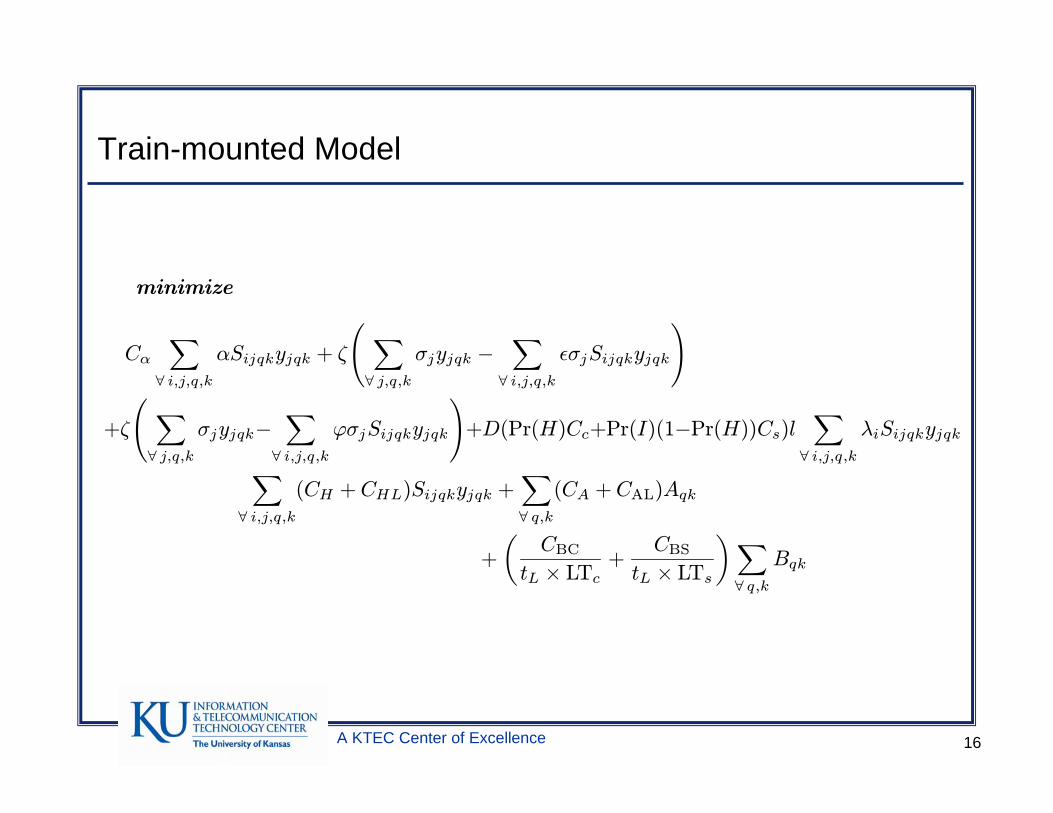
Train-mounted Model
minimize
CαX∀ i,j,q,k
αSijqkyjqk + ζ
à X∀ j,q,k
σjyjqk −X∀ i,j,q,k
²σjSijqkyjqk
!
+ζ
à X∀ j,q,k
σjyjqk−X∀ i,j,q,k
ϕσjSijqkyjqk
!+D(Pr(H)Cc+Pr(I)(1−Pr(H))Cs)l
X∀ i,j,q,k
λiSijqkyjqkX∀ i,j,q,k
(CH +CHL)Sijqkyjqk +X∀ q,k
(CA +CAL)Aqk
+
µCBC
tL × LTc+
CBStL × LTs
¶X∀ q,k
Bqk
A KTEC Center of Excellence 17
Trackside Model
minimize
CαX∀ i,j,q,k
αSijqkyjqk + ζ
à X∀ j,q,k
σjyjqk −X∀ i,j,q,k
²σjSijqkyjqk
!
+ ζ
à X∀ j,q,k
σjyjqk −X∀ i,j,q,k
ρσjSijqkyjqk
!+
µdTx
¶Ccl
X∀ i,j,q,k
λiSijqkyjqk
+X∀ i,j,q,k
(CH + CHL)Sijqkyjqk +
õCA +CADtf × LTA
+CBC + CBDtf × LTc
¶×¹dTdA
º!
A KTEC Center of Excellence 18
Constraints
• Constraints for all models include:• Requirement that all visibility conditions are satisfied• Requirement that no more than one sensor is assigned to a container• Requirement that a sensor is used exactly once
• In addition for trackside model we require that:• A sensor must be read within the time interval that a sensor is within
range of a reader.• The train must cover the distance between two trackside readers within
the deadline for decision maker notification.
A KTEC Center of Excellence 19
Solution Methodologies
• Mixed Integer Nonlinear Program (MINLP) is optimization problem with some integer-constrained and continuous variables as well as nonlinear constraints and/or objective function• If all the variables are continuous, then we have a nonlinear program• If all the functions are linear, then we have a mixed integer linear
program• MINLP are NP-Hard.• Convex MINLP can be solved with the following techniques:
• Branch-and-bound• Extended cutting plane• Outer approximation• Generalized Benders decomposition• LP/NLP-based branch-and-bound• Branch-and-cut
A KTEC Center of Excellence 20
Solution Methodologies
• Models have been solved using the Bonmin solver running on the Network-Enabled Optimization System (NEOS) server• NEOS server handed off problems to solvers hosted at Lehigh University• Solver machines were Pentium 4 computers with clock speed of at least
2.0 GHz and at least 500 MB of RAM• Bonmin used the outer approximation method to solve the
optimization problems• Solving optimization problem yields sensor mappings, i.e., sensor
locations, and determines appropriate values for all other variables
A KTEC Center of Excellence 21
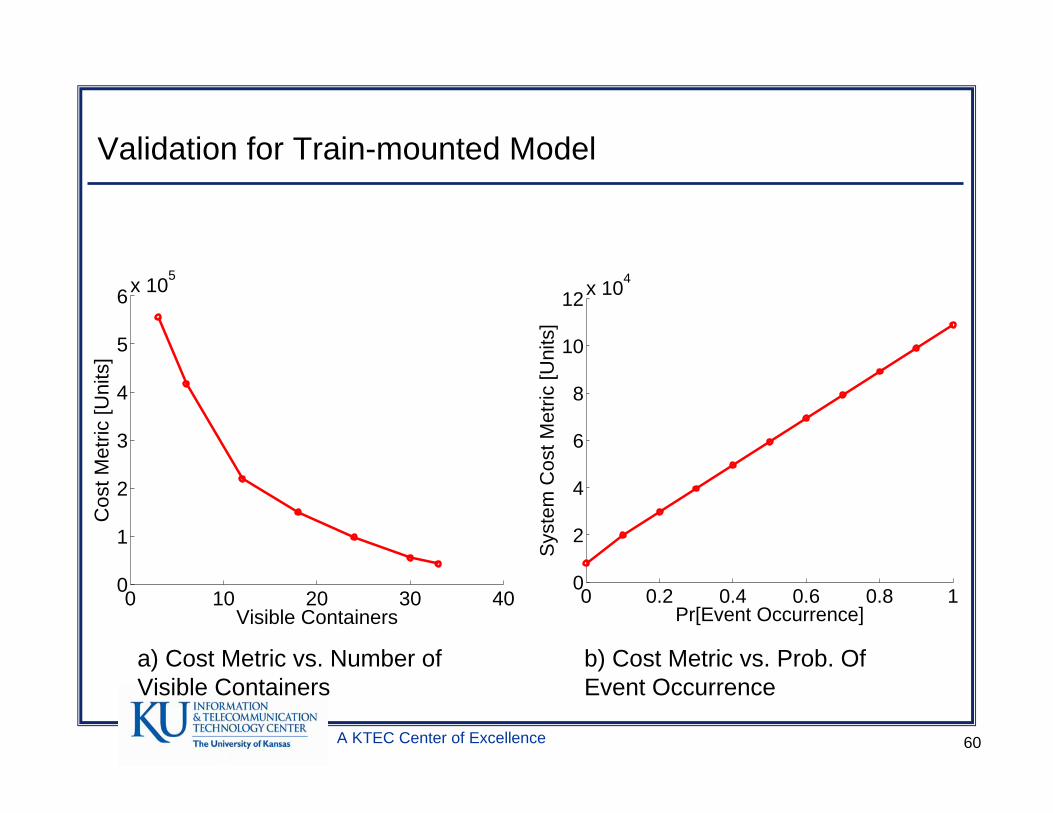
Validation of Models
• Model validation seeks to determine if a given mathematical abstraction matches a real system
• “Validated” the train-mounted and trackside models by studying trends in the behavior of the optimization models at the boundaries of the visibility space.• Aim was to see if model displayed correct behavior, e.g.,
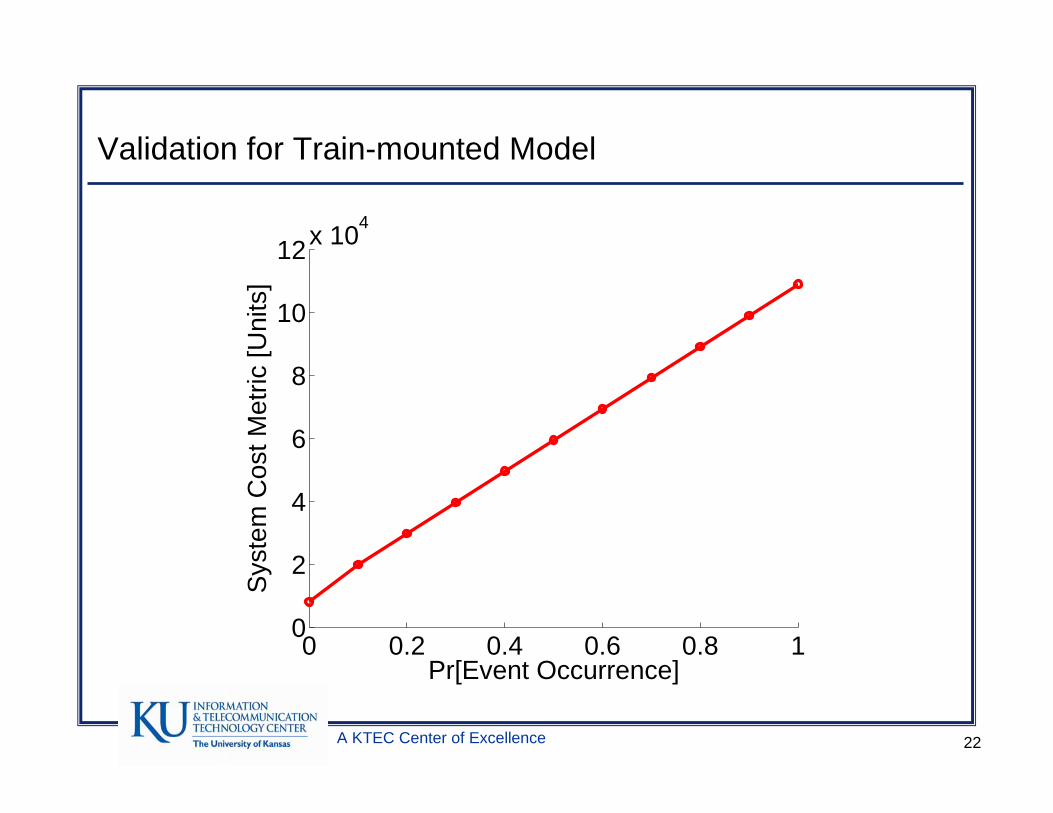
– Does system cost increase as probability of critical event increases?– Does the system cost metric decrease as train goes faster?– Does sensor transmission range increase with train speed?
A KTEC Center of Excellence 22
Validation for Train-mounted Model
0 0.2 0.4 0.6 0.8 10
2
4
6
8
10
12x 104
Pr[Event Occurrence]
Sys
tem
Cos
t Met
ric [U
nits
]

A KTEC Center of Excellence 23
Outline
• Acknowledgements• Introduction• Modeling• System Trade-offs• Heuristic• Conclusion• Questions?
A KTEC Center of Excellence 24
System Trade-offs : Introduction
• Models were developed and applied to determine system trade-offs when seeking visibility into cargo shipments.
• Objectives:• Study trade-offs when monitoring cargo in motion and to identify the
important factors that system architects must consider when choosing to implement either a train-mounted or trackside deployment system
• Provide tools for designers of cargo monitoring systems that balance performance and cost
• Highlight the power of the models developed• Studied system trade-offs when two different sensor cost models
were available:• Linear cost model• Nonlinear cost model
A KTEC Center of Excellence 25
System Trade-offs : Introduction
• Due to computational limits on solver, system trade-offs were studied on train with:• 15 units (railcars)• 33 containers• Up to 33 sensors
• Other train details:• Average train speed was 25 km/h• Length of the rail trip was 1984 km, which is the distance from Laredo to
Kansas City• Cost of each false alarm was 20,000 units• Other parameters in dissertation
A KTEC Center of Excellence 26
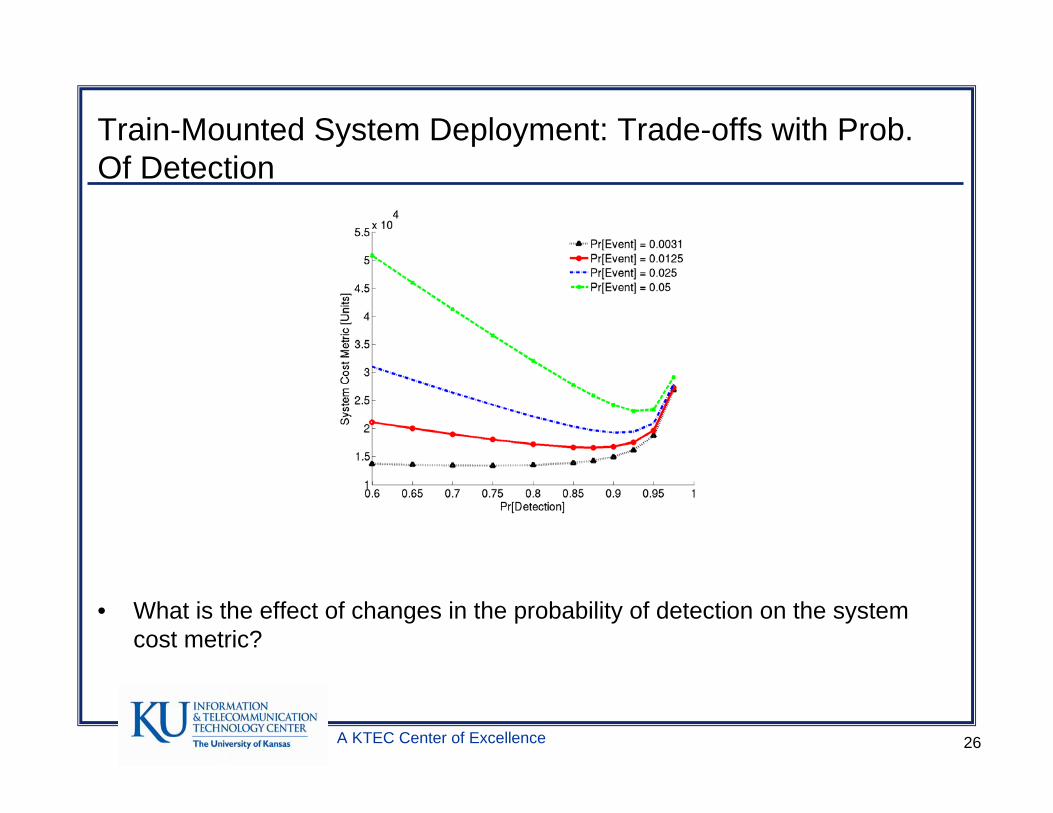
Train-Mounted System Deployment: Trade-offs with Prob. Of Detection
• What is the effect of changes in the probability of detection on the system cost metric?
A KTEC Center of Excellence 27
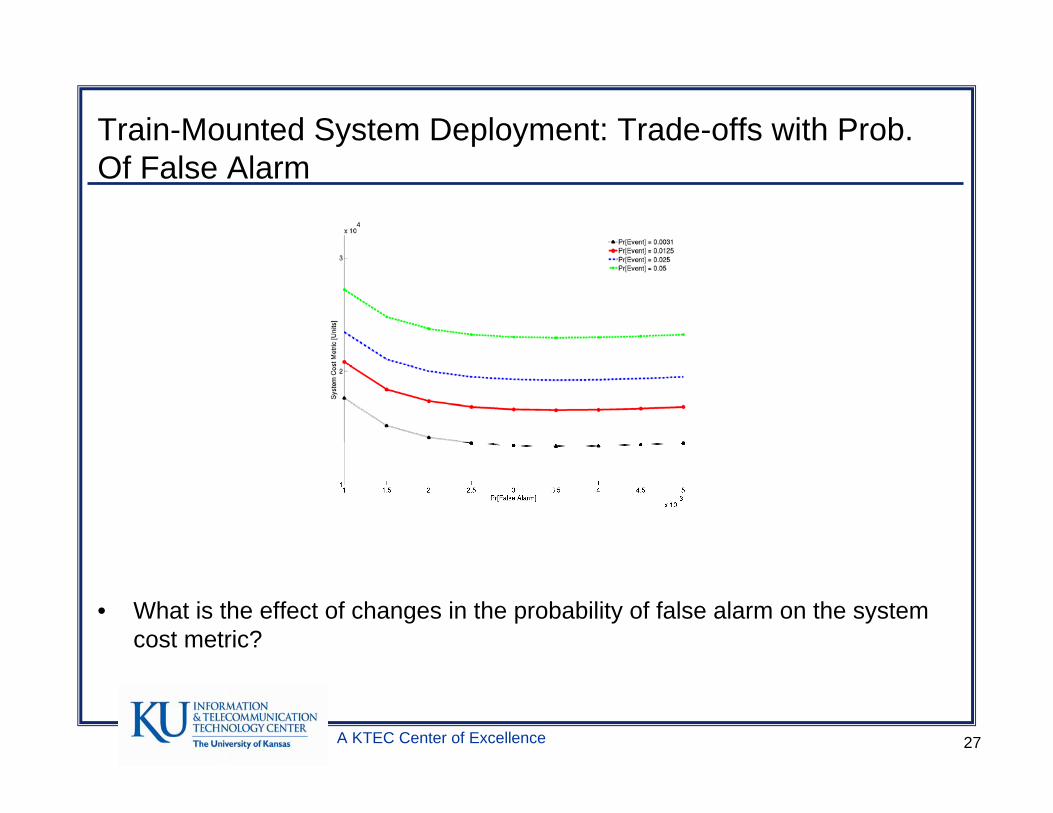
Train-Mounted System Deployment: Trade-offs with Prob. Of False Alarm
• What is the effect of changes in the probability of false alarm on the system cost metric?
A KTEC Center of Excellence 28
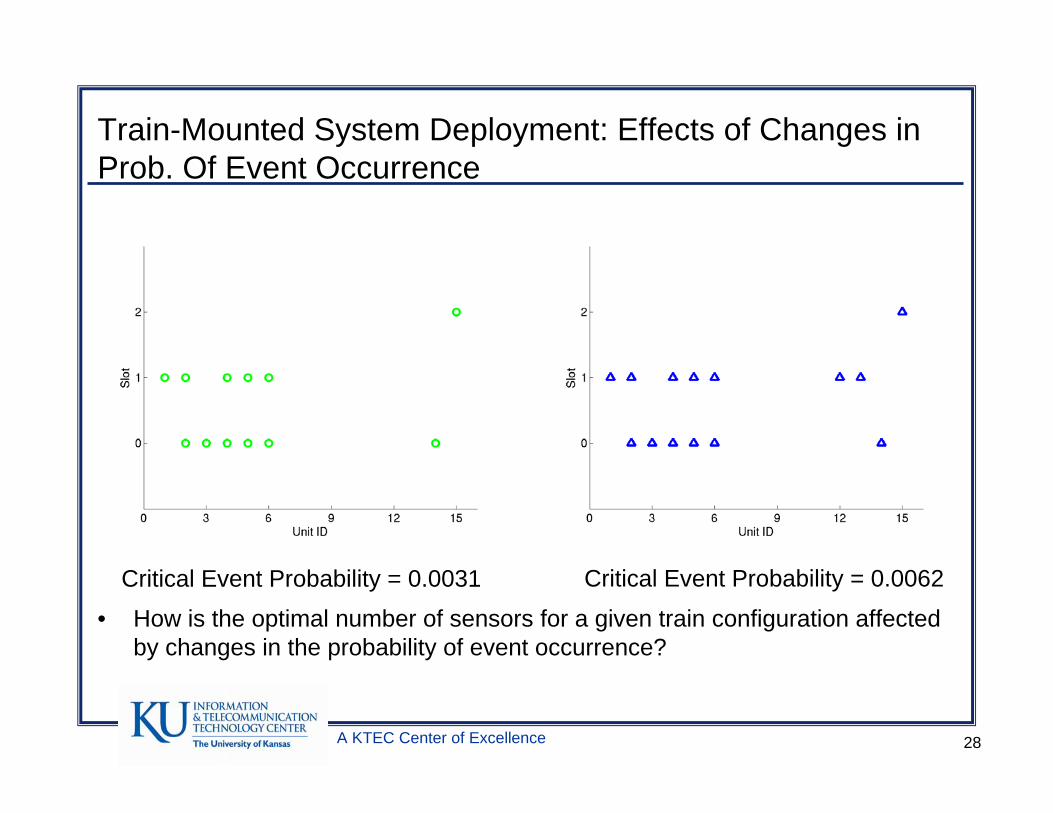
Train-Mounted System Deployment: Effects of Changes in Prob. Of Event Occurrence
• How is the optimal number of sensors for a given train configuration affected by changes in the probability of event occurrence?
Critical Event Probability = 0.0031 Critical Event Probability = 0.0062
A KTEC Center of Excellence 29
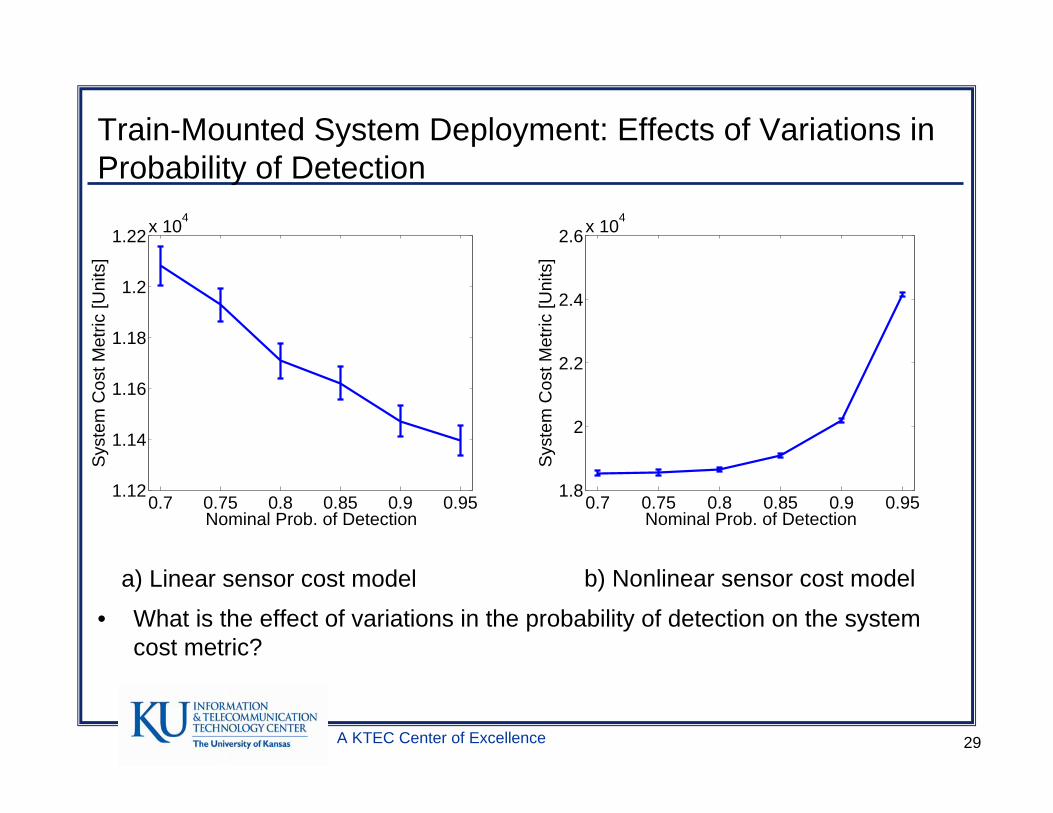
Train-Mounted System Deployment: Effects of Variations in Probability of Detection
• What is the effect of variations in the probability of detection on the system cost metric?
a) Linear sensor cost model b) Nonlinear sensor cost model
0.7 0.75 0.8 0.85 0.9 0.951.12
1.14
1.16
1.18
1.2
1.22x 10⁴
Nominal Prob. of Detection
Sys
tem
Cos
t Met
ric [U
nits
]
0.7 0.75 0.8 0.85 0.9 0.951.8
2
2.2
2.4
2.6x 10⁴
Nominal Prob. of Detection
Sys
tem
Cos
t Met
ric [U
nits
]
A KTEC Center of Excellence 30
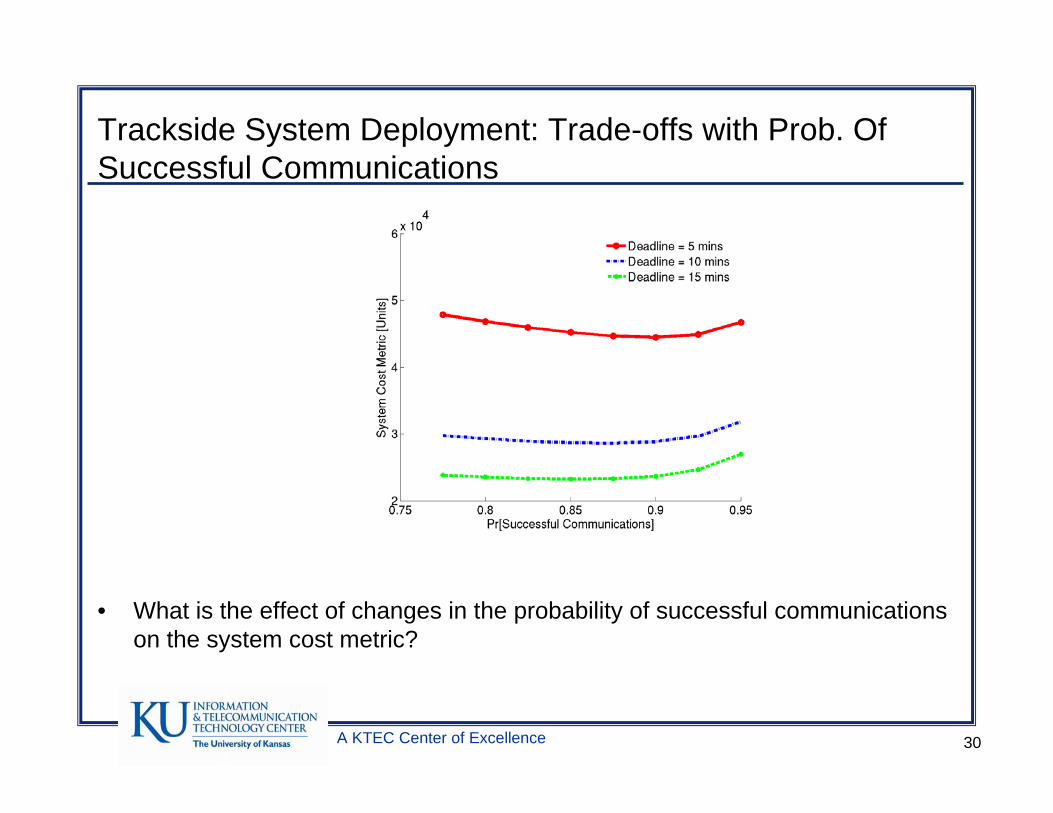
Trackside System Deployment: Trade-offs with Prob. Of Successful Communications
• What is the effect of changes in the probability of successful communications on the system cost metric?
A KTEC Center of Excellence 31
Trackside vs. Train-Mounted System Deployments
60 120 180 240 300 3600
0.5
1
1.5
2
x 105
Notification Time [s]
Sys
tem
Cos
t Met
ric [U
nits
]
Train−mounted, linear sensor costTrain−mounted, nonlinear sensor costTrackside, linear sensor costTrackside, nonlinear sensor cost
60 120 180 240 300 36010
4
105
106
107
Notification Time [s]
Sys
tem
Cos
t Met
ric [U
nits
]
Train−mounted, linearTrain−mounted, nonlinearTrackside, linear sensor costTrackside, nonlinear sensor cost
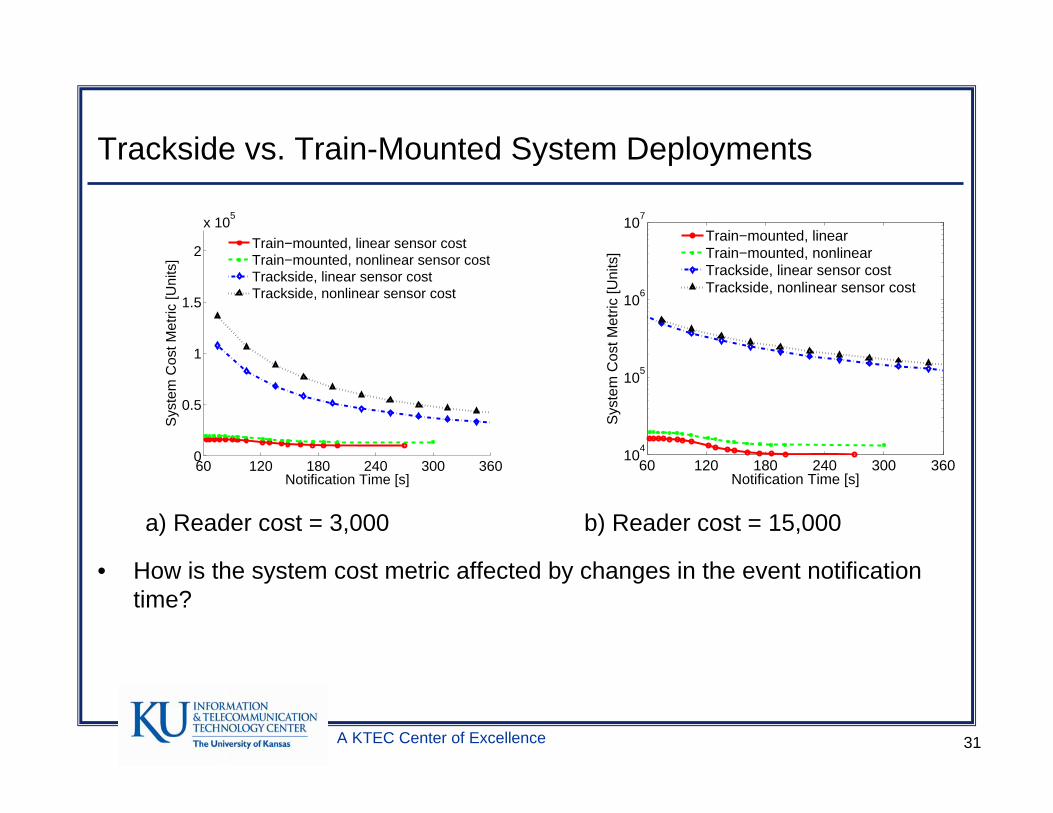
• How is the system cost metric affected by changes in the event notification time?
a) Reader cost = 3,000 b) Reader cost = 15,000
A KTEC Center of Excellence 32
Trackside vs. Train-Mounted System Deployments
20 30 40 50 60 70 80 900
2
4
6
8x 10⁴
Train Speed [km/h]
Sys
tem
Cos
t Met
ric [U
nits
]
Train−mounted, linear sensor costTrain−mounted, nonlinear sensor costTrackside, linear sensor costTrackside, nonlinear sensor cost
20 30 40 50 60 70 80 900
1
2
3x 10⁵
Train Speed [km/h]
Sys
tem
Cos
t Met
ric [U
nits
]
Train−mounted, linear sensor costTrain−mounted, nonlinear sensor costTrackside, linear sensor costTrackside, nonlinear sensor cost
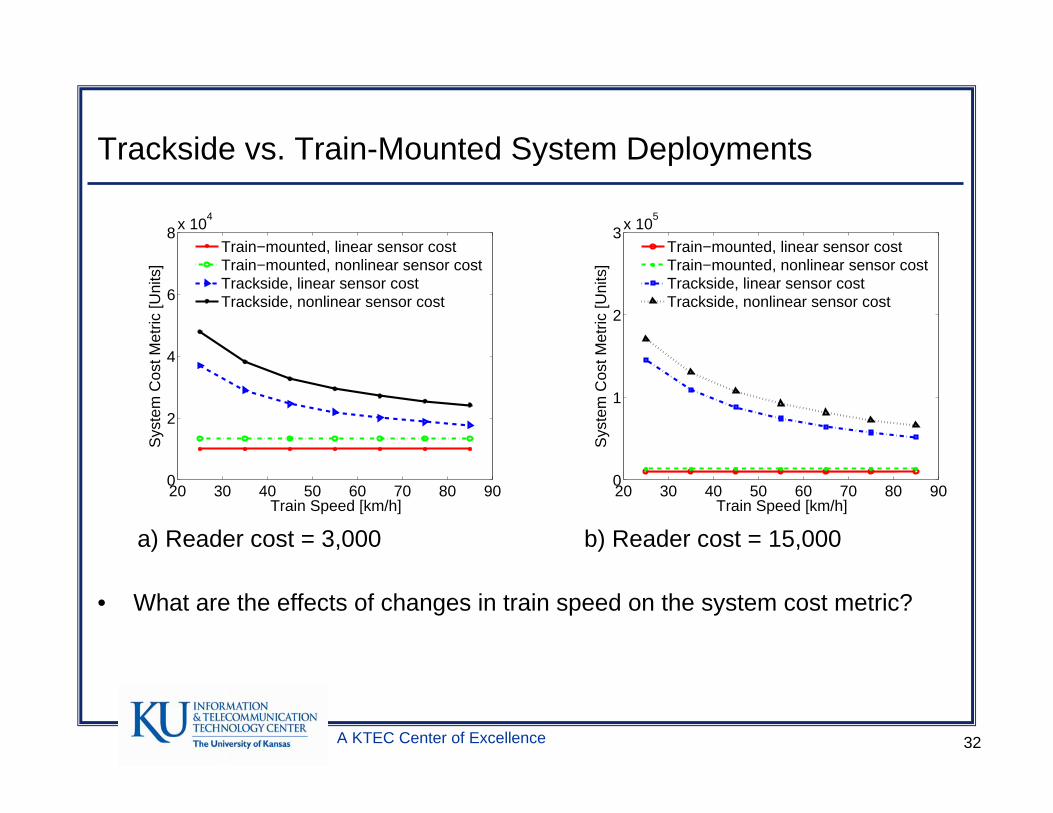
• What are the effects of changes in train speed on the system cost metric?
a) Reader cost = 3,000 b) Reader cost = 15,000
A KTEC Center of Excellence 33
Trackside vs. Train-Mounted System Deployments
0 5 10 15 20 25 30 350
1
2
3
4
5
6
7
8x 10⁴
Containers with Sensors
Sys
tem
Cos
t Met
ric [U
nits
]
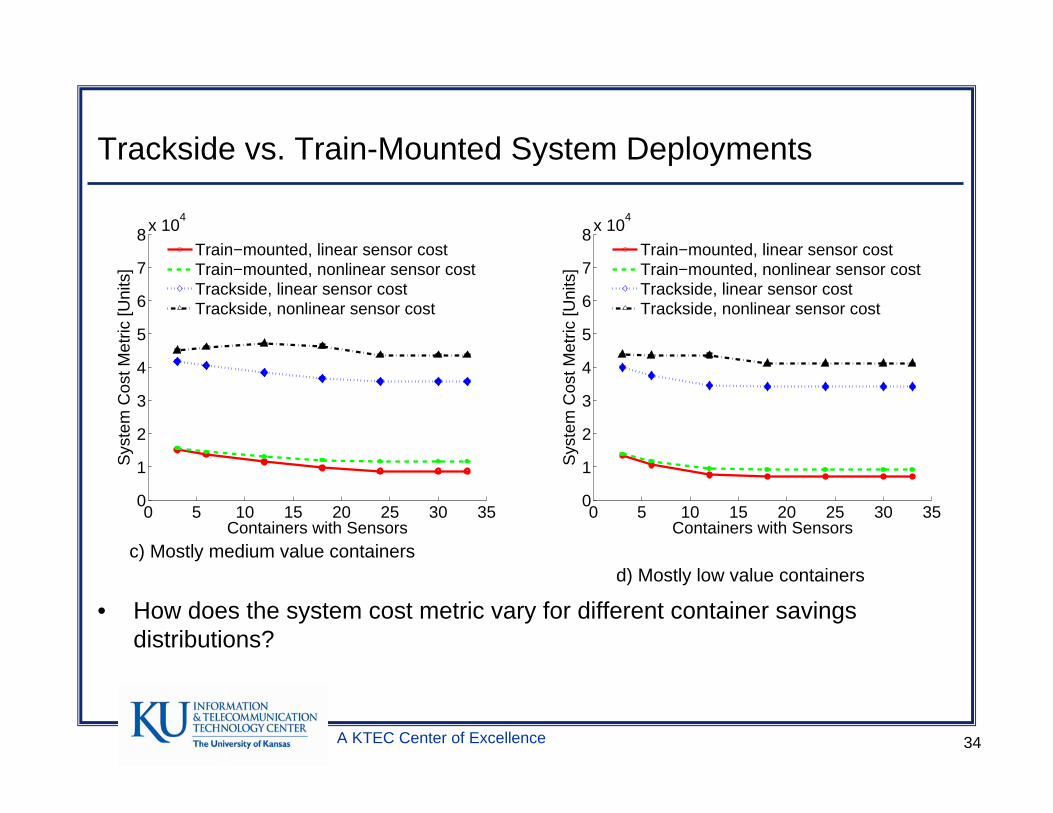
Train−mounted, linear sensor costTrain−mounted, nonlinear sensor costTrackside, linear sensor costTrackside, nonlinear sensor cost
0 5 10 15 20 25 30 350
1
2
3
4
5
6
7
8x 10⁴
Containers with Sensors
Sys
tem
Cos
t Met
ric [U
nits
]
Train−mounted, linear sensor costTrain−mounted, nonlinear sensor costTrackside, linear sensor costTrackside, nonlinear sensor cost
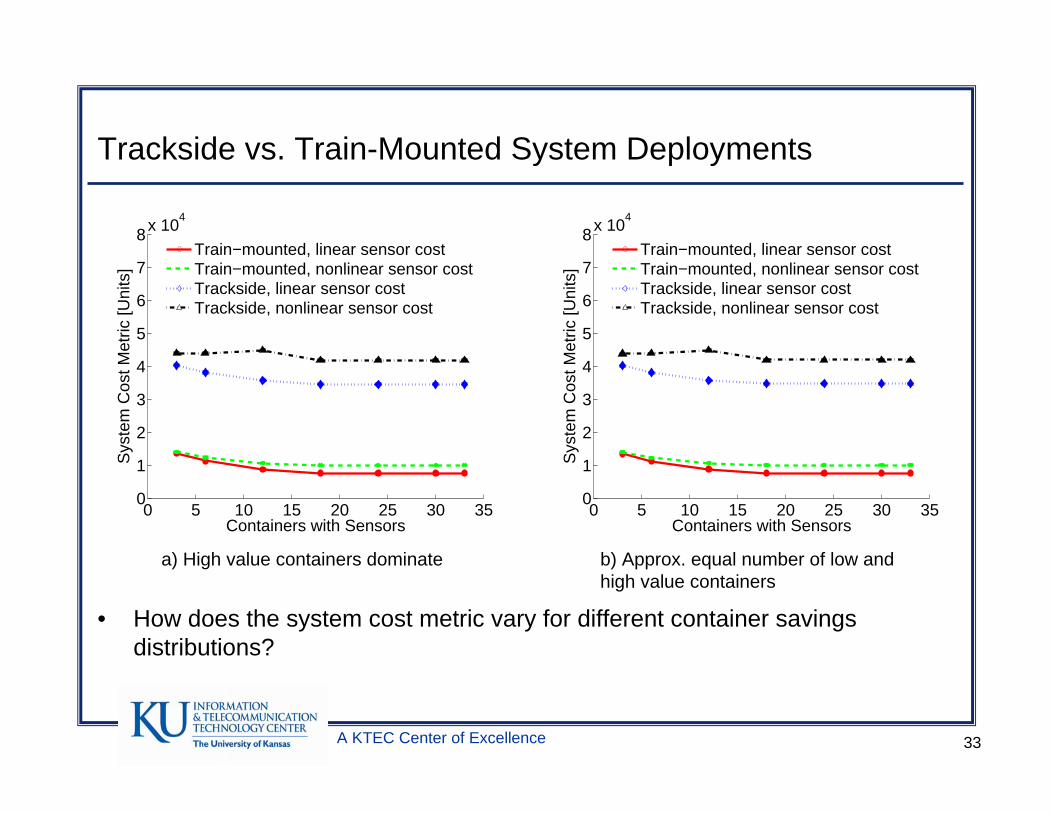
• How does the system cost metric vary for different container savings distributions?
a) High value containers dominate b) Approx. equal number of low and high value containers
A KTEC Center of Excellence 34
Trackside vs. Train-Mounted System Deployments
0 5 10 15 20 25 30 350
1
2
3
4
5
6
7
8x 10⁴
Containers with Sensors
Sys
tem
Cos
t Met
ric [U
nits
]
Train−mounted, linear sensor costTrain−mounted, nonlinear sensor costTrackside, linear sensor costTrackside, nonlinear sensor cost
0 5 10 15 20 25 30 350
1
2
3
4
5
6
7
8x 10⁴
Containers with Sensors
Sys
tem
Cos
t Met
ric [U
nits
]
Train−mounted, linear sensor costTrain−mounted, nonlinear sensor costTrackside, linear sensor costTrackside, nonlinear sensor cost
• How does the system cost metric vary for different container savings distributions?
c) Mostly medium value containersd) Mostly low value containers
A KTEC Center of Excellence 35
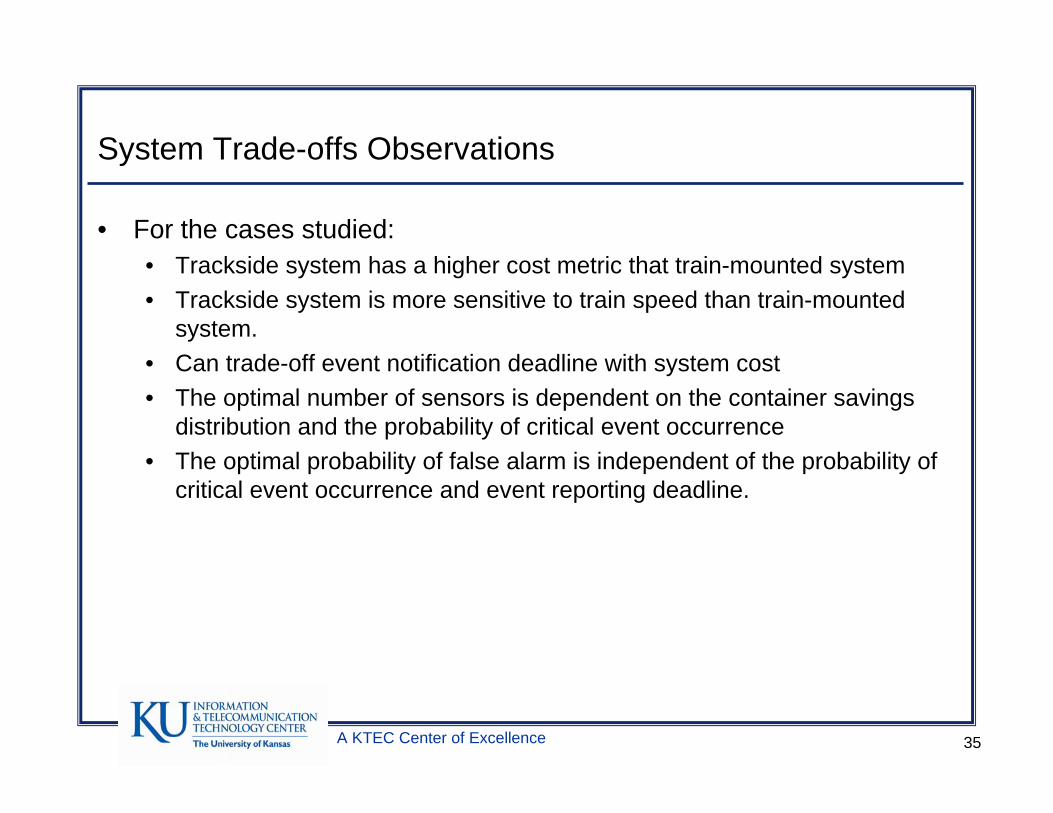
System Trade-offs Observations
• For the cases studied:• Trackside system has a higher cost metric that train-mounted system• Trackside system is more sensitive to train speed than train-mounted
system.• Can trade-off event notification deadline with system cost• The optimal number of sensors is dependent on the container savings
distribution and the probability of critical event occurrence• The optimal probability of false alarm is independent of the probability of
critical event occurrence and event reporting deadline.
A KTEC Center of Excellence 36
Outline
• Acknowledgements• Introduction• Modeling• System Trade-offs• Heuristic• Conclusion• Questions?
A KTEC Center of Excellence 37
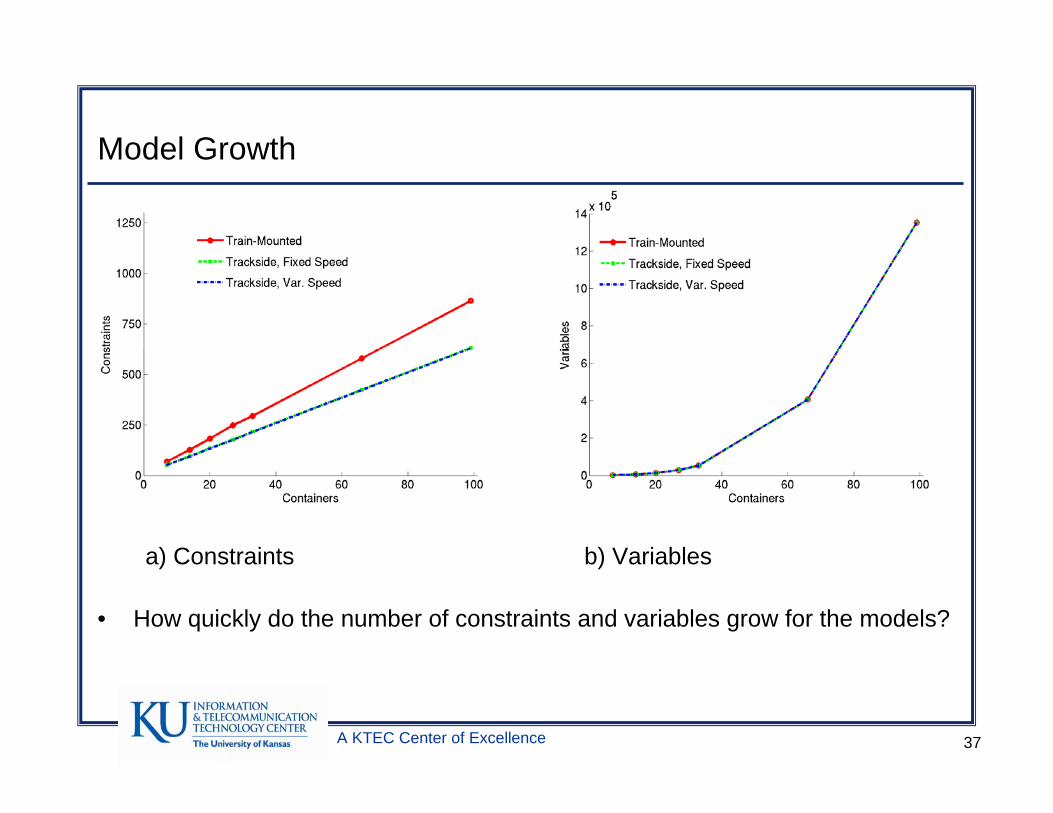
Model Growth
a) Constraints b) Variables
• How quickly do the number of constraints and variables grow for the models?
A KTEC Center of Excellence 38
Heuristic Motivation
• MINLP can be used to optimally assign sensors to containers on atrain.
• MINLP approach was only used on a train with 15 units and 33 containers.
• Typical international intermodal stack train can have up to 104 units and 224 containers.
• Heuristic needed to place sensors on typically-sized trains.
A KTEC Center of Excellence 39
Assumptions for Heuristic
• Finite number of sensors• A valid sensor placement solution exists• Unit cost of each sensor is related to the sensor capabilities using
either a linear or nonlinear cost model• Transmission range of the sensors can be modified so that all the
sensors are connected in a cargo monitoring network.• A visibility weight is associated with each container
A KTEC Center of Excellence 40
Heuristic Description
• Heuristic stores the number of sensors available to be used on the train and the total savings for all the containers on the train.
• Computes the visibility weight for each container and stores thevisibility weights in descending order.
• Computes the probabilities of detection and false alarm for eachsensor.
• Assigns sensors to containers in order of descending visibility weight as long as there are sensors available.
• Check that each sensor can communicate with its neighbors.• Compute cargo monitoring cost and terminate.
A KTEC Center of Excellence 41
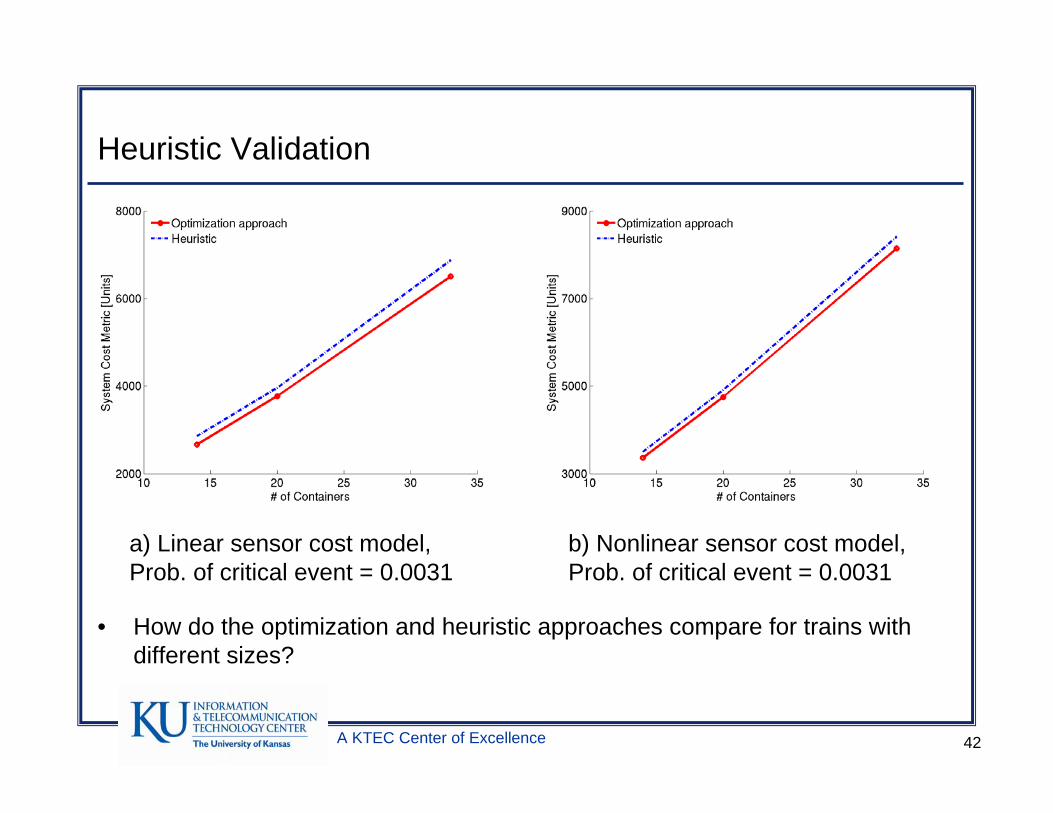
Heuristic Validation
• Heuristic was implemented in Java and run over trains of different sizes with the linear and nonlinear sensor cost models
• Train configuration:• Some details identical to those used for system trade-off studies• One train had 33 containers and 15 units; the next train had 20
containers and 9 units; and the last train had 14 containers and 6 units
A KTEC Center of Excellence 42
Heuristic Validation
a) Linear sensor cost model, Prob. of critical event = 0.0031
b) Nonlinear sensor cost model, Prob. of critical event = 0.0031
• How do the optimization and heuristic approaches compare for trains with different sizes?
A KTEC Center of Excellence 43
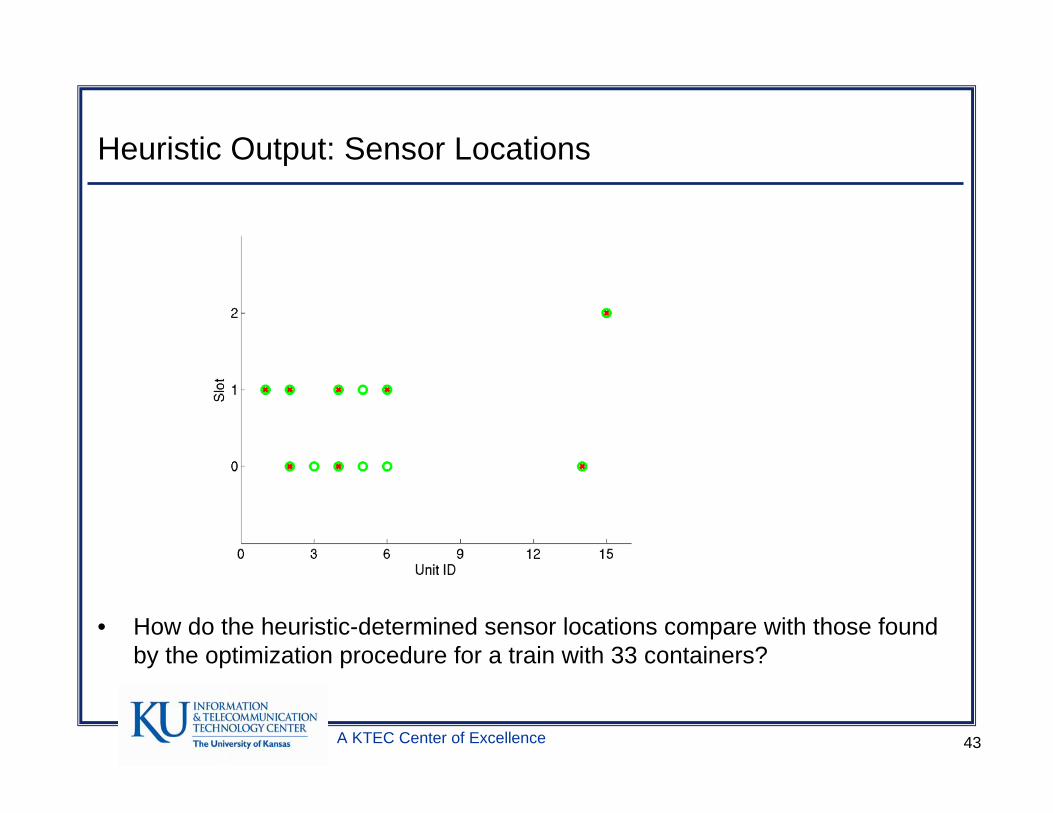
Heuristic Output: Sensor Locations
• How do the heuristic-determined sensor locations compare with those found by the optimization procedure for a train with 33 containers?
A KTEC Center of Excellence 44
Application of Heuristic
• Heuristic applied to train using the following assumptions:• The average train speed was 25 km/h• The length of the rail trip was 1984 km, which is the distance from Laredo
to Kansas City• There were 105 units and 225 containers on the train, with 30 20-feet,
186 40-feet, and 9 45-feet containers.• 150 containers had a mean value of 20,000 units, 50 containers had a
mean value of 100,000 units, and 25 containers had a mean value of 200,000 units.
• Containers were placed in slots on the train using only the train company’s loading rules
• The probability of a critical event, such as a container seal being opened, closed, or tampered with, occurring at each container was varied across the runs.
A KTEC Center of Excellence 45
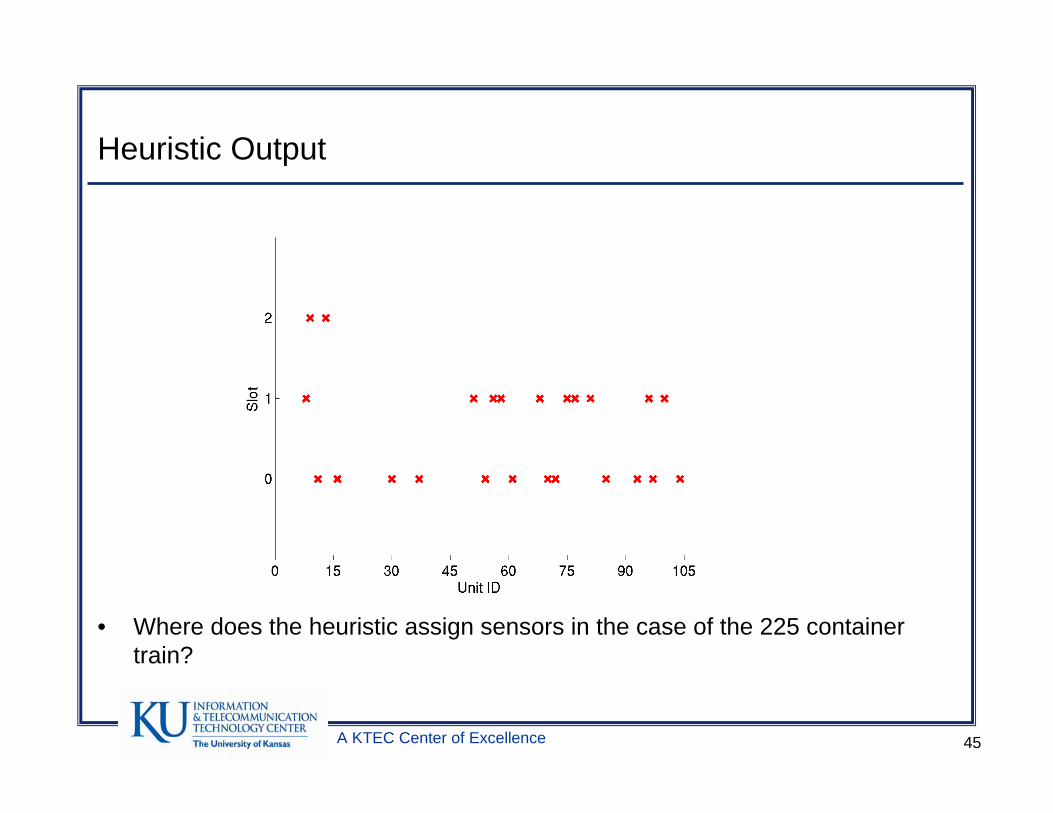
Heuristic Output
• Where does the heuristic assign sensors in the case of the 225 container train?
A KTEC Center of Excellence 46
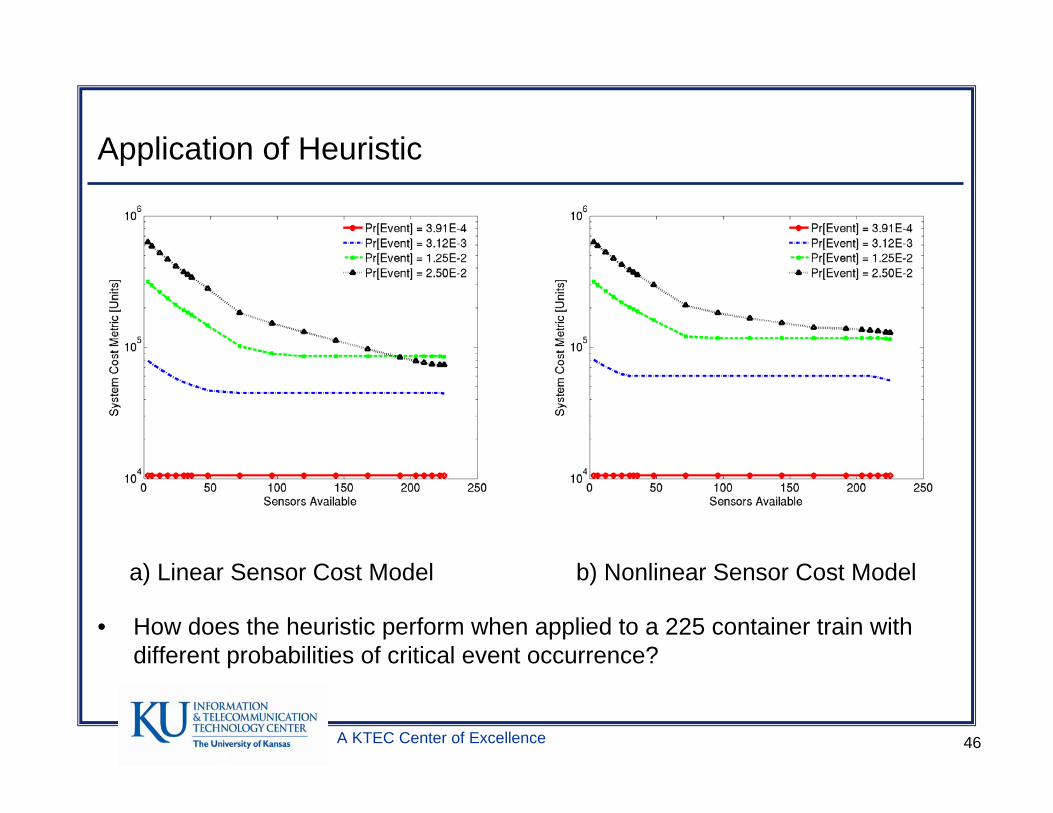
Application of Heuristic
a) Linear Sensor Cost Model b) Nonlinear Sensor Cost Model
• How does the heuristic perform when applied to a 225 container train with different probabilities of critical event occurrence?
A KTEC Center of Excellence 47
Heuristic Findings
• Heuristic is able to determine appropriate sensor assignments and sensor characteristics for near to optimal system performance.
• Depending on the probability of critical event occurrence it may be necessary to use fewer sensors than the total number of containers, if the cost of an event exceeds the unit sensor cost.

A KTEC Center of Excellence 48
Outline
• Acknowledgements• Introduction• Modeling• System Trade-offs• Heuristic• Conclusion• Questions?
A KTEC Center of Excellence 49
Contributions Summary
• Developed and applied a new definition for container visibility.• Developed a mechanism for container location and identification on
trains: indexing scheme.• Produced models that find the optimal assignment of sensors to
containers on a train• Studied system trade-offs between:
• Train-mounted and trackside deployment of readers.• System cost and time needed to report events.
• Developed a heuristic for deploying sensors to trains of realistic size.
A KTEC Center of Excellence 50
Future Work
• Investigate methods of validating the models more rigorously• Improve the sensor cost models such that they incorporate a
standard deviation in sensor characteristics• The more a sensor deviates from the optimum value, the cheaper it is.
• Improve the calculation for the system cost metric such that it incorporates a small loss to the system operator if there is an event, unlike the current situation
• Literature review indicates that cargo is most at risk when it is stationary.• Thus, the probability of a critical event needs to be related to train speed.
• Investigate the maximum sized train that can be handled by the heuristic

A KTEC Center of Excellence 51
Questions?

A KTEC Center of Excellence 52
Back-up Slides
A KTEC Center of Excellence 53
Experiences from a Transportation SecuritySensor Network Field Trial
• Cargo theft estimated to cost the US economy $15–$30 billion • Cargo theft affects originators, shippers, and receivers.
• Most non-bulk cargo travels in shipping containers.• Container transport is characterized by complex interactions.
• Deficiencies in container transport chain expose the system to attacks such as:• Trojan Horse• Hijack or theft of goods
• Insufficiencies in these areas can be overcome by creating secure trade lanes, especially at intermodal points.
• Transportation Security Sensor Network (TSSN) has been developedfor monitoring integrity of cargo shipments.
• TSSN has been implemented and a field trial conducted to evaluate its effectiveness and performance.
A KTEC Center of Excellence 54
TSSN System Architecture
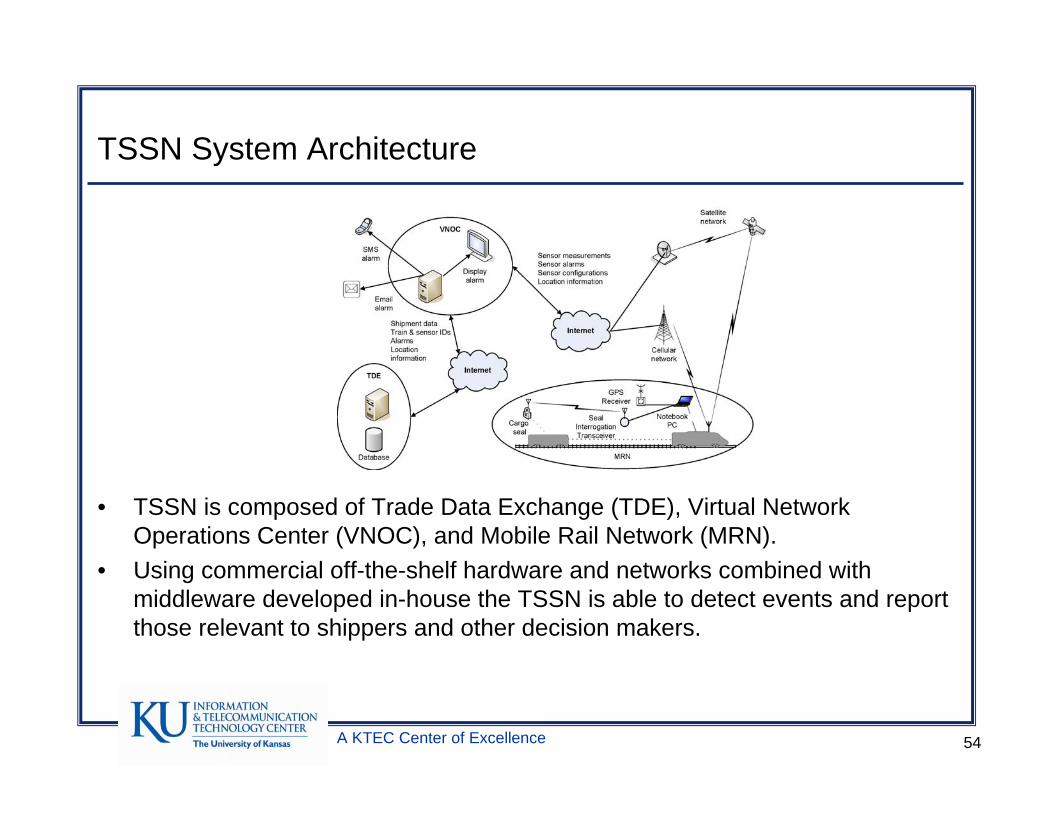
• TSSN is composed of Trade Data Exchange (TDE), Virtual Network Operations Center (VNOC), and Mobile Rail Network (MRN).
• Using commercial off-the-shelf hardware and networks combined with middleware developed in-house the TSSN is able to detect events and report those relevant to shippers and other decision makers.
A KTEC Center of Excellence 55
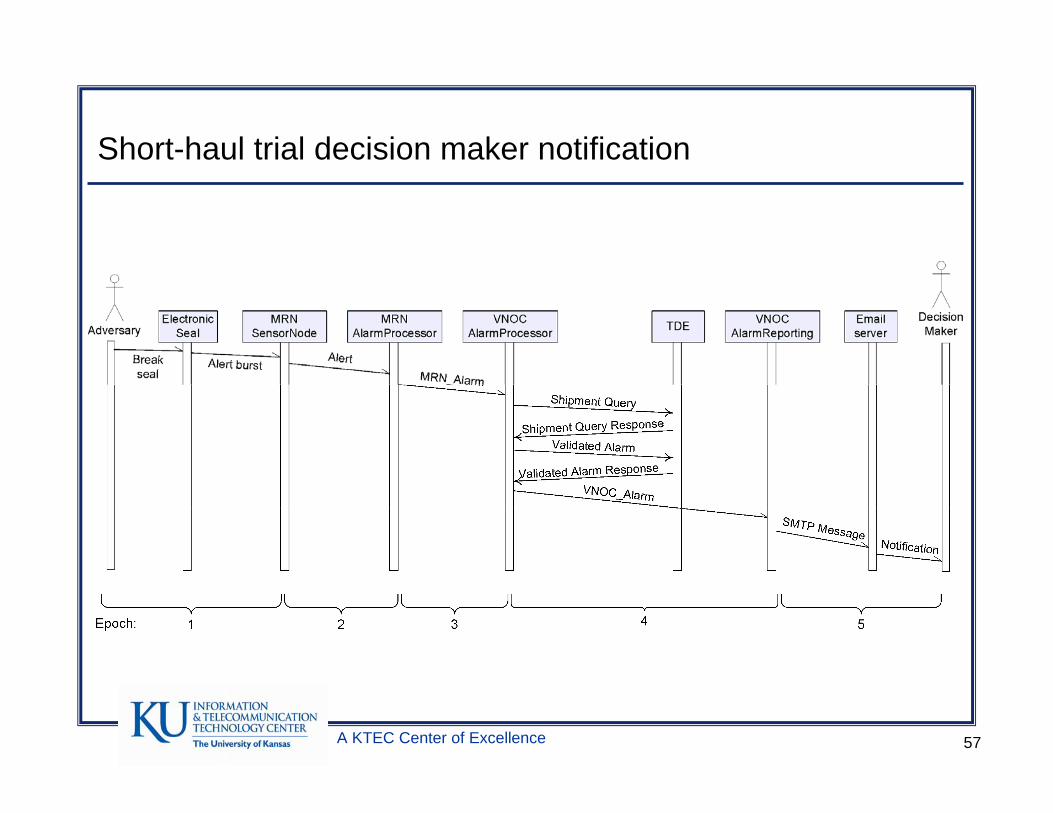
Short-haul trial Experiment
• Field trail carried out on train making a ~35 km trip from intermodal facility to rail yard.
• Field trail objectives:• Determine performance of TSSN system when detecting events on
intermodal containers in a rail environment.• Investigate if decision makers could be informed of events in a timely
manner using SMS messages and email.• Collect data that will be used in a model to investigate system trade-offs
for monitoring rail-borne cargo.• During experiment events were created by breaking and closing a
seal kept in the locomotive.
A KTEC Center of Excellence 56
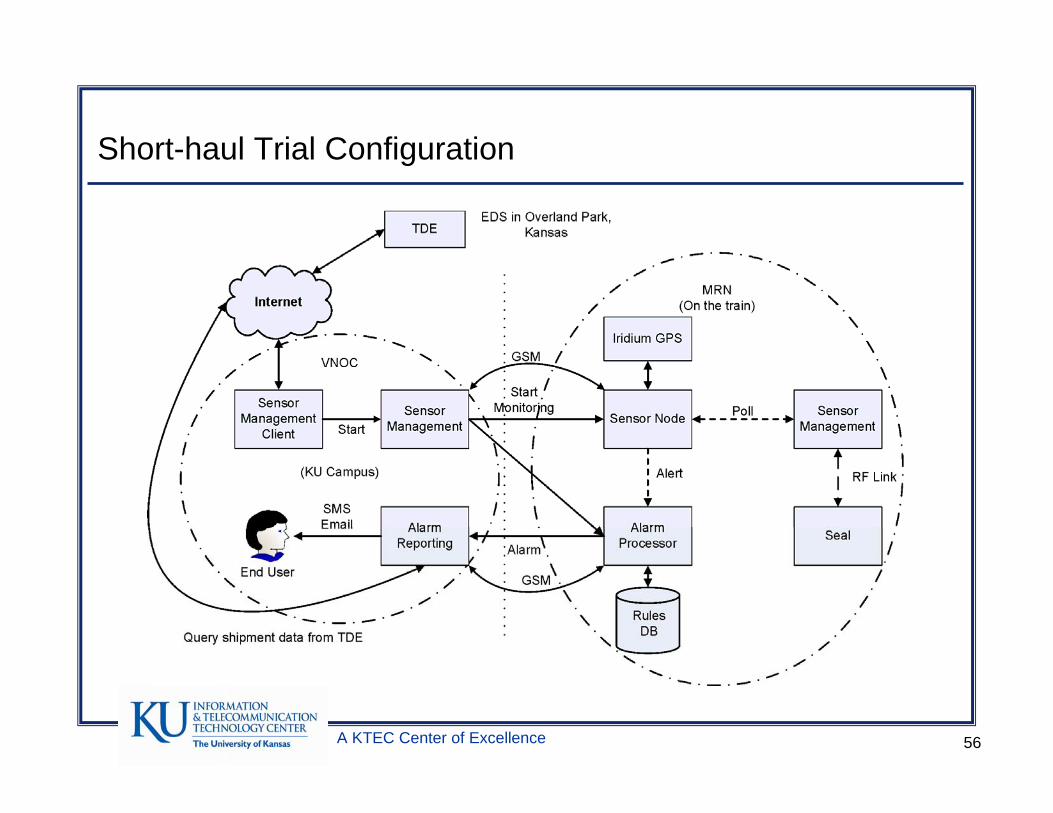
Short-haul Trial Configuration
A KTEC Center of Excellence 57
Short-haul trial decision maker notification
A KTEC Center of Excellence 58
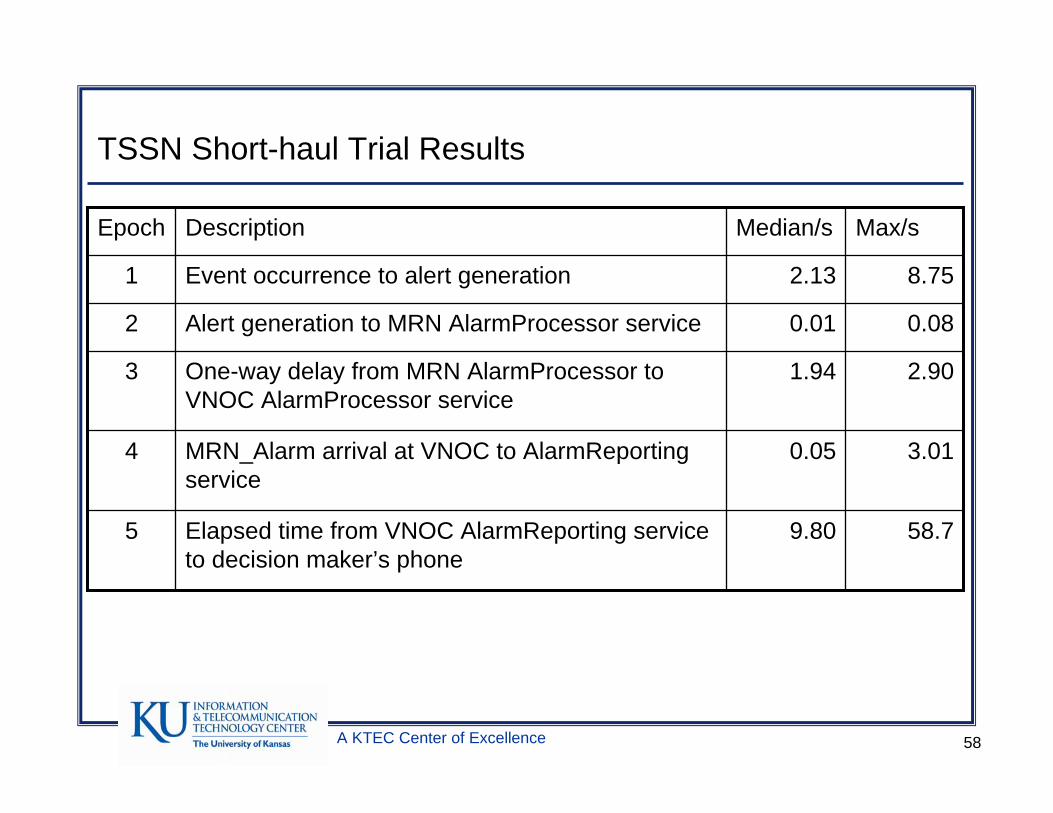
TSSN Short-haul Trial Results
8.752.13Event occurrence to alert generation1
58.79.80Elapsed time from VNOC AlarmReporting service to decision maker’s phone
5
3.010.05MRN_Alarm arrival at VNOC to AlarmReportingservice
4
2.901.94One-way delay from MRN AlarmProcessor to VNOC AlarmProcessor service
3
0.080.01Alert generation to MRN AlarmProcessor service2
Max/sMedian/sDescriptionEpoch
A KTEC Center of Excellence 59
TSSN Refinements and Conclusions
• Refinements:• Redesign MRN hardware for TSSN collector node to have redundant
backhaul communications capabilities.• Enhanced sensor capabilities to enable whole-train monitoring.
• Conclusions• Based on our experiments and evaluations TSSN is viable for monitoring
rail-borne cargo.• Based on experimental results it can take just over one minute to notify
decision makers of events. • We have successfully demonstrated that events can be detected and
decision makers notified within decision maker threshold.
A KTEC Center of Excellence 60
Validation for Train-mounted Model
0 10 20 30 400
1
2
3
4
5
6x 10⁵
Visible Containers
Cos
t Met
ric [U
nits
]
0 0.2 0.4 0.6 0.8 10
2
4
6
8
10
12x 104
Pr[Event Occurrence]
Sys
tem
Cos
t Met
ric [U
nits
]
a) Cost Metric vs. Number of Visible Containers
b) Cost Metric vs. Prob. Of Event Occurrence
A KTEC Center of Excellence 61
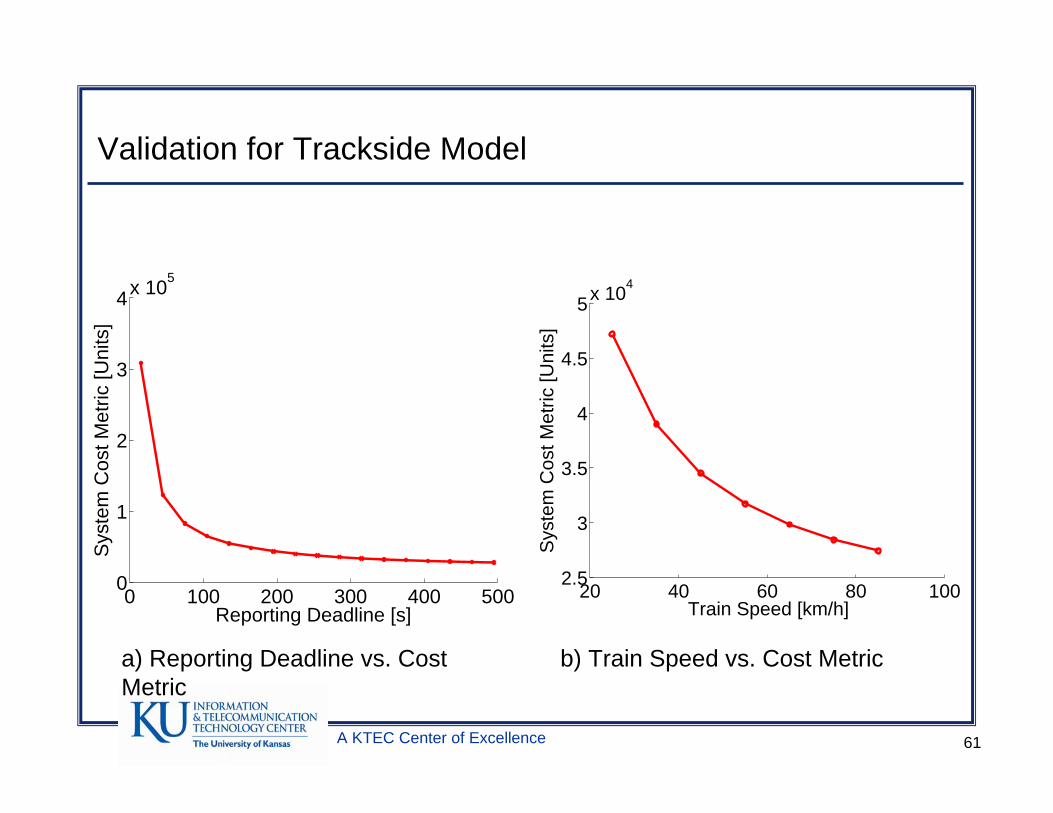
Validation for Trackside Model
0 100 200 300 400 5000
1
2
3
4x 10⁵
Reporting Deadline [s]
Sys
tem
Cos
t Met
ric [U
nits
]
20 40 60 80 1002.5
3
3.5
4
4.5
5x 10⁴
Train Speed [km/h]
Sys
tem
Cos
t Met
ric [U
nits
]
a) Reporting Deadline vs. Cost Metric
b) Train Speed vs. Cost Metric
A KTEC Center of Excellence 62
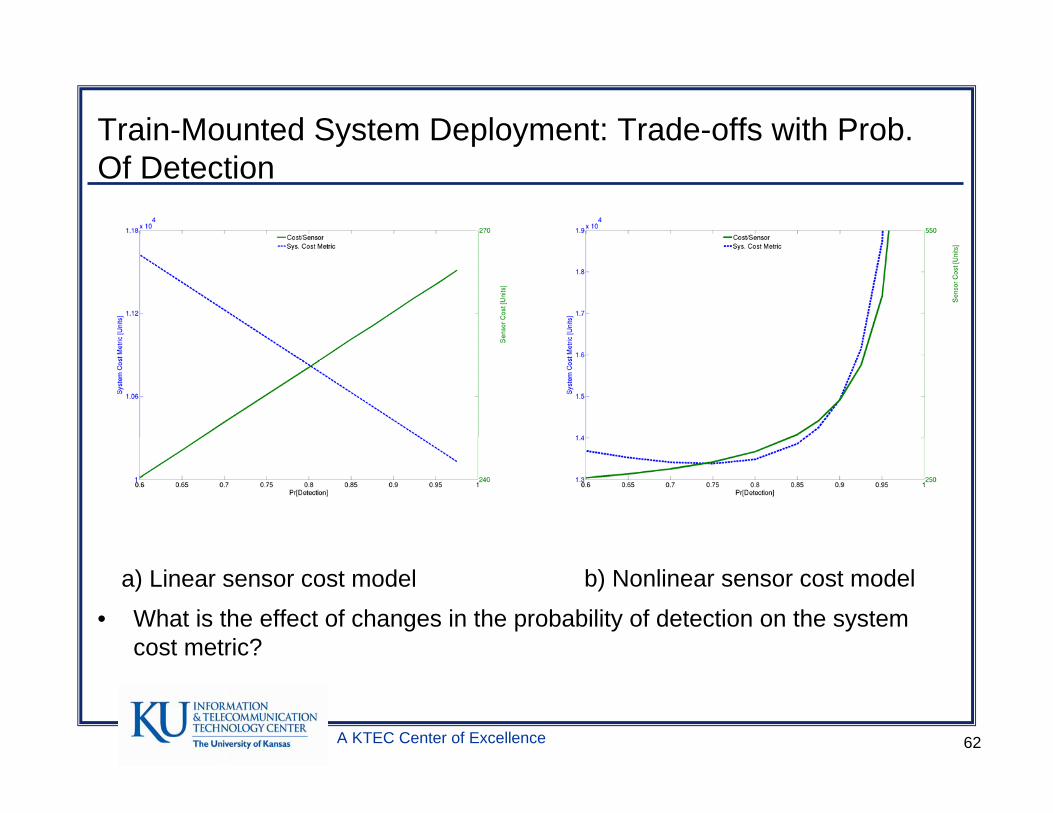
Train-Mounted System Deployment: Trade-offs with Prob. Of Detection
• What is the effect of changes in the probability of detection on the system cost metric?
a) Linear sensor cost model b) Nonlinear sensor cost model
A KTEC Center of Excellence 63
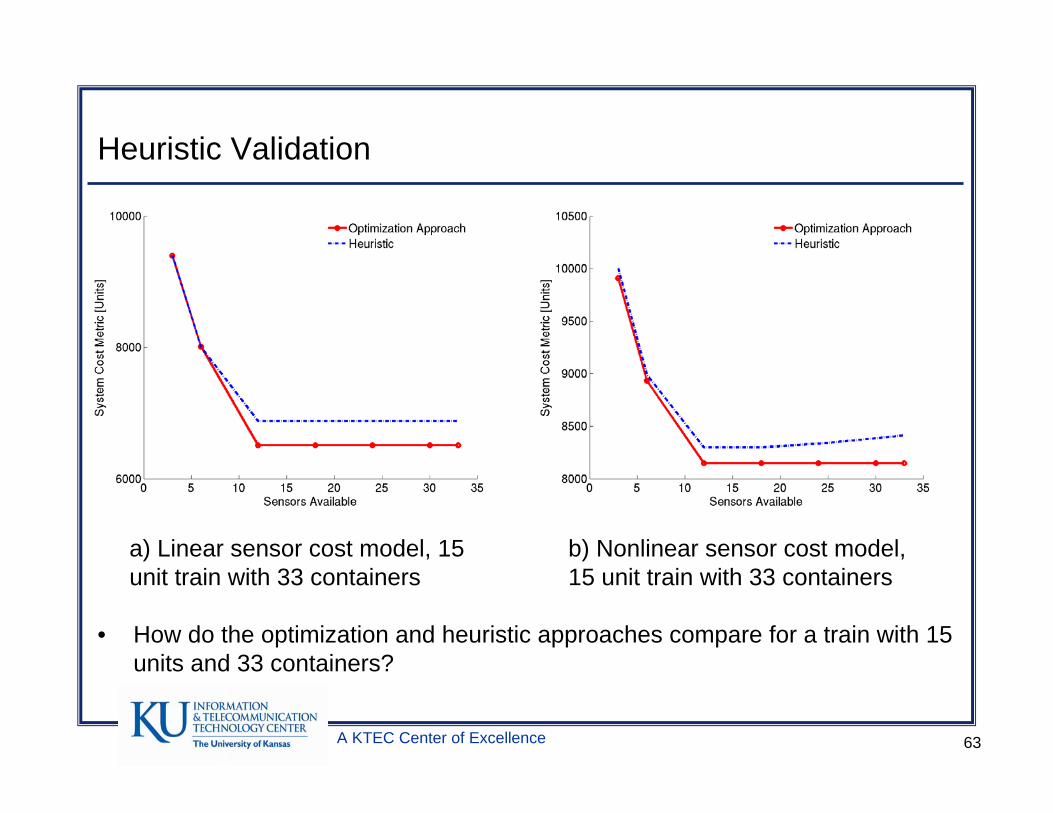
Heuristic Validation
a) Linear sensor cost model, 15 unit train with 33 containers
b) Nonlinear sensor cost model, 15 unit train with 33 containers
• How do the optimization and heuristic approaches compare for a train with 15 units and 33 containers?
A KTEC Center of Excellence 64
Conclusions
• An open system transportation security sensor network can be used to provide decision makers with timely notification of events on a train.
• Two mechanisms have been developed to determine sensor placements and system trade-offs when seeking visibility into cargo shipments.• Models show that it is cost-effective to use sensor networks for cargo
monitoring.
A KTEC Center of Excellence 65
Conclusions
• System trade-off studies showed that:• Optimal number of sensors is dependent on the container savings
distribution and the probability of critical event occurrence• For nonlinear sensor cost model the optimal probability of detection is
dependent on the probability of critical event occurrence• For the linear sensor cost model the optimal probability of detection is
independent of the probability of critical event occurrence• Optimal probability of false alarm is independent of the probability of
critical event occurrence and event reporting deadline.• System deployment cost is inversely related to the deadline for decision
maker notification.• Developed a heuristic for deploying sensors to a train
• Heuristic performance is reasonable when compared to optimization approach.