Embed Size (px)
Citation preview
Optimal choice of prototypes for ceramic typology
Uzy Smilansky (WIS) Avshalom Karasik (WIS)M. Bietak (Vienna)V. Mueller(Vienna)
Acknowledge support from : Bikura (ISF) ,Kimmel center for archaeological studies (WIS) .
Tel – el – Daba = AbidosThe capital of the Hyksos (1800-1600 bc)
Assemblage - 190 drinking cups w/o clear stratigraphical assignment.
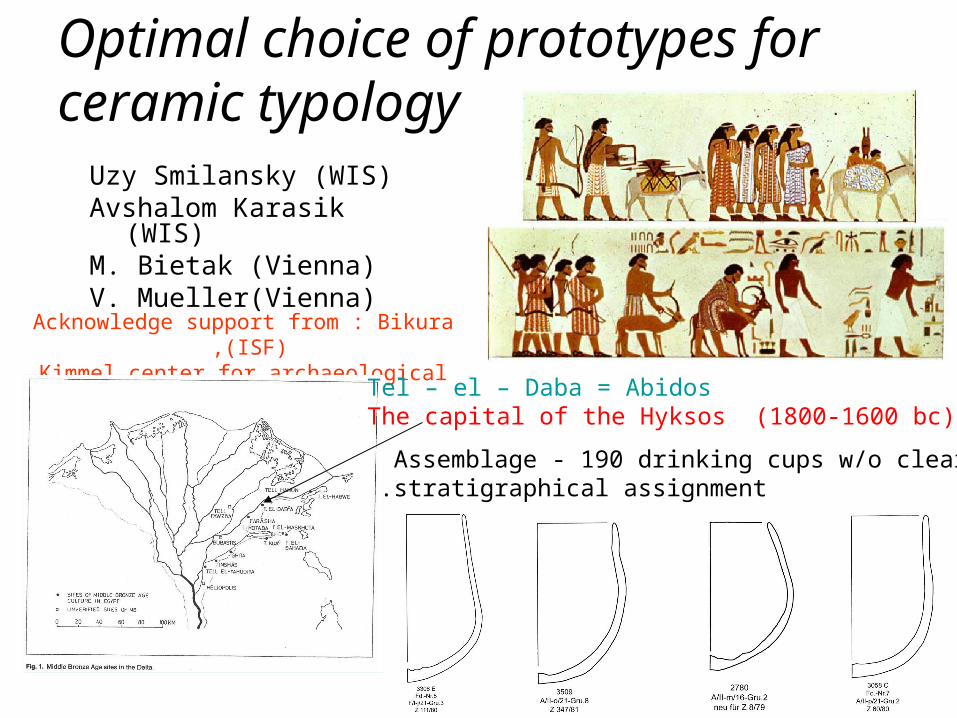
Typological analysis with a single index:)D. Arnold, M. Bietak (
H
DI
ds
dxs arccos)(
2
2
2
1
)(
ds
dx
ds
xd
ds
ds
-2 0 2 4 6 80
2
4
6
8
a.
cmcm
0 5 10 15 200
0.05
0.1
0.15
0.2
0.25b.
arc length
x(s)
0 5 10 15 20-1
0
1
2
3
4
5c.
arc length
0 5 10 15 20-0.15
-0.1
-0.05
0
0.05
0.1
0.15
0.2d.
arc length
k(s)(s)
t
s
x
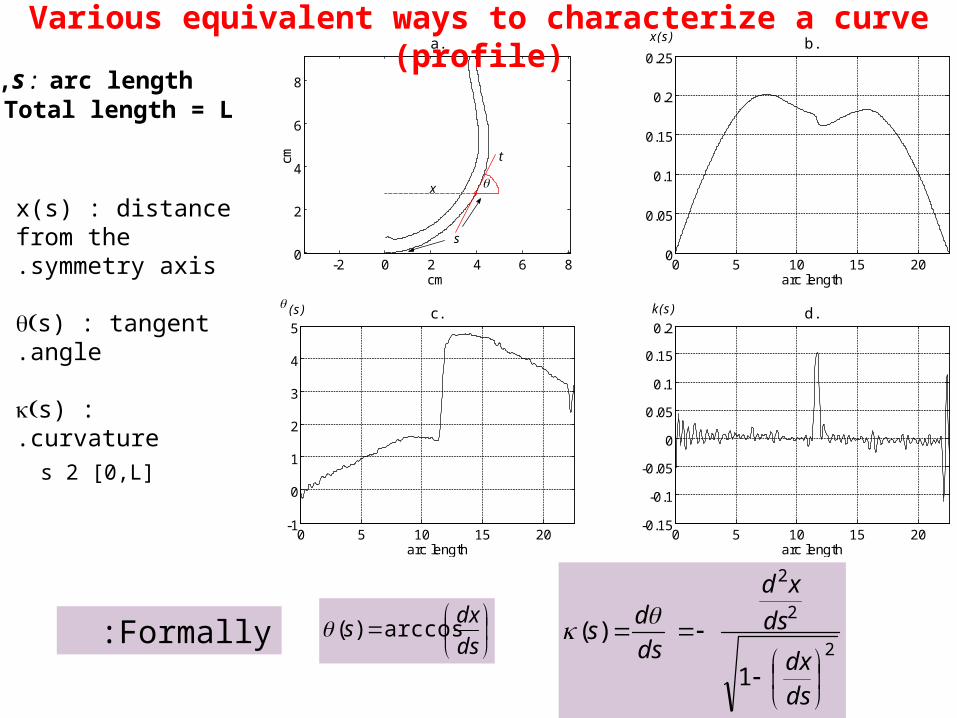
Various equivalent ways to characterize a curve (profile)
s : arc length,Total length = L
Formally :
s 2 [0,L]
x(s) : distance from the symmetry axis.
s) : tangent angle.
s) : curvature.
-2 0 2 4 6 80
2
4
6
8
a.
cm
cm
0 0.2 0.4 0.6 0.8 1-0.05
0
0.05
0.1
0.15
0.2
0.25
0.3b.
normalized arc length
x(s
)
0 0.2 0.4 0.6 0.8 1-1
0
1
2
3
4c.
normalized arc length
0 0.2 0.4 0.6 0.8 1-0.2
-0.1
0
0.1
0.2
0.3d.
normalized arc length
k(s
)
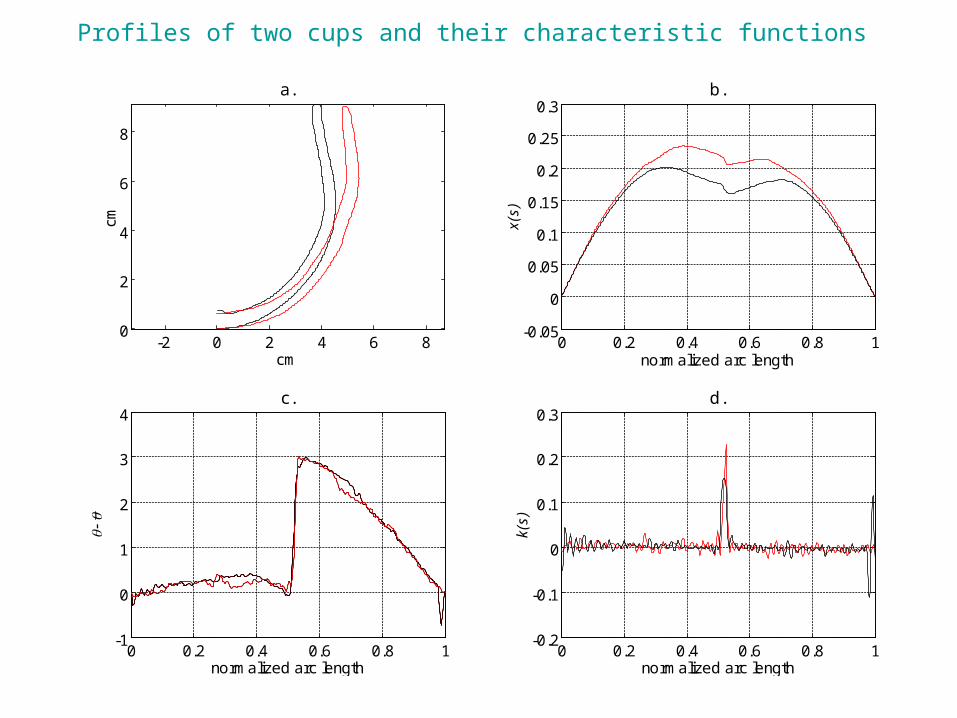
Profiles of two cups and their characteristic functions
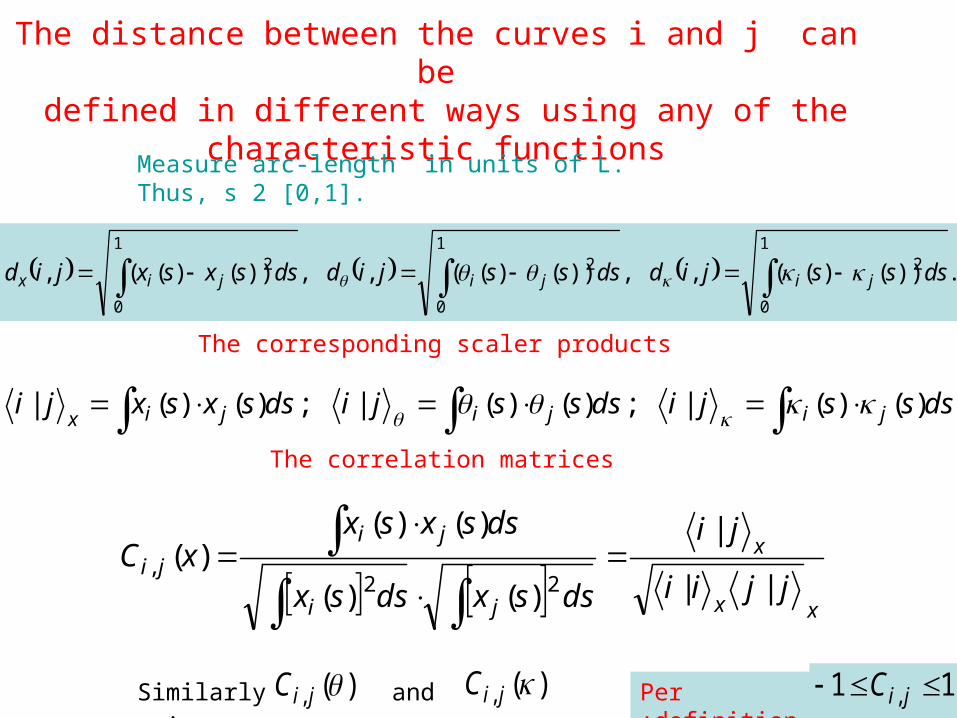
The distance between the curves i and j can bedefined in different ways using any of the
characteristic functions
.))()((,,))()((,,))()((,1
0
21
0
21
0
2 dsssjiddsssjiddssxsxjid jijijix
Measure arc-length in units of L. Thus, s 2 [0,1].
The corresponding scaler products
xx
x
ji
ji
jijjii
ji
dssxdssx
dssxsxxC
||
|
)()(
)()()(
22,
The correlation matrices
Similarly : )(, jiC and 11 , jiCPer definition:
dsssjidsssjidssxsxji jijijix)()(|;)()(|;)()(|
)(, jiC
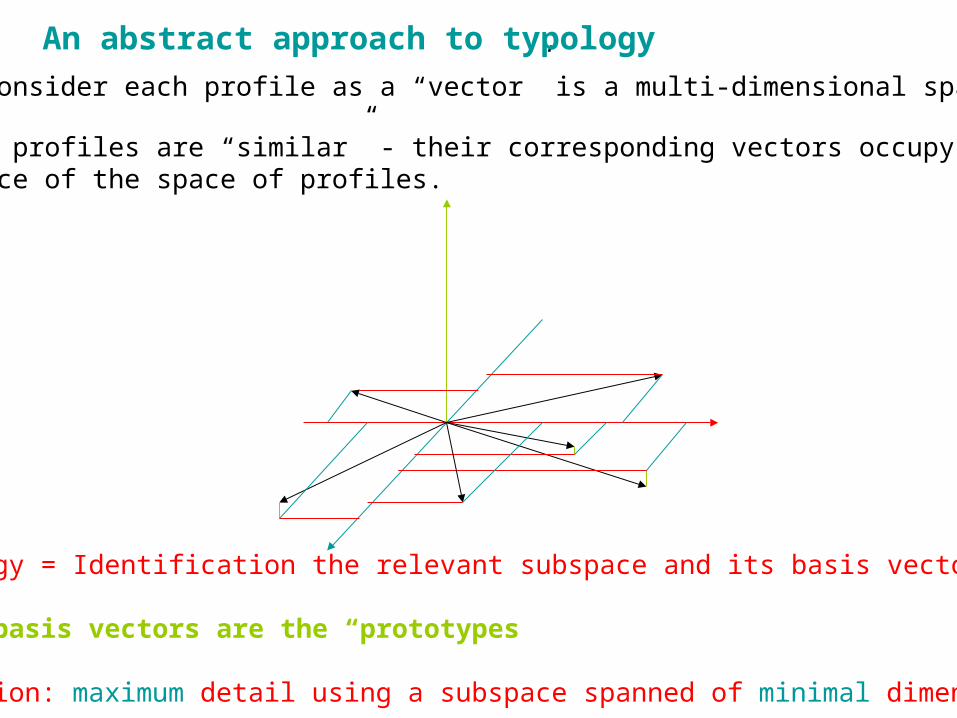
We consider each profile as a “vector” is a multi-dimensional space . If the profiles are “similar” - their corresponding vectors occupy only asubspace of the space of profiles.
Typology = Identification the relevant subspace and its basis vectors.
The basis vectors are the “prototypes.”
Criterion: maximum detail using a subspace spanned of minimal dimension.
An abstract approach to typology
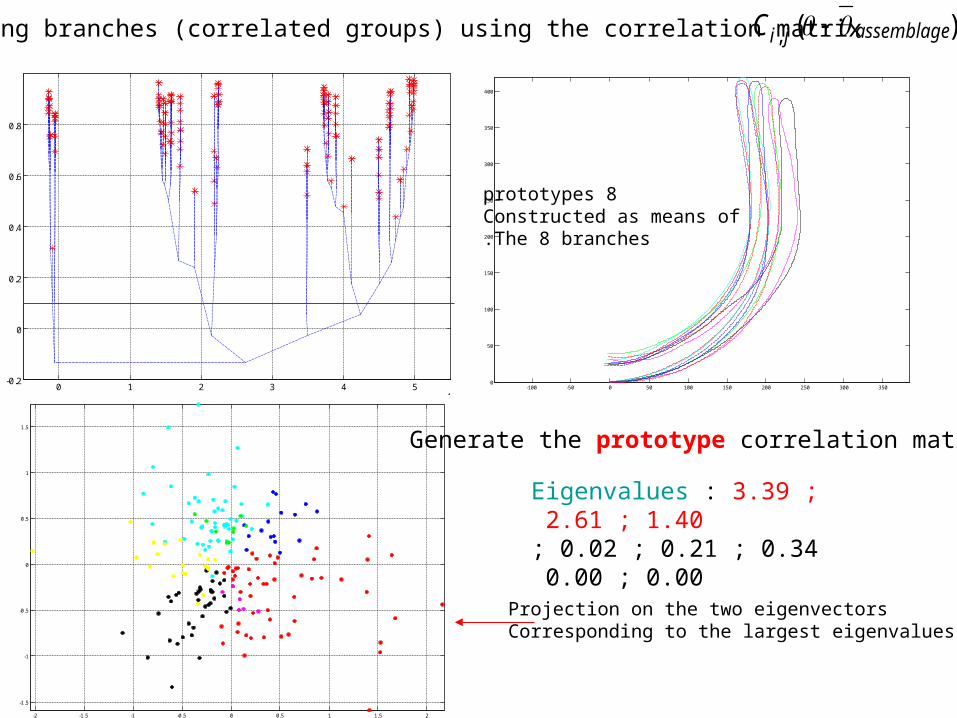
Sorting branches (correlated groups) using the correlation matrix
0 1 2 3 4 5
x 104
-0.2
0
0.2
0.4
0.6
0.8
-100 -50 0 50 100 150 200 250 300 3500
50
100
150
200
250
300
350
400
Eigenvalues : 3.39 ; 2.61 ; 1.40
0.34 ; 0.21 ; 0.02 ; 0.00 ; 0.00
-2 -1.5 -1 -0.5 0 0.5 1 1.5 2
-1.5
-1
-0.5
0
0.5
1
1.5
)(, assemblagejiC
Generate the prototype correlation matrix
Projection on the two eigenvectorsCorresponding to the largest eigenvalues
8 prototypesConstructed as means ofThe 8 branches.
-200 0 200 400 600 800-0.2
0
0.2
0.4
0.6
0.8
1
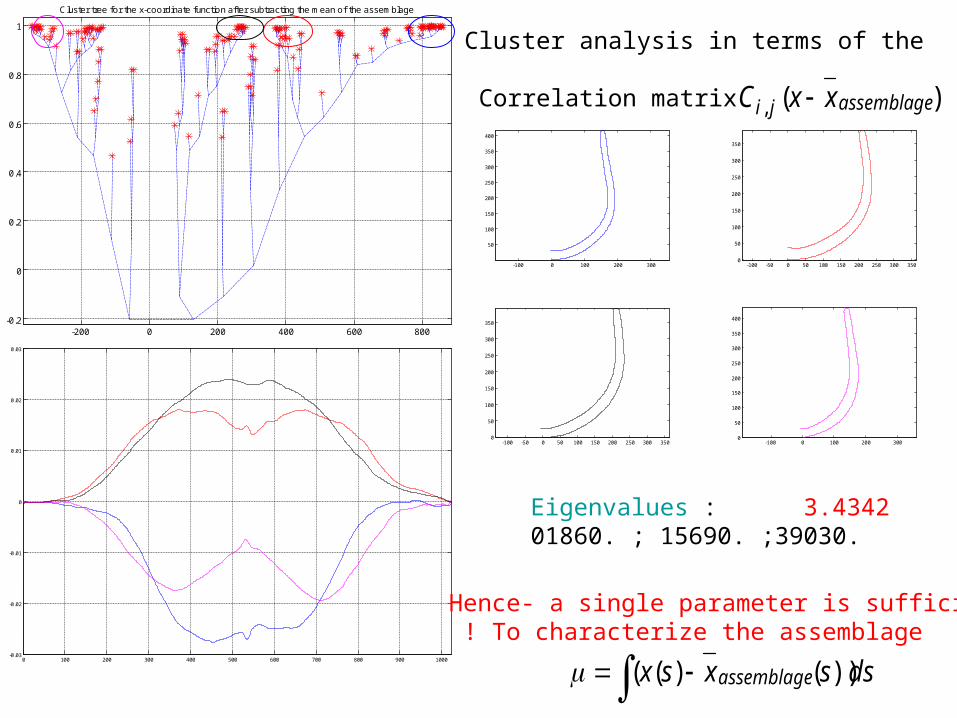
Cluster tree for the x-coordinate function after subtracting the mean of the assemblage
0 100 200 300 400 500 600 700 800 900 1000-0.03
-0.02
-0.01
0
0.01
0.02
0.03
Eigenvalues : 3.4342 .39030. ;15690. ; 01860
Hence- a single parameter is sufficientTo characterize the assemblage !
-100 0 100 200 300
50
100
150
200
250
300
350
400
-100 -50 0 50 100 150 200 250 300 3500
50
100
150
200
250
300
350
-100 -50 0 50 100 150 200 250 300 3500
50
100
150
200
250
300
350
-100 0 100 200 3000
50
100
150
200
250
300
350
400
Cluster analysis in terms of the Correlation matrix )(, assemblageji xxC
dssxsx assemblage ))()((
-1 -0.5 0 0.5 1 1.5 2 2.5 3 3.5 4
-1.5
-1
-0.5
0
0.5
1
1.5
2
2.5
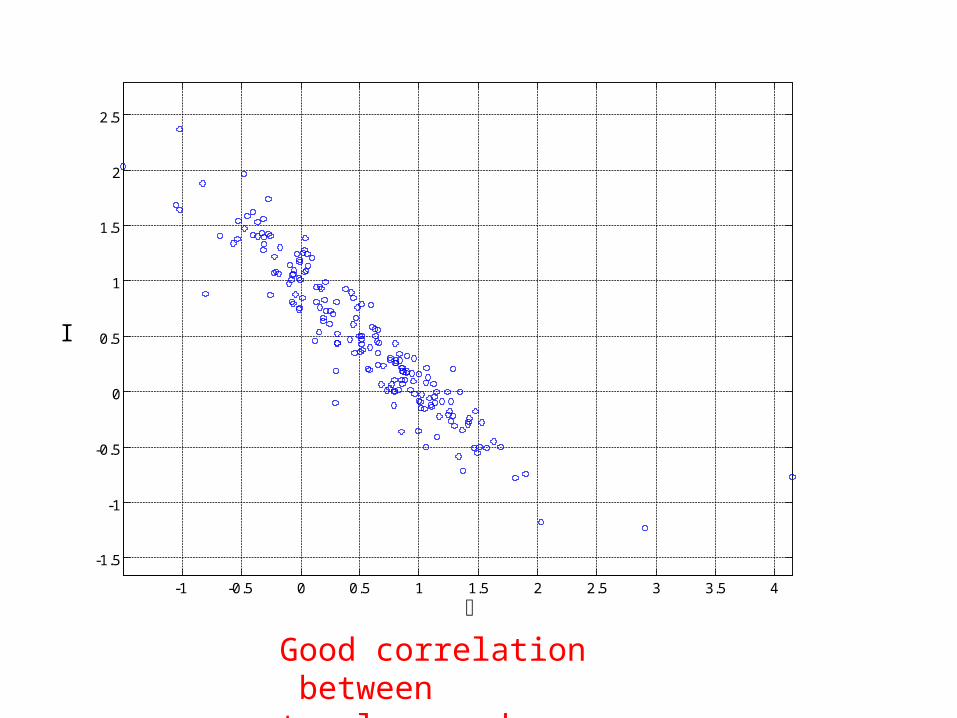
Bitak's parameter as a function of the distance of x-coordinate function,from the mean xcoordinate function
Good correlation between typology and chronology
I
Conclusions:
• The optimal mathematical characterization of the profiles depends primarily on the nature of the features of importance.
• The best set of independent prototypes is created by the eigenvectors of the prototype correlation matrix which correspond to the dominant eigenvalues.
• The chosen set of prototypes presents the best possible compromise which minimizes the number of prototypes, while maximizing the amount of preserved details.
• For further details on the method and other applications: visit- http://www.weizmann.ac.il/complex/uzy/archaeomath/research.html