Embed Size (px)
Citation preview
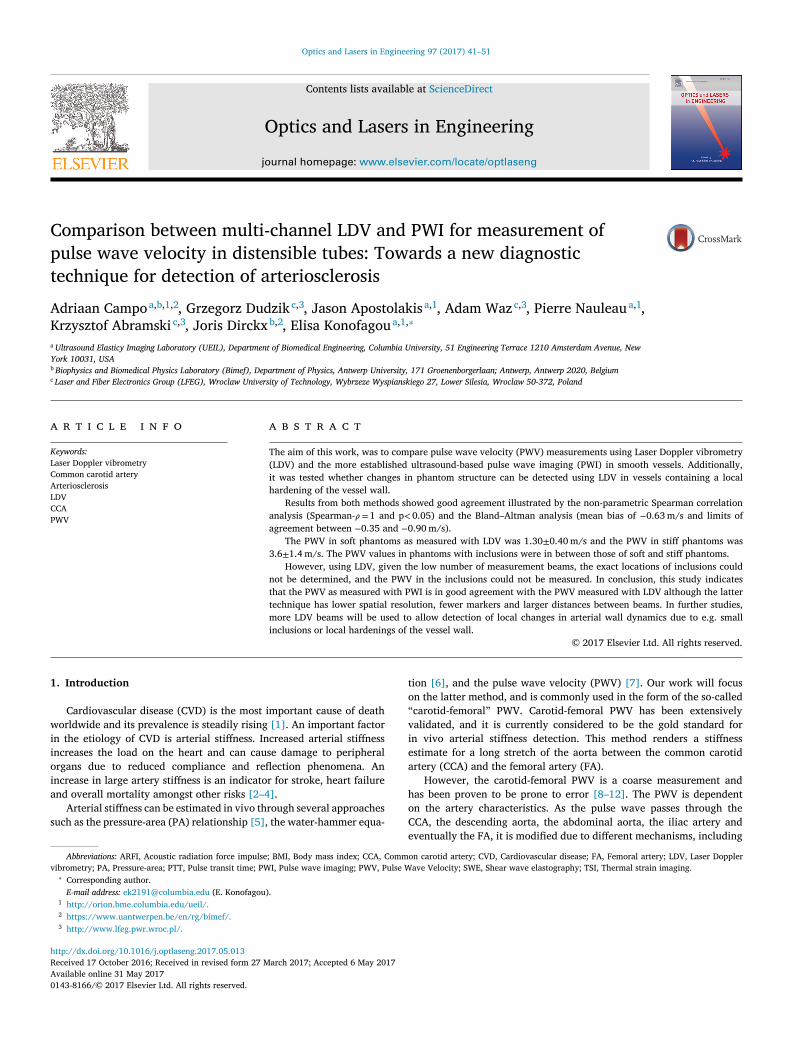
Optics and Lasers in Engineering 97 (2017) 41–51
Contents lists available at ScienceDirect
Optics and Lasers in Engineering
journal homepage: www.elsevier.com/locate/optlaseng
Comparison between multi-channel LDV and PWI for measurement of
pulse wave velocity in distensible tubes: Towards a new diagnostic
technique for detection of arteriosclerosis
Adriaan Campo
a , b , 1 , 2 , Grzegorz Dudzik
c , 3 , Jason Apostolakis a , 1 , Adam Waz c , 3 , Pierre Nauleau
a , 1 ,
Krzysztof Abramski c , 3 , Joris Dirckx
b , 2 , Elisa Konofagou
a , 1 , ∗
a Ultrasound Elasticy Imaging Laboratory (UEIL), Department of Biomedical Engineering, Columbia University, 51 Engineering Terrace 1210 Amsterdam Avenue, New
York 10031, USA b Biophysics and Biomedical Physics Laboratory (Bimef), Department of Physics, Antwerp University, 171 Groenenborgerlaan; Antwerp, Antwerp 2020, Belgium
c Laser and Fiber Electronics Group (LFEG), Wroclaw University of Technology, Wybrzeze Wyspianskiego 27, Lower Silesia, Wroclaw 50-372, Poland
a r t i c l e i n f o
Keywords:
Laser Doppler vibrometry
Common carotid artery
Arteriosclerosis
LDV
CCA
PWV
a b s t r a c t
The aim of this work, was to compare pulse wave velocity (PWV) measurements using Laser Doppler vibrometry
(LDV) and the more established ultrasound-based pulse wave imaging (PWI) in smooth vessels. Additionally,
it was tested whether changes in phantom structure can be detected using LDV in vessels containing a local
hardening of the vessel wall.
Results from both methods showed good agreement illustrated by the non-parametric Spearman correlation
analysis (Spearman- 𝜌= 1 and p < 0.05) and the Bland–Altman analysis (mean bias of − 0.63 m/s and limits of
agreement between − 0.35 and − 0.90 m/s).
The PWV in soft phantoms as measured with LDV was 1.30 ± 0.40 m/s and the PWV in stiff phantoms was
3.6 ± 1.4 m/s. The PWV values in phantoms with inclusions were in between those of soft and stiff phantoms.
However, using LDV, given the low number of measurement beams, the exact locations of inclusions could
not be determined, and the PWV in the inclusions could not be measured. In conclusion, this study indicates
that the PWV as measured with PWI is in good agreement with the PWV measured with LDV although the latter
technique has lower spatial resolution, fewer markers and larger distances between beams. In further studies,
more LDV beams will be used to allow detection of local changes in arterial wall dynamics due to e.g. small
inclusions or local hardenings of the vessel wall.
© 2017 Elsevier Ltd. All rights reserved.
1
w
i
i
o
i
a
s
v
t
o
“
v
i
e
a
h
o
C
h
R
A
0
. Introduction
Cardiovascular disease (CVD) is the most important cause of death
orldwide and its prevalence is steadily rising [1] . An important factor
n the etiology of CVD is arterial stiffness. Increased arterial stiffness
ncreases the load on the heart and can cause damage to peripheral
rgans due to reduced compliance and reflection phenomena. An
ncrease in large artery stiffness is an indicator for stroke, heart failure
nd overall mortality amongst other risks [2–4] .
Arterial stiffness can be estimated in vivo through several approaches
uch as the pressure-area (PA) relationship [5] , the water-hammer equa-
Abbreviations: ARFI, Acoustic radiation force impulse; BMI, Body mass index; CCA, Comm
ibrometry; PA, Pressure-area; PTT, Pulse transit time; PWI, Pulse wave imaging; PWV, Pulse W∗ Corresponding author.
E-mail address: [email protected] (E. Konofagou). 1 http://orion.bme.columbia.edu/ueil/. 2 https://www.uantwerpen.be/en/rg/bimef/. 3 http://www.lfeg.pwr.wroc.pl/.
e
ttp://dx.doi.org/10.1016/j.optlaseng.2017.05.013
eceived 17 October 2016; Received in revised form 27 March 2017; Accepted 6 May 2017
vailable online 31 May 2017
143-8166/© 2017 Elsevier Ltd. All rights reserved.
ion [6] , and the pulse wave velocity (PWV) [7] . Our work will focus
n the latter method, and is commonly used in the form of the so-called
carotid-femoral ” PWV. Carotid-femoral PWV has been extensively
alidated, and it is currently considered to be the gold standard for
n vivo arterial stiffness detection. This method renders a stiffness
stimate for a long stretch of the aorta between the common carotid
rtery (CCA) and the femoral artery (FA).
However, the carotid-femoral PWV is a coarse measurement and
as been proven to be prone to error [8–12] . The PWV is dependent
n the artery characteristics. As the pulse wave passes through the
CA, the descending aorta, the abdominal aorta, the iliac artery and
ventually the FA, it is modified due to different mechanisms, including
on carotid artery; CVD, Cardiovascular disease; FA, Femoral artery; LDV, Laser Doppler
ave Velocity; SWE, Shear wave elastography; TSI, Thermal strain imaging.
A. Campo et al. Optics and Lasers in Engineering 97 (2017) 41–51
c
o
r
m
d
c
r
f
t
t
b
i
c
r
f
e
s
p
i
t
o
r
s
t
a
e
i
p
t
w
d
p
A
(
p
w
d
p
w
m
t
c
s
w
s
2
2
S
G
g
(
R
c
a
u
s
c
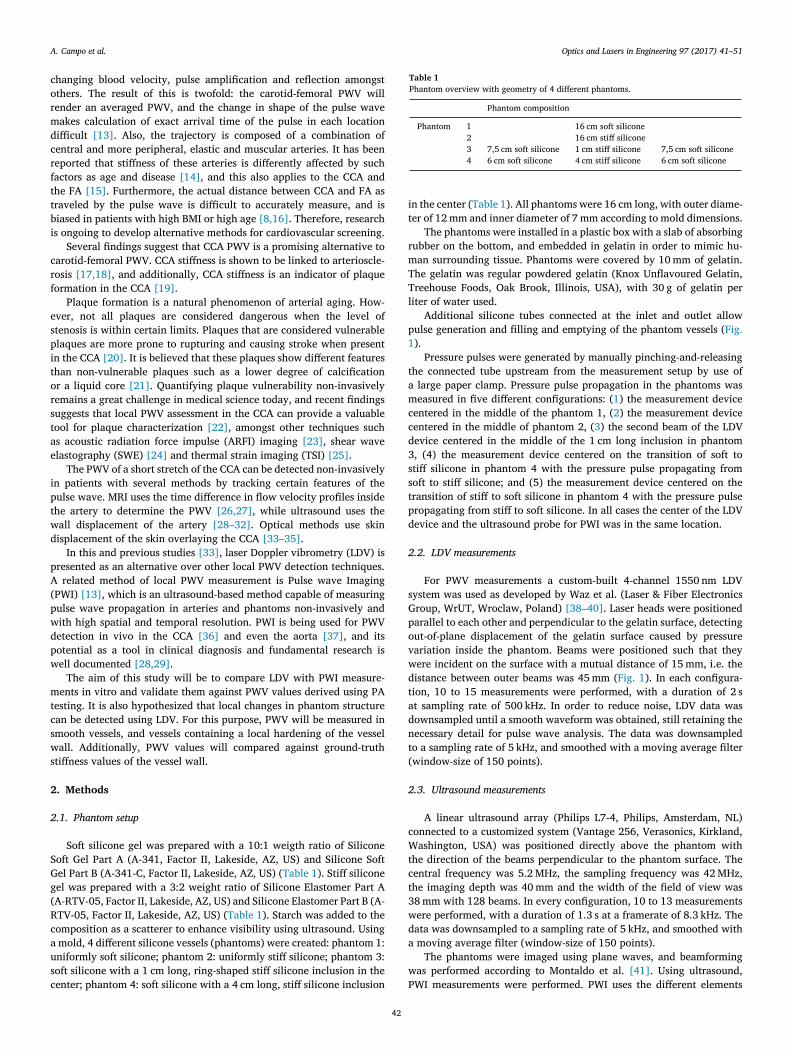
Table 1
Phantom overview with geometry of 4 different phantoms.
Phantom composition
Phantom 1 16 cm soft silicone
2 16 cm stiff silicone
3 7,5 cm soft silicone 1 cm stiff silicone 7,5 cm soft silicone
4 6 cm soft silicone 4 cm stiff silicone 6 cm soft silicone
i
t
r
m
T
T
l
p
1
t
a
m
c
c
d
3
s
s
t
p
d
2
s
G
p
o
v
w
d
t
a
d
n
t
(
2
c
W
t
c
t
3
w
d
a
w
P
hanging blood velocity, pulse amplification and reflection amongst
thers. The result of this is twofold: the carotid-femoral PWV will
ender an averaged PWV, and the change in shape of the pulse wave
akes calculation of exact arrival time of the pulse in each location
ifficult [13] . Also, the trajectory is composed of a combination of
entral and more peripheral, elastic and muscular arteries. It has been
eported that stiffness of these arteries is differently affected by such
actors as age and disease [14] , and this also applies to the CCA and
he FA [15] . Furthermore, the actual distance between CCA and FA as
raveled by the pulse wave is difficult to accurately measure, and is
iased in patients with high BMI or high age [8,16] . Therefore, research
s ongoing to develop alternative methods for cardiovascular screening.
Several findings suggest that CCA PWV is a promising alternative to
arotid-femoral PWV. CCA stiffness is shown to be linked to arterioscle-
osis [17,18] , and additionally, CCA stiffness is an indicator of plaque
ormation in the CCA [19] .
Plaque formation is a natural phenomenon of arterial aging. How-
ver, not all plaques are considered dangerous when the level of
tenosis is within certain limits. Plaques that are considered vulnerable
laques are more prone to rupturing and causing stroke when present
n the CCA [20] . It is believed that these plaques show different features
han non-vulnerable plaques such as a lower degree of calcification
r a liquid core [21] . Quantifying plaque vulnerability non-invasively
emains a great challenge in medical science today, and recent findings
uggests that local PWV assessment in the CCA can provide a valuable
ool for plaque characterization [22] , amongst other techniques such
s acoustic radiation force impulse (ARFI) imaging [23] , shear wave
lastography (SWE) [24] and thermal strain imaging (TSI) [25] .
The PWV of a short stretch of the CCA can be detected non-invasively
n patients with several methods by tracking certain features of the
ulse wave. MRI uses the time difference in flow velocity profiles inside
he artery to determine the PWV [26,27] , while ultrasound uses the
all displacement of the artery [28–32] . Optical methods use skin
isplacement of the skin overlaying the CCA [33–35] .
In this and previous studies [33] , laser Doppler vibrometry (LDV) is
resented as an alternative over other local PWV detection techniques.
related method of local PWV measurement is Pulse wave Imaging
PWI) [13] , which is an ultrasound-based method capable of measuring
ulse wave propagation in arteries and phantoms non-invasively and
ith high spatial and temporal resolution. PWI is being used for PWV
etection in vivo in the CCA [36] and even the aorta [37] , and its
otential as a tool in clinical diagnosis and fundamental research is
ell documented [28,29] .
The aim of this study will be to compare LDV with PWI measure-
ents in vitro and validate them against PWV values derived using PA
esting. It is also hypothesized that local changes in phantom structure
an be detected using LDV. For this purpose, PWV will be measured in
mooth vessels, and vessels containing a local hardening of the vessel
all. Additionally, PWV values will compared against ground-truth
tiffness values of the vessel wall.
. Methods
.1. Phantom setup
Soft silicone gel was prepared with a 10:1 weigth ratio of Silicone
oft Gel Part A (A-341, Factor II, Lakeside, AZ, US) and Silicone Soft
el Part B (A-341-C, Factor II, Lakeside, AZ, US) ( Table 1 ). Stiff silicone
el was prepared with a 3:2 weight ratio of Silicone Elastomer Part A
A-RTV-05, Factor II, Lakeside, AZ, US) and Silicone Elastomer Part B (A-
TV-05, Factor II, Lakeside, AZ, US) ( Table 1 ). Starch was added to the
omposition as a scatterer to enhance visibility using ultrasound. Using
mold, 4 different silicone vessels (phantoms) were created: phantom 1:
niformly soft silicone; phantom 2: uniformly stiff silicone; phantom 3:
oft silicone with a 1 cm long, ring-shaped stiff silicone inclusion in the
enter; phantom 4: soft silicone with a 4 cm long, stiff silicone inclusion
42
n the center ( Table 1 ). All phantoms were 16 cm long, with outer diame-
er of 12 mm and inner diameter of 7 mm according to mold dimensions.
The phantoms were installed in a plastic box with a slab of absorbing
ubber on the bottom, and embedded in gelatin in order to mimic hu-
an surrounding tissue. Phantoms were covered by 10 mm of gelatin.
he gelatin was regular powdered gelatin (Knox Unflavoured Gelatin,
reehouse Foods, Oak Brook, Illinois, USA), with 30 g of gelatin per
iter of water used.
Additional silicone tubes connected at the inlet and outlet allow
ulse generation and filling and emptying of the phantom vessels ( Fig.
).
Pressure pulses were generated by manually pinching-and-releasing
he connected tube upstream from the measurement setup by use of
large paper clamp. Pressure pulse propagation in the phantoms was
easured in five different configurations: ( 1 ) the measurement device
entered in the middle of the phantom 1, ( 2 ) the measurement device
entered in the middle of phantom 2, ( 3 ) the second beam of the LDV
evice centered in the middle of the 1 cm long inclusion in phantom
, (4) the measurement device centered on the transition of soft to
tiff silicone in phantom 4 with the pressure pulse propagating from
oft to stiff silicone; and (5) the measurement device centered on the
ransition of stiff to soft silicone in phantom 4 with the pressure pulse
ropagating from stiff to soft silicone. In all cases the center of the LDV
evice and the ultrasound probe for PWI was in the same location.
.2. LDV measurements
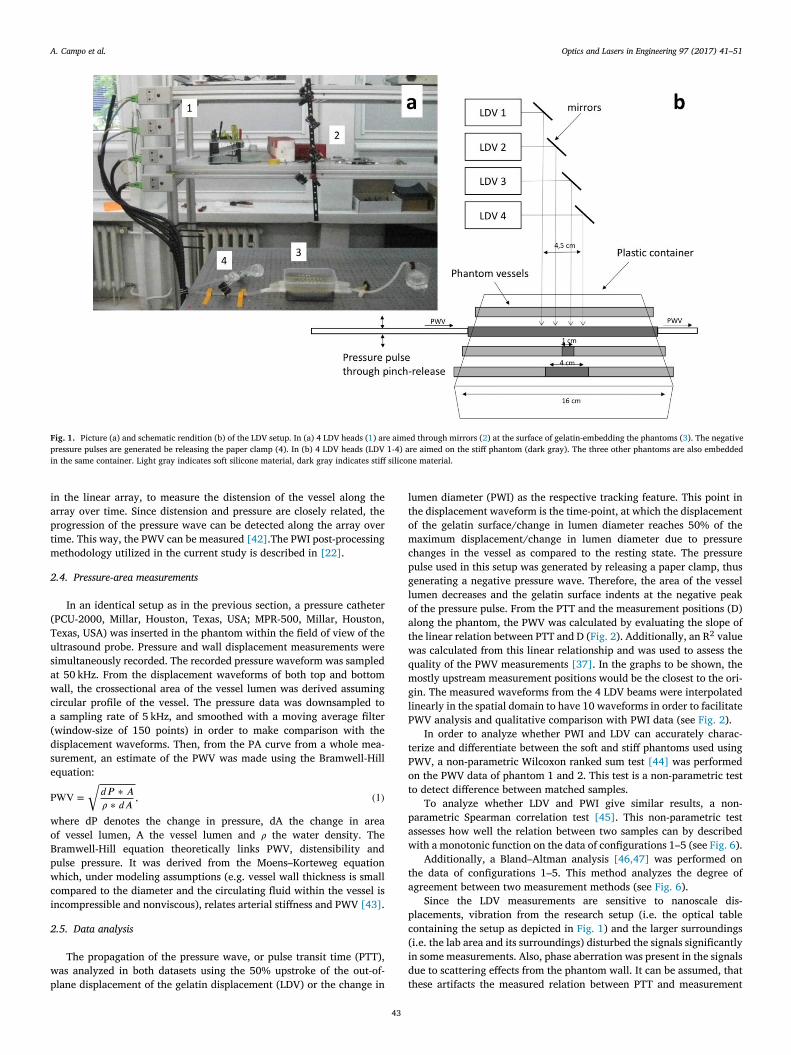
For PWV measurements a custom-built 4-channel 1550 nm LDV
ystem was used as developed by Waz et al. (Laser & Fiber Electronics
roup, WrUT, Wroclaw, Poland) [38–40] . Laser heads were positioned
arallel to each other and perpendicular to the gelatin surface, detecting
ut-of-plane displacement of the gelatin surface caused by pressure
ariation inside the phantom. Beams were positioned such that they
ere incident on the surface with a mutual distance of 15 mm, i.e. the
istance between outer beams was 45 mm ( Fig. 1 ). In each configura-
ion, 10 to 15 measurements were performed, with a duration of 2 s
t sampling rate of 500 kHz. In order to reduce noise, LDV data was
ownsampled until a smooth waveform was obtained, still retaining the
ecessary detail for pulse wave analysis. The data was downsampled
o a sampling rate of 5 kHz, and smoothed with a moving average filter
window-size of 150 points).
.3. Ultrasound measurements
A linear ultrasound array (Philips L7-4, Philips, Amsterdam, NL)
onnected to a customized system (Vantage 256, Verasonics, Kirkland,
ashington, USA) was positioned directly above the phantom with
he direction of the beams perpendicular to the phantom surface. The
entral frequency was 5.2 MHz, the sampling frequency was 42 MHz,
he imaging depth was 40 mm and the width of the field of view was
8 mm with 128 beams. In every configuration, 10 to 13 measurements
ere performed, with a duration of 1.3 s at a framerate of 8.3 kHz. The
ata was downsampled to a sampling rate of 5 kHz, and smoothed with
moving average filter (window-size of 150 points).
The phantoms were imaged using plane waves, and beamforming
as performed according to Montaldo et al. [41] . Using ultrasound,
WI measurements were performed. PWI uses the different elements
A. Campo et al. Optics and Lasers in Engineering 97 (2017) 41–51
Fig. 1. Picture (a) and schematic rendition (b) of the LDV setup. In (a) 4 LDV heads ( 1 ) are aimed through mirrors ( 2 ) at the surface of gelatin-embedding the phantoms ( 3 ). The negative
pressure pulses are generated be releasing the paper clamp (4). In (b) 4 LDV heads (LDV 1-4) are aimed on the stiff phantom (dark gray). The three other phantoms are also embedded
in the same container. Light gray indicates soft silicone material, dark gray indicates stiff silicone material.
i
a
p
t
m
2
(
T
u
s
a
w
c
a
(
d
s
e
P
w
o
B
p
w
c
i
2
w
p
l
t
o
m
c
p
g
l
o
a
t
w
q
m
g
l
P
t
P
o
t
p
a
w
t
a
p
c
(
i
d
these artifacts the measured relation between PTT and measurement
n the linear array, to measure the distension of the vessel along the
rray over time. Since distension and pressure are closely related, the
rogression of the pressure wave can be detected along the array over
ime. This way, the PWV can be measured [42] .The PWI post-processing
ethodology utilized in the current study is described in [22] .
.4. Pressure-area measurements
In an identical setup as in the previous section, a pressure catheter
PCU-2000, Millar, Houston, Texas, USA; MPR-500, Millar, Houston,
exas, USA) was inserted in the phantom within the field of view of the
ltrasound probe. Pressure and wall displacement measurements were
imultaneously recorded. The recorded pressure waveform was sampled
t 50 kHz. From the displacement waveforms of both top and bottom
all, the crossectional area of the vessel lumen was derived assuming
ircular profile of the vessel. The pressure data was downsampled to
sampling rate of 5 kHz, and smoothed with a moving average filter
window-size of 150 points) in order to make comparison with the
isplacement waveforms. Then, from the PA curve from a whole mea-
urement, an estimate of the PWV was made using the Bramwell-Hill
quation:
WV =
√
𝑑𝑃 ∗ 𝐴
𝜌 ∗ 𝑑𝐴
, (1)
here dP denotes the change in pressure, dA the change in area
f vessel lumen, A the vessel lumen and 𝜌 the water density. The
ramwell-Hill equation theoretically links PWV, distensibility and
ulse pressure. It was derived from the Moens–Korteweg equation
hich, under modeling assumptions (e.g. vessel wall thickness is small
ompared to the diameter and the circulating fluid within the vessel is
ncompressible and nonviscous), relates arterial stiffness and PWV [43] .
.5. Data analysis
The propagation of the pressure wave, or pulse transit time (PTT),
as analyzed in both datasets using the 50% upstroke of the out-of-
lane displacement of the gelatin displacement (LDV) or the change in
43
umen diameter (PWI) as the respective tracking feature. This point in
he displacement waveform is the time-point, at which the displacement
f the gelatin surface/change in lumen diameter reaches 50% of the
aximum displacement/change in lumen diameter due to pressure
hanges in the vessel as compared to the resting state. The pressure
ulse used in this setup was generated by releasing a paper clamp, thus
enerating a negative pressure wave. Therefore, the area of the vessel
umen decreases and the gelatin surface indents at the negative peak
f the pressure pulse. From the PTT and the measurement positions (D)
long the phantom, the PWV was calculated by evaluating the slope of
he linear relation between PTT and D ( Fig. 2 ). Additionally, an R
2 value
as calculated from this linear relationship and was used to assess the
uality of the PWV measurements [37] . In the graphs to be shown, the
ostly upstream measurement positions would be the closest to the ori-
in. The measured waveforms from the 4 LDV beams were interpolated
inearly in the spatial domain to have 10 waveforms in order to facilitate
WV analysis and qualitative comparison with PWI data (see Fig. 2 ).
In order to analyze whether PWI and LDV can accurately charac-
erize and differentiate between the soft and stiff phantoms used using
WV, a non-parametric Wilcoxon ranked sum test [44] was performed
n the PWV data of phantom 1 and 2. This test is a non-parametric test
o detect difference between matched samples.
To analyze whether LDV and PWI give similar results, a non-
arametric Spearman correlation test [45] . This non-parametric test
ssesses how well the relation between two samples can by described
ith a monotonic function on the data of configurations 1–5 (see Fig. 6 ).
Additionally, a Bland–Altman analysis [46,47] was performed on
he data of configurations 1–5. This method analyzes the degree of
greement between two measurement methods (see Fig. 6 ).
Since the LDV measurements are sensitive to nanoscale dis-
lacements, vibration from the research setup (i.e. the optical table
ontaining the setup as depicted in Fig. 1 ) and the larger surroundings
i.e. the lab area and its surroundings) disturbed the signals significantly
n some measurements. Also, phase aberration was present in the signals
ue to scattering effects from the phantom wall. It can be assumed, that

A. Campo et al. Optics and Lasers in Engineering 97 (2017) 41–51
Fig. 2. Spatiotemporal maps of interpolated (4 to 10) LDV measurements in soft (a) and stiff (b) phantoms and PWI measurements in soft (c) and stiff (d) phantoms. The x-axis represents
the time-domain, the y-axis represents the measurement position, and the color indicates change in lumen diameter of the vessel (c and d) or out-of-plane displacement of the gelatin
surface (a and b). The dashed line indicates the 50% threshold of maximum displacement/change in lumen diameter as used for calculating PWV. The red rectangle in (d), delineates
the zone zoomed in upon in Fig. 2e. The linear relation between measurement position and 50% upstroke point is clearly visible (e). (For interpretation of the references to color in this
figure legend, the reader is referred to the web version of this article.)
44

A. Campo et al. Optics and Lasers in Engineering 97 (2017) 41–51
Table 2
Increase in diameter (PWI) and displacement amplitude (LDV) in five different configurations.
Configuration Method (N) Max change in lumen diameter (PWI, 𝜇m) or max displacement of gelatin surface (LDV, μm)
Soft Stiff Soft
1 PWI (10) 295 ± 50 N/A N/A
LDV (10) 85 ± 16
2 PWI (10) N/A 97 ± 12
LDV (10) 78 ± 28
3 PWI (10) 250 ± 28 91 ± 28 357 ± 30
LDV (10) 54 ± 15 53 ± 15 63 ± 18
4 PWI (10) 277 ± 32 89 ± 31 N/A
LDV (9) 73 ± 16 44 ± 11
5 PWI (10) N/A 107 ± 11 378 ± 33
LDV (10) 46.1 ± 9.1 81 ± 16
Table 3
The PWV of different phantoms in five different configurations as measured with PWI
and LDV. N indicates sample number.
Method Configuration Average PWV ± SD (m/s) Average R ± SD N
LDV Soft 1.30 ± 0.40 0.9878 ± 0.0090 10
Stiff 3.6 ± 1.4 0.915 ± 0.085 10
1 cm 1.6 ± 0.89 0.932 ± 0.066 10
Soft-stiff 3.5 ± 2.7 0.91 ± 0.12 9
Stiff-soft 1.5 ± 1.6 0.9870 ± 0.0088 10
PWI Soft 2.39 ± 0.83 0.981 ± 0.010 10
Stiff 4.7 ± 1.4 0.9936 ± 0.0031 10
1 cm 3.3 ± 1.4 0.920 ± 0.031 10
Soft-stiff 4.5 ± 2.6 0.950 ± 0.079 10
Stiff-soft 2.82 ± 0.98 0.941 ± 0.016 10
PA Soft 1.341 ± 0.015 / 3
Stiff 2.787 ± 0.050 / 3
p
q
a
3
3
u
(
a
fi
3
2
d
3
f
i
p
t
i
P
3
i
p
i
f
P
3
b
m
D
2
P
W
T
m
e
p
c
l
s
i
i
1
P
𝑎
w
a
T
3
s
S
a
t
b
4
4
C
b
s
m
c
t
osition D, as evaluated by the R
2 value. Therefore, to ensure highest
uality, a threshold was placed on the LDV measurements, discarding
ny measurement with an R
2 value less than 0.5.
. Results
.1. LDV measurements
The maximum amplitude of gelatin displacement is 85 ± 16 μm in the
niformly soft phantom and 78 ± 28 μm in the uniformly stiff phantom
see Table 2 ). In the uniformly soft phantom, the PWV is 1.30 ± 0.40 m/s
nd in the uniformly stiff phantom the PWV is 3.6 ± 1.4 m/s. In con-
guration 3, the PWV is 1.6 ± 0.89 m/s; in configuration 4, the PWV is
.5 ± 2.7 m/s and in configuration 5, the PWV is 1.5 ± 1.6 m/s (see Tables
and 3 , Figs. 2–4 ). Values are being reported in mean ± standard
eviation (SD).
.2. PWI measurements
The maximum incremental increase in lumen diameter between
rames is 295 ± 50 μm in the uniformly soft phantom and 97 ± 12 μm
n the uniformly stiff phantom (see Table 2 ). In the uniformly soft
hantom, the PWV is 2.39 ± 0.83 m/s and in the uniformly stiff phantom
he PWV is 4.7 ± 1.4 m/s. In configuration 3, the PWV is 3.3 ± 1.4 m/s;
n configuration 4, the PWV is 4.5 ± 2.6 m/s and in configuration 5, the
WV is 2.787 ± 0.050 m/s (see Tables 2 and 3 , Figs. 2 and 4 ).
.3. Pressure-area measurements
Static pressures inside the phantoms at the beginning of the exper-
ment are between 600 and 650 Pa, pressures during the propagating
ulse are between 0 and 850 Pa. The lumen area inside the phantoms
s between 55 and 70 mm
2 for the soft phantom and 80 and 86 mm
2
or the stiff phantom. The PWV of the soft part is 1.341 ± 0.015 m/s, the
WV of the stiff part is 2.787 ± 0.050 m/s (see Fig. 5 ).
45
.4. Precision and accuracy estimation
PWV is determined by evaluating the slope of the linear relation
etween detected timepoints of 50% upstroke (T) and associated
easurement location (D). Thus, PWV is a function of input quantities
and T: PWV = f(D,T) and is estimated from n pairs (Di,Ti) with (i = 1,
, …,N) as follows:
WV = f ( D , T ) =
∑𝑁
𝑖 =1 (𝑇 𝑖 − �̂�
)∗ (𝐷 𝑖 − �̂�
)∑𝑁
𝑖 =1 (𝑇 𝑖 − �̂�
)2 (2)
ith �̂� and �̂� being the means of the respective input quantities D and
. D and T are being determined by manual measurement (LDV) or
anufacturers probe characteristics (PWI). Thus, the precision of Di is
stimated 1.0 mm in the case of LDV and 0.30 in the case of PWI. The
recision of Ti is estimated as the sample frequency, which is 0.20 ms.
We will not consider precision nor accuracy in the phantoms
ontaining inclusions, since these are non-ideal situation. I.e. the
inear relationship between T and D is strongly biased. The combined
tandard precision for the smooth phantoms (i.e. the ones without
nclusions) is determined using the standard deviations on the PWV,
.e. experimentally determined precision. This standard precision is
.4 m/s both for PWI and LDV, in this particular setup.
The accuracy is expressed as the difference between the expected
WV value and the measured PWV value:
𝑐 𝑐 𝑢𝑟𝑎𝑐 𝑦 = 𝑒𝑥𝑝𝑒𝑐𝑡𝑒𝑑 𝑃 𝑊 𝑉 𝑣𝑎𝑙𝑢𝑒 − 𝑚𝑒𝑎𝑠𝑢𝑟𝑒𝑑 𝑃 𝑊 𝑉 𝑣𝑎𝑙𝑢𝑒 (3)
ith measured PWV values being the PWV determined by PWI and LDV,
nd the expected PWV value being determined by the PA experiments.
he accuracy is − 0.81 ± 1.4 m/s for the LDV and − 1.9 ± 1.4 m/s for PWI.
.5. Comparison of methods
The non-parametric Spearman correlation analysis of all five mea-
ured configurations comparing 2 measurement techniques, shows a
pearman- 𝜌 1 at a significance level of p < 0.05. The Bland–Altman
nalysis of all five measured configurations comparing 2 measurement
echniques shows a mean bias of − 0.63 m/s and limits of agreement
etween − 0.35 and − 0.90 m/s (see Fig. 6 ).
. Discussion
.1. Introduction
Arterial stiffness is an important parameter in the aetiology of
VD and research is ongoing to assess arterial stiffness to acquire a
etter understanding of this parameter and to use it for cardiovascular
creening. Several approaches are currently being explored for reliable
easurement of local CCA stiffness. CCA stiffness has clinical signifi-
ance as a putative indicator of large artery stiffness, and it is suspected
o be an indicator of vulnerable plaque formation. Recently, LDV is

A. Campo et al. Optics and Lasers in Engineering 97 (2017) 41–51
Fig. 3. In (a), relation of average pulse transit time (PTT) and measurement position is indicated as measured with LDV. In (b), average maximum amplitude of surface displacements
is displayed along the measurement position as measured with LDV. The different line styles represent the five different investigated configurations as described in the methods section.
Fig. 4. Comparison of the PWV as measured by three different methods. ∗ : p < 0.001; ∗ ∗ : p < 0.0005; ∗ ∗ ∗ : p < 0.0001 with p being the probability that results are from the same population.
b
w
a
u
p
w
4
M
u
t
i
b
a
p
m
i
6
f
i
v
4
v
a
l
m
o
a
i
s
t
s
o
v
o
eing developed for local stiffness detection. The aim of this study
as to compare LDV with the more established PWI technique in vitro
nd validate both techniques against ground-truth PWV values derived
sing PA testing. Additionally, it was tested whether local changes in
hantom structure can be detected using LDV. For this purpose, PWV
as measured in vessels containing a local hardening of the vessel wall.
.2. Comparison of PWV measurements in smooth vessels
The spatial resolution of LDV was 30 times lower than PWI’s.
oreover, PTT was evaluated based on the waveform (using the 50%
pstroke method). The origin of the waveform, is very different in both
echniques, with the waveform evaluated in PWI being the change
n diameter of the vessel lumen, and the waveform evaluated in LDV
eing a displacement of the gelatin surface covering the vessel. Thus,
lthough the reference point is the same from a signal processing
erspective, the physical meaning will be different. Nevertheless, both
ethods yielded similar findings (see Table 3 and Fig. 4 ) as reflected
n the correlation (see Fig. 6 a) and the Bland–Altman analyses (see Fig.
b). Additionally, both PWI and LDV were capable of distinguishing soft
46
rom stiff phantoms (see Table 3 and Fig. 4 ), and PWV values measured
n these phantoms were in line with theoretical “ground-truth ” PWV
alues as derived from the PA relationship.
.3. Comparison of PWV measurements in vessels containing an inclusion
Soft phantoms containing a stiff inclusion, had a higher overall PWV
alue compared to their uniformly soft counterpart (see Fig. 4 ). It can be
ssumed that the velocity of the pulse wave was affected locally by the
ocal changes in artery stiffness [22] . However, since only 4 measure-
ent points were used, these local changes in PWV could not be readily
bserved using LDV. It should be noted that the measurement errors
re in general larger, when measuring on a reflection site, as is the case
n situations 3-5 (coefficient of variation is on average 34 ± 4% for the
mooth vessels, and 62 ± 26% for the vessels containing an inclusion). At
he site of the inclusion, where the pressure wave propagates from the
oft-to-stiff, or from the stiff-to-soft part of the phantom, reflections and
ther significant perturbations of the system emanate locally, causing
ariability in the measurement outcome. Moreover, the traditional way
f estimating PWV (in contrast to e.g. piece-wise pulse wave analysis

A. Campo et al. Optics and Lasers in Engineering 97 (2017) 41–51
Fig. 5. Example of a simultaneously measured lumen area (blue graph) pressure (red
graph) in soft (a) and stiff (b) phantoms. (For interpretation of the references to color in
this figure legend, the reader is referred to the web version of this article.)
[
H
t
w
s
2
s
d
f
r
d
l
m
c
w
t
t
4
1
−
H
s
a
a
R
e
s
y
f
c
v
y
t
[
i
p
l
s
4
M
m
r
i
o
p
t
b
v
a
i
w
a
h
j
o
i
r
i
F
B
22] ), assumes that distensibility does not change along the vessel.
owever, when evaluating the PWV over an inclusion with altered dis-
ensibility, this assumption is violated, resulting in biased PWV results.
In the displacement results (see Fig. 3 ), it could be observed that the
all displacement and diameter change is larger in the softer parts and
maller in the stiffer parts (70–80 μm compared to 50–60 μm and 250–
80 compared to 80–110 μm respectively), representing the phantom
tructure accurately. It should be stressed that the discordance between
isplacement and diameter values ( Table 2 ), is because they have a dif-
erent physical meaning: the values originating from PWI measurements
epresent change in lumen diameter, i.e. the change due to combined
ownward movement of the upper wall and upward movement of the
ower wall of the vessel; while the values originating from LDV measure-
ents represent downward displacement of the surface of the gelatin
overing the vessel. However, for a LDV-driven quantitative assessment
ith exact pinpointing of the location of the structural differences within
he phantom, a higher number of beams is likely to be required, poten-
ially even to match spatial resolution of PWI (128 beams per 38 mm).
.4. Translation to the clinic: where are we now?
In the uniform vessels, the standard precision was determined as
.4 m/s both for PWI and LDV and the accuracy was determined as
0.81 ± 1.40 m/s for the LDV and − 1.9 ± 1.4 m/s for PWI measurements.
owever, the authors stress that the uncertainties from a measurement
etup will not transfer readily to a real-life biomedical situation. The
ig. 6. Correlation plot (left) and Bland–Altman plot (right) of the PWV as measured with PW
land–Altman analysis shows a mean bias of − 0.63 m/s and limits of agreement between − 0.35
47
rtifacts in this environment very different, and are likely to pose
dditional challenges.
Carotid-femoral PWV, is extensively described in the literature.
eference “healthy ” and “at-risk ” values have been determined for
ach age group, and the relation between carotid-femoral PWV and
everal pathologies has been described. e.g., in a healthy, young ( < 30
ears old) population, the carotid-femoral PWV can be expected to
all between 4.7 and 7.6 m/s [48] , while in hypertensive patients, a
arotid-femoral PWV above 13 m/s is a strong predictor of cardio-
ascular mortality [49] . However, similar extensive research has not
et been accomplished for CCA PWV. Although the literature suggests
hat CCA PWV values generally fall in the range of 4.3–8.3 m/s (e.g.
31,36] ) in young healthy volunteers, research is scarce, and very little
s known about CCA PWV in age and disease, and CCA PWV for use in
laque determination is in early stages of exploration [50] .
Future research will reveal what requirements are needed on the
evel of precision and accuracy with current approaches, either for
tiffness detection or for plaque determination.
.5. The benefits and weaknesses of LDV as apparent from this experiment
At present, the spatial resolution of LDV is low compared to PWI.
oreover, LDV measures displacements at the nanoscale level [51,52] ,
aking a measurement susceptible to all kinds of artifacts, such as
inging and other vibrations in the measurement environment, or
nvoluntary body motions [33] . Also, it should be noted, that the LDV
nly measures displacement information of the outer wall of the CCA,
ossibly masking stiffness information of the inner wall. This in contrast
o PWI, which is capable of measuring displacement information of
oth inner and outer CCA wall (see Fig. 7 ) while additionally providing
aluable information such as blood velocity, degree stenosis and plaque
natomy. Also, accurate and reproducible positioning of the LDV device
s challenging, especially in elder or obese patients, while lacking the
indow on the CCA anatomy as is the case with PWI. Finally, CCA
natomy differs between subjects, with the CCA sometimes lying deeply
idden in the flesh, or close or under other moving structures such as the
ugular vein. Not only does this make it difficult to detect the trajectory
f the CCA, but it can also contaminate the displacement signal [53] .
On the other hand, the readout of the displacement measurement
s direct with no extensive post-processing of large datasets, such that
esults can be acquired in real time. The technique is non-contact, avoid-
ng any interference with artery mechanics during measurements [33] .
I and LDV. The Spearman correlation analysis returns a Spearman- 𝜌 1 with p < 0.05; the
and − 0.90 m/s.
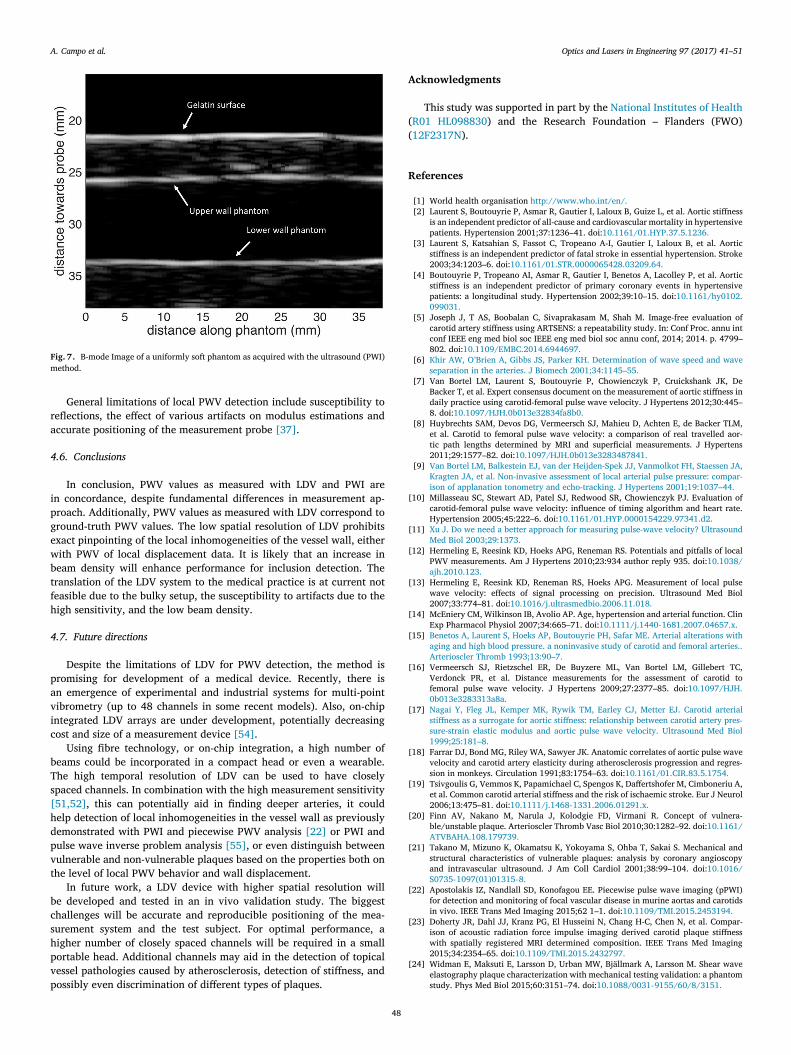
A. Campo et al. Optics and Lasers in Engineering 97 (2017) 41–51
Fig. 7. B-mode Image of a uniformly soft phantom as acquired with the ultrasound (PWI)
method.
r
a
4
i
p
g
e
w
b
t
f
h
4
p
a
v
i
c
b
T
s
[
h
d
p
v
t
b
c
s
h
p
v
p
A
(
(
R
[
[
[
[
[
[
[
[
[
[
[
[
[
[
[
General limitations of local PWV detection include susceptibility to
eflections, the effect of various artifacts on modulus estimations and
ccurate positioning of the measurement probe [37] .
.6. Conclusions
In conclusion, PWV values as measured with LDV and PWI are
n concordance, despite fundamental differences in measurement ap-
roach. Additionally, PWV values as measured with LDV correspond to
round-truth PWV values. The low spatial resolution of LDV prohibits
xact pinpointing of the local inhomogeneities of the vessel wall, either
ith PWV of local displacement data. It is likely that an increase in
eam density will enhance performance for inclusion detection. The
ranslation of the LDV system to the medical practice is at current not
easible due to the bulky setup, the susceptibility to artifacts due to the
igh sensitivity, and the low beam density.
.7. Future directions
Despite the limitations of LDV for PWV detection, the method is
romising for development of a medical device. Recently, there is
n emergence of experimental and industrial systems for multi-point
ibrometry (up to 48 channels in some recent models). Also, on-chip
ntegrated LDV arrays are under development, potentially decreasing
ost and size of a measurement device [54] .
Using fibre technology, or on-chip integration, a high number of
eams could be incorporated in a compact head or even a wearable.
he high temporal resolution of LDV can be used to have closely
paced channels. In combination with the high measurement sensitivity
51,52] , this can potentially aid in finding deeper arteries, it could
elp detection of local inhomogeneities in the vessel wall as previously
emonstrated with PWI and piecewise PWV analysis [22] or PWI and
ulse wave inverse problem analysis [55] , or even distinguish between
ulnerable and non-vulnerable plaques based on the properties both on
he level of local PWV behavior and wall displacement.
In future work, a LDV device with higher spatial resolution will
e developed and tested in an in vivo validation study. The biggest
hallenges will be accurate and reproducible positioning of the mea-
urement system and the test subject. For optimal performance, a
igher number of closely spaced channels will be required in a small
ortable head. Additional channels may aid in the detection of topical
essel pathologies caused by atherosclerosis, detection of stiffness, and
ossibly even discrimination of different types of plaques.
48
cknowledgments
This study was supported in part by the National Institutes of Health
R01 HL098830 ) and the Research Foundation – Flanders (FWO)
12F2317N ).
eferences
[1] World health organisation http://www.who.int/en/ .
[2] Laurent S, Boutouyrie P, Asmar R, Gautier I, Laloux B, Guize L, et al. Aortic stiffness
is an independent predictor of all-cause and cardiovascular mortality in hypertensive
patients. Hypertension 2001;37:1236–41. doi: 10.1161/01.HYP.37.5.1236 .
[3] Laurent S, Katsahian S, Fassot C, Tropeano A-I, Gautier I, Laloux B, et al. Aortic
stiffness is an independent predictor of fatal stroke in essential hypertension. Stroke
2003;34:1203–6. doi: 10.1161/01.STR.0000065428.03209.64 .
[4] Boutouyrie P, Tropeano AI, Asmar R, Gautier I, Benetos A, Lacolley P, et al. Aortic
stiffness is an independent predictor of primary coronary events in hypertensive
patients: a longitudinal study. Hypertension 2002;39:10–15. doi: 10.1161/hy0102.
099031 .
[5] Joseph J, T AS, Boobalan C, Sivaprakasam M, Shah M. Image-free evaluation of
carotid artery stiffness using ARTSENS: a repeatability study. In: Conf Proc. annu int
conf IEEE eng med biol soc IEEE eng med biol soc annu conf, 2014; 2014. p. 4799–
802. doi: 10.1109/EMBC.2014.6944697 .
[6] Khir AW , O’Brien A , Gibbs JS , Parker KH . Determination of wave speed and wave
separation in the arteries. J Biomech 2001;34:1145–55 .
[7] Van Bortel LM, Laurent S, Boutouyrie P, Chowienczyk P, Cruickshank JK, De
Backer T, et al. Expert consensus document on the measurement of aortic stiffness in
daily practice using carotid-femoral pulse wave velocity. J Hypertens 2012;30:445–
8. doi: 10.1097/HJH.0b013e32834fa8b0 .
[8] Huybrechts SAM, Devos DG, Vermeersch SJ, Mahieu D, Achten E, de Backer TLM,
et al. Carotid to femoral pulse wave velocity: a comparison of real travelled aor-
tic path lengths determined by MRI and superficial measurements. J Hypertens
2011;29:1577–82. doi: 10.1097/HJH.0b013e3283487841 .
[9] Van Bortel LM , Balkestein EJ , van der Heijden-Spek JJ , Vanmolkot FH , Staessen JA ,
Kragten JA , et al. Non-invasive assessment of local arterial pulse pressure: compar-
ison of applanation tonometry and echo-tracking. J Hypertens 2001;19:1037–44 .
10] Millasseau SC, Stewart AD, Patel SJ, Redwood SR, Chowienczyk PJ. Evaluation of
carotid-femoral pulse wave velocity: influence of timing algorithm and heart rate.
Hypertension 2005;45:222–6. doi: 10.1161/01.HYP.0000154229.97341.d2 .
11] Xu J . Do we need a better approach for measuring pulse-wave velocity? Ultrasound
Med Biol 2003;29:1373 .
12] Hermeling E, Reesink KD, Hoeks APG, Reneman RS. Potentials and pitfalls of local
PWV measurements. Am J Hypertens 2010;23:934 author reply 935. doi: 10.1038/
ajh.2010.123 .
13] Hermeling E, Reesink KD, Reneman RS, Hoeks APG. Measurement of local pulse
wave velocity: effects of signal processing on precision. Ultrasound Med Biol
2007;33:774–81. doi: 10.1016/j.ultrasmedbio.2006.11.018 .
14] McEniery CM, Wilkinson IB, Avolio AP. Age, hypertension and arterial function. Clin
Exp Pharmacol Physiol 2007;34:665–71. doi: 10.1111/j.1440-1681.2007.04657.x .
15] Benetos A , Laurent S , Hoeks AP , Boutouyrie PH , Safar ME . Arterial alterations with
aging and high blood pressure. a noninvasive study of carotid and femoral arteries..
Arterioscler Thromb 1993;13:90–7 .
16] Vermeersch SJ, Rietzschel ER, De Buyzere ML, Van Bortel LM, Gillebert TC,
Verdonck PR, et al. Distance measurements for the assessment of carotid to
femoral pulse wave velocity. J Hypertens 2009;27:2377–85. doi: 10.1097/HJH.
0b013e3283313a8a .
17] Nagai Y , Fleg JL , Kemper MK , Rywik TM , Earley CJ , Metter EJ . Carotid arterial
stiffness as a surrogate for aortic stiffness: relationship between carotid artery pres-
sure-strain elastic modulus and aortic pulse wave velocity. Ultrasound Med Biol
1999;25:181–8 .
18] Farrar DJ, Bond MG, Riley WA, Sawyer JK. Anatomic correlates of aortic pulse wave
velocity and carotid artery elasticity during atherosclerosis progression and regres-
sion in monkeys. Circulation 1991;83:1754–63. doi: 10.1161/01.CIR.83.5.1754 .
19] Tsivgoulis G, Vemmos K, Papamichael C, Spengos K, Daffertshofer M, Cimboneriu A,
et al. Common carotid arterial stiffness and the risk of ischaemic stroke. Eur J Neurol
2006;13:475–81. doi: 10.1111/j.1468-1331.2006.01291.x .
20] Finn AV, Nakano M, Narula J, Kolodgie FD, Virmani R. Concept of vulnera-
ble/unstable plaque. Arterioscler Thromb Vasc Biol 2010;30:1282–92. doi: 10.1161/
ATVBAHA.108.179739 .
21] Takano M, Mizuno K, Okamatsu K, Yokoyama S, Ohba T, Sakai S. Mechanical and
structural characteristics of vulnerable plaques: analysis by coronary angioscopy
and intravascular ultrasound. J Am Coll Cardiol 2001;38:99–104. doi: 10.1016/
S0735- 1097(01)01315- 8 .
22] Apostolakis IZ, Nandlall SD, Konofagou EE. Piecewise pulse wave imaging (pPWI)
for detection and monitoring of focal vascular disease in murine aortas and carotids
in vivo. IEEE Trans Med Imaging 2015;62 1–1. doi: 10.1109/TMI.2015.2453194 .
23] Doherty JR, Dahl JJ, Kranz PG, El Husseini N, Chang H-C, Chen N, et al. Compar-
ison of acoustic radiation force impulse imaging derived carotid plaque stiffness
with spatially registered MRI determined composition. IEEE Trans Med Imaging
2015;34:2354–65. doi: 10.1109/TMI.2015.2432797 .
24] Widman E, Maksuti E, Larsson D, Urban MW, Bjällmark A, Larsson M. Shear wave
elastography plaque characterization with mechanical testing validation: a phantom
study. Phys Med Biol 2015;60:3151–74. doi: 10.1088/0031-9155/60/8/3151 .

A. Campo et al. Optics and Lasers in Engineering 97 (2017) 41–51
[
[
[
[
[
[
[
[
[
[
[
[
[
[
[
[
[
[
[
[
[
[
[
[
[
[
[
[
[
[
[
25] Kim K, Huang S-W, Hall TL, Witte RS, Chenevert TL, O’Donnell M. Arterial vulnera-
ble plaque characterization using ultrasound-induced thermal strain imaging (TSI).
IEEE Trans Biomed Eng 2008;55:171–80. doi: 10.1109/TBME.2007.900565 .
26] Hardy C , Marinelli L , Blezek D , Darrow R . MRI determination of pulse wave velocity
in the carotid arteries. Proc 16th annu meet ISMRM, Toronto; 2008. n.d .
27] Kröner ESJ, Lamb HJ, Siebelink H-MJ, Cannegieter SC, van den Boogaard PJ, van
der Wall EE, et al. Pulse wave velocity and flow in the carotid artery versus the
aortic arch: effects of aging. J Magn Reson Imaging 2014;40:287–93. doi: 10.1002/
jmri.24470 .
28] Luo J, Li R, Konofagou E. Pulse wave imaging (PWI) of the human carotid
artery: an in vivo feasibility study. IEEE Trans Ultrason Ferroelectr Freq Control
2012;59(1):174–81. doi: 10.1109/TUFFC.2012.2170 .
29] Hermeling E, Reesink KD, Kornmann LM, Reneman RS, Hoeks AP. The dicrotic
notch as alternative time-reference point to measure local pulse wave velocity in
the carotid artery by means of ultrasonography. J Hypertens 2009;27:2028–35.
doi: 10.1097/HJH.0b013e32832f5890 .
30] Benthin M , Dahl P , Ruzicka R , Lindström K . Calculation of pulse-wave velocity us-
ing cross correlation–effects of reflexes in the arterial tree. Ultrasound Med Biol
1991;17:461–9 .
31] Eriksson A , Greiff E , Loupas T , Persson M , Pesque P . Arterial pulse wave velocity
with tissue Doppler imaging. Ultrasound Med Biol 2002;28:571–80 .
32] Fujikura K , Luo J , Gamarnik V , Pernot M , Fukumoto R , Tilson MD , et al. A novel
noninvasive technique for pulse-wave imaging and characterization of clinically-sig-
nificant vascular mechanical properties in vivo. Ultrason Imaging 2007;29:137–54 .
33] Campo A, Heuten H, Goovaerts I, Ennekens G, Vrints C, Dirckx J. A non-
contact approach for PWV detection: application in a clinical setting. Physiol Meas
2016;37:990–1003. doi: 10.1088/0967-3334/37/7/990 .
34] Campo A , Soons J , Heuten H , Ennekens G , Govaerts I , Vrints C , et al. Digital image
correlation for full-field time-resolved assessment of arterial stiffness. J Biomed Opt
2014;19 doi:10.1117/1 .
35] Campo A, Segers P, Heuten H, Goovaerts I, Ennekens G, Vrints C, et al. Non-invasive
technique for assessment of vascular wall stiffness using laser Doppler vibrometry.
Meas Sci Technol 2014;25:65701. doi: 10.1088/0957-0233/25/6/065701 .
36] Luo J, Li RX, Konofagou EE. Pulse wave imaging of the human carotid artery: an in
vivo feasibility study. IEEE Trans Ultrason Ferroelectr Freq Control 2012;59:174–81.
doi: 10.1109/TUFFC.2012.2170 .
37] Vappou J, Luo J, Konofagou EE. Pulse wave imaging for noninvasive and quanti-
tative measurement of arterial stiffness in vivo. Am J Hypertens 2010;23:393–8.
doi: 10.1038/ajh.2009.272 .
38] Dudzik G, Waz AT, Kaczmarek PR, Antonczak AJ, Sotor JZ, Krzempek K, et al.
Demodulator electronics for laser vibrometry. In: 10th Int. conf. vib. meas. by
laser noncontact tech. - AIVELA 2012, 1457; 2012. p. 35–40. AIP Publishing.
doi: 10.1063/1.4730540 .
39] Waz AT, Dudzik G, Kaczmarek PR, Abramski KM. Multichannel WDM vibrometry at
1550 nm. Photonics Lett Pol 2014;6:133–5. doi: 10.4302/plp.2014.4.07 .
49
40] Waz AT, Dudzik G, Kaczmarek PR, Antonczak AJ, Sotor JZ, Krzempek K, et al.
Recent development of WDM fiber vibrometry. In: 10th Int. conf. vib. meas. by
laser noncontact tech. - AIVELA 2012, 1457; 2012. p. 227–33. AIP Publishing.
doi: 10.1063/1.4730561 .
41] Couture O, Bannouf S, Montaldo G, Aubry J-F, Fink M, Tanter M. Ultrafast imaging
of ultrasound contrast agents. Ultrasound Med Biol 2009;35:1908–16. doi: 10.1016/
j.ultrasmedbio.2009.05.020 .
42] Meinders JM, Kornet L, Brands PJ, Hoeks APG. Assessment of local pulse wave veloc-
ity in arteries using 2D distension waveforms. Ultrason Imaging 2001;23:199–215.
doi: 10.1177/016173460102300401 .
43] Bramwell JC, Hill AV. The velocity of the pulse wave in man. Proc R Soc B Biol Sci
1922;93:298–306. doi: 10.1098/rspb.1922.0022 .
44] Wilcoxon F. Individual comparisons by ranking methods. Biometrics Bull 1945;1:80.
doi: 10.2307/3001968 .
45] Spearman C . The proof and measurement of association between two things. By C.
Spearman, 1904. Am J Psychol 1987;100:441–71 n.d .
46] Altman DG , Bland JM . Measurement in medicine : the analysis of method comparison
studies † . Statistician 1983;32:307–17 .
47] Bland JM , Altman D . Statistical methods for assessing agreement between two meth-
ods of clinical measurement. Lancet 1986:307–10 .
48] Boutouyrie P, Vermeersch SJ, Dynamics B, Society L. Determinants of pulse wave
velocity in healthy people and in the presence of cardiovascular risk factors: “estab-
lishing normal and reference values. Eur Heart J 2010;31:2338–50. doi: 10.1093/
eurheartj/ehq165 .
49] Blacher J , Asmar R , Djane S , London GM , Safar ME , London M , et al. Aortic pulse
wave velocity as a marker of cardiovascular risk in hypertensive patients. Hyperten-
sion 1999;33:1111–17 .
50] Li RX , Apostolakis I-Z , Connolly ES , Konofagou EE . Intra-plaque stiffness mapping
in carotid stenosis patients in vivo using high-frame rate {P}ulse {W}ave {I}maging.
IEEE Int. ultrason. symp., Taipei, Taiwan; 2015 .
51] Willemin J-FF, Dändliker R, Khanna SM. Heterodyne interferometer for submicro-
scopic vibration measurements in the inner ear. J Acoust Soc Am 1988;83:787.
doi: 10.1121/1.396122 .
52] Cooper NP. An improved heterodyne laser interferometer for use in stud-
ies of cochlear mechanics. J Neurosci Methods 1999;88:93–102. doi: 10.1016/
S0165- 0270(99)00017- 5 .
53] Mignanelli L , Rembe C , Kroschel K . Medical diagnosis of the cardiovascular system
on the carotid artery with IR laser Doppler vibrometer. In: 11th Int. conf. vib. meas.
by laser noncontact tech. AIVELA 2014; 2014. p. 313–22 .
54] Li Y, Segers P, Dirckx J, Baets R. On-chip laser Doppler vibrometer for arterial pulse
wave velocity measurement. Biomed Opt Express 2013;4:1229–35. doi: 10.1364/
BOE.4.001229 .
55] Mcgarry M, Li R, Apostolakis I, Nauleau P, Konofagou EE, et al. An inverse approach
to determining spatially varying arterial compliance using ultrasound imaging. Phys
Med Biol 2016;61:5486–507. doi: 10.1088/0031-9155/61/15/5486 .

A. Campo et al. Optics and Lasers in Engineering 97 (2017) 41–51
c University of Leuven (Leuven, Belgium). After his studies he obtained a PhD in science at the
of Physics at the University of Antwerp (Antwerpen, Belgium). Currently he is associated as
(UEIL) at Columbia University (New York, USA) and the Bimef at the University of Antwerp.
Flanders (FWO) postdoc fellow. His main research interests are development of non-invasive and
lobal research interests are arterial mechanics, biomedical optics and cardiovascular screening.
ofessor assistant at Faculty of Electronics, Wroclaw University of Science and Technology. The
ith analog and digital electronics (microcontrollers and Digital Signal Processors), frequency
pectroscopy. For 5 years he worked as an independent designer/constructor (later as a director)
ducing commercial laser interferometers, optical parts and iodine frequency patterns. He has
Athens, Greece. He received his diploma in Electrical and Computer Engineering in 2011 and
olumbia University’s M.S./Ph.D. program in Biomedical Engineering, at the UEIL. His research
r vision techniques in order to assess the elasticity of diseased large arteries and the risk they
w University of Technology in 2009 (thesis title: “Analysis of weak, Doppler frequency shifted
Faculty of Electronics and he works in Laser and Fiber Electronic Group. His main scientific
ttered light, photodetection systems, demodulation, signal processing and data acquisition. He
or of controlling software for two prototypes developed in our group: four-channel laser-fiber
search projects devoted laser vibrometry, fiber amplifiers, ultrafast fiber lasers.
he Applied Physics Department in the Ecole Normale Superieure in 2010. After three years of
on the ultrasonic characterization of the cortical bone of the femoral neck using guided waves,
e et Marie Curie - Paris 6 in 2013. He got a one year position at the same university to teach
research, in the Laboratoire d’Imagerie Biomedicale. In October 2014, he joined the UEIL as a
scular projects.
electronics from Wroc ł aw University of Technology (WrUT), Poland. From 1983–84, he worked
nte University of Technology, the Netherlands), working on optogalvanic effects in CO2, CO
92, he worked at the Optoelectronics and Lasers Engineering Group (Heriott-Watt University,
eguides, slab-waveguides, waveguide arrays, phase locking structures). He returned to WrUT in
s Group (LFEG) as professor, where he works on optical fibre lasers (cw tunable, femtosecond,
cal fibre sensors, free-space, and optical fibre communications.
Adriaan Campo , PhD, studied bio-engineering at the Catholi
Laboratory of Biomedical Physics (Bimef) at the Department
a postdoc with the Ultrasound Elasticity Imaging Laboratory
Adriaan is a BAEF postdoc fellow, and a Research Foundation -
non-contact methods for assessment of arterial stiffness. His g
Grzegorz Dudzik , PhD was born in 1980 (Poland). He is a pr
Ph.D. degree he received in 2009. He has large experience w
stabilization of lasers, vibrometry signal processing and laser s
in the Research and Development Company Lasertex Ltd. pro
worked as a main constructor in many projects and grants.
Iason-Zacharias Apostolakis was born in January 1989 in
majored in Computer Science. Since 2012, he is enrolled in C
interests include the use of ultrasound imaging and compute
pose. He is working on PWI and CCA elastography.
Adam W ąż , PhD Obtained his PhD in electronics from Wrocla
laser beams ”). Currently Dr Waz is an assistant professor at
interest is focused on laser Doppler vibrometry: analysis of sca
is an expert in analog electronics and LabView. He is the auth
vibrometer and 5 W fiber laser. Dr. W ąż participated in five re
Born in 1987, Pierre graduated from in Medical Imaging at t
research in the Laboratoire d’Imagerie Parametrique, focused
he received his PhD in Acoustical Physics at Universite Pierr
in the Engineering Mechanics Department and to pursue his
post-doctoral research scientist involved in the cardiac and va
Krzysztof M. Abramski received his MSc and PhD degrees in
as a research fellow in the Quantum Electronics Group (Twe
lasers and high pressure XeCl excimer lasers. From 1987–19
Edinburgh) on different aspects of RF excited CO2 lasers (wav
1993, where he started leading the Laser Fibre and Electronic
combs) and microchip solid state diode pumped includes opti
50

A. Campo et al. Optics and Lasers in Engineering 97 (2017) 41–51
graduated in Physics and in Didactics and in 1991 he obtained the PhD in Physics. He worked
ed to research and worked in clinical audiology, oto-acoustic emissions and cochlear implants.
ics ( www.uantwerp.be/bimef) and full professor at the University of Antwerp. In 2014 he was
interests focus on the development of opto-electronic metrology systems and on the mechanics
of Biomedical Engineering and Radiology and Director of the Ultrasound and Elasticity Imaging
ain interests are in the development of novel elasticity imaging techniques and therapeutic
y, electromechanical and pulse wave imaging, harmonic motion imaging and focused ultrasound
ollaborations in the Columbia Presbyterian Medical Center and elsewhere. Elisa is a fellow of
g, member of the IEEE in Engineering in Medicine and Biology Society, IEEE in Ultrasonics,
f America and the American Institute of Ultrasound in Medicine.
Joris J.J. Dirckx was born in Antwerp, Belgium in 1960. He
as scientific advisor for the government and in 1994 he return
Nowadays he is director of the laboratory of Biomedical Phys
elected chair of the department of Physics. His current research
of biological systems.
Elisa Konofagou is the Robert and Margaret Hariri Professor
Laboratory at Columbia University in New York City. Her m
ultrasound methods and more notably, myocardial elastograph
therapy and drug delivery in the brain, with several clinical c
the American Institute for Medical and Biological Engineerin
Ferroelectrics and Frequency Control, the Acoustical Society o
51