Embed Size (px)
Citation preview

Optical Sum-Frequency Spectroscopy
Y. Ron ShenPhysics Department
University of California at Berkeley(supported by DOE and NSF)

ω1+ω2ω2
ω1 (2) (2)1 2
(2) 2
( ) ( ) ( )
| |i ijk j k
i
P E E
S P
ω χ ω ω=
∝
From structure symmetry, some elements vanish, and others do not but may depend on one another.
(2)ijkχ
Special Case: in media with inversion symmetry(2) 0ijkχ =
ω2
ω1
ωSF
ωSF
Sum Frequency Generation: Basic Principle
Measurements with selected input/output polarization combinations allow deduction of nonvanishing (2)
ijkχ
(2)1 2 1 2
(2)(2) (2)
1 2
(2)
(2)
( ) : ( ) ( )
( ) ( ) ( )
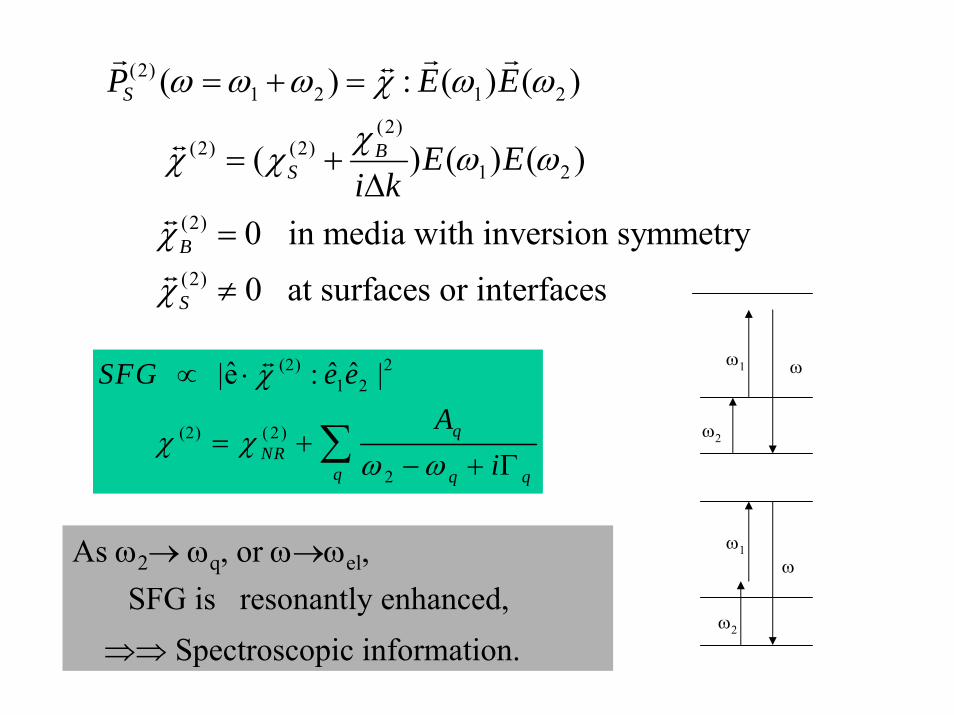
0 in media with inversion symmetry
0 at surfaces or interfaces
S
BS
B
S
P E E
E Ei k
ω ω ω χ ω ω
χχ χ ω ω
χ
χ
= + =
= +Δ
=
≠
r r rt
t
t
t
(2) 21 2
(2) ( 2 )
2
ˆ ˆ ˆ |e : |
qNR
q q q
SFG e eA
i
χ
χ χω ω
∝ ⋅
= +− + Γ∑
t
As ω2→ ωq, or ω→ωel, SFG is resonantly enhanced,
⇒⇒ Spectroscopic information.
ω1
ω2
ω
ω1
ω2
ω
( 2 ) ( 2 )
( 2 )
, , ' 2 '
( ) ( )
| | | | ' ' | | ( ) {
( )( )
+ 7 other terms }
ijk ijk
i j kijk
g n n ng n g
d f
g r n n r n n r g
χ α
αω ω ω ω
= Ω Ω Ω
< >< >< >Ω =
− −
∫
∑
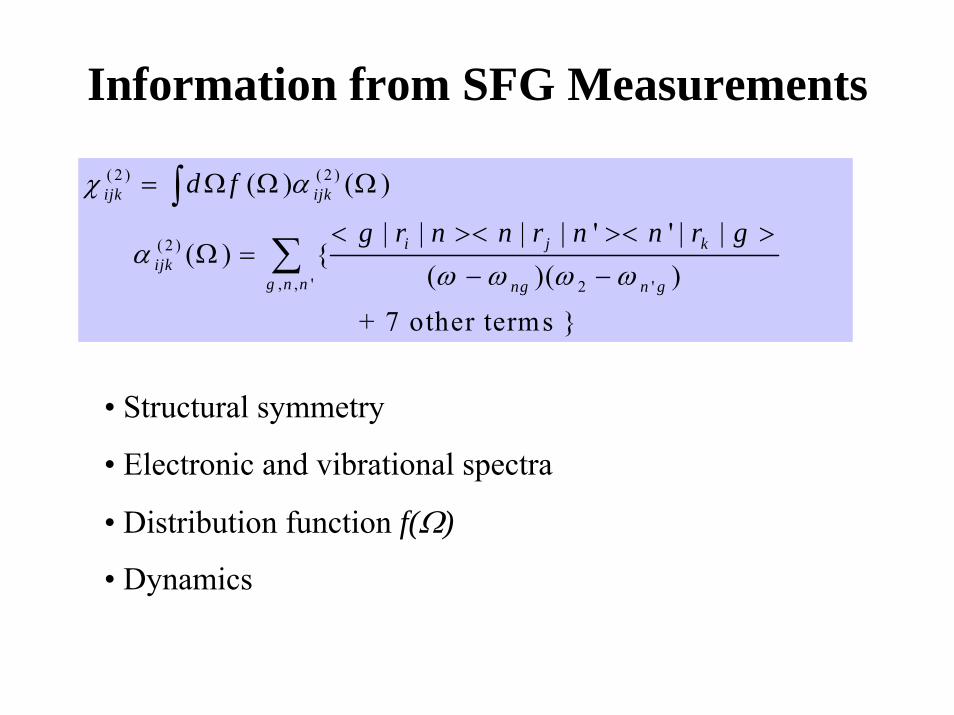
• Structural symmetry
• Electronic and vibrational spectra
• Distribution function f(Ω)
• Dynamics
Information from SFG Measurements

Sum-Frequency Spectroscopy
ω2
ω1 ω
ω2
ω1
ω
ω2
ω1 ω
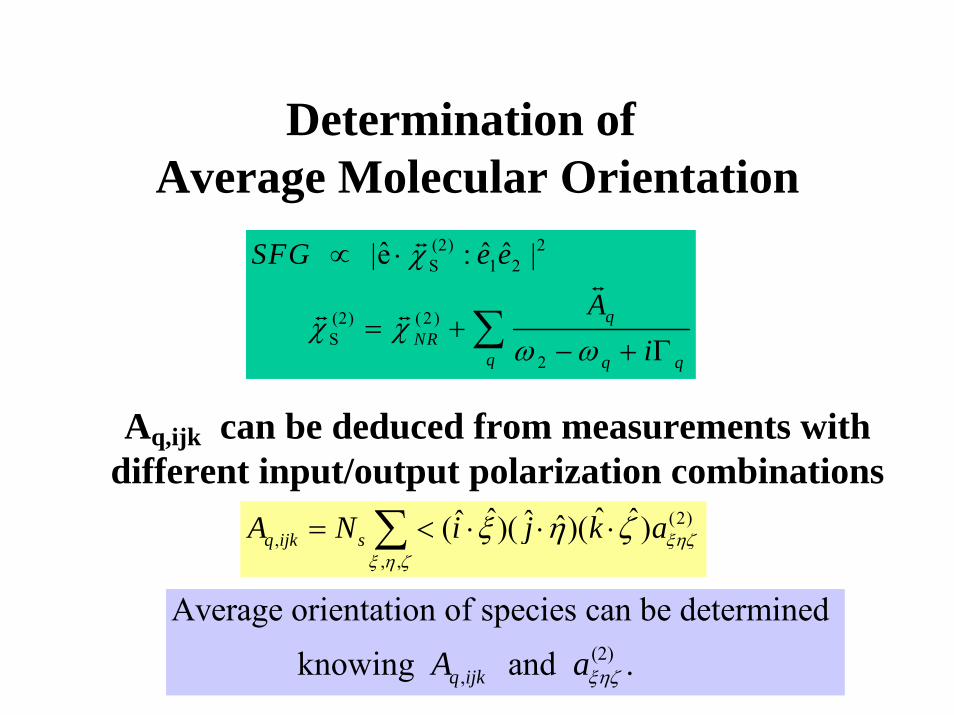
Determination of Average Molecular Orientation
(2) 2S 1 2
(2) ( 2 )S
2
ˆ ˆ ˆ |e : |
qNR
q q q
SFG e e
Ai
χ
χ χω ω
∝ ⋅
= +− + Γ∑
t
tt t
Aq,ijk can be deduced from measurements with different input/output polarization combinations
(2),
, ,
ˆˆ ˆˆ ˆ ˆ( )( )( )q ijk sA N i j k aξηζξ η ζ
ξ η ζ= < ⋅ ⋅ ⋅∑
(2),
Average orientation of species can be determined knowing and .q ijkA aξηζ
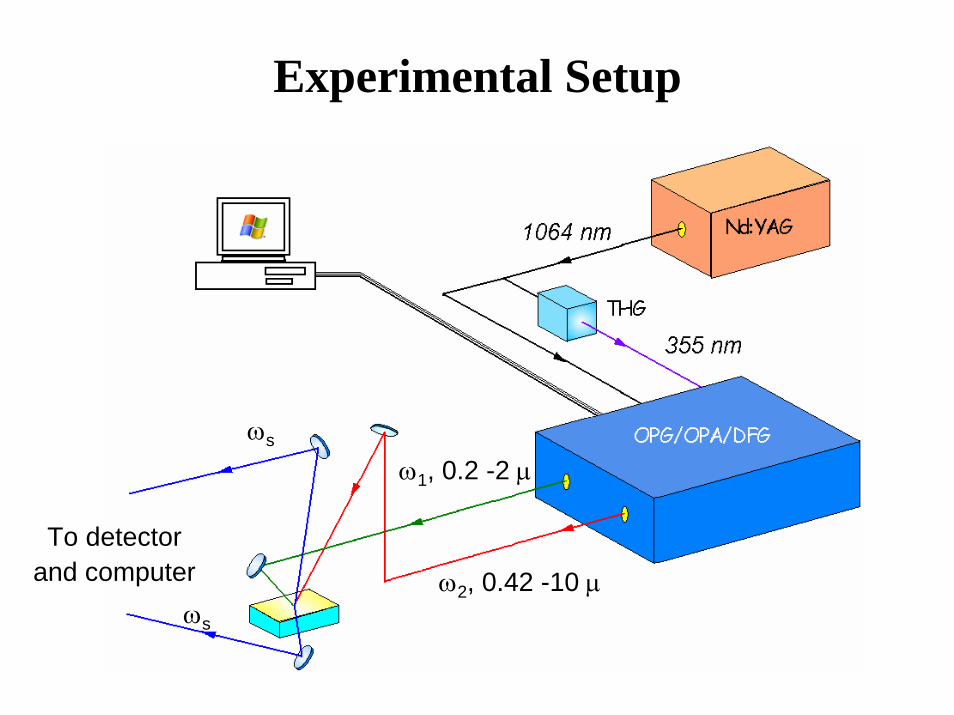
ω1, 0.2 -2 μ
ω2, 0.42 -10 μωs
ωs
To detectorand computer
Experimental Setup
Surface Sum-Frequency Spectroscopy
Basic Idea: Surface and Bulk have different structural symmetry.

Information from Surface SFG Measurements
• Surface structural symmetry
• Surface electronic and vibrational spectra
• Surface distribution function f(Ω)
• Surface dynamics

2 2( )kωr
1 1( )kωr
( )kωr
Output from a monolayer:3
(2) 21 23
4
(2) 15 21 2
2
8( ) | | photons/pulse
10 photons/pulse for | | 10 , ~ ~ 10 GW/cm
~ 0.1 mm , ~ 10 psec.
ijk
ijk
S I I ATc
esu I I
A T
π ωω χ
χ −
=
≈h
Output highly directional: || 1 || 2 ||( ) ( ) ( )k k kω ω ω+ =
Surface Sum-Frequency Generation

Advantages• Submonolayer sensitivity
• Surface specificity
• Output highly directional
• Non-detrimental, in situ, remote sensing
• High spatial, temporal, spectral resolution
• Applicable to any interfaces accessible by light
many unique applications

SiO2 HD HDSiO2 SiO2
OTS OTS
CCl4
HD: Hexadecane, H3C(CH2)14CH3
OTS: Silane, H3C(CH2)17SiCl3
Surface Specificity of SFG

Unique ApplicationsUnique Applications
•Buried interfaces
•Surface structures of neat bulk materials:polymers, liquids, etc.
•Molecular adsorption under ambient condition
•Surface dynamics
•Surface microscopy

Neat Liquid Interfaces
• Molecules are randomly oriented in the bulk liquid, but could be more orderly arranged at a surface or interface.
• Surface vibrational spectrum provides information about surface structure.
• Surface structure determines surface properties.
• Surface vibrational spectrum is important, but cannot be obtained by conventional techniques.
• SFG is unique for surface vibrational spectroscopy of neat liquids.

Water Interfaces

Water:
Most abundant and important liquid on earth
Water interfaces play pivotal roles in many areas of science and technology:
Home and industrial applications:washing, cleaning, corrosion, plating
Environmental problems:pollution, nutrient circulation
Life Science:membrane formation, protein hydration
Geoscience:soil formation and weathering

Experimental Techniques
Probing macroscopic properties:• Surface tension
• Surface potential
• Ellipsometry (Anisotropic refractive indices)
Probing microscopic properties:• X-ray spectroscopy
• STM & AFM
• Second harmonic generation
• Sum-frequency vibrational spectroscopy

SF Vibrational Spectra of Vapor/Water Interface

-
SF Spectrum (SSP) of OH Stretches at Vapor/Water Interface
BondedOH
DanglingOH
Frequency (cm- )
SFG
Inte
nsity
(a.u
.)
SSP
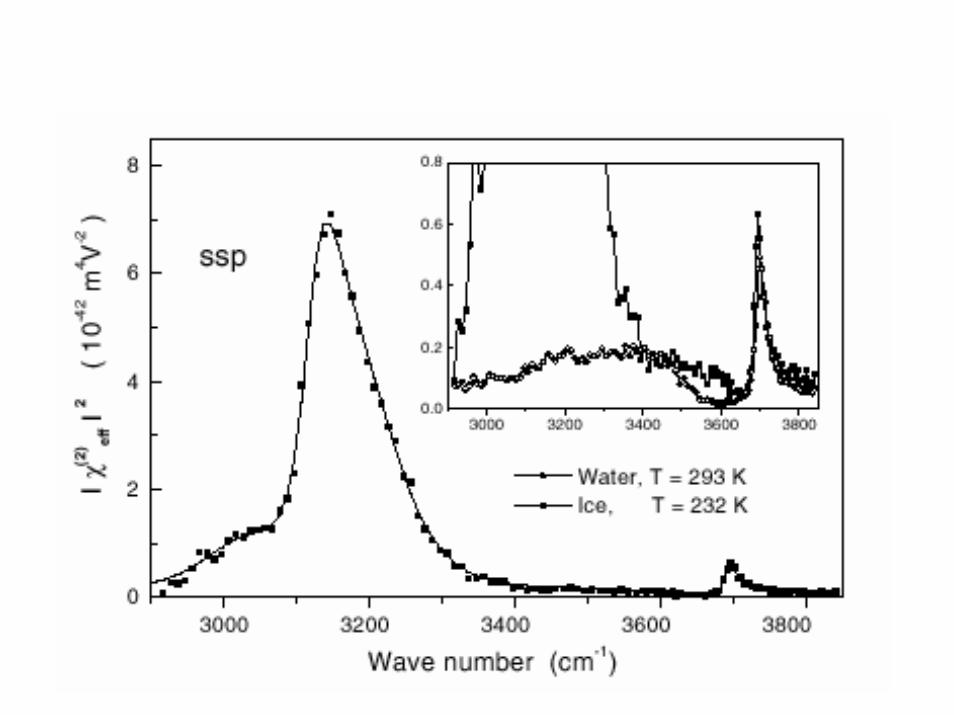
Bulk Water
Frequency (cm-1)
SF vis IR

Dependence on
Polarization Combination
Wei, Shen, PRL 56, 4799(2001) Du et al, PRL 70, 2313 (1993)
(2)yyzχ
(2)yzyχ
(2) 21 2ˆ ˆ ˆ | : |sS e e eχ∝ ⋅

SIDE VIEW
H H H
Hydrogen Bonding Of water Molecules
Hexagonal Ice Structure Near Surface

• Dangling OH bond at 3700 cm-1
• Weak peak at ~3600 cm-1
• Water-like peak at ~3400 cm-1
• Ice-like peak at ~3200 cm-1
Assignment of Spectral Features

2800 3000 3200 3400 3600 3800
-0.6
-0.4
-0.2
0.0
0.2
0.4
0.6
2800 3000 3200 3400 3600 3800
-0.6
-0.4
-0.2
0.0
0.2
0.4
2800 3000 3200 3400 3600 38000.0
0.2
0.4
Spectra of |χ(2)(ω)|, Re χ(2)(ω), and Im χ(2)(ω)
|χ(2)|
Re χ(2)
Im χ(2)

Results and Interpretations• 3700 cm-1 narrow positive peak:
Dangling OH with H pointing up (Antisymmetric stretch)
• ~3400 cm-1 broad negative liquid-like peak:Bonded OH in local disordered H-bonding network; net orientation with H pointing down
• ~3100 cm-1 weak positive ice-like peak:Bonded OH in more ordered local H-bonding network; weak net orientation with H pointing up
• ~3600 cm-1 weak narrow positive peak:Symmetric OH stretch mode of water molecules with one dangling OH bond

Water Interfaces with Hydrophilic and Hydrophobic Solid Surfaces
Hydrophilic: Water/Quartz
Hydrophobic: Water/OTS/Quartz

SFG Vibrational Spectra of Water at the Water/Quartz Interface
(a) pH=1.5(b) pH=3.8(c) pH=5.6(d) pH=8.0(e) pH=12.3(f) quartz/ice

2800 3000 3200 3400 3600 3800 4000-1
0
1
Wavenumber, cm-1
pH 1.5
6.5
χ(2) , (
10−2
1 m2 / V
)
11.5
χ(2)(1
0-21
m2 /
V )
Wavenumber (cm -1 )
(2)| |Sχ (2)Re S
-
χ(2)Im Sχ
Spectra of of Quartz/water Interfaces(2) (2) (2)| |, Re , and ImS S Sχ χ χ
Ostroverkhov et al, PRL 94, 046102 (2005)
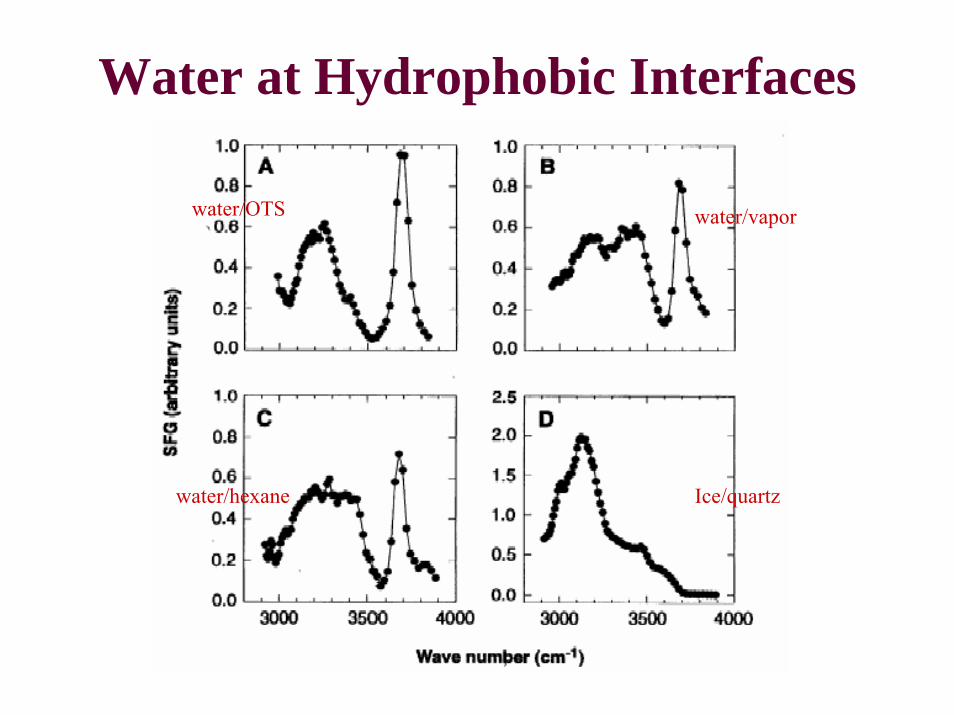
Water at Hydrophobic Interfaces
water/vaporwater/OTS
water/hexane Ice/quartz

Interfacial Water Structure
• Interfacial water molecules form an ordered/disordered hydrogen-bonding network; water surface has a more ordered structure than the bulk.
• Many other water interfaces show a similar vibrational spectrum, indicating that they have a similar interfacial structure (although the degree of ordering may be different)

Studies of Polymer Surfaces
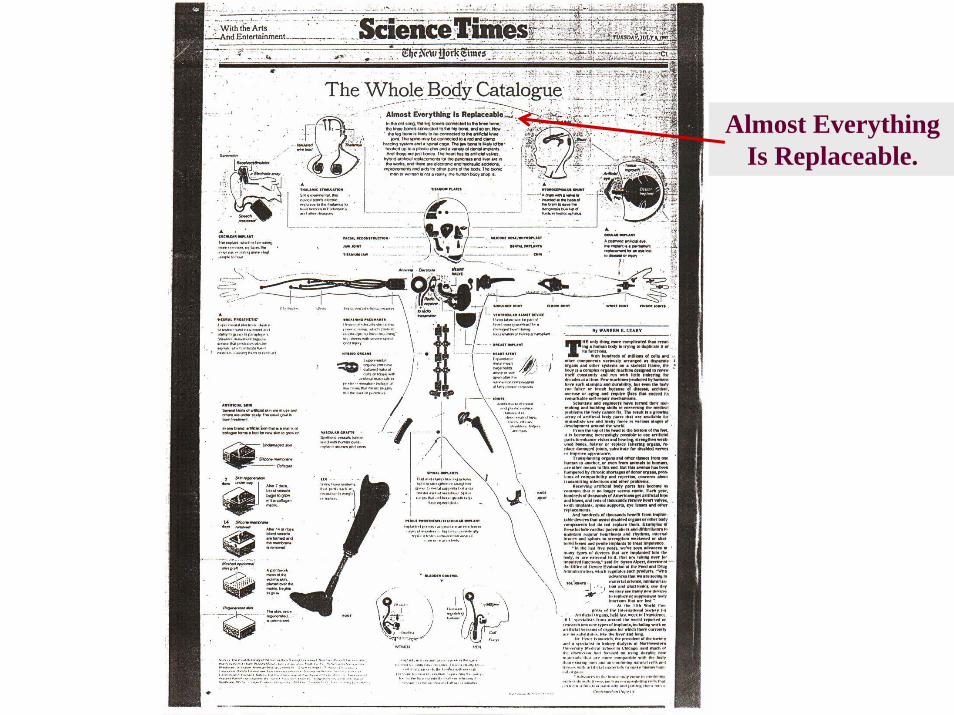
Almost EverythingIs Replaceable.

Surface properties of polymers are controlled by surface composition, structure, and molecular orientations. Molecular-level information is needed.
Techniques Available for Probing
• Infrared spectroscopy
• Atomic force microscopy
• Near-Edge X-ray Absorption Fine Structure (NEXAFS) spectroscopy
• Sum-frequency vibrational spectroscopy
Probing Surface Modification of Polymers
• Surface has composition and structure generally different from bulk.
• Precipitation of certain molecular groups or components dominates the surface properties without changing the bulk properties.
• Adjusting bulk composition, doping with impurities, or changing end groups of main and side chains can modify surface structure and properties.
• Surface-specific probe at the molecular level is needed ⇒ SFVS.

PolyurethanePTMO
BioSpan (BN)
BioSpan S (BS)
BioSpan P (BP)
PDMS
PEG

Infrared Spectra of BN, BS, and BP
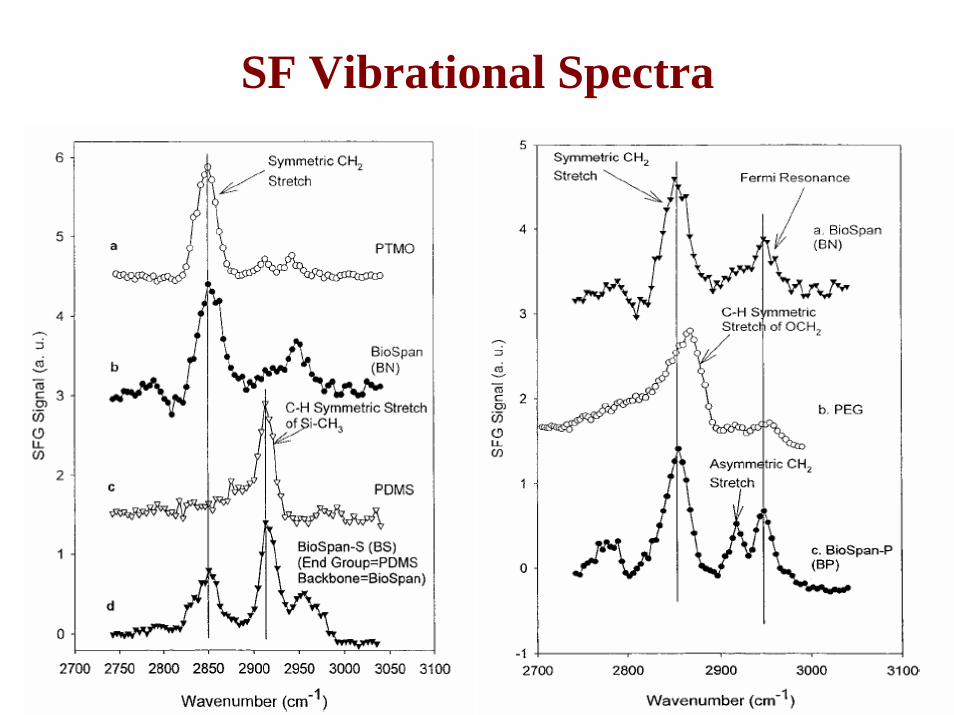
SF Vibrational Spectra
Other Means of Modifying Polymer Surfaces
For patterned templates,
• Etching
• Photo-induced reactions
• Mechanical rubbing

Surface-Induced Liquid Alignment

Example
Polyvinyl Alcohol (PVA)
100% hydrolyzed Molecular weight: 14,000
Spin-coated on fused quartz Film thickness : ~30 nm Rubbed with velvet cloth

‘
‘
X
yγ: angle between incident
plane xz and rubbing plane x’z
γ = 0 γ = 900
Geometry

SF Vibrational Spectra of Rubbed PVA

Qualitative Understanding
γ

Determination of Average Molecular Orientation
(2) 2S 1 2
(2) ( 2 )S
2
ˆ ˆ ˆ |e : |
qNR
q q q
SFG e e
Ai
χ
χ χω ω
∝ ⋅
= +− + Γ∑
t
tt t
Aq,ijk can be deduced from measurements with different input/output polarization combinations
(2),
, ,
ˆˆ ˆˆ ˆ ˆ( )( )( )q ijk sA N i j k aξηζξ η ζ
ξ η ζ= < ⋅ ⋅ ⋅∑
(2),
Average orientation of species can be determined knowing and .q ijkA aξηζ

Quantitative Analysis(2)
,, ,
2 2 20 0 02 2 2
0 0
ˆˆ ˆˆ ˆ ˆ( ) ( )( )( )
( ) ( ) ( )assuming ( ) exp[ ] 2 2 2
By symmetry, 0 and 0
q ijk sA N f i j k a d
f C
ξηζξ η ζ
θ φ ψ
ξ η ζ
θ θ φ φ ψ ψσ σ σ
φ ψ
= Ω ⋅ ⋅ ⋅ Ω
− − −Ω = − − −
= =
∑∫
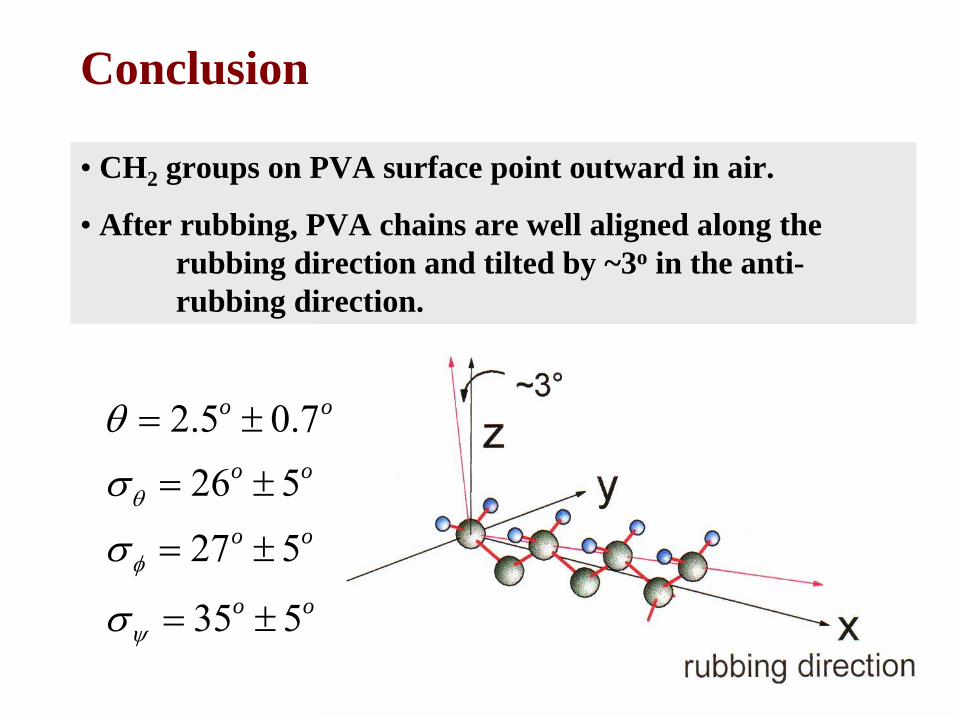
Conclusion
• CH2 groups on PVA surface point outward in air.
• After rubbing, PVA chains are well aligned along the rubbing direction and tilted by ~3o in the anti-rubbing direction.
2.5 0.726 5
27 5
35 5
o o
o o
o o
o o
θ
φ
ψ
θ
σ
σ
σ
= ±
= ±
= ±
= ±

In Situ Studies of Surface Chemical Reactions

Motivations
• Industrial catalysis processes proceed under high ambient pressure.
• Academic studies of surface catalysis are often conducted in UHV.
• In situ surface probes of real catalytical processes are desired.

Surface Reaction Studies under High Gas Pressure
• In situ identification of surface species.
• Correlation of surface species with reaction products.
• Example: CO oxidation on Pt(111)

Oxidation of CO on Pt(111): 2CO + O2 ⇒ 2CO2
• An important catalytical process(first studied by I. Langmuir, 1922)
• Rare in situ surface studies under real atmosphere (plenty UHV results available)(IR spectroscopy on supported catalyst: Lindstrom and Tsotsis, 1985)
• Pressure gap rpoblem(Catalytical results under real atmosphere and under UHV may be different.)

Experimental Arrangement

CO on Pt(111)

Stretch Vibrations of CO on Pt(111)
Bridge site
Top site
Incommensurate
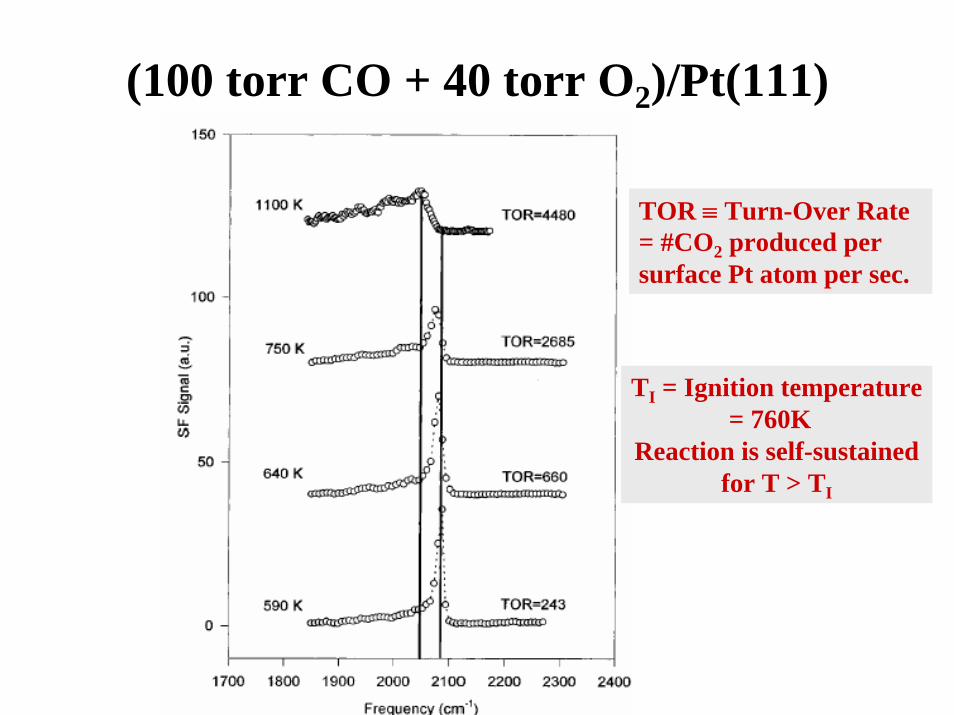
(100 torr CO + 40 torr O2)/Pt(111)
TOR ≡ Turn-Over Rate = #CO2 produced per surface Pt atom per sec.
TI = Ignition temperature = 760K
Reaction is self-sustained for T > TI

Reaction Rate vsAdsorbed CO
CO coverage varied by CO/O2relative partial pressure.
CO at atop sites
590K
Incommensurate CO, 590K
Incommensurate CO, 720K
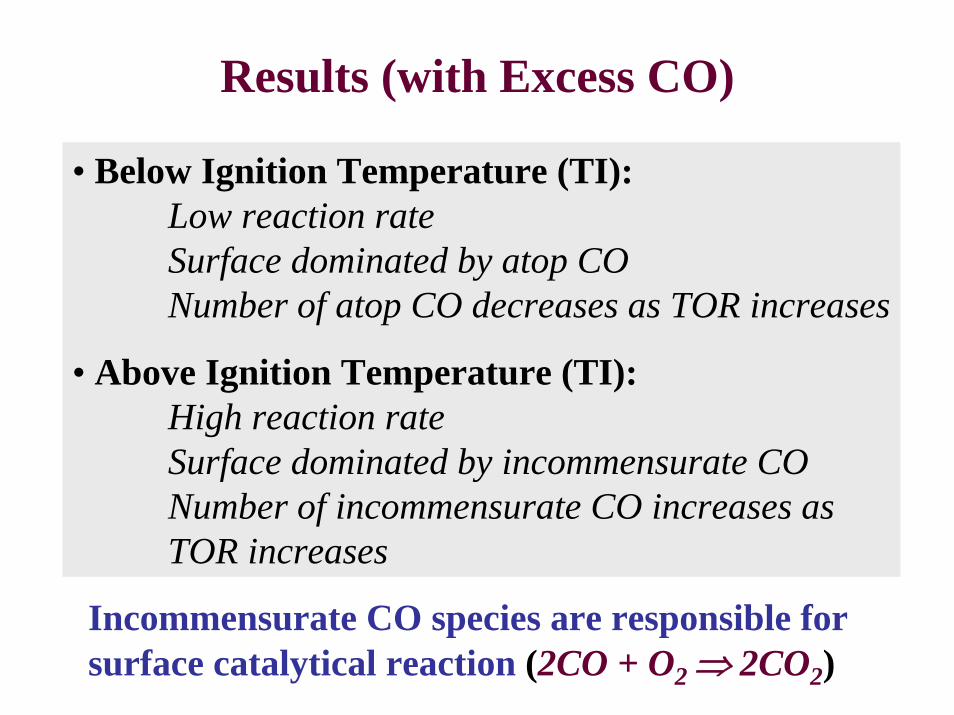
Results (with Excess CO)
• Below Ignition Temperature (TI):Low reaction rateSurface dominated by atop CONumber of atop CO decreases as TOR increases
• Above Ignition Temperature (TI):High reaction rateSurface dominated by incommensurate CONumber of incommensurate CO increases as TOR increases
Incommensurate CO species are responsible for surface catalytical reaction (2CO + O2 ⇒ 2CO2)

Surface Melting of Ice


Phenomenological Theory

Experimental Proofs


Temperature Dependence of Free OH Mode
TS ~ 200K

Model


Results
• Surface melting of ice (libration of dangling OH) begins at ~200K.
• Disordering of the quasi-liquid layer increases with temperature.

Sum-Frequency Spectroscopy for Bulk Studies

Surface-Induced Pyroelectric Ice
(Ice Film with a Net Electric Polarization)

Ice Structure
1.01 A
• Ice Rules (Bernal-Fowler-Pauling)
Tetrahedral H-bondingOne and only one proton between two oxygen atoms
• Residual Entropy (Pauling, 1935)
• Ferroelectric TransitionTc = 0 K
• Dipole-Dipole Interaction Energy(Onsager, 1936; Slater, 1941)

Pauling’s Calculation on Residual Entropy• Number of vertices (oxygen atoms) = n
• Total number of H-bonds = 4n/2 = 2n
• Each bond has 2 possible configurations:Proton residing at one or the other end
• Number of ways arranging the bonds = 22n
Not all of them are allowed by ice rules
• Around each vertex, number of bonds = 4# bond configurations = 24
# bond configurations allowed by ice rules = 6Fraction of allowed configurations = 6/ 24
• Total number of lattice configurations = 22n(6/16)n
• Residual entropy = k ln[22n(6/16)n] = nk ln(3/2) = 0.4055nk(Nagle: 1.5065 < w < 1.5068)

4.8 A
Pt(111)

4.5 A
Hexagonal Ice on Pt(111)
H2O adsorbs with O bonded to Pt.
First monolayer of H2O forms a surface dipole layer.

Surface-Induced Ordering
Surface dipole layer could induce ferroelectric ordering in neighboring layers following the ice rules.

H2O
Experimental Arrangement
2600-3800

Sum Frequency Vibrational Spectroscopy As An Effective Probe
for Surface-Induced Polar Ordering
ω2
ω1
ωSF
ω1
ω2
ω
(2) 2,
(2) (2),
| |S eff
S eff DInt
SFG
dz
χ
χ χ
∝
≅ ∫
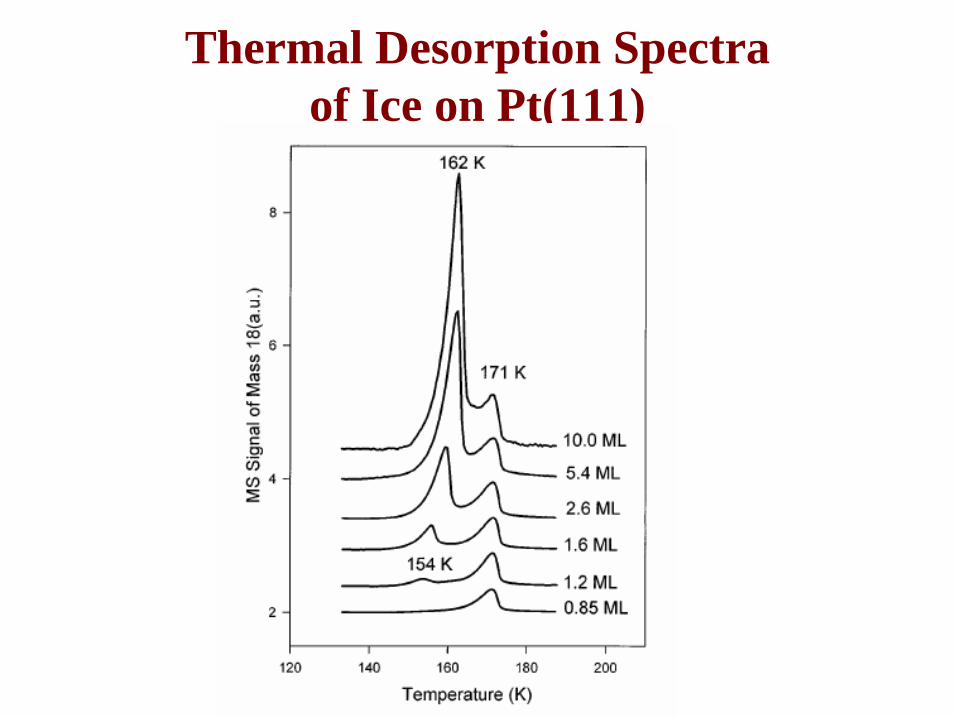
Thermal Desorption Spectra of Ice on Pt(111)
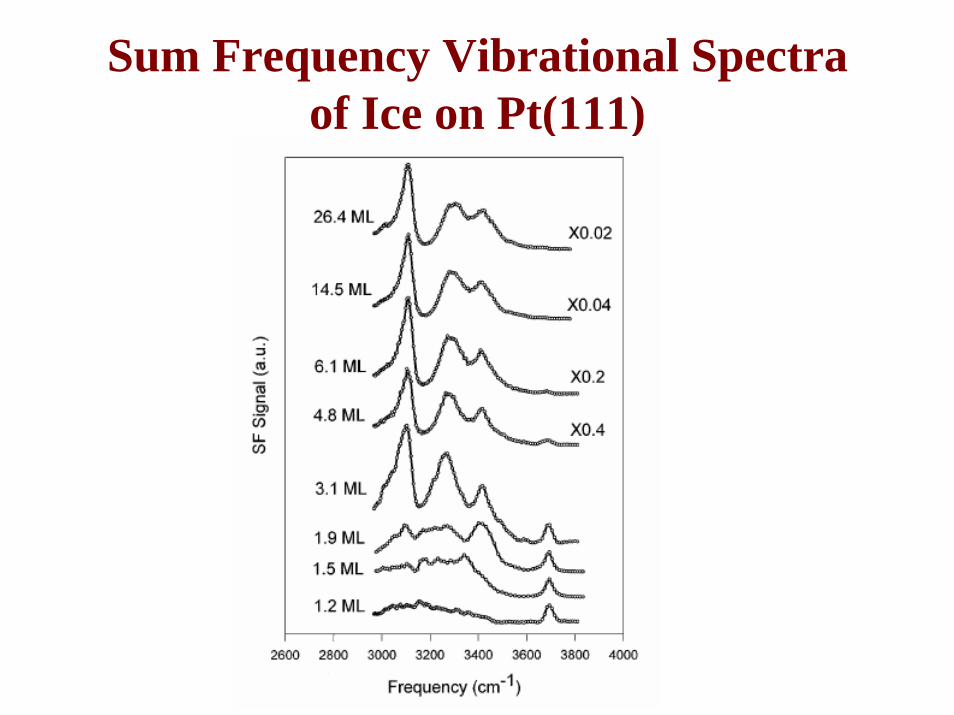
Sum Frequency Vibrational Spectra of Ice on Pt(111)
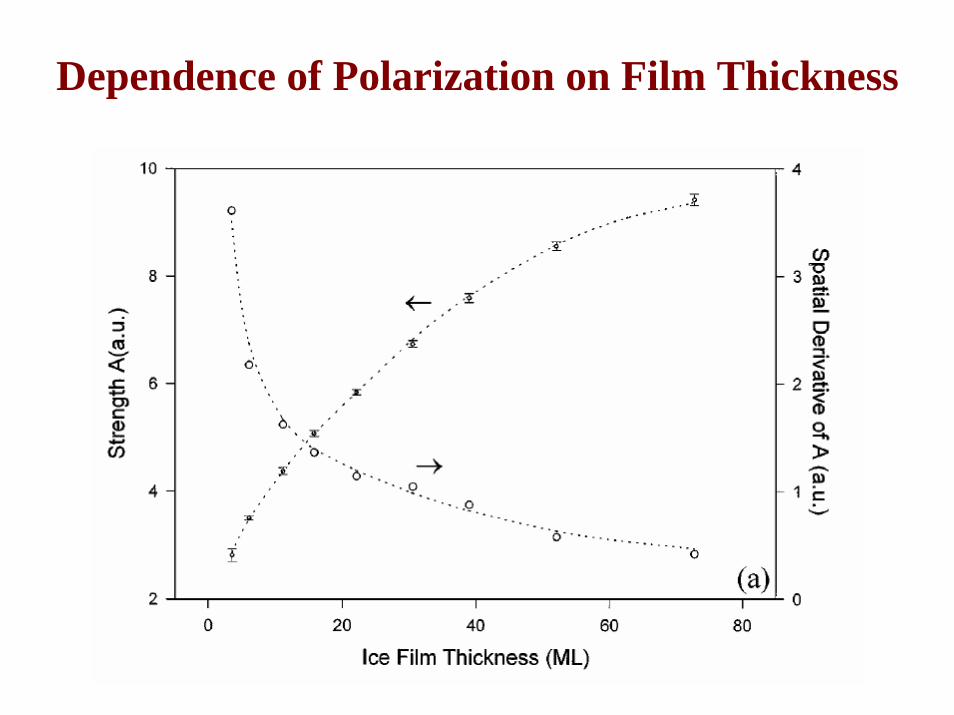
Dependence of Polarization on Film Thickness

Summary
SF vibrational spectroscopy on Ice/Pt(111) shows:
existence of surface-induced polar ordering (pyroelectricity) in ice films grown on
Pt(111) with a decaying length of 30 ML at 120K

Sum-Frequency Spectroscopy as a Novel Probe
for Molecular Chirality

• Cannot be brought to coincidence with its mirror image by translation and rotation.
• Have no inversion symmetry.
• Chiral coefficients for the two enantiomers have opposite signs.
EnantiomersS R
Chiral Molecules
Characteristics

• Origin of life: more than 90% of natural biological molecules are homo-chiral. Why?
• Same molecules with different chiralities can have very different properties.
• Molecular chirality is most important for biology: secondary structural changes, complexation, drug quality control, etc.
Importances of Molecular Chirality

Conventional Optical Probes for Molecular Chrality
Circular Dichroism (CD)
Optical Rotatory Dispersion (ORD)
( ) ( )n i n i n iβ β β+ −+ − + = Δ + Δ

Limited Sensitivity of CD and ORD3 4
4 5
Electronic Transitions: ~ ~ 10 10
Vibrational Transitions: ~ ~ 10 10
nn
nn
βββ
β
− −
− −
Δ Δ−
Δ Δ−
Detection Limit: 4
lim3
lim
( ) ~ 10
For electronic transitions, ~10 / cm; ~1 m
l
l
β
βμ
−Δ
Why is the sensitivity limited?

CD is electric-dipole forbidden
Chiral response is characterized by rank-3 tensor coefficients w i th lm n l m nμ ≠ ≠
Linear optical response is characterized by rank-2 tensor under electric-dipole approximation. For rank-3 chiralresponse, we must involve higher-order magnetic-dipole contribution.
( ) (0) with | | | |
lm lm lmn n
lmn n lm
k G kG k
ε εε
= +
( )ijε

Shortcomings of CD and ORD
• Difficult to probe chirality of thin films and monolayers.
• Difficult for in situ probing of chirality.
• Difficult to study chiral functions and dynamics of practical systems.
Can we find a more sensitive chiral probe?

Sum-Frequency Spectroscopy for Probing Molecular Chirality
(Development of a Novel Powerful Tool)

ω2
ω1 ω
ω2
ω1
ω
ω2
ω1 ω
2 2( )kωr
1 1( )kωr
( )kωr
Sum-Frequency Spectroscopy
(2) 2
(2) (2)1 2 1 2
| ( ) |
( ) ( ) ( )SF i
i ijk j k
S P
P E E
ω
ω ω ω χ ω ω
∝
= + =
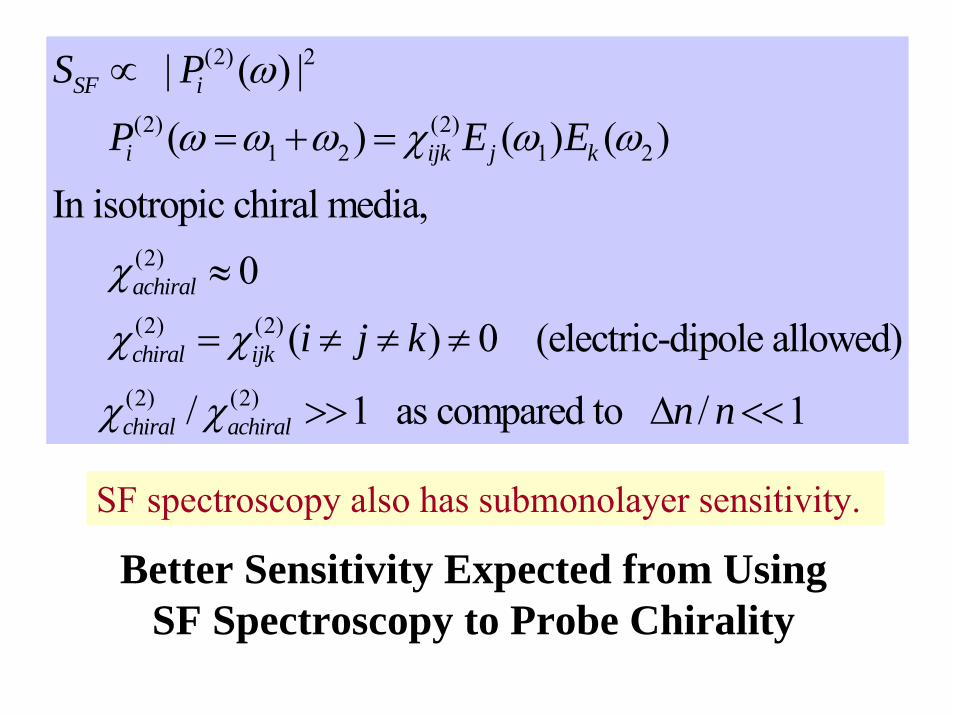
SF spectroscopy also has submonolayer sensitivity.
(2) 2
(2) (2)1 2 1 2
(2)
(2) (2)
(2) (2)
| ( ) |
( ) ( ) ( )
In isotropic chiral media, 0
( ) 0 (electric-dipole allowed)
/ 1 as c
SF i
i ijk j k
achiral
chiral ijk
chiral achiral
S P
P E E
i j k
ω
ω ω ω χ ω ω
χ
χ χ
χ χ
∝
= + =
≈
= ≠ ≠ ≠
>> ompared to / 1n nΔ <<
Better Sensitivity Expected from Using SF Spectroscopy to Probe Chirality

Bulk Nonlinear Susceptibilities of Chiral Liquids(2) (2), 1 2 1 2
(2)
lmpn 2 1
( ) ( ) ( ) ( )
( )
B l B lmn m n
DB lmn chiral lmn
Q Q Qp lpmn p plmn p
P E E
k k k
ω ω ω χ ω ω
χ χ ε
χ χ χ
= + =
=
+ + +
εlmn = ±1 for l ≠ m ≠ n
Nonvanishing Independent Elements:Chiral elements (electric-dipole allowed)
Achiral elements (electric-dipole forbidden)lmn
Dchiralεχ
, , ,
Q Q Qllmm lmml lmlmQ Q Q Qllll llmm lmml lmlm
χ χ χ
χ χ χ χ= + +

Various elements can be deduced from SFG measurements with selected
input/output polarization combinations.Achiral Elements can be deduced from:
SSP, SPS, PSS, PPP
SF visible IR
Chiral Elements can be deduced from:
SPP →PSP →PPS →
)2(yzxχ
)2(zyxχ
)2(zxyχ
(2)ijkχ
(2) 2ijk| |SFG χ∝

ω1, 0.2 -2 μ
ω2, 0.42 -10 μωs
ωs
To detectorand computer
Experimental Setup
Probing Molecular Chirality of Electronic Transitions
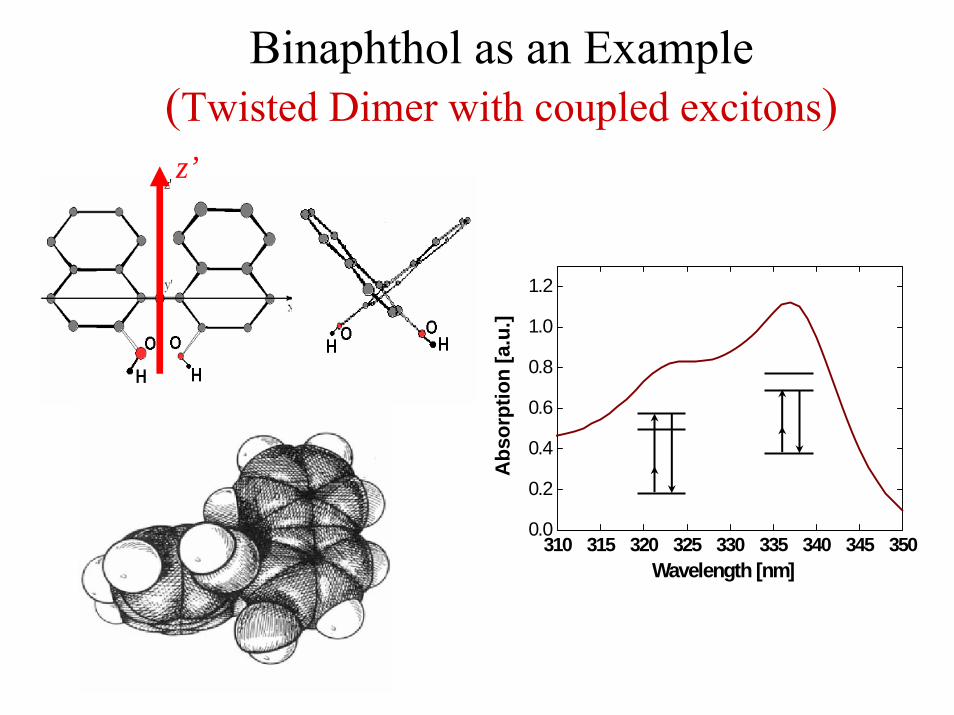
Binaphthol as an Example (Twisted Dimer with coupled excitons)
310 315 320 325 330 335 340 345 3500.0
0.2
0.4
0.6
0.8
1.0
1.2
Abs
orpt
ion
[a.u
.]
Wavelength [nm]
z’
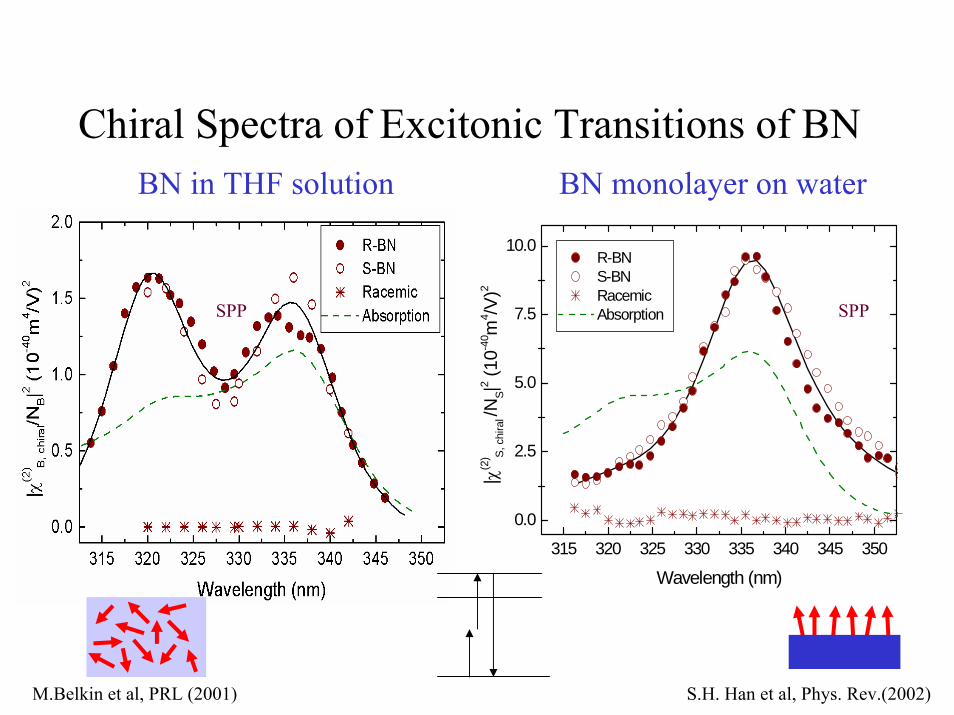
Chiral Spectra of Excitonic Transitions of BNBN in THF solution BN monolayer on water
315 320 325 330 335 340 345 350
0.0
2.5
5.0
7.5
10.0
|χ
(2) S,
chi
ral /N
S|2 (10-4
0 m4 /V
)2
R-BN S-BN Racemic Absorption
Wavelength (nm)
SPP SPP
S.H. Han et al, Phys. Rev.(2002)M.Belkin et al, PRL (2001)

Probing Molecular Chirality of Vibrational Transitions
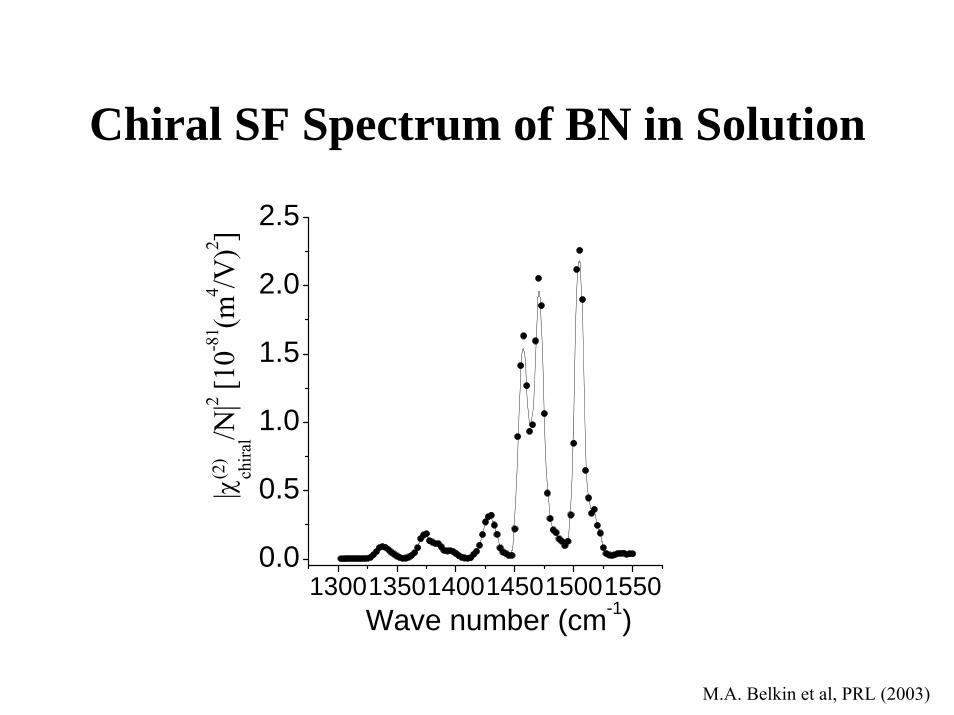
Chiral SF Spectrum of BN in Solution
1300135014001450150015500.0
0.5
1.0
1.5
2.0
2.5|χ
(2)
chira
l/N|2 [1
0-81 (m
4 /V)2 ]
Wave number (cm-1)
M.A. Belkin et al, PRL (2003)

Chiral Vibrational Spectra of a BN Monolayer on Water
1300 1350 1400 1450 1500 1550
0.00
0.05
0.10
0.15R-binaphthol
racemic mixture
Infrared wavenumbers [cm-1]
|
|2[1
0-76(m
4 /V)2 ]
χ spp/N
M.A. Belkin et al, PRL (2003)

210 215 220 225 230
0.0
0.2
0.4
0.6
0.8
1.0
1.2 R = CH3R = CH(CH3)2R = CH2CH(CH3)2R = CH(CH3)CH2CH3R = H
| χch
iral(2
) /N |
2 (a. u
.)
Sum Frequency Wavelength (nm)
Ala Val Leu Ile Gly
C H
R
COO-
H2N
210 215 220 225 230
0.0
0.2
0.4
0.6
0.8
1.0
1.2 R = CH3R = CH(CH3)2R = CH2CH(CH3)2R = CH(CH3)CH2CH3R = H
| χch
iral(2
) /N |
2 (a. u
.)
Sum Frequency Wavelength (nm)
Ala Val Leu Ile Gly
C H
R
COO-
H2N
CD Responses:Leu > Ile > Val > Ala
SF Responses:Ile > Val > Leu > Ala
(Molecules with a Chiral Center)SF Chiral Responses of Amino Acids
N. Ji, Y.R. Shen, JACS 126, 15008(2004) 127, 12933(2005)

Chiral SFG Microscopy
Chiral Optical Microscopy is useful to track biological molecules and their chiral
structures and conformations relevant to their functions in biological systems.
• Absence of achiral background, e.g., water
• Selective detection of chiral molecules
• No need of fluorescence labeling

Chiral Microscopy(Collaboration with Hao Yang’s Group)
Front view Side view
Two input beams noncollinear to probe chirality
Achiral beads in chiral solution to create chirality contrast
430nm+860nm
277nm

0 1 2 3 4 5 6 7050
100150
μm
7
6
5
4
3
2
1
00 1 2 3 4 5 6 7
(b)
020.0040.0060.0080.00100.0120.0140.0160.0
0 1 2 3 4 50
50
100
μm
0
1
2
3
4
50 1 2 3 4 5
(a)
Images of Silica Beads (2.5 μm) in R-BN Solution
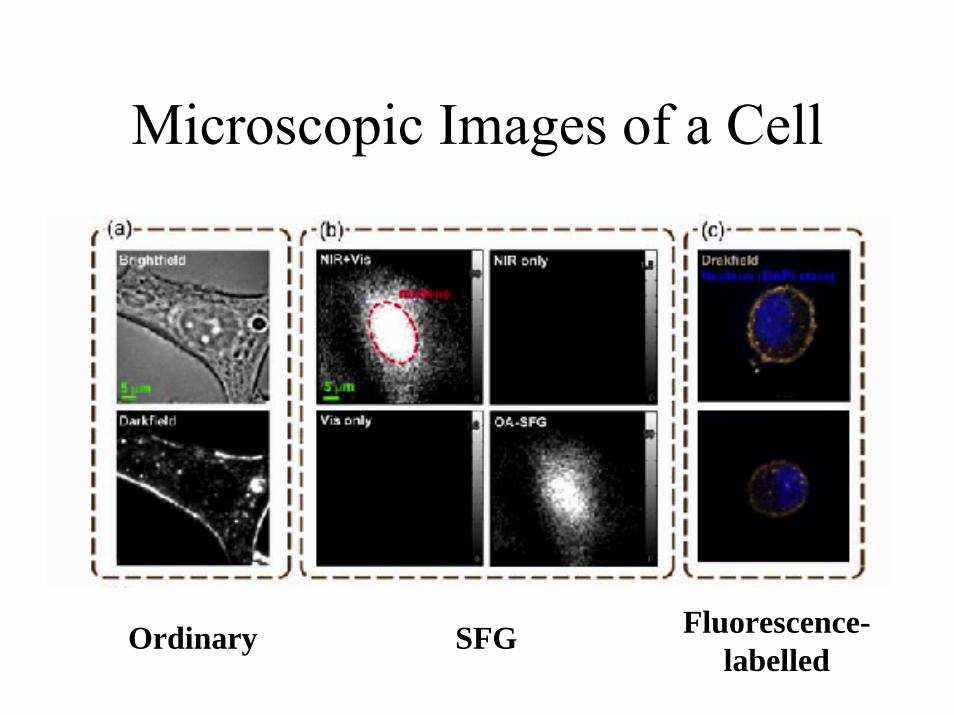
Microscopic Images of a Cell
SFGOrdinary Fluorescence-labelled

•Measure chiral spectra of DNA, proteins, and other biological molecules in bulk and at surfaces
• Apply chiral microscopy to biological systems
• Study chiral molecular adsorption on chiral surfaces (understanding chiral molecular separation)
• Probe in situ change of molecular chirality such as protein folding, induced chirality and chiral dynamics
Future Plan(Collaboration with Haw Yang’s group)

Microscopic Images of a Cell
SFGOrdinary Fluorescence-labelled
Ultrafast Surface Dynamics of Neat Materials

Ultrafast Dynamics of OH Stretch Vibrations
at Water Interfaces

Intensively studied in bulk Woutersen et al., PRL 81, 1106 (1998).Lock and Bakker, JCP 117, 1708 (2002).Cowan et al., Nature 434, 199 (2005).
Dynamics occurring on hundreds of femtosecond timescale in the H-bonding network
Vibrational excitationSpectral diffusionVibrational relaxationThermalization
Ultrafast Dynamics of OH Stretches of Water
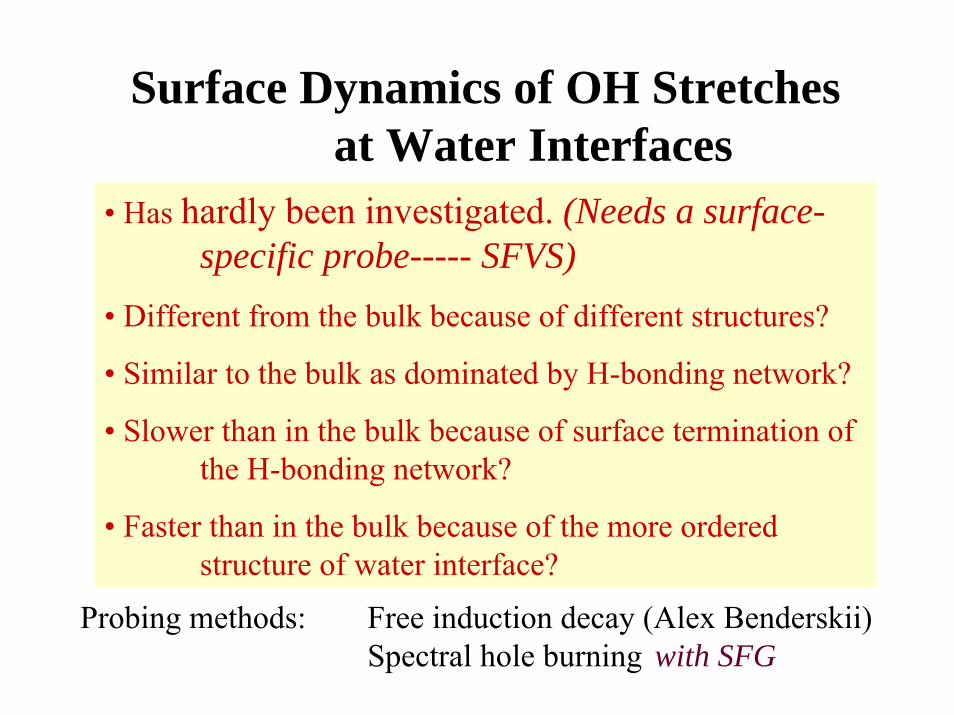
Surface Dynamics of OH Stretches at Water Interfaces
• Has hardly been investigated. (Needs a surface-specific probe----- SFVS)
• Different from the bulk because of different structures?
• Similar to the bulk as dominated by H-bonding network?
• Slower than in the bulk because of surface termination of the H-bonding network?
• Faster than in the bulk because of the more ordered structure of water interface?
Probing methods: Free induction decay (Alex Benderskii)Spectral hole burning with SFG

Ti:Al2O3800 nm, 0.8 mJ100 fs, 1 kHz
Pump OPA~10 uJ, ~130 fs
Probe OPA~5 uJ, ~200 fs
λsignal~1.1 μm
λidler~3.0 μm
800 nm
Boxcarintegrator
PMT
H2O
NormalizationPD
NormalizationPD
Pump-Probe SFG Experimental Layout
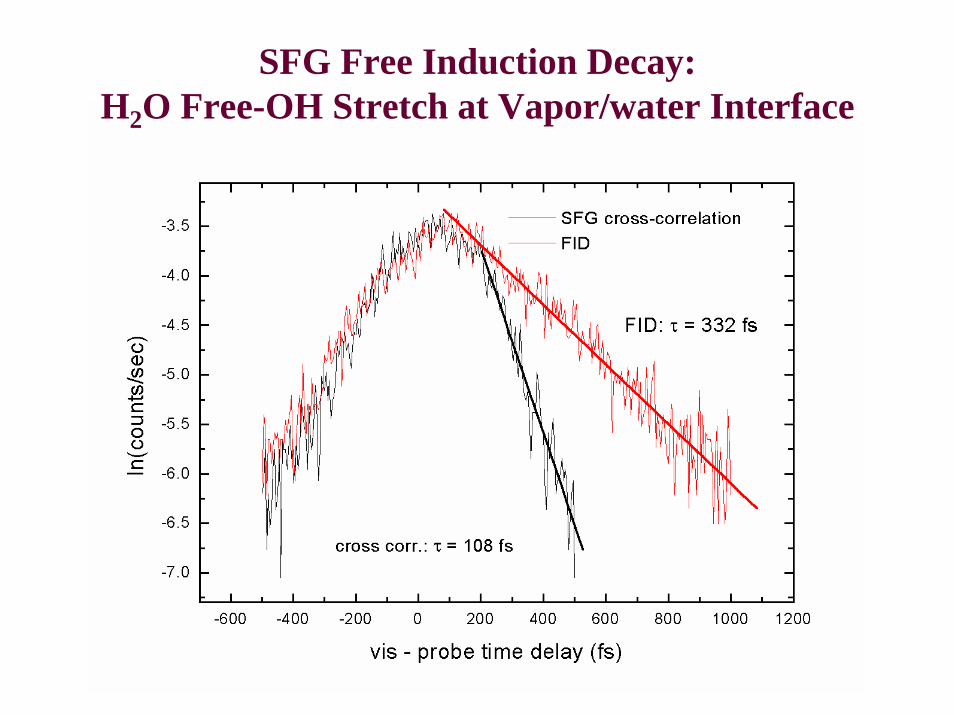
Free Induction DecaySFG Free Induction Decay:
H2O Free-OH Stretch at Vapor/water Interface

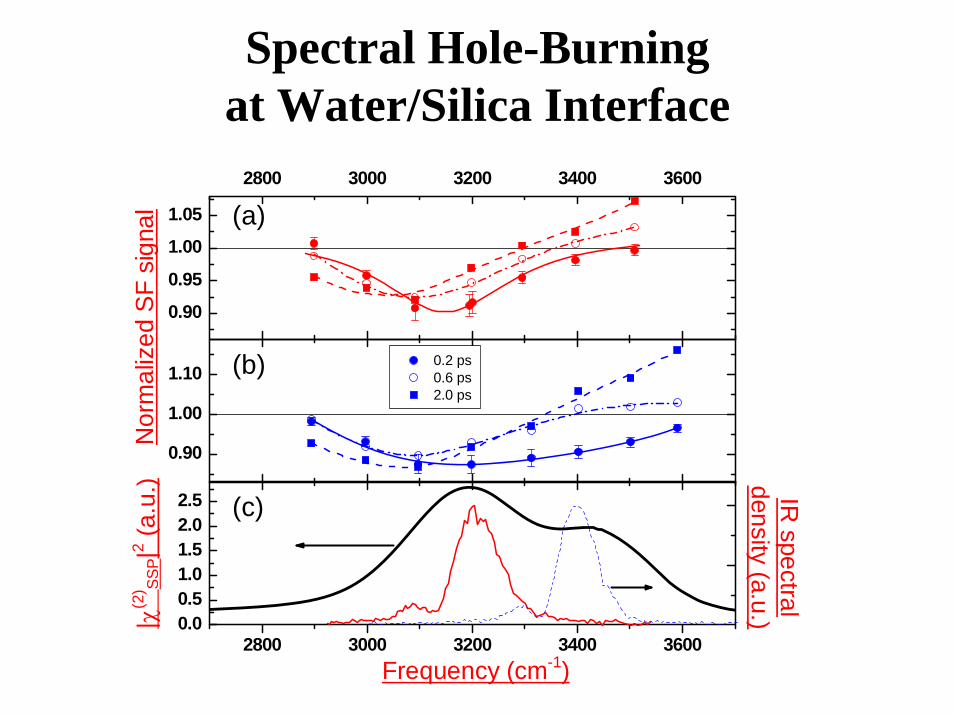
Spectral Hole Burning
ω
S
• hole width ~ homogeneous linewidth = 1/dephasing time
• hole recovery time ~ population relaxation time
• hole broadening with time~ excitation transfer to neighbors
(spectral diffusion)
2800 3000 3200 3400 36000.00.51.01.52.02.5
0.90
0.95
1.00
1.05
2800 3000 3200 3400 3600
0.90
1.00
1.10
0.2 ps 0.6 ps 2.0 ps
Frequency (cm-1)
| χ(2
) SSP|
2 (a.u
.) IR spectral
density (a.u.)
Nor
mal
ized
SF
sign
al (a)
(b)
(c)
Spectral Hole-Burning at Water/Silica Interface
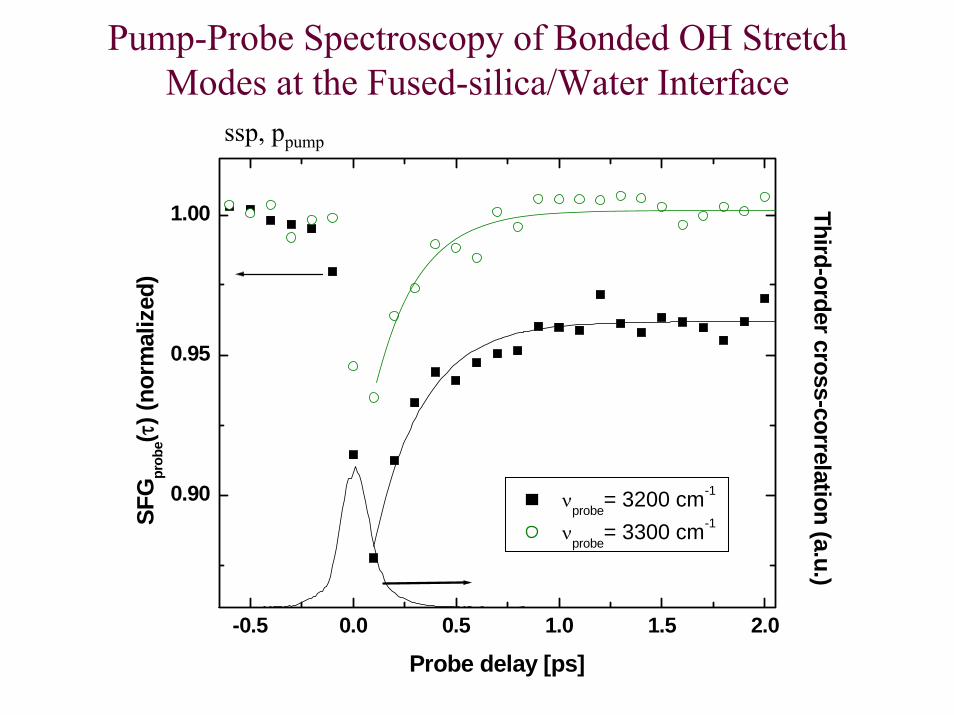
Pump-Probe Spectroscopy of Bonded OH Stretch Modes at the Fused-silica/Water Interface
-0.5 0.0 0.5 1.0 1.5 2.0
0.90
0.95
1.00 Third-order cross-correlation (a.u.)
τ = 220 +/- 30 fs
τ = 240 +/- 30 fs
SFG
prob
e(τ) (
norm
aliz
ed)
Probe delay [ps]
νprobe= 3200 cm-1
νprobe= 3300 cm-1
ssp, ppump

0 1 2
0.90
1.00
1.10
1.000.75
1.00
1.00
1.001.00
0 1 2
0.90
1.00
1.10
3300 cm-1
1.00
3200 cm-1
3100 cm-1
3000 cm-1
2900 cm-1
3400 cm-1
3500 cm-1
3600 cm-1
1.00
1.00
1.00
0.90
1.00
1.00
1.00
0 1 20 1 2
0.90
1.00
3200 cm-1
3100 cm-1
3000 cm-1
2900 cm-1
3300 cm-1
3400 cm-1
3500 cm-1
Nor
mal
ized
SF
sign
al
νpump= 3200 cm-1 νpump= 3400 cm-1(a) (b)
Probe delay (ps)
Time-Resolved SF Probing of Spectral Hole Recovery
( 100) / ( 100) /0( ) 1 (1 ) [1 ]v tt T t TS t S e S e− − − −= − − + Δ −
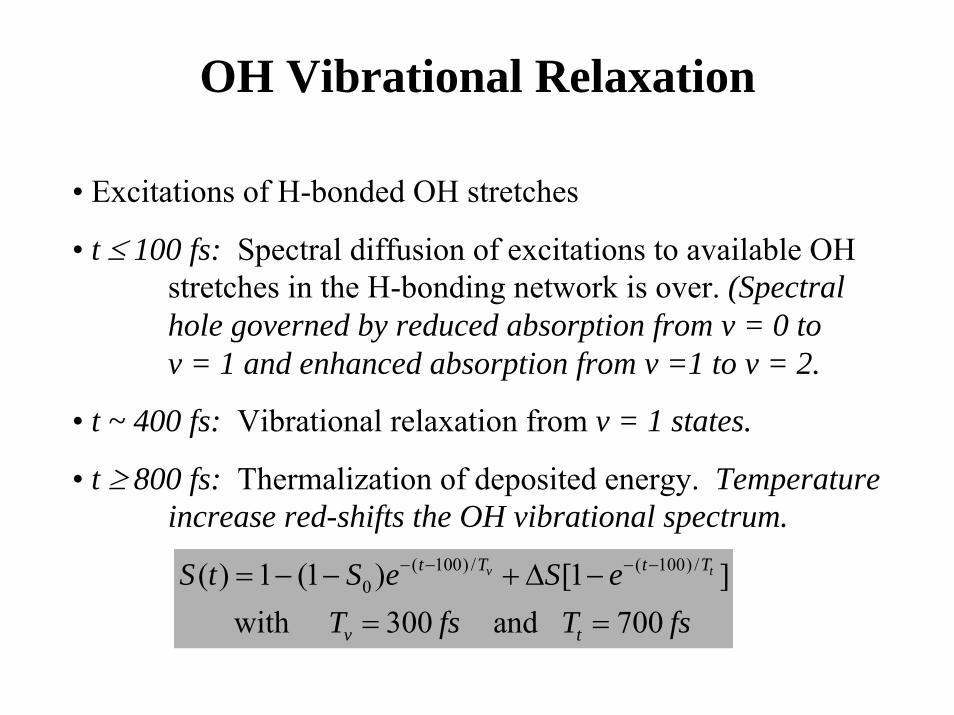
OH Vibrational Relaxation
• Excitations of H-bonded OH stretches
• t ≤ 100 fs: Spectral diffusion of excitations to available OH stretches in the H-bonding network is over. (Spectral hole governed by reduced absorption from v = 0 to v = 1 and enhanced absorption from v =1 to v = 2.
• t ~ 400 fs: Vibrational relaxation from v = 1 states.
• t ≥ 800 fs: Thermalization of deposited energy. Temperature increase red-shifts the OH vibrational spectrum.
( 100) / ( 100) /0( ) 1 (1 ) [1 ]
with 300 and 700
v tt T t T
v t
S t S e S eT fs T fs
− − − −= − − + Δ −
= =
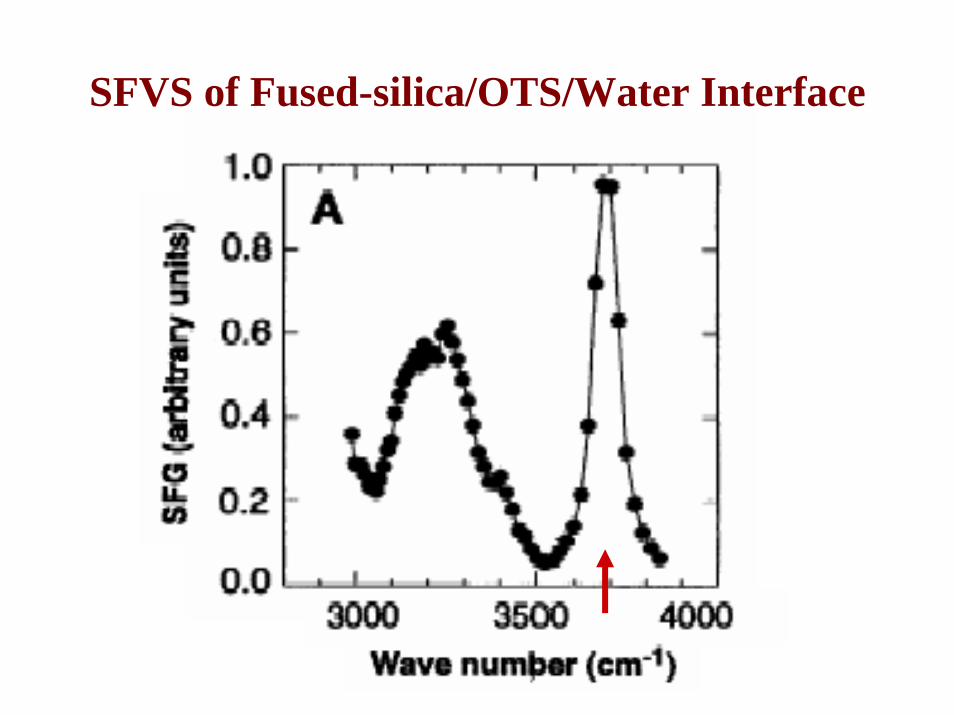
SFVS of Fused-silica/OTS/Water Interface
-1 0 1 2 3 4 5 60.90
0.92
0.94
0.96
0.98
1.00
1.02
1.04
-+τ = 1.3 0.1 ps
SFG
prob
e(τ)/S
FGpr
obe(τ
< -2
00fs
)
probe IR + vis delay (ps)
Third-order cross-correlation (a.u.)
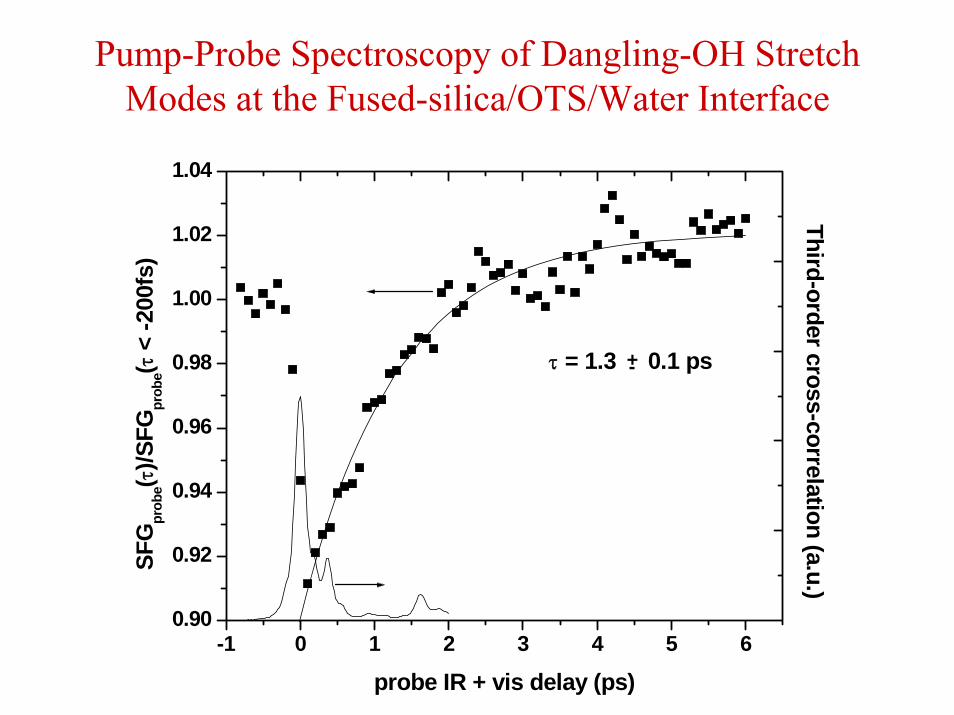
Pump-Probe Spectroscopy of Dangling-OH Stretch Modes at the Fused-silica/OTS/Water Interface

Bonded OH stretches● Spectral diffusion time ≤ 100 fs● Vibrational relaxation time ~ 300 fs● Thermalization time ~ 700 fs● Dephasing time: ≤ 100 fs
Free OH Stretch● Hole recovery time: 1.3 ps● Dephasing time: 1/linewidth ~ 330 fs
Results
Sum frequency spectroscopy is a powerful, versatile tool that allows
many unique applications

Graduate Students:
Mikhail Belkin, Na Ji, John McGuire, Thai Troung, Luning Zhang
Postdoctoral Associates and Visiting Scholars:Katsuyoshi Ikeda (supported by Japanese Science oundation),Ying-Jen Shiu (supported by National Research Council, Taiwan), Song-Hee Han (Korea Sci. & Eng. Foundation fellow), Francois Lagugne-Labarthet (on leave from CNRS, France), Victor Overkhosky (NSF-STC for water purification), Tao Yu (Berkeley Scholar, U. C. Berkeley),Yong An (NRL for cavitand characterization), Pasquale Pagluisi (on leave from U. Calabria, Italy), Eric Chen (supported by National Research Council, Taiwan),Feng Wang (Miller Fellow, U.C. Berkeley)
Collaborators
Phil Ross (MSD, LBNL), Gabor Somorjai (MSD, LBNL), Glenn Waychunas (Earth Science Division, LBNL), D. Chemla (MSD, LBNL), Hao Yang (MSD, LBNL), Xiang Zhang (Berkeley Campus)Masahito Oh-e (Hitachi Research Labs, Japan) , Markus Raschke (Max-Born Institut, Berlin)S. H. Lin (Inst. Atomic & Molecular Sciences, Taiwan), Shin-ya Koshihara (Tokyo Institute of Technology)
Principal Investigator:Y. Ron Shen