Embed Size (px)
Citation preview
455
Technology in Cancer Research and Treatment
ISSN 1533-0346
Volume 12, Number 5, October 2013
© Adenine Press (2013)
Optical Spectral Fingerprints of Tissues from Patients with Different Breast Cancer Histologies Using a Novel Fluorescence Spectroscopic Device
www.tcrt.orgDOI: 10.7785/tcrt.2012.500330
The fluorescence of paired human breast malignant and normal tissue samples was inves-tigated using a novel fluorescence spectroscopic (S3-LED) ratiometer unit with no moving parts. This device can measure the emission spectra of key native organic biomolecules such as tryptophan, tyrosine, collagen and elastin within tissues by using LED (light emitting diode) excitation sources coupled to an optical fiber. With this device, the spectral profiles of 11 paired breast cancerous and normal samples from 11 patients with breast carcinoma were obtained. In each of the 11 cases, marked increases in the tryptophan levels were found in the breast carcinoma samples when compared to the normal breast tissues. In the breast cancer samples, there were also consistently higher ratios of the 340 to 440 nm and the 340 to 460 nm intensity peaks after 280 nm excitation, likely representing an increased tryptophan to NADH ratio in the breast cancer samples. This difference was seen in the spectral profiles of the breast cancer patients regardless of whether they were HER2 positive or negative or hormone receptor positive or negative, and was found regardless of meno-pausal status, histology, stage, or tumor grade.
Key words: Breast carcinoma; Cancer detection; Fluorescence spectroscopy; Stokes shift; Optical fingerprint; Optical biopsy; Tryptophan; Compact medical explorer; Portable fluorescence device.
Introduction
In 1984, an alternative approach to cancer detection, known as fluorescence spec-troscopy or autofluorescence spectroscopy, was introduced by Alfano et al. (1). This approach utilizes the emission of light from the native biomolecules present in tissues, without the use of extrinsic dyes. Because key organic biomolecules such as tryptophan, collagen, elastin and nicotinamide adenine dinucleotide (NADH) have absorption and emission peaks that occur at different wavelengths, an optical fingerprint of the studied tissue can be obtained. Analysis of these spectral peaks can give information about the changes that occur in cancer and other diseases. At about the same time, Profio et al. used fluorescence of lung tissues with extrinsic dyes during bronchoscopy to localize bronchogenic carcinoma (2). Soon after, Tata et al. studied fluorescence polarization spectroscopy of native cancerous and nor-mal kidney tissues (3). The next major advance in optical spectroscopy occurred in 1987, when Alfano et al. investigated the fluorescence spectra from cancerous
*Corresponding author:R. R. Alfano, Ph.D.E-mail: [email protected]
Laura A. SordilloYang Pu, Ph.D.Peter P. Sordillo, M.D., Ph.D.Yury BudanskyR. R. Alfano, Ph.D.*
Institute for Ultrafast Spectroscopy and
Lasers, Department of Physics, The City
College of the City University of New
York, 160 Convent Avenue, New York,
NY 10031
Abbreviations: NADH: Nicotinamide Adenine Dinucleotide; S3: Stokes Shift Spectroscopy; LED: Light Emitting Diode; UV: Ultraviolet; LDA: Linear Discriminant Analysis; PCA: Principle Compo-nent Analysis; ROC: Receiver Operator Characteristic; AUC: Area Under the Curve.
456 Sordillo et al.
Technology in Cancer Research & Treatment, Volume 12, Number 5, October 2013
and normal human breast and lung tissues (4). For the next decade, other investigators utilized ultraviolet and visible light for cancer diagnosis, and key advances were made (5-11). For example, Svanberg et al. used laser-induced fluorescence for tissue characterization (7). Gupta et al. studied breast cancer diagnosis using N2 laser excited native fluorescence spectros-copy (9) and Bigio et al. used scattering light spectroscopy for tissue diagnosis (10). Recently, many other investigators have also utilized light for cancer diagnosis (12-22). In 2007, Alimova et al. investigated hybrid phosphorescence and fluo-rescence native spectroscopy for breast cancer detection utiliz-ing UV LED excitation (22).
The fluorescence of paired human breast malignant and nor-mal tissue samples was investigated using a novel fluorescence spectroscopic ratiometer unit with no moving parts. The unit was tested on 22 samples from 11 breast cancer patients (11 pairs of normal and cancerous breast cancer tissues). In this work, we used native fluorescence spectroscopy with a selective excitation wavelength of 280 nm to study tis-sues from patients with different breast cancer histologies. Linear Discriminant Analysis (LDA) was applied to separate Principle Component Analysis (PCA)-analyzed results into two categories: cancer (malignant) and normal. To highlight the spectral difference between cancerous and normal breast tissues caused by key fluorophores, the ratios of intensities at 340 nm/440 nm and 340 nm/460 nm were calculated from the spectral peaks for both breast normal and malignant tissues.
Materials and Methods
S3-LED Ratiometer Unit
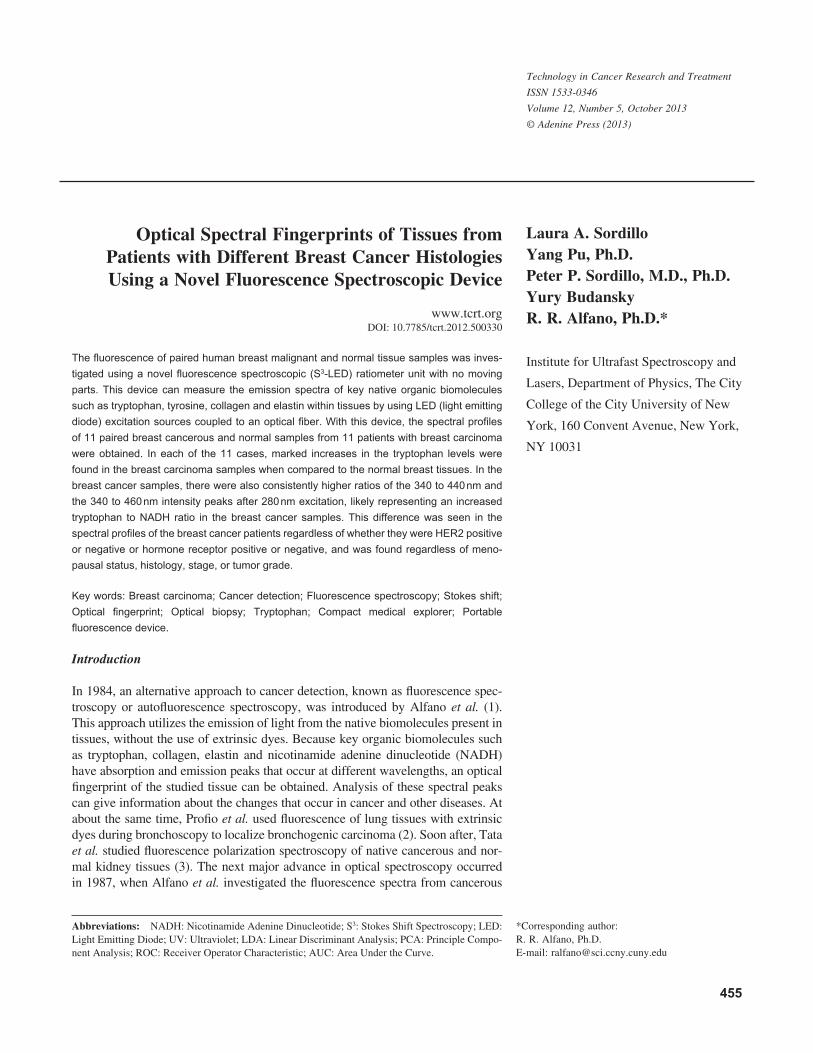
The S3-LED ratiometer unit (Figure 1) has multiple wave-length LEDs coupled to an optical fiber and wavelengths in the ultraviolet to blue-green range (280 nm-520 nm). The main parts of the S3-LED unit are shown in Figure 2. The unit contains a miniature fiber Ocean Optics spectrometer which consists of a linear silicon array detector and is equipped with an additional detection collection lens for increased light effi-ciency. The Ocean Optics spectrometer can collect light in the wavelength range of 200 to 1100 nm with a spectral resolu-tion of 33 nm and an acquisition time of less than 1 second. The LEDs are less than 1 mm squared and create enough power to excite a sample and to be detected by the sensitive Ocean Optics spectrometer. LEDs offer a higher efficiency and lifetime compared to lamp sources. This device is com-pact and no external power is needed.
Samples
The S3-LED ratiometer unit was used to obtain the fluores-cence spectra to show differences in spectral peaks of key biomolecules in 11 paired breast normal and malignant tissue samples from patients with different breast cancer
histologies. Fresh tissues of random shapes were supplied by the National Disease Research Interchange (NDRI) and the Cooperative Human Tissue Network (CHTN) under an Institutional Review Board (IRB) protocol. All tissue sam-ples were measured within 24 hours of removal from the patient. The fresh breast normal and malignant samples from the same patient were measured at the same time. The patient ages ranged from 44 to 76 (see Table I). Eight were post-menopausal, two were pre-menopausal and one was peri-menopausal. Nine were caucasian and two were black. All 11 patients had been treated with mastectomy. None of patients had received prior radiation to the breast. Two had received prior neo-adjuvant chemotherapy without shrinkage of tumor, while nine were treatment naive. Measurements were acquired from multiple random locations along the surfaces of the samples. Cuvettes were used to hold tissue samples. The wavelengths collected by the Ocean Optics spectrom-eter ranged from 300 nm to 700 nm. Photographs of paired malignant and normal breast tissues in a 1 cm 3 1 cm 3 5 cm quartz cuvette are shown in Figure 3A. A microscopic image of stained pathology slides (20X magnified) from malignant and normal tissues from patient 3 can also be seen in Figure 3B (image on the left is cancerous breast tissue sample).
Principal Component Analysis (PCA)
Principal Component Analysis (PCA) was used to analyze the 11 paired breast cancer samples. PCA is a mathematical procedure that uses an orthogonal transformation to convert a set of observations of possibly correlated variables into a set of values of linearly uncorrelated variables called principal components. In our study, PCA was applied as a technique that can resolve a complete spectral data set into a few prin-cipal components and can thus identify and isolate important trends within the data set. Therefore, PCA was used to reduce the number of parameters needed to represent the variance in the spectral data set. Subsequently, Linear Discriminant Analysis (LDA) was employed.
Figure 1: Image of the S3-LED ratiometer unit equipped with LEDs coupled to an optical fiber.

Compact Fluorescence Spectroscopic Device 457
Technology in Cancer Research & Treatment, Volume 12, Number 5, October 2013
Linear Discriminant Analysis (LDA)
Linear Discriminant Analysis (LDA) is a method to find a linear combination of features which separates two or more classes of objects or events. This method is com-monly useful for two group classes of significant dis-criminants. In our study, LDA was applied to separate the PCA-analyzed results into two categories: cancer (malig-nant) and normal. To evaluate the performance of the PCA algorithm combined with LDA for diagnosis of human breast cancer, the following terms can be used 1) true posi-tive: a cancerous sample correctly diagnosed as malignant; 2) false positive: a healthy sample incorrectly identified as malignant; 3) true negative: a healthy sample correctly iden-tified as healthy; and 4) false negative: a cancerous sample incorrectly identified as healthy. Sensitivity and specificity
are then calculated. Sensitivity is the proportion of true nega-tives correctly recognized. Specificity is the proportion of true positives correctly identified. The sensitivity and specificity scores range between 0 and 1, where the larger the score the better the method.
Receiver Operator Characteristic (ROC)
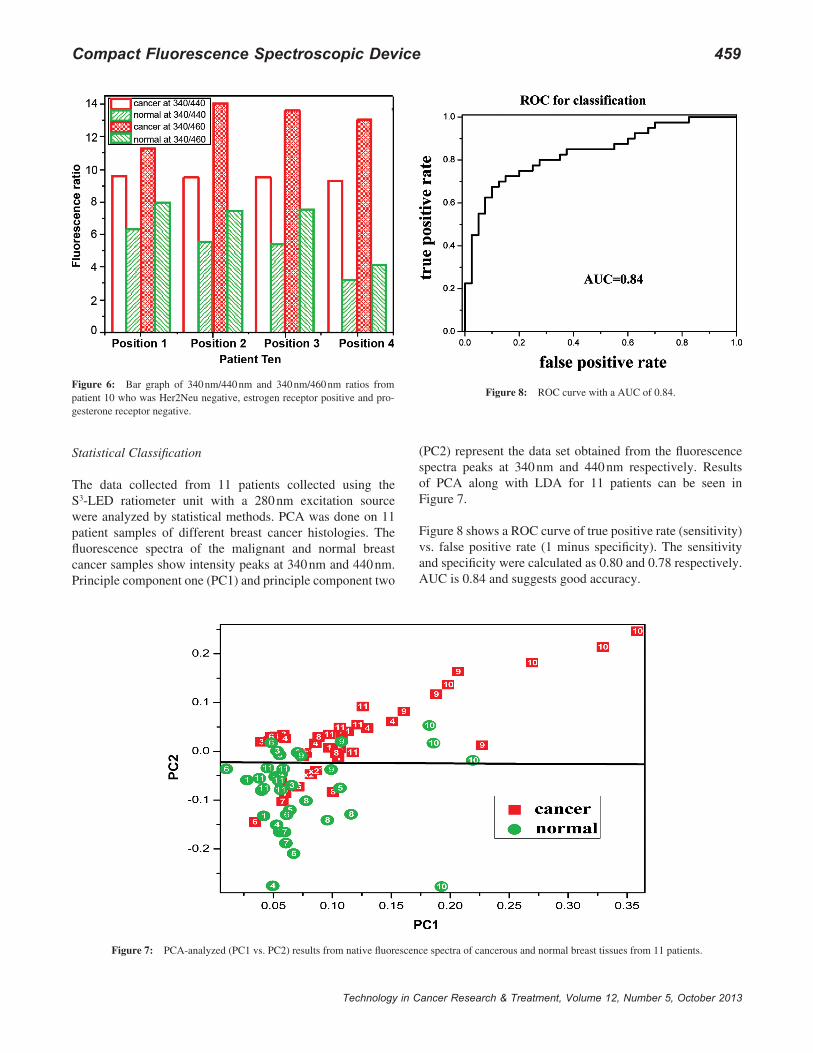
A Receiver Operator Characteristic (ROC) curve is a graph-ical plot of two group classes; true positive rate (sensitiv-ity) vs. false positive rate (1 minus specificity). Accuracy is measured by the area under the ROC curve (AUC). A rough guide for analyzing the accuracy of a diagnostic test is the standard academic point system: (A) excel-lent 5 0.90-1; (B) good 5 0.80-0.90; (C) fair 5 0.70-0.80; (D) poor 5 0.60-0.70; and (E) fail 5 0.50-0.60.
Table I
Characteristics of breast cancer patients.
Patients Age/Sex Histology Stage Grade
1 76F Invasive ductal carcinoma 2A 3 2 61F Multifocal invasive ductal carcinoma 3C 3 3 74F Invasive micropapillary breast carcinoma 3C 2 4 59F Invasive ductal carcinoma 3C 3 5 44F Invasive metaplastic carcinoma, matrix
producing subtype with chondroid and squamous differentiation
3C 3
6 66F Invasive ductal carcinoma 2A 2 7 54F Invasive ductal carcinoma 3C 1 8 59F Invasive ductal carcinoma 3A 3 9 66F Invasive ductal carcinoma 3A 310 63F Invasive ductal carcinoma 2B 311 48F Invasive lobular carcinoma, pleomorphic variant 2A 2
Figure 2: Schematic of S3-LED ratiometer unit which includes a LED light source unit, a separate light enclosed box and a computer.

458 Sordillo et al.
Technology in Cancer Research & Treatment, Volume 12, Number 5, October 2013
Results
Fluorescence from Human Breast Tissues
The fluorescence spectra of the malignant and normal breast cancer samples from the 11 patients were notably different. The fluorescence intensities at 340 nm obtained with a 280 nm excitation source were stronger in the malignant samples than in the normal samples, while the intensities at 440 nm were stronger in the normal samples. The average fluorescence spectral profiles of cancerous (solid line) and normal (dashed line) breast tissue from the 11 patients with standard devia-tion error bars at key wavelengths are shown in Figure 4. The
main peaks are found at 340 nm in both the malignant and normal samples with the peaks in the malignant samples higher. This is consistent with previous studies where we investigated biomolecules such as tryptophan, collagen, elastin, NADH, and other key fluorophores using absorp-tion and fluorescence spectroscopy (1, 3-6).
To highlight the spectral difference between cancerous and normal breast tissues caused by key fluorophores, the ratios of intensities at 340 nm/440 nm and 340 nm/460 nm were calculated for both breast normal and malignant tis-sues from the spectral peaks. The ratios were consistently higher in the breast cancer samples compared to the nor-mal samples, likely representing an increased tryptophan to NADH ratio in the breast cancer samples. A consistent difference in the 340 nm/440 nm and 340 nm/460 nm ratios was seen between malignant and normal breast cancer samples regardless of tumor histology, stage, grade, meno-pausal status or hormone receptor status. For example, this difference was seen for both patient 8 (Figure 5) and for patient 10 (Figure 6). It was noted that the difference was greater for patient 10 than for patient 8. The reason for this is unclear, but may have been because patient 10’s
tumor was more malignant by several important measures. It was very large (4.8 cm compared 2.8 cm for patient 8’s tumor), was progesterone receptor negative while patient 8’s tumor was progesterone receptor positive, and had fewer estrogen receptors (more than 95% vs. 19%). As expected, the difference in 340 nm/440 nm and 340 nm/460 nm ratios between the benign and malignant breast tissue samples was also seen in the two patients who received neo-adjuvant chemotherapy without tumor shrinkage.
Figure 4: Average fluorescence spectral profiles of cancerous (solid line) and normal (dashed line) breast tissues from 11 patients with standard devia-tion error bars at key wavelengths.
Figure 5: Bar graph of 340 nm/440 nm and 340 nm/460 nm ratios from patient 8 who was triple positive (Her2Neu, estrogen and progesterone all positive).
Figure 3: Image of normal (right) and malignant (left) breast tissue samples. (A) inside a 1 cm 3 1 cm 3 5 cm quartz cuvette; (B) a microscopic image of stained pathology slides (20X magnified).
Compact Fluorescence Spectroscopic Device 459
Technology in Cancer Research & Treatment, Volume 12, Number 5, October 2013
Statistical Classification
The data collected from 11 patients collected using the S3-LED ratiometer unit with a 280 nm excitation source were analyzed by statistical methods. PCA was done on 11 patient samples of different breast cancer histologies. The fluorescence spectra of the malignant and normal breast cancer samples show intensity peaks at 340 nm and 440 nm. Principle component one (PC1) and principle component two
(PC2) represent the data set obtained from the fluorescence spectra peaks at 340 nm and 440 nm respectively. Results of PCA along with LDA for 11 patients can be seen in Figure 7.
Figure 8 shows a ROC curve of true positive rate (sensitivity) vs. false positive rate (1 minus specificity). The sensitivity and specificity were calculated as 0.80 and 0.78 respectively. AUC is 0.84 and suggests good accuracy.
Figure 8: ROC curve with a AUC of 0.84. Figure 6: Bar graph of 340 nm/440 nm and 340 nm/460 nm ratios from patient 10 who was Her2Neu negative, estrogen receptor positive and pro-gesterone receptor negative.
Figure 7: PCA-analyzed (PC1 vs. PC2) results from native fluorescence spectra of cancerous and normal breast tissues from 11 patients.

460 Sordillo et al.
Technology in Cancer Research & Treatment, Volume 12, Number 5, October 2013
Discussion
A new compact S3-LED ratiometer unit which is portable and without moving parts is described which can be used to distinguish normal from malignant breast tissues. Dis-tinct differences at 340 nm and at 440 nm were observed between normal and malignant breast tissue. Based on previous studies (1, 3-6), the fluorescence and absorp-tion peaks of tryptophan, NADH, flavin and other fluoro-phores of interest are summarized in Table II. The peaks observed at 340 nm are most likely attributable to trypto-phan. In each of the 11 patient samples in our study, there was a weaker spectral signature in normal tissue than in the malignant tissue sample at 340 nm. This may be due to increased protein synthesis and the increased utilization of the amino acid tryptophan that occurs in more rapidly dividing cancer cells. Tryptophan is an amino acid required for protein synthesis, accounting for the majority of protein fluorescence. Because of the higher cell density and uncon-trollable cell division in cancerous breast cells, increased fluorescence of tryptophan should be expected. A second peak was observed at 440 nm and is most likely attribut-able to the biomolecule NADH. Further, the 340 nm/440 nm and 340 nm/460 nm ratios were consistently greater in the malignant samples compared to the normal samples. It is noteworthy that the difference in the 340 nm/440 nm ratios and the 340 nm/460 nm ratios between the malignant and normal samples was seen regardless of the pathologic char-acteristics of the breast samples studied, although there was a suggestion that in a more malignant tumor there might have been a more profound difference. With this device, we were able to use the differences at 340 nm and 440 nm to distinguish benign from malignant tissues.
This S3-LED ratiometer unit provides a simple and effective way of showing intrinsic properties of human breast tissue. Breast carcinomas that are pre-menopausal can be thought be represent a different disease than breast carcinomas that develop in the post-menopausal population. Likewise, tumors that have hormone receptor or Her2Neu receptor positivity have a different natural history, prognosis and treatment responsiveness than those that are receptor nega-tive. Despite these differences, all of the samples from these breast cancer patients had similar spectral profiles with our device.
Conclusion
This study demonstrates how the S3-LED ratiometer unit can be used to evaluate normal and abnormal breast tissue samples from patients with different breast cancer histolo-gies. The data of this study shows that this ratiometer unit can effectively obtain the fluorescence of key native organic bio-molecules in complex breast tissue samples with the use of optical fiber technology and multi-wavelength LEDs. A con-sistent difference in the 340 nm/440 nm and 340 nm/460 nm ratios was seen between malignant and normal breast cancer samples regardless of tumor histology, stage, grade, meno-pausal status or hormone receptor status. This difference was greater for patient 10 than for patient 8 and may have been because patient 10’s tumor was more malignant by several important measures. Further investigation into the fluores-cence of paired normal and malignant samples from patients with different breast cancer histologies should be done. This study suggests that this device can be used in vitro for distin-guishing cancerous from normal tissue and could be used as part of the evaluation for determining whether a cancer has been completely resected, thus reducing the need for second or repeat surgeries.
Conflict of Interest
The authors report no conflicts of interest.
Acknowledgements
Laura A. Sordillo is a recipient of the Kaylie Entrepreneurship Award from the Grove Engineering School at The City College of the City University of New York and of the CCNY-MSKCC Graduate Award from the CCNY-MSKCC Partnership for Cancer Research Program. Dr. Yang Pu acknowledges sup-port from the U. S. Army Medical Research and Material Command (USAMRMC) grant of W81XWH-11-1-0335 (CUNY RF # 47204-00-01). The authors acknowledge CHTN and NDRI for providing tissue samples.
References
1. Alfano, R. R., Tata, D., Cordero, J., Tomashefsky, P., Longo F., Alfano, M. Laser induced fluorescence spectroscopy from native can-cerous and normal tissue. IEEE J Quantum Electronics 20, 1507-1511 (1984). DOI: 10.1109/JQE.1984.1072322
2. Profio, A. E., Doiron, D. R., Balchum, O. J., Huth, G. C. Fluorescence bronchoscopy for localization of carcinoma in situ. Med Phys 10(1), 35-39 (1983). DOI: 10.1118/1.595374
3. Tata, D. B., Foresti, M., Cordero, J., Tomashefsky, P., Alfano, M. A., Alfano, R. R. Fluorescence polarization spectroscopy and time-resolved fluorescence kinetics of native cancerous and normal rat kidney tissues. Biophys J 50, 463-469 (1986). DOI: 10.1016/S0006-3495(86)83483-X
4. Alfano, R. R., Tang, G., Pradhan, A., Lam, W., Choy, D., Opher, E. Fluorescence spectra from cancerous and normal human breast and
Table IIAbsorption and emission wavelength maxima of key biomolecules: tyro-sine, tryptophan, collagen, elastin, NADH and flavins.
Molecules Tyrosine Tryptophan Collagen Elastin NADH Flavin
Absorption (nm) 275 287 339 351 340 375Emission (nm) 303 342 380 410 440-460 525
Compact Fluorescence Spectroscopic Device 461
Technology in Cancer Research & Treatment, Volume 12, Number 5, October 2013
lung tissues. IEEE J of Quant Electronics QE 23, 1806 (1987). DOI: 10.1109/JQE.1987.1073234
5. Baraga, J. J., Rava, R. P., Taroni, P., Kittrell, C., Fitzmaurice, M., Feld, M. S. Laser induced fluorescence spectroscopy of nor-mal and atherosclerotic human aorta using 306-310 nm exci-tation. Lasers Surg Med 10, 245-261 (1990). DOI: 10.1002/lsm.1900100305
6. Alfano, R. R., Das, B. B., Cleary, J. B., Prudente, R., Celmer, E. Light sheds light on cancer. Bull NY Acad Med 67, 143-150 (1991).
7. Svanberg, K., Andersson-Engels, S., Baert, L., Bak-Jensen, E., Berg, R., Brun, A., Colleen, S., Idvall, I., D’Hallewin, M., Ingvar, C., Johansson, J., Karlsson, S., Lundgren, R., Salford, L., Stenram, U., Stromblad, L., Svanberg, S., Wang-Nordman, I. Tissue characteriza-tion in some clinical specialities utilizing laser-induced fluorescence. Advances in Laser and Light Spectroscopy to Diagnose Cancer and Other Diseases SPIE 2135, 2-15 (1994). DOI: 10.1117/12.175982
8. Yang, Y., Katz, A., Celmer, E. J., Zurawska-Szczepaniak, M. Z., Alfano, R. R. Optical spectroscopy of benign and malignant breast tissues. Lasers Life Sci 7, 115-127 (1996).
9. Gupta, P. K., Majumder, S. K., Uppal, A. Breast cancer diagno-sis using N2 laser excited autoflorescence spectroscopy. Laser Surg Med 21(5), 417-422 (1997). DOI: 10.1002/(SICI)1096-9101(1997)21:5<417::AID-LSM2>3.0.CO;2-T
10. Bigio, I. J., Mourant, J. R. Ultraviolet and visible spectroscopies for tissue diagnosis: fluorescence spectroscopy and elastic-scattering spectroscopy. Phys Med Biol 42, 803-14 (1997). DOI: 10.1088/0031-9155/42/5/005
11. Lakowicz, J. R. Principles of Fluorescence Spectroscopy. Third Edi-tion, J Biomed Opt 13(2), 029901 (2008). DOI:10.1117/1.2904580
12. Majumder, S. K., Gupta, P. K., Jain, B., Uppal, A. UV excited autofluorescence spectroscopy of human breast tissue for dis-criminating cancerous tissue from benign tumor and normal tissue. Lasers in Life Sciences 8, 249-264 (1999).
13. Drezek, R., Sokolov, K., Utzinger, U., Boiko, I., Malpica, A., Follen, M., Richards-Kortum, R. Understanding the contributions of NADH and collagen to cervical tissue fluorescence spectra: Modeling, measurements, and implications. Journal of Biomedical Optics 6(4), 385-396 (2001).
14. Georgakoudi, I., Jacobson, B. C., Muller, M. G., Sheets, E. E., Badizadegan, K., Carr-Locke, D. L., Crum, C. P., Boone, C. W., Dasari, R. R., Dam, J. V., Feld, M. S. NAD(P)H and collagen as in vivo quantitative fluorescent biomarkers of epithelial precancerous changes. Cancer Res 62, 682-687 (2002).
15. Alfano, R. R., Yang, Y. Stokes shift emission spectroscopy of human tissue and key biomolecules. IEEE J Quantum Electronics 9(2), 148-153 (2003). DOI: 10.1109/JSTQE.2003.811285
16. Demos, S. G., Gandour-Edwards, R., Ramsamooj, R., deVere White, R. Near-infrared autofluorescence imaging for detection of cancer. Journal of Biomedical Optics 9(3), 587-592 (2004). DOI: 10.1117/1.1688812
17. Dramicanin, T., Dramicanin, M. D., Jokanovic, V., Nikolic-Vukosavljevic, D., Dimitrijevic, B. Three-dimensional total synchro-nous luminescence spectroscopy criteria for discrimination between normal and malignant breast tissues. Photochem and Photobiol 81(6), 1554-1558 (2005). DOI: 10.1562/2005-02-15-RA-442
18. Demos, S. G., Vogel, A. J., Gandjbakhche, A. H. Advances in opti-cal spectroscopy and imaging of breast lesions. Journal of Mammary Gland Biology and Neoplasia 11(2), 165-181 (2006). DOI: 10.1007/s10911-006-9022-4
19. Kennedy, S., Geradts, J., Bydlon, T., Brown, J. Q., Gallagher, J., Junker, M., Barry, W., Ramanujam, N., Wilke, L. Optical breast can-cer margin assessment: an observational study of the effects of tis-sue heterogeneity on optical contrast. Breast Cancer Res 12(6), R91 (2010). DOI: 10.1186/bcr2770
20. Pu, Y., Wang, W. B., Tang, G. C., Alfano, R. R. Changes of collagen and Nicotinamide adenine dinucleotide in human cancerous and nor-mal prostate tissues studied using native fluorescence spectroscopy with selective excitation wavelength. J Biomed Opt 15(4), 047008 (2010). DOI: 10.1117/1.3463479
21. Pu, Y., Tang, G. C., Wang, W. B., Savage, H. E., Schantz, S. P., Alfano, R. R. Native fluorescence spectroscopic evaluation of chemotherapeu-tic effects on malignant cells using nonnegative matrix factorization analysis. Technol Cancer Res Treat (TCRT) 10(2), 113-120 (2011).
22. Alimova, A., Katz, A., Sriramoju, V., Budansky, Y., Bykov, A. A., Zeylikovich, R., Alfano, R. R. Hybrid phosphorescence and fluores-cence native spectroscopy for breast cancer detection. J Biomed Opt 12(1), 014004 (2007). DOI: 10.1117/1.2437139
Received: May 23, 2012; Revised: September 4, 2012; Accepted: January 8, 2013