Embed Size (px)
Citation preview

Optical nTAPUser Guide

Notice
Every effort was made to ensure that the information in this manual was accurate at the time of printing. However, informationis subject to change without notice, and Viavi reserves the right to provide an addendum to this manual with information notavailable at the time that this manual was created.
Copyright
© Copyright 2015 Viavi Solutions Inc. All rights reserved. Viavi and the Viavi logo are trademarks of Viavi Solutions Inc. (“Viavi”). Allother trademarks and registered trademarks are the property of their respective owners. No part of this guide may be reproducedor transmitted, electronically or otherwise, without written permission of the publisher.
Copyright release
Reproduction and distribution of this guide is authorized for Government purposes only.
Terms and conditions
Specifications, terms, and conditions are subject to change without notice. The provision of hardware, services, and/or softwareare subject to Viavi standard terms and conditions, available at www.viavisolutions.com/terms.
Specifications, terms, and conditions are subject to change without notice. All trademarks and registered trademarks are theproperty of their respective companies.
Federal Communications Commission (FCC) Notice
This product was tested and found to comply with the limits for a Class A digital device, pursuant to Part 15 of the FCC Rules.These limits are designed to provide reasonable protection against harmful interference when the equipment is operated in acommercial environment. This product generates, uses, and can radiate radio frequency energy and, if not installed and used inaccordance with the instruction manual, may cause harmful interference to radio communications. Operation of this product in aresidential area is likely to cause harmful interference, in which case you will be required to correct the interference at your ownexpense.
The authority to operate this product is conditioned by the requirements that no modifications be made to the equipment unlessthe changes or modifications are expressly approved by Viavi.
Laser compliance
This device is a class 1 laser product.
Industry Canada Requirements
This Class A digital apparatus complies with Canadian ICES-003.
Cet appareil numérique de la classe A est conforme à la norme NMB-003 du Canada.
WEEE and Battery Directive Compliance
Viavi has established processes in compliance with the Waste Electrical and Electronic Equipment (WEEE) Directive, 2002/96/EC,and the Battery Directive, 2006/66/EC.
This product, and the batteries used to power the product, should not be disposed of as unsorted municipal waste and should becollected separately and disposed of according to your national regulations. In the European Union, all equipment and batteriespurchased from Viavi after 2005-08-13 can be returned for disposal at the end of its useful life. Viavi will ensure that all wasteequipment and batteries returned are reused, recycled, or disposed of in an environmentally friendly manner, and in compliancewith all applicable national and international waste legislation.
It is the responsibility of the equipment owner to return equipment and batteries to Viavi for appropriate disposal. If theequipment or battery was imported by a reseller whose name or logo is marked on the equipment or battery, then the ownershould return the equipment or battery directly to the reseller.
Instructions for returning waste equipment and batteries to Viavi can be found in the Environmental section of Viavi web siteat http://www.viavisolutions.com. If you have questions concerning disposal of your equipment or batteries, contact Viavi WEEEProgram Management team at [email protected].
Technical Support
North America 1.844.GO VIAVI / 1.844.468.4284Latin America +52 55 5543 6644EMEA +49 7121 862273APAC +1 512 201 6534All Other Regions viavisolutions.com/contactsemail [email protected]
Support hours are 9:00 am to 5:00 pm (local time for each office).

Table of Contents
Chapter 1: Getting started.................................................................................................................. 5
Optical nTAP Overview................................................................................................................................ 5
Security, convenience, and dependability.................................................................................................5
Chapter 2: Why choose a TAP or SPAN port...................................................................................... 6
Choosing between a SPAN, Aggregator, or full-duplex TAP................................................................... 6
Deciding whether to use a TAP or a SPAN/mirror port....................................................................... 8
When to use a SPAN/mirror port.........................................................................................................10
When to use the Aggregator TAP........................................................................................................12
When to use a full-duplex TAP.............................................................................................................13
Chapter 3: Features............................................................................................................................14
Features....................................................................................................................................................... 14
Chapter 4: Standard and Optional Parts......................................................................................... 15
Parts..............................................................................................................................................................15
Chapter 5: Optical nTAP Installation................................................................................................16
Installing...................................................................................................................................................... 16
Chapter 6: Attenuation......................................................................................................................18
Attenuation and TAPs................................................................................................................................18
Managing attenuation.............................................................................................................................. 19
Attenuation and optical cables................................................................................................................ 19
Determining the best split ratio for you.................................................................................................. 20
Chapter 7: Technical Specifications................................................................................................. 25
Technical specifications.............................................................................................................................25
Chapter 8: Troubleshooting..............................................................................................................27
What latency does a TAP create?............................................................................................................. 27
Not seeing traffic at the analyzer from the TAP..................................................................................... 27
Can I “team” or bond NICs in my analyzer?............................................................................................28
I am seeing CRC errors on my network................................................................................................... 29

4 Table of Contents (16 Oct 2015) — Archive/Non-authoritative version
VLAN tags not visible at the analyzer......................................................................................................29
Memory........................................................................................................................................................ 29
Maximum frame size..................................................................................................................................30
Chapter 9: FCC compliance statement.............................................................................................31
Index....................................................................................................................................................32

1
Chapter 1: Getting started
Optical nTAP OverviewThank you for purchasing the Optical nTAP. Your new product is the most robust,secure, and convenient mechanism for network analyzers and similar devices tocopy data streams from high-capacity network links.
A network Test Access Port (TAP) provides access to the data streams passingthrough a high-speed, full-duplex network link (typically between a networkdevice and a switch). The TAP copies both sides of a full-duplex link (copper oroptical, depending on type of TAP), and sends the copied data streams to ananalyzer, probe, intrusion detection system (IDS) or any other analysis device.There are different TAP models available to monitor both copper and opticallinks.
Security, convenience, and dependabilityThe security and convenience of a TAP makes it preferable to inline connectionsfor network analysis and intrusion detection and prevention (IDS/IPS)applications.
Because a TAP has no address on the network, the TAP and the analyzerconnected to it cannot be the target of a hack or virus attack. TAPs areeconomical to install, allowing you to leave them permanently deployed. Thisallows you to connect and disconnect the analysis device as needed withoutbreaking the full-duplex connection, much like plugging in an electrical device.
A TAP is also preferable to using a switch’s SPAN/mirror port to copy the datastream. Unlike the SPAN/mirror port, a TAP will not filter any SPAN/mirror port isa half-duplex link (that is, a send-only “simplex” data stream), it has the capacityto transmit only half of a fully-saturated link. Additionally, a TAP does not useany of the switch’s CPU resources.

2
Chapter 2: Why choosea TAP or SPAN port
Choosing between a SPAN, Aggregator, or full-duplexTAP
Whether you use a SPAN/mirror port, aggregator TAP, or full-duplex TAP dependson the saturation level of the link (up to 200% of link speed when both sides arecombined) you want to monitor and the level of visibility you require.
There are numerous ways to access full-duplex traffic on a network for analysis:SPAN/mirror ports, Aggregator TAPs, or full-duplex TAPs are the three mostcommon.
Each approach has advantages and disadvantages. SPANs and Aggregator TAPsare designed to work with a standard (and usually less expensive) networkcard on the analysis device, but their limitations make them less than ideal forsituations where it is necessary to guarantee the visibility of every packet on thewire.
A full-duplex TAP is the ideal solution for monitoring full-duplex networksutilized at more than 50 percent (100% when both sides are combined), but itsdesign requires that the analyzer be a specialized device with a dual-receivecapture interface that is capable of capturing the TAP’s output, providingaccurate timing, and recombining the data for analysis.
Table 1 list the advantages and disadvantages of three common methods ofaccessing traffic from full-duplex networks for analysis, monitoring, or forensics:
Table 1: Methods of accessing traffic Aggregator SPAN/Mirror Full-DuplexRequires power X X X1

Choosing between a SPAN, Aggregator, or full-duplex TAPChapter 2: Why choose a TAP or SPAN port 7
Aggregator SPAN/Mirror Full-Duplex
Better2 protectionagainst droppedpackets
X X
Uses single-receivecapture card
X X
Uses internal bufferto mitigate trafficspikes
X3
Suitable fornetworks with lightto moderate trafficwith occasionalspikes
X
Passes OSI Layer 1& 2 errors
X X
Not Addressable(cannot be hacked)
X X
Requires dual-receive capturecard
X
Ideal for heavytraffic/criticalnetworks
X
Suitable fornetworks with lightto moderate traffic
X
Remotelyconfigurable
X
1. The Optical TAP does not require power, but the Copper TAP does.2. Better protection against dropping packets than SPAN/mirror.3. Although the Aggregator TAP has an internal buffer that mitigates spikes in traffic, when thebuffer itself is full, the new packets are dropped until the output of the buffer can catch up.
Whether you are monitoring a network for security threats or capturing anddecoding packets while troubleshooting, you need a reliable way to see thenetwork traffic. The appropriate TAP for capturing full-duplex data for analysisdepends on the rates of traffic you must monitor, and what level of visibility yourequire.
♦ Attaching a monitoring or analysis device to a switch’s analyzer port(SPAN/mirror port) to monitor a full-duplex link.
Because a SPAN/mirror port is a send-only simplex stream of data thereis a potential bottleneck when trying to mirror both sides of a full-duplexlink to the analyzer’s single receive channel. When to use a SPAN/mirrorport.
♦ Attaching a monitoring or analysis device to an Aggregator TAP insertedinto a full-duplex link.
As with a SPAN, the Aggregator TAP copies both sides of a full-duplex linkto the analyzer’s single receive channel. It uses buffering which makes it

Choosing between a SPAN, Aggregator, or full-duplex TAP8 Optical nTAP (16 Oct 2015) — Archive/Non-authoritative version
somewhat better able to keep up with higher traffic levels than a SPAN.For more details, see When to use the Aggregator TAP and .
♦ Attaching a dual-receive monitoring or analysis device to a full-duplex TAPinserted into a full-duplex link.
Dual-receive means that the network card on the analysis device has tworeceive channels rather than the transmit and receive channels associatedwith a standard full-duplex link. For more details, see When to use a full-duplex TAP.
Deciding whether to use a TAP or a SPAN/mirror portSPANs are great for proof of concepts and lightly used links. TAPs ensure you getall of the traffic, including on high speed links, and physical layer errors.
A TAP is a passive splitting mechanism installed between a device of interest andthe network. A TAP copies the incoming network traffic and splits it. It passes thenetwork traffic to the network and sends a copy of that traffic (both send andreceive) to a monitoring device in real time.
A SPAN/mirror port on a switch that copies traffic on a port or group of portsand sends the copied data to an analyzer. By its very nature it is half-duplex,which means that it cannot send all of the send and receive traffic it sees iftraffic exceeds 50% of the bandwidth. Moreover, switch manufacturers designtheir products so that the SPAN/mirror port has a lower priority in the switchoperating system. Therefore, one of the first things to stop working when theswitch gets busy is the SPAN/mirror port traffic flow. A SPAN/mirror port is finefor connections to stations at the edge of your network, but may be unable tokeep up with the higher traffic volumes on your full duplex links at the core ofyour network. It is convenient for a proof of concept, but cannot pass physicallayer errors (poorly formed packets, runts, CRCs) to the analyzer and give you allof the visibility you need for Gigabit, 10 Gigabit or 40 Gigabit networks, but aTAP will.
Most enterprise switches copy the activity of one or more ports through a SwitchPort Analyzer (SPAN) port, also known as a mirror port. An analysis device canthen be attached to the SPAN port to access network traffic.
There are four common ways to get full duplex data to a probe or analyzer:
♦ Connect the probe to a SPAN/mirror port. A SPAN/mirror port can providea copy of all designated traffic on the switch in real time, assumingbandwidth utilization is below 50% of full capacity.
♦ Deploy an Aggregator TAP on critical full duplex links.♦ Deploy a full duplex TAP on critical links to capture traffic. For some
types of traffic, such as full duplex gigabit links, TAPs are the only way toguarantee complete analysis, especially when traffic levels are high.
♦ Traffic aggregators, like the Observer Matrix, allow you to copy and filterfull duplex traffic. Because full-duplex Ethernet links lies at the core ofmost corporate networks, ensuring completely transparent analyzer accessto those links is critical.

Choosing between a SPAN, Aggregator, or full-duplex TAPChapter 2: Why choose a TAP or SPAN port 9
Figure 1: TAP versus SPAN
Table 2: TAP versus SPAN TAP SPAN/mirror portPros Greatly reduces the risk of
dropped packetsLow cost
Monitoring device receivesall packets, including physicalerrors
Remotely configurable fromany system connected to theswitch
Provides full visibility into full-duplex networks
Able to copy intra-switchtraffic
Cons Analysis device may needdual-receive capture interfaceif you are using a full-duplexTAP (does not apply to theAggregator TAP family)
Cannot handle heavily utilizedfull-duplex links withoutdropping packets
Additional cost with purchaseof TAP hardware
Filters out physical layer errors,hampering some types ofanalysis
Cannot monitor intra-switchtraffic
Burden placed on a switch’sCPU to copy all data passingthrough ports
Switch puts lower priority onSPAN port data than regularport-to-port data
Can change the timing offrame interaction alteringresponse times
Bottom line A TAP is ideal when analysisrequires seeing all the traffic,including physical-layer errors.A TAP is required if networkutilization is moderate toheavy. The Aggregator TAPcan be used as an effectivecompromise between a TAPand SPAN port, deliveringsome of the advantagesof a TAP and none of thedisadvantages of a SPAN port.
A SPAN port performs wellon low-utilized networks orwhen analysis is not affectedby dropped packets.

Choosing between a SPAN, Aggregator, or full-duplex TAP10 Optical nTAP (16 Oct 2015) — Archive/Non-authoritative version
When to use a SPAN/mirror portThe advantage of using a SPAN/mirror port is its cost, as a SPAN/mirror port isincluded for free with nearly every managed switch. A SPAN/mirror port is alsoremotely configurable, allowing you to change which ports are mirrored from theswitch management console.
There are some limitations in using a SPAN/mirror port. Limitations of a SPAN/mirror port stem from the aggregation necessary to merge full-duplex networktraffic into a single receive channel. For examples, when traffic levels on thenetwork exceed the output capability of the SPAN/mirror port, the switch isforced to drop packets. Another reason that a SPAN/mirror port may not be theright choice is because Layer 1 and 2 errors are not mirrored and therefore neverreach the analyzer. When performing network troubleshooting, seeing theseerrors can be important.
When monitoring with a SPAN/mirror port on a switch, the switch does threethings:
♦ Copies both the send and receive data channels♦ Reconstructs an integrated data stream from the two channels♦ Routes the integrated signal to the send channel of the SPAN/mirror port
Each of these activities burdens the switch’s internal processor. These demandson the switch’s CPU have implications for both your monitoring equipment andgeneral network performance. Using a SPAN/mirror port to capture networktraffic for analysis presents the following risks:
♦ As total bandwidth usage for both channels exceeds the capacity of theoutbound link to the analyzer, the excess traffic is dropped from theanalyzer stream. There simply is not enough bandwidth to transmit bothsides of the full-duplex traffic across a single standard interface.
♦ The switch’s CPU must act as both a network switch and a packet-copier.The switch’s CPU must also integrate the two data streams (send andreceive) together correctly. Both packet copy/re-direction and channelintegration is affected by switch load. This means the SPAN/mirror portmay not deliver accurate captures when the switch is under heavy load.Monitoring a 10/100 network through a gigabit SPAN/mirror port andanalyzer does not alleviate these concerns. Also, there is no notificationwhen the SPAN/mirror port is dropping packets or delivering inaccuratetime stamps.
A SPAN/mirror port can deliver satisfactory results when used to monitor lightlyused, non-critical networks. If network utilization exceeds the capacity of theoutbound (analyzer) link, packet loss results—which invalidates many types ofanalysis, and makes monitoring for certain kinds of network activity impractical.For example, you might miss a virus signature because packets are beingdropped. When analyzing a transaction or connection problem, the analyzer maydetect problems where none exist because expected packets are being droppedby the SPAN/mirror port. Hardware and media errors will also be impossible totroubleshoot through a SPAN/mirror port, as these errors are not mirrored to theanalyzer.

Choosing between a SPAN, Aggregator, or full-duplex TAPChapter 2: Why choose a TAP or SPAN port 11
Cloning your SPAN/mirror portYou can still access your SPAN/mirror port even if all of your SPAN/mirror portson your switch are used. This is fairly common, and you can use a TAP to producetwo copies of the SPAN/mirror port.
By cloning a SPAN/mirror port you get the benefits of a duplicate copy of thetraffic and no security risk.
Figure 2: Cloning your SPAN/mirror port
Joining SPAN/mirror portsIf you have a primary switch and a failover switch, you can connect both of themto the Aggregator TAP. Connect one of them to Link A and the other to Link B.
It does not matter whether the primary switch is connected to Link A or Link B,and you do not need to know which one is “live.” The Aggregator TAP joins theactive and inactive SPAN/mirror port session together and sends the result tothe analyzer. Regardless which switch is primary, the Aggregator TAP sends theSPAN/mirror port data from that switch to the analyzers.

Choosing between a SPAN, Aggregator, or full-duplex TAP12 Optical nTAP (16 Oct 2015) — Archive/Non-authoritative version
Figure 3: Joining SPAN/mirror ports
When to use the Aggregator TAPThe Aggregator TAP offers a compromise between the SPAN/mirror port andfull-duplex TAP options. It costs more than a full-duplex TAP due to the addedcomplexity and memory requirements of its built-in buffer.
The Aggregator TAP does not require a specialized (and potentially moreexpensive) analyzer with a dual-receive capture interface. Like a full-duplex TAP,it is independent of the network, making it immune to security threats.
The Aggregator TAP includes an internal buffer to mitigate the bandwidthproblem associated with converging both sides of the full-duplex traffic from thenetwork into one side of the full-duplex link to the analyzer. The buffer is able tocache some spikes in network utilization, but the Aggregator TAP drops packetswhen the bursts of activity exceed its buffer capacity.
The Aggregator TAP is ideally suited to work with an analysis device with astandard, single-receive capture interface or NIC. This means that a laptop or astandard system can be deployed as an analyzer rather than the more expensivespecialized analyzers or appliances that are designed to accept full duplex trafficthrough a dual-receive capture interface.
Just like a SPAN/mirror port, the Aggregator TAP is ideal for a lightly usednetwork that occasionally has utilization peaks above the capture capacity of theanalyzer. Unlike a SPAN/mirror port, the Aggregator TAP will forward Layer 1 and2 errors to the analysis device.
Another advantage the Aggregator TAP has over a SPAN/mirror port session is itsinternal memory buffer. The memory buffer provides limited protection againstpacket loss, and if the network utilization does not regularly exceed the capacityof the analyzer’s capture card, an Aggregator TAP may be the right choice.
The appropriate solution for capturing full-duplex data for analysis dependson the rates of traffic you must monitor, and what level of visibility yourequire. When monitoring a lightly-used network, using a SPAN/mirror port orAggregator TAP to supply an analysis device with a standard NIC (i.e., single-receive) interface can be an economical choice. The Aggregator TAP can provide

Choosing between a SPAN, Aggregator, or full-duplex TAPChapter 2: Why choose a TAP or SPAN port 13
protection against packet loss, but if usage spikes exceed its buffer capacitybefore the link to the analyzer can catch up, the Aggregator TAP drops packets.
To monitor a critical, heavily utilized full-duplex link, a full-duplex TAP is the onlyalternative. Monitoring a full-duplex connection using a full-duplex TAP and ananalyzer with a dual-receive capture interface guarantees complete, full-duplexcapture for monitoring, analysis, and intrusion detection regardless of bandwidthsaturation.
When to use a full-duplex TAPA full-duplex TAP is the only option guaranteeing all of the network traffic makesit to the analysis device (including Layer 1 and 2 error information). Althoughthis can be the most expensive option, it is also the only option that guaranteescomplete accuracy when the network is highly saturated.
A full-duplex TAP is more complex and potentially expensive to implement, butwhere there is high network utilization and an importance to guarantee thecapture of “everything on the wire” along with errors from all network layers,a full-duplex TAP is the only choice. If the analysis requires a high level of datastream fidelity (for instance, looking for jitter in video or VoIP), only a full duplexTAP forwards the original data timing to the analyzer.
Note: A full-duplex TAP must be coupled with a probe or monitoring devicecapable of receiving both channels of a full-duplex signal and recombiningthe two channels into a single data stream for analysis.
A full-duplex TAP is a passive mechanism that is installed between two networkdevices. An Optical TAP is non-electronic (no power) and optically splits thesignal into two full-duplex signals. One signal maintains the network link, whilethe other is passed to an analyzer equipped with a dual-receive capture card. ACopper TAP performs the same function, but uses electronic circuitry to duplicatethe signals.
Because a full-duplex TAP copies both the send and receive channels from afull-duplex link to the analyzer (where the data is integrated), the analyzer canmonitor a full-duplex network at line rate—assuming the capture card in theanalyzer is capable.
All TAPs from Viavi, except the Aggregator TAP family, are full-duplex TAPs.

3
Chapter 3: Features
Features
Key features of the Optical nTAP include:
♦ No AC power required♦ Passive access without packet tampering or introducing a single point of
failure♦ All traffic (including errors) is passed from all OSI layers for analyzing♦ Enhanced security because the nTAP does not require or use an IP address,
making it undetectable compared to a SPAN♦ Allows you to connect and disconnect the analysis device as needed
without taking the network down♦ Fully IEEE 802.3 compliant♦ Fully RoHS compliant♦ Front-mounted connectors make installation simple♦ Optional 19-inch 1U rack mount panel holds up to three nTAP

4
Chapter 4: Standard and Optional Parts
PartsThe Optical nTAP comes with several parts. If any part is missing or damaged,contact Viavi immediately.
The Optical nTAP ships with the following items:
♦ Optical nTAP♦ Quick Reference Card
Your kit may also contain optionally available parts (for instance, patch cables).

5
Chapter 5: Optical nTAP Installation
InstallingPrerequisite(s):
♦ Decide where to place the nTAP and physically mount it, if desired.Depending on the form factor purchased, this may be in a drive bay, rackmount bracket, or wherever it is most convenient.
♦ Connect your device of interest (for instance, switch, router, etc.) tothe Optical nTAP using standard optical cables with an LC connector tocomplete the pass-through connection.
♦ Connect the nTAP to your analyzer or other monitoring device usingoptical cables. Be certain to connect to the receive ports of the capturecard in your analyzer.
♦ The network adapter you connect to the Analyzer side of the OpticalnTAP must have auto-negotiation disabled, otherwise no traffic will bepassed to that network adapter. This also means the network adaptermust support the ability to disable auto-negotiation; not all third-partynetwork adapters support this. However, all Gen2 capture card models canenable and disable auto-negotiation.
An Optical TAP splits the full-duplex signals, allowing the monitoring deviceaccess to a copy of the data stream while maintaining uninterruptable data flowthrough the monitored link. Optical TAPs require no external power. They areavailable in various split ratios to match the optical signal strength requirementsof the network connections and of the monitoring equipment.
When traffic comes in to Link A, two copies are made in the TAP. One copy is sentout Link B to the switch and the other copy is sent out the Analyzer port A to theanalysis device. A similar thing happens with traffic that comes in Link B. Twocopies are made. One copy is sent out Link A and the other copy is sent out the

InstallingChapter 5: Optical nTAP Installation 17
Analyzer port B. Due to how the TAP is designed, it is not possible for traffic fromthe Analyzer side to pass to the Link side.
Figure 4: Cabling the Optical nTAP
Caution: Before you temporarily break the link between the device ofinterest and the network, you may want to shut down access to that deviceand notify users of the down time.
1. Disconnect the cable from your device (typically a switch) and connect it toLink B.
2. Use another full-duplex cable to connect the network device (or primarydevice in a failover arrangement) to Link A port, thus completing the pass-through link.
3. Use a Y-cable (i.e., a splitter cable) to connect the nTAP‘s Analyzer port to thereceive sockets on your analyzer’s capture interface. Be certain to connectthe cable to the capture card in your analyzer. As an alternative, you can splityour own duplex cable (or use two simplex cables) to connect each side ofthe Analyzer ports on the TAP to the receive ports on each of the NICs in theanalyzer.
4. Ensure that auto-negotiation is disabled on the receiving capture card in youranalyzer. See the documentation for your capture card or analyzer for details.If auto-negotiation is enabled, the analyzer will not be able to receive thestream from the TAP until it is.
All Optical TAP devices contribute to optical attenuation. See a fuller discussionof it in Attenuation.

6
Chapter 6: Attenuation
Network administrators who manage optical links have the added challengeof dealing with signal attenuation—the rate at which light dissipates over anetwork.
Attenuation is caused by a number of factors and can affect both networkperformance and the ability to analyze the network.
Excessive signal attenuation can cause link failure. Understanding signal levels,selecting the right split ratio on TAPs, and carefully managing the location ofrepeaters can prevent problems. This section defines attenuation, explains how itis affected by fiber and other optical elements on a network, and how it can beefficiently managed.
Attenuation is the reduction of signal strength during transmission caused by theabsorption of light from the materials through which it travels. Greater signalloss equals higher attenuation. A signal can lose intensity or experience increasedattenuation with each surface or medium it traverses. Many factors contribute tothe attenuation rate of signals including devices such as TAPs and transmissionthrough optical cables.
Optical signal strength is measured in decibels (dB) and is based on a logarithmicscale. If a signal attenuates too much, the destination device cannot identify itor the signal may not even reach the destination. This is why some optical linksdepend on repeaters, which amplify the signal.
Attenuation and TAPsAs with all devices inserted into an optical link, one side effect of TAP usage issignal attenuation.
TAPs are used to provide access to the data streams passing through a high-speed, full-duplex network link. TAPs deliver a complete copy of data to amonitoring device for accurate analysis. An Optical TAP optically splits the lightpower of the full-duplex signal into two copies. One part of the split signal

Managing attenuationChapter 6: Attenuation 19
is sent to the other device on the network, while the other is simultaneouslypassed to the analysis or monitoring appliance.
A TAP attenuates the signal for two reasons:
♦ A portion of the signal strength is “siphoned off” and sent to the analyzer.How much of the signal strength is redirected for analysis depends on thesplit ratio of the TAP.
♦ The connections and internal TAP cables and connectors absorb and refracta small portion of the signal.
An Optical TAP contributes to signal attenuation, but typically not enough tomake a significant difference on the network.
An optical split ratio must be designated on each TAP. In most cases, a 50/50split ratio is ideal, providing sufficient light to both the network and monitoringdevice. However, there may be special cases that require an alternative ratio inorder to meet signal power needs. For example, if a TAP is cabled close to theanalyzer NIC and the link under test requires a long cable run, you may want toprovide more light power back to the network than to the monitoring device. Ifyou do choose a ratio other than 50/50, keep in mind that the signal has to bestrong enough for it to be interpreted at the analyzer. More details about this arecovered in Determining the best split ratio for you.
Managing attenuationManaging signal attenuation is critical for running a network at optimalperformance.
If signal attenuation is too high, destination devices may not be able to establisha link or receive network traffic. Repeaters can help, but they can be costlyand inconvenient to implement. In general, unless a signal must travel a longdistance or is compromised by patch panels, there should not be a problemusing the 50/50 split ratio. The most efficient and cost-conscious way to manageattenuation is to measure signal levels throughout the network and placerepeaters only when and where they are needed.
To determine if a light signal is at an acceptable level at any point on a network,it is helpful to use an optical power meter. Optical power meters measure signalpower at a port, helping you determine whether a device is receiving a strongenough signal and thereby identifying if repeaters need to be placed. The metersare typically inexpensive and are offered from a number of vendors.
Attenuation and optical cablesOptical cables contribute to signal attenuation. As light travels through anoptical cable, some of its energy gets dispersed and absorbed by the cable. Theattenuation rate varies depending on the cable type used.
Depending on your transmission technology, you may be required to use aspecific cable type. Examples include single-mode (for LX or LR) and multimode(for SX or SR). Multimode cable has a larger core diameter than single-modecable, resulting in greater light dispersion. Unless the cable run is extremely long,the signal attenuation for both cable types is a minor contributor to the powerloss budget. However, multimode cable does cause higher signal attenuationthan single-mode cable. Check with the cable manufacturer to determine specificattenuation rates.

Determining the best split ratio for you20 Optical nTAP (16 Oct 2015) — Archive/Non-authoritative version
Determining the best split ratio for youTo ensure that all of the devices receive enough light power to establish andmaintain a connection, you must understand where light can be “lost” as ittravels between the network devices connected to the TAP and from the TAP tothe analyzer.
Fiber optic data travels on light power. A fiber optic TAP makes a copy of thedata for the analyzer by splitting the light power.
After the send strength and receive sensitivities of the ports and cable distancesare known, a “power loss budget” can be calculated. The power loss budget canbe helpful in determining if there is enough signal strength left at the analyzerreceive port for a desired split ratio.
The primary factors that need to be collected to determine loss budget are the:
♦ Transmit power from the network devices♦ Cable distance from the network device to the TAP♦ Maximum insertion loss from the TAP♦ Cable distance from the TAP to the analyzer♦ Analyzer port receive sensitivity♦ Other less crucial items that may also affect you include:
● Number or quality of any connectors or patch panels in the path to andfrom the TAP
● Age of the fiber cables● Amount of heat in the environment where the fiber runs
Table 3: Maximum Insertion LossesMaximum Insertion Losses in Decibels Multimode 62.5
micrometerMultimode 50micrometer
Single-Mode 9micrometer
Split Ratio1 1300nm 850nm 1300nm 850nm 1310-1550
50/50 3.9/3.9 4.7/4.7 4.5/4.5 5.5/5.5 3.6/3.660/40 3.0/5.0 3.8/5.7 3.7/5.6 4.7/6.6 2.8/4.870/30 2.3/6.3 3.0/7.0 2.9/7.0 3.9/8.0 2.0/6.1
80/202 1.7/8.3 2.4/9.0 2.3/9.0 3.2/10.0 1.3/8.0
90/102 1.2/12.0 1.9/12.5 1.8/12.8 2.7/13.5 0.8/12
Fiber Loss/km3 1 3 1 3 0.4/0.3
Connector Loss .5 .5 .5 .5 .21. The ratio is network/analyzer. So, a 70/30 connection has 70% of the light power for the networkand 30% for the analyzer.2. Not recommended because too little light power reaches the analyzer.3. Fiber loss is per kilometer of fiber.
In each split ratio, what you are dividing is the light power from the incomingnetwork link. The larger percentage of the light power is used for the connectionto the other network device and the smaller portion is the light power for the

Determining the best split ratio for youChapter 6: Attenuation 21
analyzer. As long as there is sufficient light power, all data is still sent to theanalyzer regardless of the split ratio chosen.
Determining your power loss budget is a several step process that requires youto know the send power and receive sensitivities of the devices connected to theTAP, and requires that you do some basic math. Use these equations to determinethe light available in decibels at the analyzer.
1. Determine your power loss budget by subtracting the receive sensitivity ofthe device connected to Link B from the send power of the device connectedto Link A. Get these values from the device manufacturers. The amount of lossthat you can have through attenuation and connector loss must be less thanthis power loss budget.
(Send Device Power) – (Receive Device Sensitivity)=Power LossBudget
These values will be negative numbers, so you will be subtracting a negativenumber from a negative number and its product will be a positive number.
2. Determine the loss caused by attenuation. Use Table 3 for values to assist you.If your cables are less than one kilometer, convert your cable length for theequation.
(Number of Connectors * Connector Loss) + (Fiber Lengthof Link A * Fiber Loss) + (Fiber Length of Link B * FiberLoss)=Attenuation
3. Subtract the output from step 2 from step 1.
Power Loss Budget - Attenuation=Actual Loss
If the actual loss is less than the power loss budget, then your budget isfeasible with your chosen split ratio; however, you must also calculate thepower loss budget for the analyzer from Link A and from Link B. Only if bothpower loss budgets are feasible is the chosen split ratio usable.
4. Determine your maximum insertion loss by subtracting the receive sensitivityof the analyzer from the send power from the device connected to Link A. Getthese values from the device manufacturers. This is the amount of loss thatyou can have through attenuation and connector loss.
(Send Device Power) – (Analyzer Sensitivity)=Power Loss Budget
5. Determine the loss caused by attenuation. See Maximum Insertion Losses forvalues to assist you.
(Number of Connectors * Connector Loss) + (Fiber Length ofLink A * Fiber Loss) + (Fiber Length of Analyzer * FiberLoss)=Attenuation
6. Subtract the output from step 5 from step 4.
Power Loss Budget - Attenuation=Actual Loss
7. Repeat step 4 through step 6 for Link B to the analyzer.
For example, Figure 5 shows cable lengths to the TAP from the networkdevices and from the TAP to the analyzer. Using these cable lengths and someinformation from the device manufacturers, you can determine the power loss.

Determining the best split ratio for you22 Optical nTAP (16 Oct 2015) — Archive/Non-authoritative version
Figure 5: Cable lengths to/from the TAP
The equations here are examples of how to calculate a power loss budget withactual values.
This shows the power loss budget for Link A to Link B. Link A # Link BSend Device Power -9.000
Receive Device Sensitivity --19.5
Power Loss Budget 10.500
Number of Connectors 4.0
Connector Loss 1 x 0.5
Connector Loss 2.0
Fiber Length Link A (8meters)
0.008
Fiber Loss Link A 2 x 3.0
Fiber Loss Link A total +0.024
Fiber Length Link B (40meters)
0.04
Fiber Loss Link B x 3.0
Fiber Loss Link B total +0.120
Attenuation -2.144
Power Loss Budget -
Attenuation 38.356
1. Multimode.2. 850nm multimode.3. Light power available for network. Any network split ratio smaller than this number is feasible solong as the analyzer side is also feasible.
The budget for the network side is 8.356 dB. Any split ratio is valid because 8.356dB is greater than any of the insertion losses from Maximum Insertion Losses.

Determining the best split ratio for youChapter 6: Attenuation 23
Before we can say that any split ratio will work though, we must also check thelight power to the analyzer.
This shows the power loss budget for Link A to the analyzer. Link A > AnalyzerSend Device Power -9.000
Receive Device Sensitivity --17.5
Power Loss Budget 9.000
Number of Connectors 4.0
Connector Loss 1 x 0.5
Connector Loss 2.0
Fiber Length Link A (8meters)
0.008
Fiber Loss Link A 2 x 3.0
Fiber Loss Link A total +0.024
Fiber Length to Analyzer (75meters)
0.075
Fiber Loss Analyzer x 3.0
Fiber Loss Link B total +0.225
Attenuation -2.249
Power Loss Budget -
Attenuation 36.751
1. Multimode.2. 850nm multimode.3. Light power available for the analyzer. Any split ratio smaller than this number is feasible so longas the network side is also feasible.
The budget for the analyzer side is 6.751 dB. The network side allowed us tochoose any split ratio, but the analyzer side presents some limitations. Ourbudget was 9.0 dB, which is greater than our 6.751 dB availability. Since we onlyhave 6.751 dB available, the split ratios we can use are 50/50 and 60/40 afterlooking at Maximum Insertion Losses. All others do not provide enough lightpower to the analyzer.
After completing this task:
Use this page to create your own power loss budget from Link A to Link B if youare considering an Optical TAP with a split ratio other than 50/50. Then use it foryour Link A or Link B to the analyzer, whichever link has the longer fiber length.Use Maximum Insertion Losses to assist you. Network > AnalyzerSend Device Power
Receive Device Sensitivity -
Power Loss Budget
Number of Connectors
Connector Loss x
Connector Loss
Fiber Length Link A (or Link B)
Fiber Loss Link A (or Link B) x

Determining the best split ratio for you24 Optical nTAP (16 Oct 2015) — Archive/Non-authoritative version
Fiber Loss Link A (or Link B)total
+
Fiber Length to Analyzer
Fiber Loss Analyzer x
Fiber Loss Analyzer total +
Attenuation -
Power Loss Budget - Attenuation1
1. Light power available for analyzer. Any split ratio smaller than this number is feasible.
7
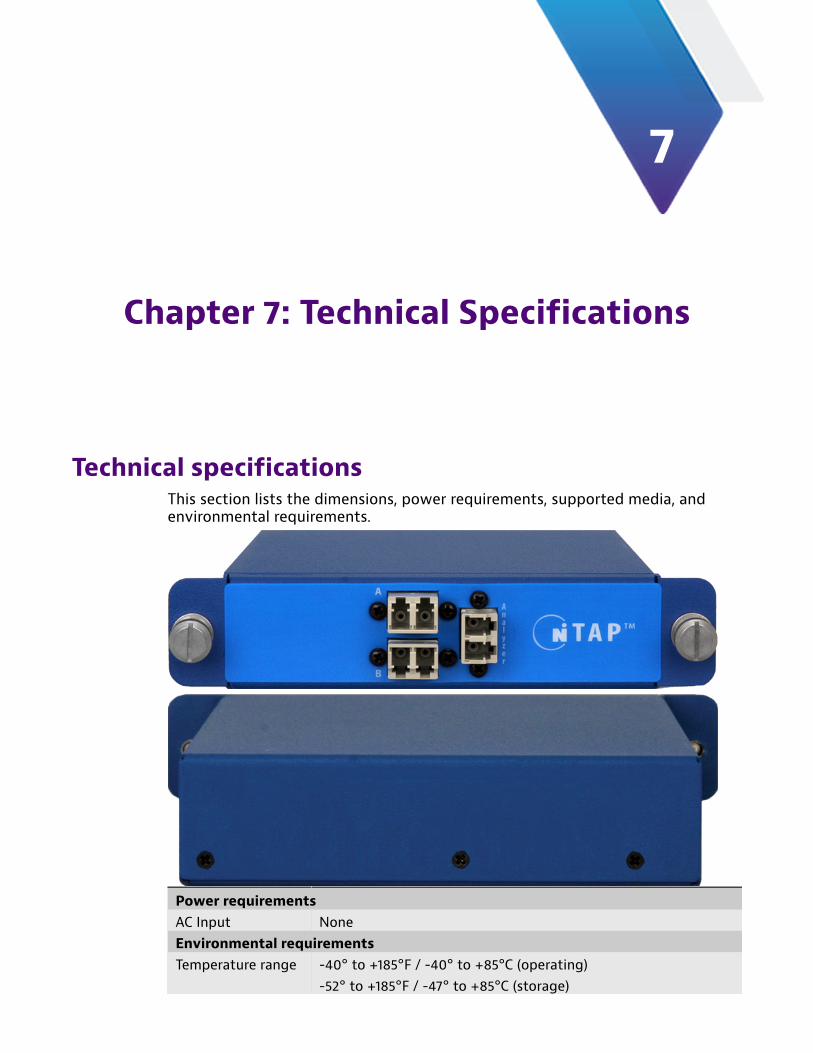
Chapter 7: Technical Specifications
Technical specificationsThis section lists the dimensions, power requirements, supported media, andenvironmental requirements.
Power requirementsAC Input NoneEnvironmental requirementsTemperature range -40° to +185°F / -40° to +85°C (operating)
-52° to +185°F / -47° to +85°C (storage)

Technical specifications26 Optical nTAP (16 Oct 2015) — Archive/Non-authoritative version
Humidity 35-85% (non-condensing)Supported mediaFiber Multimode or Single-Mode
Multimode support for 1 Gb and 10 Gb onlyConnector LCFiber diameter Multimode: 50/125 µm or 62.5/125 µm
Single-mode: 9/125 µmWavelength ranges Multimode: 850 or 1300 nanometers
Single-mode: 1310 or 1550 nanometersWavelength tolerance rangesMultimode850/1300 (Dual-window)
+/- 20 nanometers
Single-mode 1310or 1550 (Dual-window)
+/- 40 nanometers
Insertion losses See Determining the best split ratio for youDimensionsWidth 5.62 in/14.28 cmHeight 1.15 in/2.93 cmLength 7.79 in/19.78 cm; LC connector adds .476 in/1.213 cm

8
Chapter 8: Troubleshooting
What latency does a TAP create?Fully optical TAPs (TAPs with only optical connections and that require no power)do not create any latency or delay.
Not seeing traffic at the analyzer from the TAPIf your TAP is not transmitting to the analyzer as you expect, check the following:
♦ The Link is definitely up and running.♦ The cable connected to the analyzer functions properly. Use a different
cable to confirm this.♦ The Ethernet/SPAN or Fiber channel is not diverted elsewhere.♦ Try swapping the cables between the ports.♦ Use a light meter to verify there is enough light power for any optical
links.♦ If you are using an optical connection from the nTAP to your analyzer,
including a GigaStor, ensure that the receive NIC on the analyzer has auto-negotiation disabled. If auto-negotiation on the NIC is enabled, you willnot be able to see traffic from the nTAP. If this network adapter does nothave the option to disable auto-negotiation, you must obtain a differentnetwork adapter that can—there are no exceptions.
♦ If the system you are monitoring is Linux or UNIX based, you may have anissue with the Maximum Transmission Unit size. The TCP stack in the UNIXsystem uses algorithms to produce an MTU based on response time fromSYN ACK. A small MTU forces a server and client to redo their handshake.Increase the MTU on your server to alleviate this issue.

Can I “team” or bond NICs in my analyzer?28 Optical nTAP (16 Oct 2015) — Archive/Non-authoritative version
Can I “team” or bond NICs in my analyzer?Yes, it is possible with some limitations. Sometimes it is desirable to use twostandard full-duplex capture cards to capture full-duplex TAP output for analysis.Because a standard capture card port has only one receive channel you mustaggregate the receive channels from two ports to see both sides of the two-wayconnection being monitored. Intel’s Advanced Network Services allows you toteam multiple connections at the driver level, presenting your analyzer with anaggregated view of send and receive channels.
Because of the processing overhead and its effect on capture card performance,this method is not recommended for monitoring moderate to highly saturatedlinks, such as those between switches. However, it can be an economicalalternative when monitoring more lightly used connections, such as between aserver and switch.
In addition to the bandwidth limitations, connection teaming is also less accuratewhen timestamping packets, which can cause unexpected results when youranalyzer attempts to display certain charts and statistics such as ConnectionDynamics or VoIP jitter. You also will not be able to tell which side is DCE vs.DTE. In short, if you do not have a dual-receive analysis capture card, it is alwaysbetter to analyze the SPAN or port mirror session through a standard capturecard rather than using the connection teaming method described here.
Note: You need at least one capture card that supports Advanced NetworkServices. If the card has two ports, they can be teamed, otherwise anothercapture card with an unused port must be present.
Figure 6: Capture card teamingThis figure is for illustrative purposes and may not match your product.
1. Configure the IntelPro/1000 Driver Software to Define Teamed Connections.For Ubuntu Linux instructions for port bonding, see the Ubuntudocumentation.
2. Connect the TAP to the analyzer using the appropriate cables.
The TAP is cabled between the devices being monitored normally (i.e., itprovides a pass-through circuit for the link under test). Instead of connectingto a single dual-receive port (as is the preferred deployment), connectthe send lines to the transmit (TX) sides of the two ports you intend to

I am seeing CRC errors on my networkChapter 8: Troubleshooting 29
aggregate. You can team ports on separate cards as long as one of them is anIntelPro card.
3. Open Network Connections by right clicking My Network Places on theWindows Start menu and choosing Properties.
4. Right-click a Monitor Port from an IntelPro/1000 card (which one does notmatter) and choose Properties. Click the Teaming tab.
5. Choose the “Team with other adapters” option and then click New Team... tostart the New Team Wizard. The first dialog lets you name the Team (you maywant to call it something like “Virtual Dual-receive”).
6. Click Next and add another adapter/port that supports teaming (for examplethe second port on a dual-port IntelPro card).
7. Click Next and choose Static Link Aggregation. This option works best foraggregating both sides of a full duplex link for analysis. Click Next, and thenFinish.
The My Network Places display should now list the new virtual adapter.
I am seeing CRC errors on my networkIf you are seeing an uncommonly high number of CRC errors, this could indicatethat there is an issue with the TAP, but it may also indicate that the TAP isfine and there are other problems on your network. Contact Viavi Support forassistance.
VLAN tags not visible at the analyzerAll TAPs pass VLAN tags with the packets. If you are not seeing the VLAN tags atthe analyzer, check the following:
♦ On the switch:
● Confirm that the SPAN was created to pass VLAN tags. SometimesSPANs are created and passing VLAN tags is not enabled.
● Confirm the communication between the switch and the router ispassing the VLAN tags (normally the communication between them isnot a trunk).
♦ On a GigaStor, if you are using one:
● Confirm the Gen2 capture card has been enabled to receive or passVLAN tags.
MemoryFully optical TAPs do not have internal memory or any electronic components andare strictly a pass-through wherein a copy of the data is made. TAPs with anycopper connections have two distinct and separate memory stores.
The two memory stores are non-volatile memory and volatile memory. They arenot connected in any way and no data can move between them. The non-volatilememory provides certain functions that make the device work and cannot bemodified or changed during normal operation of the device. Volatile memoryholds network data as it is copied and passed through the device. Turning off thedevice clears any data in the volatile memory buffer.

Maximum frame size30 Optical nTAP (16 Oct 2015) — Archive/Non-authoritative version
Maximum frame sizeThe maximum frame size allowed through an nTAP is up to 16K; 64K super jumboframes are not supported.

9
Chapter 9: FCC compliance statement
Specification CertificationEmissions FCC Part 15 Class BCE Mark EN61000-3-2, EN55024, EN55022A
This equipment has been tested and found to comply with the limits for a ClassB digital device, pursuant to part 15 of the FCC Rules. These limits are designedto provide reasonable protection against harmful interference in a residentialinstallation. This equipment generates, uses and can radiate radio frequencyenergy and, if not installed and used in accordance with the instructions, maycause harmful interference to radio communications. However, there is noguarantee that interference will not occur in a particular installation. If thisequipment does cause harmful interference to radio or television reception,which can be determined by turning the equipment off and on, the user isencouraged to try to correct the interference by one or more of the followingmeasures:
♦ Reorient or relocate the receiving antenna.♦ Increase the separation between the equipment and receiver.♦ Connect the equipment into an outlet on a circuit different from that to
which the receiver is connected.♦ Consult the dealer or an experienced radio/TV technician for help.

32 Index (16 Oct 2015)
Index
Numerics10/100 network 1040 Gbps optical cables 19
Aadvantages
SPAN 6analyzer 27
auto-negotiation 27dual-receive capture card 6no traffic from TAP 27single-receive capture card 6
attenuation 18managing 19optical cables 19power loss budget 20TAPs 18
auto-negotiation 27, 27analyzer 27
Bbottleneck, SPAN 6buffer 12
Ccable distance 20cable lengths 20cables 20
see also crossover and straight-through cables 20capture card 6choosing NIC, SPAN 28cloning, SPAN 11CRC errors 8, 29
DDCE 28decibels 20DTE 28dual receive analyzer 6dual-receive capture card 6
Ffailover, SPAN 11FCC Compliance Statement 31full-duplex NIC 28full-duplex TAP 6, 13
G
Gen2 capture card 29GigaStor 27, 29
Hhalf-duplex 5half-duplex, SPAN 5
IIntelPro 28
Jjoining 11joining, SPAN 11jumbo frame 30
Llatency 27light meter 27light power 18, 20link loss budget, see power loss budget 20Linux 27, 28LR 19LX 19
Mmaximum frame size 30Maximum Transmission Unit 27mirror port, see SPAN 10MPO 19MTU 27multimode 19, 19, 20
NNIC teaming 28NIC, see single-receive capture card and dual-receive capturecard 6no traffic from TAP 27no traffic from TAP , analyzer 27
Ooptical cables 19optical cables, attenuation 19optical power meter 19Optical TAP 27OSI Layer 1 & 2 errors 5, 6, 12
SPAN 10

Chapter : 33
Ppackets 8patch panels 19port bonding 28power loss budget 20
attenuation 20
RRegulatory Compliance 31repeaters 18, 19risks, SPAN 10runts 8
Ssecurity 5SFP modules 27single-mode 19, 19, 20single-receive capture card 6
analyzer 6SPAN 12
SPAN 6advantages 6as bottleneck 6choosing NIC 28cloning 11failover 11half-duplex 5joining 11pros and cons 8risks 10single-receive capture card 12VLAN tags 29
SPANOSI Layer 1 & 2 errorsOSI Layer 1 & 2 errors 10
split ratios 20SR 19SX 19SYN ACK 27
TTAPs 18TCP stack 27
UUNIX 27
VVLAN tags 29
Wwhen to use, SPAN 8