Embed Size (px)
Citation preview
UNIVERSITY OF LJUBLJANA
FACULTY OF MATHEMATICS AND PHYSICS
PHYSICS DEPARTMENT
Hana Uršič
Optical Holography
Seminar
Adviser: Assistant Professor Irena Drevenšek-Olenik
Ljubljana, December 2004
Abstract
Optical holography is a method for storage and displaying a three-dimensional image ofan object. I describe its historical development, its basic principles and some examples ofits practical application in optical systems.
Contents
1 Introduction 2
2 The development of optical holography 4
3 Recording materials 8
4 Types of holograms 9
5 Volume grating 10
5.1 Volume transmission phase holograms . . . . . . . . . . . . . . . . . . . . . 145.2 Multihologram recording and readout . . . . . . . . . . . . . . . . . . . . . 155.3 Validity of the coupled wave theory . . . . . . . . . . . . . . . . . . . . . . 16
6 Holograms for displays 17
6.1 Holographic stereograms . . . . . . . . . . . . . . . . . . . . . . . . . . . . 176.2 Rainbow holograms . . . . . . . . . . . . . . . . . . . . . . . . . . . . . . . 17
7 Colour holography 19
8 Applications 20
8.1 Applications of holography in technology . . . . . . . . . . . . . . . . . . . 20
9 Conclusion 21
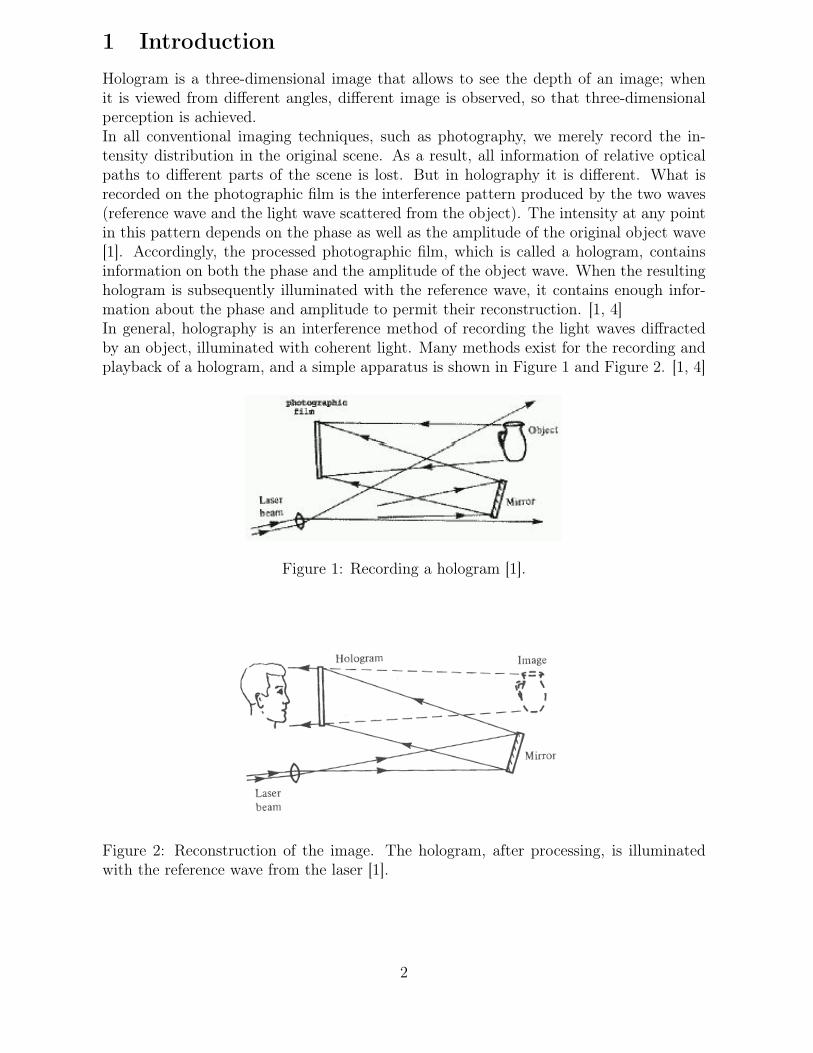
1 Introduction
Hologram is a three-dimensional image that allows to see the depth of an image; whenit is viewed from different angles, different image is observed, so that three-dimensionalperception is achieved.In all conventional imaging techniques, such as photography, we merely record the in-tensity distribution in the original scene. As a result, all information of relative opticalpaths to different parts of the scene is lost. But in holography it is different. What isrecorded on the photographic film is the interference pattern produced by the two waves(reference wave and the light wave scattered from the object). The intensity at any pointin this pattern depends on the phase as well as the amplitude of the original object wave[1]. Accordingly, the processed photographic film, which is called a hologram, containsinformation on both the phase and the amplitude of the object wave. When the resultinghologram is subsequently illuminated with the reference wave, it contains enough infor-mation about the phase and amplitude to permit their reconstruction. [1, 4]In general, holography is an interference method of recording the light waves diffractedby an object, illuminated with coherent light. Many methods exist for the recording andplayback of a hologram, and a simple apparatus is shown in Figure 1 and Figure 2. [1, 4]
Figure 1: Recording a hologram [1].
Figure 2: Reconstruction of the image. The hologram, after processing, is illuminatedwith the reference wave from the laser [1].
2
The electric field E of a linearly polarized monochromatic light wave propagating ina vacuum in z direction can be represented by the relation
E = acos[2πν(t −z
c)], (1)
where a is the amplitude, ν the frequency, and c the speed of propagation of light. Equa-tion (1) can also be written in the form
E = Re[ae[i2πν(t− z
c)]] = Re[ae−iΦei2πνt], (2)
where Φ = 2πνzc
= 2πzλ
. If we assume that all operations on E are linear, we can use thecomplex representation
E = ae−iΦei2πνt = Aei2πνt, (3)
where A is the complex amplitude. The optical intensity I at a point is given by
I = AA∗ = |A|2. (4)
Accordingly, the intensity at any point due to the interference of two waves is
I = |A1 + A2|2 = |A1|
2 + |A2|2 + A1A
∗
2 + A∗
1A2 = I1 + I2 + 2(I1I2)1/2cos(Φ1 − Φ2). (5)
The contrast of the interference pattern at any point in the hologram plane is measuredby the visibility, which is given by the relation
ν =(Imax − Imin)
(Imax + Imin), (6)
where Imax and Imin are the local maximum and minimum values of the intensity. Inorder to obtain maximum fringe visibility, it is essential to use coherent illumination.Lasers provide an intense source of highly coherent light and therefore are used almostuniversally in optical holography. The most commonly used are gas lasers. [1] The gaslasers are in general cheaper and easier to operate. The diode lasers are cheap, too. Butthe gas lasers have better coherence.
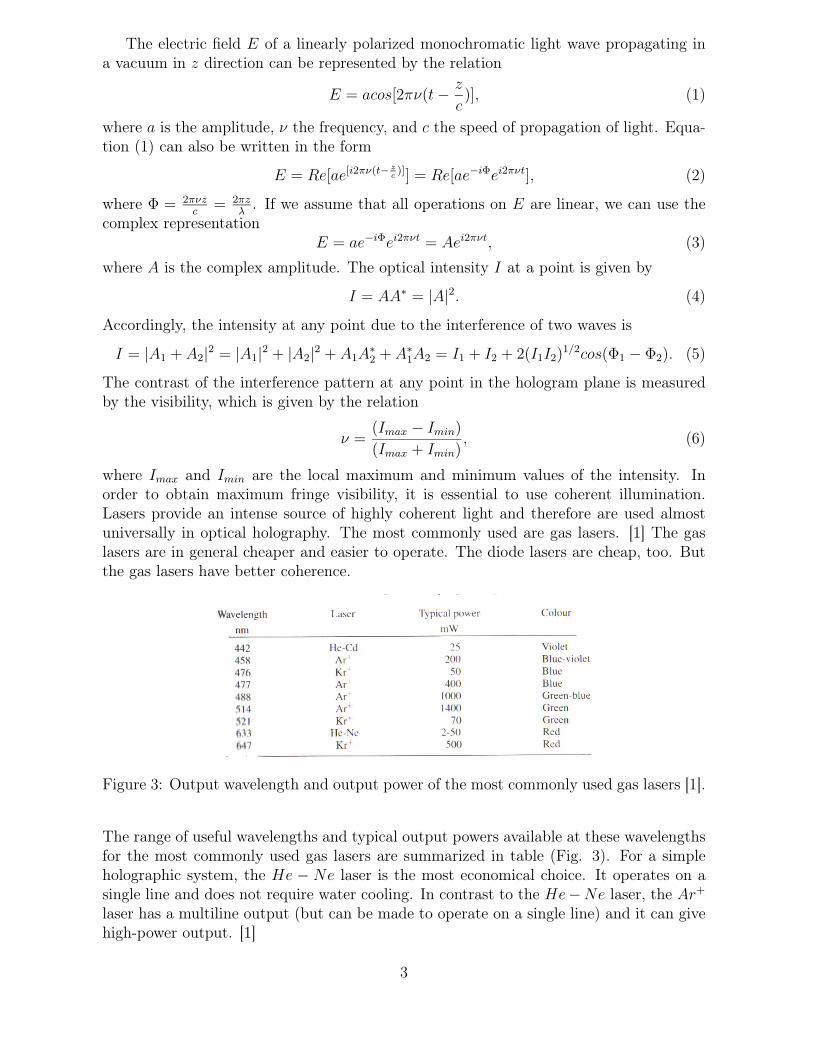
Figure 3: Output wavelength and output power of the most commonly used gas lasers [1].
The range of useful wavelengths and typical output powers available at these wavelengthsfor the most commonly used gas lasers are summarized in table (Fig. 3). For a simpleholographic system, the He − Ne laser is the most economical choice. It operates on asingle line and does not require water cooling. In contrast to the He−Ne laser, the Ar+
laser has a multiline output (but can be made to operate on a single line) and it can givehigh-power output. [1]
3
2 The development of optical holography
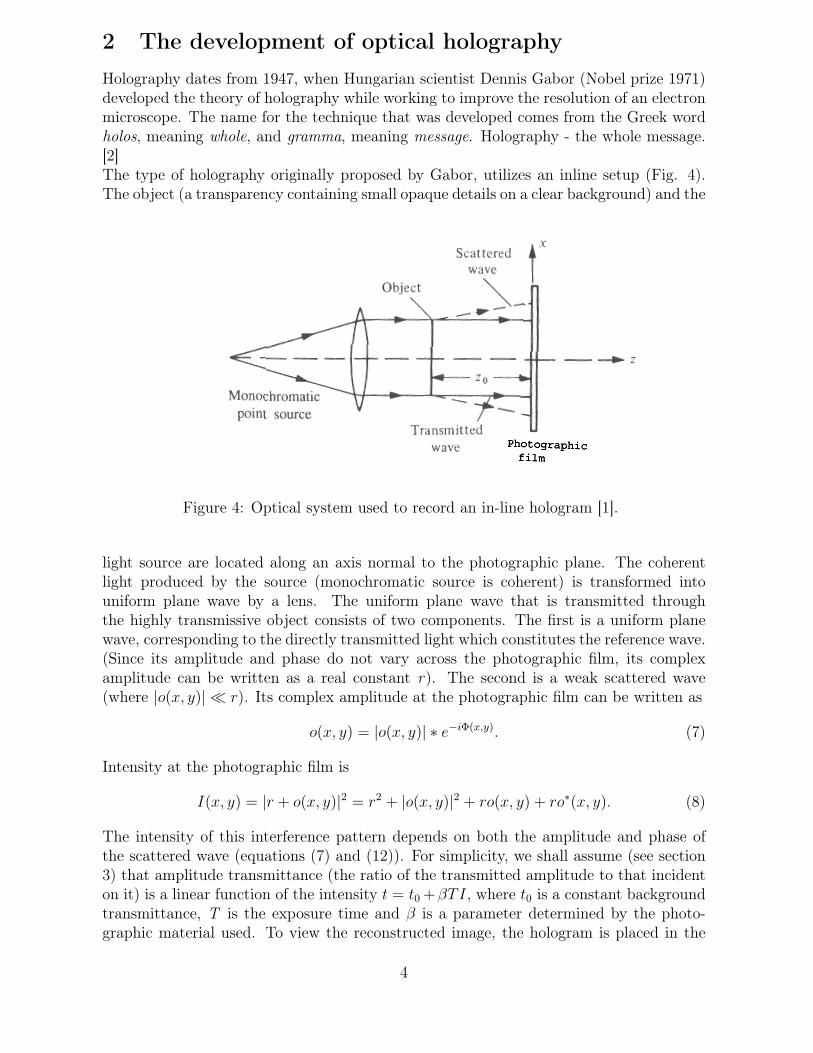
Holography dates from 1947, when Hungarian scientist Dennis Gabor (Nobel prize 1971)developed the theory of holography while working to improve the resolution of an electronmicroscope. The name for the technique that was developed comes from the Greek wordholos, meaning whole, and gramma, meaning message. Holography - the whole message.[2]The type of holography originally proposed by Gabor, utilizes an inline setup (Fig. 4).The object (a transparency containing small opaque details on a clear background) and the
Figure 4: Optical system used to record an in-line hologram [1].
light source are located along an axis normal to the photographic plane. The coherentlight produced by the source (monochromatic source is coherent) is transformed intouniform plane wave by a lens. The uniform plane wave that is transmitted throughthe highly transmissive object consists of two components. The first is a uniform planewave, corresponding to the directly transmitted light which constitutes the reference wave.(Since its amplitude and phase do not vary across the photographic film, its complexamplitude can be written as a real constant r). The second is a weak scattered wave(where |o(x, y)| ≪ r). Its complex amplitude at the photographic film can be written as
o(x, y) = |o(x, y)| ∗ e−iΦ(x,y). (7)
Intensity at the photographic film is
I(x, y) = |r + o(x, y)|2 = r2 + |o(x, y)|2 + ro(x, y) + ro∗(x, y). (8)
The intensity of this interference pattern depends on both the amplitude and phase ofthe scattered wave (equations (7) and (12)). For simplicity, we shall assume (see section3) that amplitude transmittance (the ratio of the transmitted amplitude to that incidenton it) is a linear function of the intensity t = t0 +βTI, where t0 is a constant backgroundtransmittance, T is the exposure time and β is a parameter determined by the photo-graphic material used. To view the reconstructed image, the hologram is placed in the
4
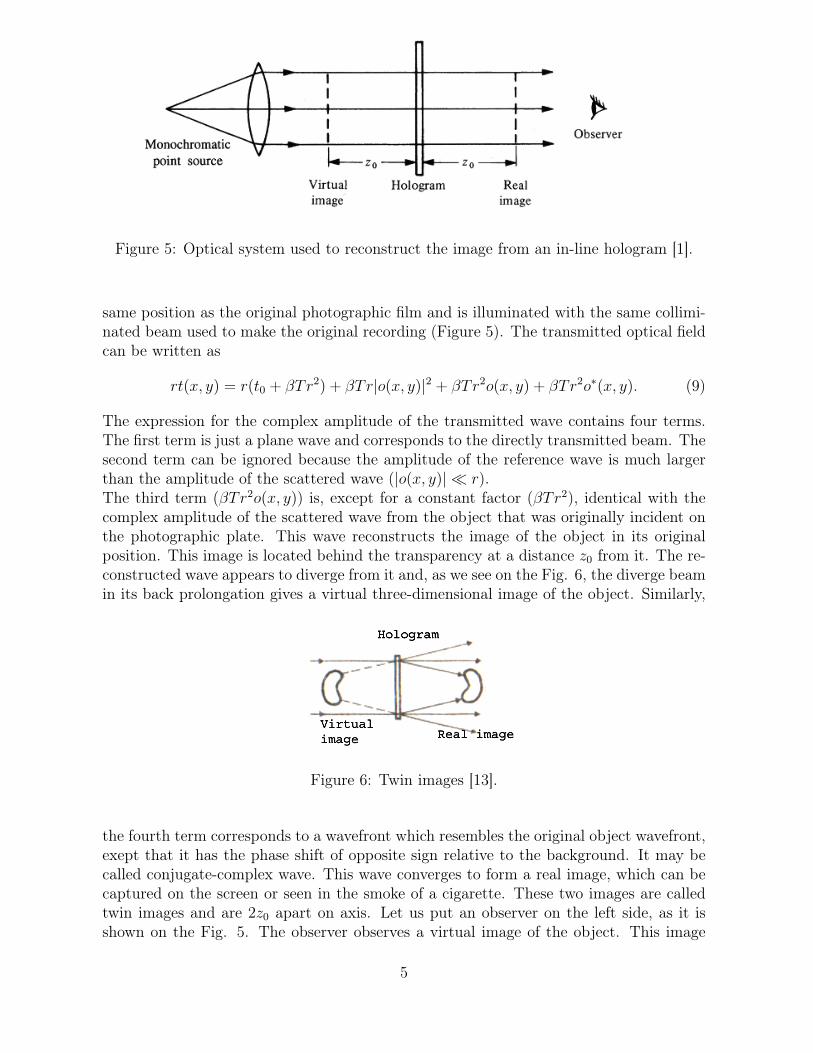
Figure 5: Optical system used to reconstruct the image from an in-line hologram [1].
same position as the original photographic film and is illuminated with the same collimi-nated beam used to make the original recording (Figure 5). The transmitted optical fieldcan be written as
rt(x, y) = r(t0 + βTr2) + βTr|o(x, y)|2 + βTr2o(x, y) + βTr2o∗(x, y). (9)
The expression for the complex amplitude of the transmitted wave contains four terms.The first term is just a plane wave and corresponds to the directly transmitted beam. Thesecond term can be ignored because the amplitude of the reference wave is much largerthan the amplitude of the scattered wave (|o(x, y)| ≪ r).The third term (βTr2o(x, y)) is, except for a constant factor (βTr2), identical with thecomplex amplitude of the scattered wave from the object that was originally incident onthe photographic plate. This wave reconstructs the image of the object in its originalposition. This image is located behind the transparency at a distance z0 from it. The re-constructed wave appears to diverge from it and, as we see on the Fig. 6, the diverge beamin its back prolongation gives a virtual three-dimensional image of the object. Similarly,
Figure 6: Twin images [13].
the fourth term corresponds to a wavefront which resembles the original object wavefront,exept that it has the phase shift of opposite sign relative to the background. It may becalled conjugate-complex wave. This wave converges to form a real image, which can becaptured on the screen or seen in the smoke of a cigarette. These two images are calledtwin images and are 2z0 apart on axis. Let us put an observer on the left side, as it isshown on the Fig. 5. The observer observes a virtual image of the object. This image
5
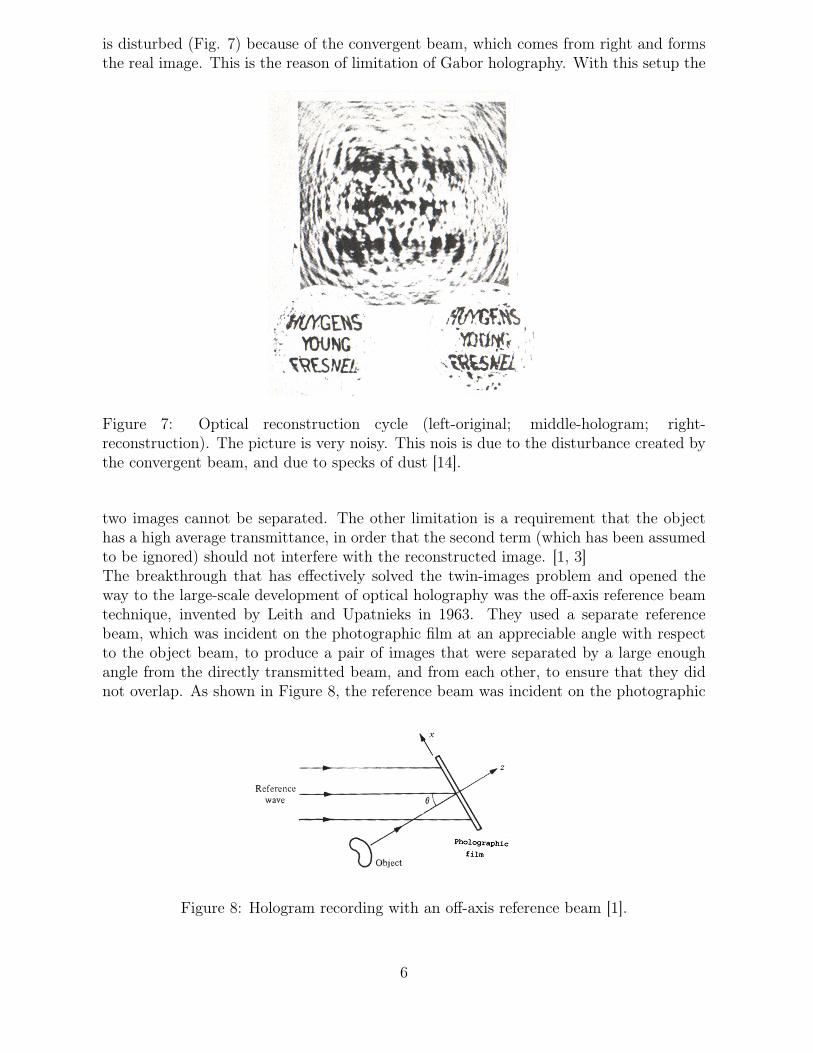
is disturbed (Fig. 7) because of the convergent beam, which comes from right and formsthe real image. This is the reason of limitation of Gabor holography. With this setup the
Figure 7: Optical reconstruction cycle (left-original; middle-hologram; right-reconstruction). The picture is very noisy. This nois is due to the disturbance created bythe convergent beam, and due to specks of dust [14].
two images cannot be separated. The other limitation is a requirement that the objecthas a high average transmittance, in order that the second term (which has been assumedto be ignored) should not interfere with the reconstructed image. [1, 3]The breakthrough that has effectively solved the twin-images problem and opened theway to the large-scale development of optical holography was the off-axis reference beamtechnique, invented by Leith and Upatnieks in 1963. They used a separate referencebeam, which was incident on the photographic film at an appreciable angle with respectto the object beam, to produce a pair of images that were separated by a large enoughangle from the directly transmitted beam, and from each other, to ensure that they didnot overlap. As shown in Figure 8, the reference beam was incident on the photographic
Figure 8: Hologram recording with an off-axis reference beam [1].
6
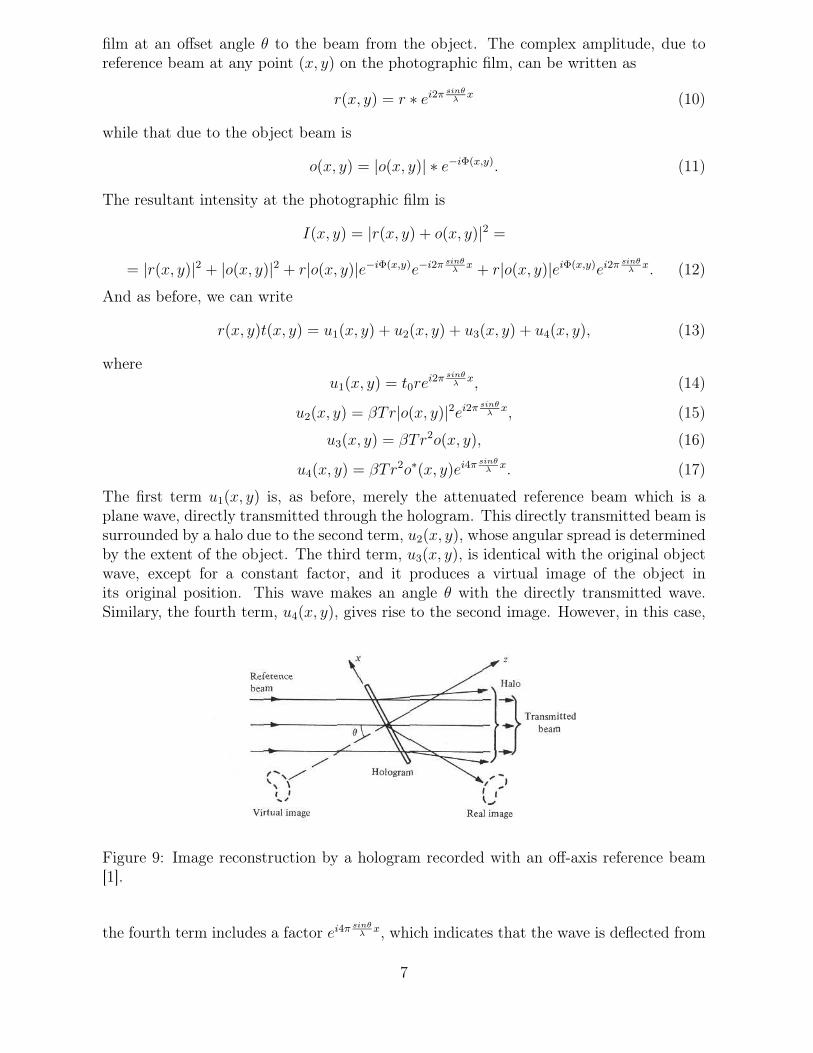
film at an offset angle θ to the beam from the object. The complex amplitude, due toreference beam at any point (x, y) on the photographic film, can be written as
r(x, y) = r ∗ ei2π sinθ
λx (10)
while that due to the object beam is
o(x, y) = |o(x, y)| ∗ e−iΦ(x,y). (11)
The resultant intensity at the photographic film is
I(x, y) = |r(x, y) + o(x, y)|2 =
= |r(x, y)|2 + |o(x, y)|2 + r|o(x, y)|e−iΦ(x,y)e−i2π sinθ
λx + r|o(x, y)|eiΦ(x,y)ei2π sinθ
λx. (12)
And as before, we can write
r(x, y)t(x, y) = u1(x, y) + u2(x, y) + u3(x, y) + u4(x, y), (13)
whereu1(x, y) = t0re
i2π sinθ
λx, (14)
u2(x, y) = βTr|o(x, y)|2ei2π sinθ
λx, (15)
u3(x, y) = βTr2o(x, y), (16)
u4(x, y) = βTr2o∗(x, y)ei4π sinθ
λx. (17)
The first term u1(x, y) is, as before, merely the attenuated reference beam which is aplane wave, directly transmitted through the hologram. This directly transmitted beam issurrounded by a halo due to the second term, u2(x, y), whose angular spread is determinedby the extent of the object. The third term, u3(x, y), is identical with the original objectwave, except for a constant factor, and it produces a virtual image of the object inits original position. This wave makes an angle θ with the directly transmitted wave.Similary, the fourth term, u4(x, y), gives rise to the second image. However, in this case,
Figure 9: Image reconstruction by a hologram recorded with an off-axis reference beam[1].
the fourth term includes a factor ei4π sinθ
λx, which indicates that the wave is deflected from
7
the z axis at an angle approximately twice that which the reference wave makes with it.In 1960 the pulsed-ruby laser was developed. This laser system emits very powerful bursof light that last only a few nanoseconds. It effectively freezes movement and makespossible to produce holograms of high-speed events, such as a bullet in flight. The rubylaser is still widely used laser for optical holography mainly because of the large outputenergy avaliable (up to 10J per pulse) and the wavelenght of the light emitted (694nm),which is fairly well matched to the peak sensitivity of commercial photographic materialsfor holography. [1, 9]A major advance in display holography occurred in 1968 when Dr. S. Benton invented therainbow hologram. This type of hologram can be viewed in ordinary white light creating abright, sharp, monochromatic image (see section 6). Another significant area of progresshas been in recording materials. [1]
3 Recording materials
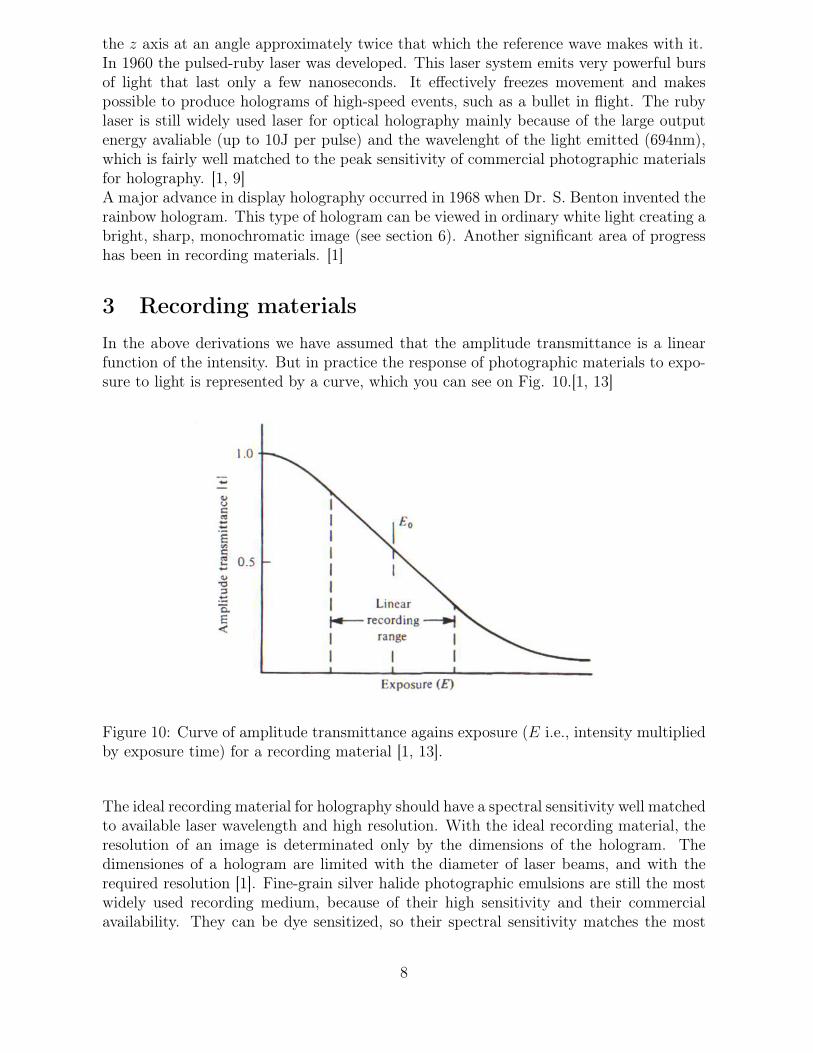
In the above derivations we have assumed that the amplitude transmittance is a linearfunction of the intensity. But in practice the response of photographic materials to expo-sure to light is represented by a curve, which you can see on Fig. 10.[1, 13]
Figure 10: Curve of amplitude transmittance agains exposure (E i.e., intensity multipliedby exposure time) for a recording material [1, 13].
The ideal recording material for holography should have a spectral sensitivity well matchedto available laser wavelength and high resolution. With the ideal recording material, theresolution of an image is determinated only by the dimensions of the hologram. Thedimensiones of a hologram are limited with the diameter of laser beams, and with therequired resolution [1]. Fine-grain silver halide photographic emulsions are still the mostwidely used recording medium, because of their high sensitivity and their commercialavailability. They can be dye sensitized, so their spectral sensitivity matches the most
8
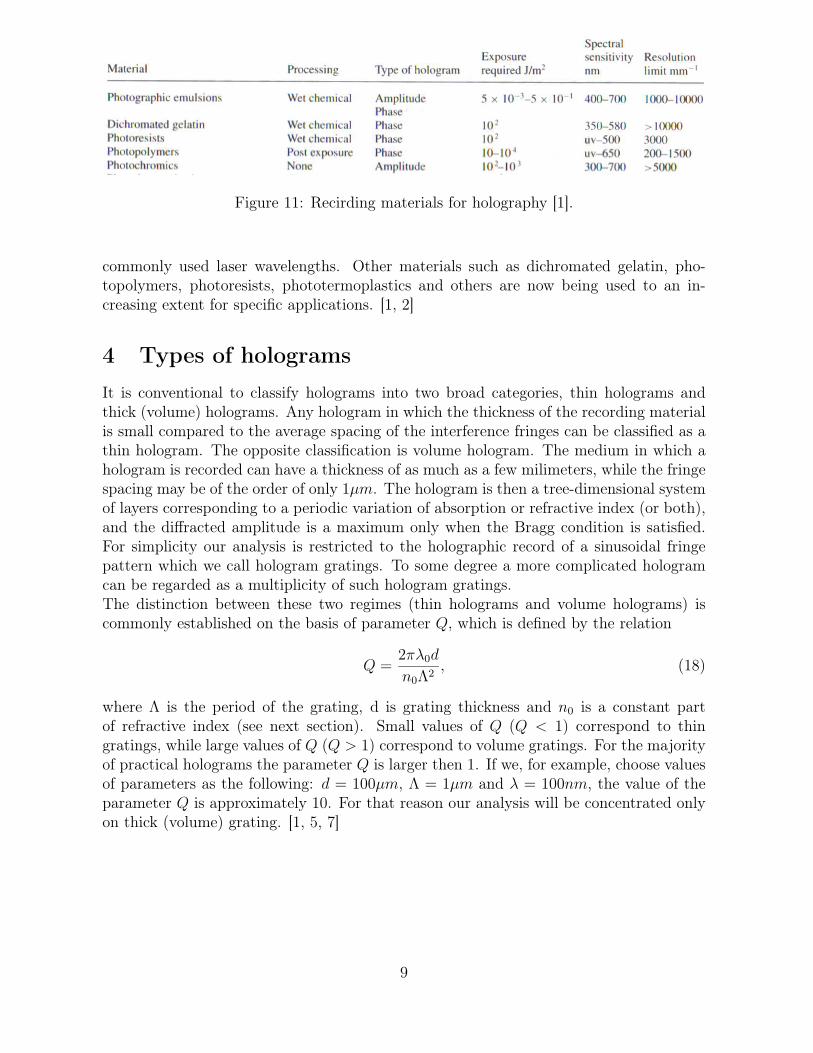
Figure 11: Recirding materials for holography [1].
commonly used laser wavelengths. Other materials such as dichromated gelatin, pho-topolymers, photoresists, phototermoplastics and others are now being used to an in-creasing extent for specific applications. [1, 2]
4 Types of holograms
It is conventional to classify holograms into two broad categories, thin holograms andthick (volume) holograms. Any hologram in which the thickness of the recording materialis small compared to the average spacing of the interference fringes can be classified as athin hologram. The opposite classification is volume hologram. The medium in which ahologram is recorded can have a thickness of as much as a few milimeters, while the fringespacing may be of the order of only 1µm. The hologram is then a tree-dimensional systemof layers corresponding to a periodic variation of absorption or refractive index (or both),and the diffracted amplitude is a maximum only when the Bragg condition is satisfied.For simplicity our analysis is restricted to the holographic record of a sinusoidal fringepattern which we call hologram gratings. To some degree a more complicated hologramcan be regarded as a multiplicity of such hologram gratings.The distinction between these two regimes (thin holograms and volume holograms) iscommonly established on the basis of parameter Q, which is defined by the relation
Q =2πλ0d
n0Λ2, (18)
where Λ is the period of the grating, d is grating thickness and n0 is a constant partof refractive index (see next section). Small values of Q (Q < 1) correspond to thingratings, while large values of Q (Q > 1) correspond to volume gratings. For the majorityof practical holograms the parameter Q is larger then 1. If we, for example, choose valuesof parameters as the following: d = 100µm, Λ = 1µm and λ = 100nm, the value of theparameter Q is approximately 10. For that reason our analysis will be concentrated onlyon thick (volume) grating. [1, 5, 7]
9
5 Volume grating
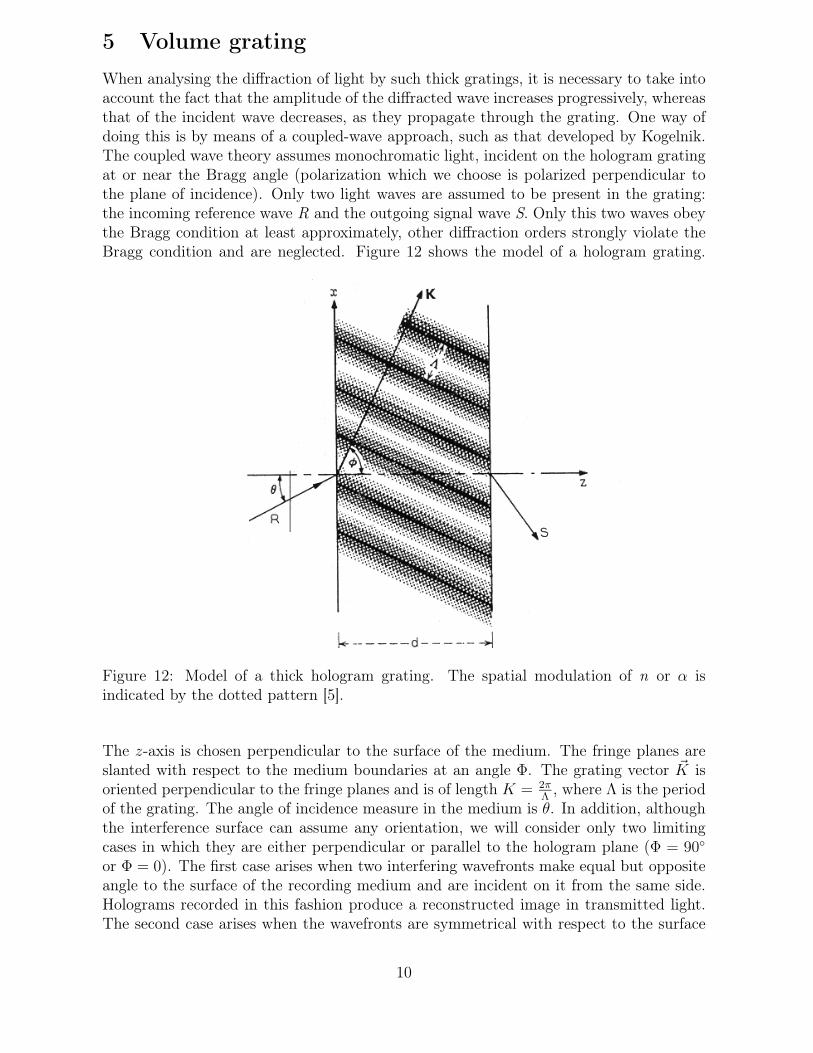
When analysing the diffraction of light by such thick gratings, it is necessary to take intoaccount the fact that the amplitude of the diffracted wave increases progressively, whereasthat of the incident wave decreases, as they propagate through the grating. One way ofdoing this is by means of a coupled-wave approach, such as that developed by Kogelnik.The coupled wave theory assumes monochromatic light, incident on the hologram gratingat or near the Bragg angle (polarization which we choose is polarized perpendicular tothe plane of incidence). Only two light waves are assumed to be present in the grating:the incoming reference wave R and the outgoing signal wave S. Only this two waves obeythe Bragg condition at least approximately, other diffraction orders strongly violate theBragg condition and are neglected. Figure 12 shows the model of a hologram grating.
Figure 12: Model of a thick hologram grating. The spatial modulation of n or α isindicated by the dotted pattern [5].
The z-axis is chosen perpendicular to the surface of the medium. The fringe planes areslanted with respect to the medium boundaries at an angle Φ. The grating vector ~K isoriented perpendicular to the fringe planes and is of length K = 2π
Λ, where Λ is the period
of the grating. The angle of incidence measure in the medium is θ. In addition, althoughthe interference surface can assume any orientation, we will consider only two limitingcases in which they are either perpendicular or parallel to the hologram plane (Φ = 90◦
or Φ = 0). The first case arises when two interfering wavefronts make equal but oppositeangle to the surface of the recording medium and are incident on it from the same side.Holograms recorded in this fashion produce a reconstructed image in transmitted light.The second case arises when the wavefronts are symmetrical with respect to the surface
10
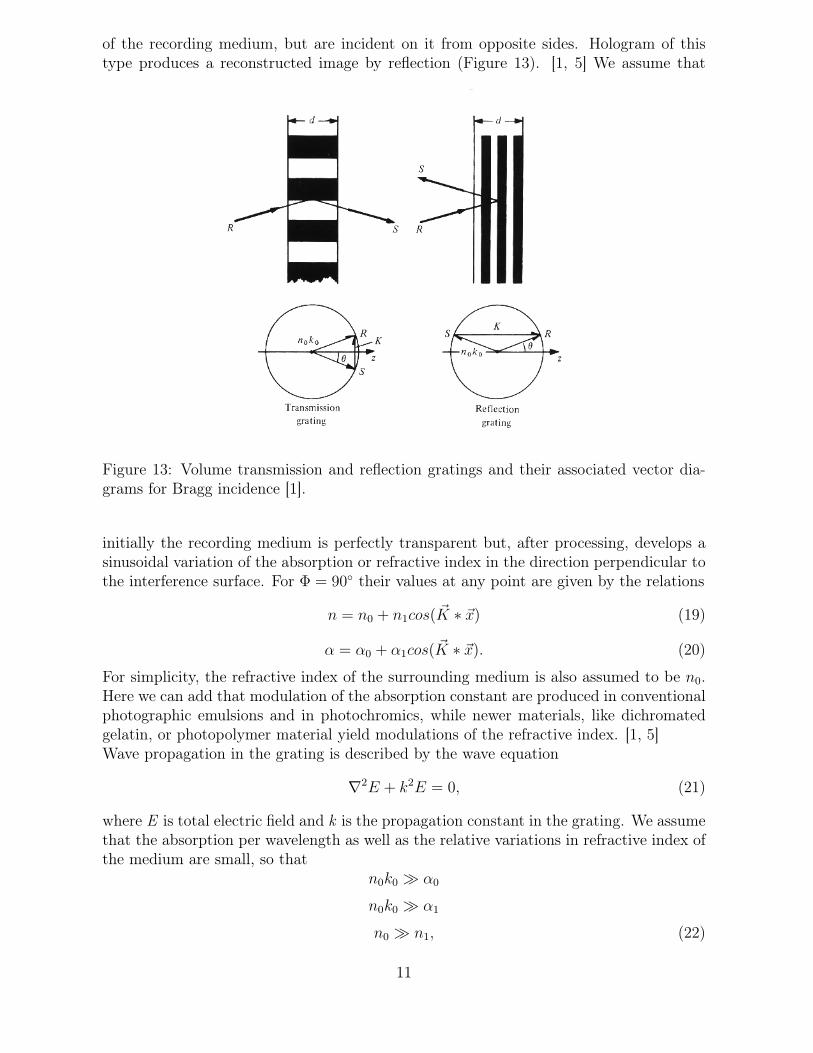
of the recording medium, but are incident on it from opposite sides. Hologram of thistype produces a reconstructed image by reflection (Figure 13). [1, 5] We assume that
Figure 13: Volume transmission and reflection gratings and their associated vector dia-grams for Bragg incidence [1].
initially the recording medium is perfectly transparent but, after processing, develops asinusoidal variation of the absorption or refractive index in the direction perpendicular tothe interference surface. For Φ = 90◦ their values at any point are given by the relations
n = n0 + n1cos( ~K ∗ ~x) (19)
α = α0 + α1cos( ~K ∗ ~x). (20)
For simplicity, the refractive index of the surrounding medium is also assumed to be n0.Here we can add that modulation of the absorption constant are produced in conventionalphotographic emulsions and in photochromics, while newer materials, like dichromatedgelatin, or photopolymer material yield modulations of the refractive index. [1, 5]Wave propagation in the grating is described by the wave equation
∇2E + k2E = 0, (21)
where E is total electric field and k is the propagation constant in the grating. We assumethat the absorption per wavelength as well as the relative variations in refractive index ofthe medium are small, so that
n0k0 ≫ α0
n0k0 ≫ α1
n0 ≫ n1, (22)
11
where k0 = 2πλ
. The propagation constant can then be written in the form
k2 = B2 − 2iα0B + 4κBcos( ~K ∗ ~x) (23)
where B = n0k0 is the average propagation constant, and κ is the coupling constantdefined as
κ = (πn1
λ) −
iα1
2. (24)
This coupling constant describes the interaction between the reference wave R and thesignal wave S. If κ = 0, there is no modulation of the refractive index or the absorptionand, hence, no diffraction. [1, 5]The propagation of the two coupled waves through the grating can be described by theircomplex amplitudes R(z) and S(z), which vary along z as a result of the energy interchangebetween them as well as energy losses due to absorption. The total electric field E in thegrating is then the sum of the fields due to these two waves, so that
E = R(z)e−i~ρ∗~x + S(z)e−i~σ∗~x, (25)
where ~ρ and ~σ are the propagation vectors for the two waves, defined by the propagationconstants and the directions of propagation of R and S. The quantity ~ρ is assumed to beequal to the propagation vector of the free reference wave in the absence of coupling ,while ~σ is determined by the grating and is related to ~ρ and the grating vector ~K by theexpression
~σ = ~ρ − ~K. (26)
For the special case of incidence at the Bragg angle θ0, the lengths of both ~ρ and ~σ areequal to the propagation constant n0k0, and the Bragg condition, which can be writtenin the form
cos(Φ − θ0) =K
2n0k0
, (27)
is obeyed. If (27) is differentiated, we obtain the result
dθ0
dλ0
=K
4πn0sin(Φ − θ0)(28)
To derive the couple wave equations, (21) and (23) are combined, and (25) and (26) areinserted. We get
R′′
− 2iR′
ρz − 2iα0BR + 2κBS = 0 (29)
andS
′′
− 2iS′
σz − 2iα0BS + (B2 − |~σ|2)S + 2κBR = 0, (30)
where the prime denote differentiation with respect to z. If, in addition, we assume thatthe energy interchange between S and R, as well as the energy absorption in the mediumare slow, the second differentials R
′′
and S′′
can be neglected. Equations (29) and (30)can be rewritten in the form
R′
cos(θ) + α0R = iκS (31)
and[cos(θ) − (K/B)cosΦ]S
′
+ (α0 + iξ)S = iκR, (32)
12
where ξ is determinate as
ξ =(B2 − |σ|2)
2B, (33)
ξ = Kcos(Φ − θ) − K2λ/4πn0. (34)
For small deviations ∆θ and ∆λ from the Bragg condition, equation (34) becomes
ξ = ∆θKsin(Φ − θ0) − ∆λK2/4πn0. (35)
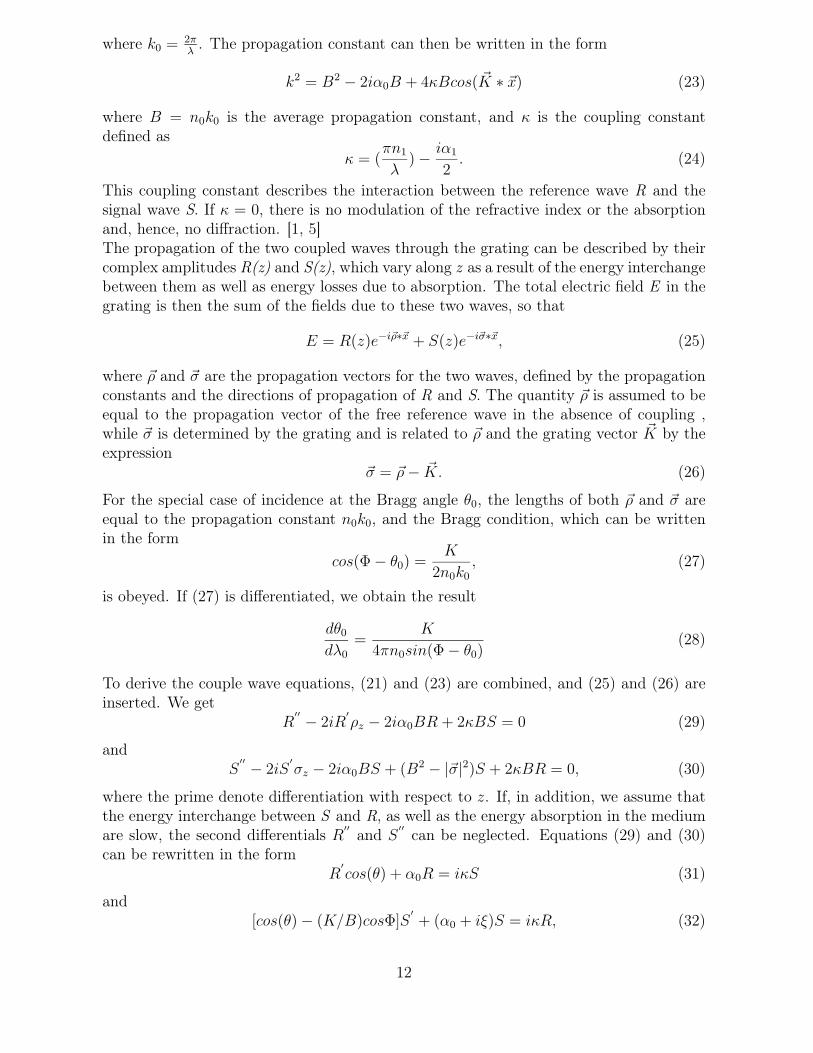
The coupled wave equations (31) and (32) show that the amplitude of a wave changealong z because of coupling to the other wave (κR, κS) or absorption (α0R,α0S).The coupled wave equations can be solved for the appropriate boundery conditions. Forboth holograms types the reference wave R is assumed to start with unit amplitude atz=0. It decays as it propagates to the right and couples energy into S. In transmissionholograms the signal S starts with zero amplitude at z=0 and propagates to the right.In reflection holograms the signal travels to the left and it starts with zero amplitude atz=d. Boundary conditions are R(0)=1, S(0)=0, for transmission grating, and R(0)=1,S(d)=0, for reflection gratings. [1, 5]
Figure 14: Wave propagation in (a) transmission and (b) reflection holograms [5].
Based on these characteristics, holograms recorded in relatively thick recording mediacan be classified either as transmission amplitude holograms (n1 = 0), transmission phaseholograms (α0 = α1 = 0), reflection amplitude holograms (n1 = 0), or reflection phaseholograms (α0 = α1 = 0). Let us concentrate to the solutions of volume transmissionphase holograms, and look at their characteristics. [1, 5]
13
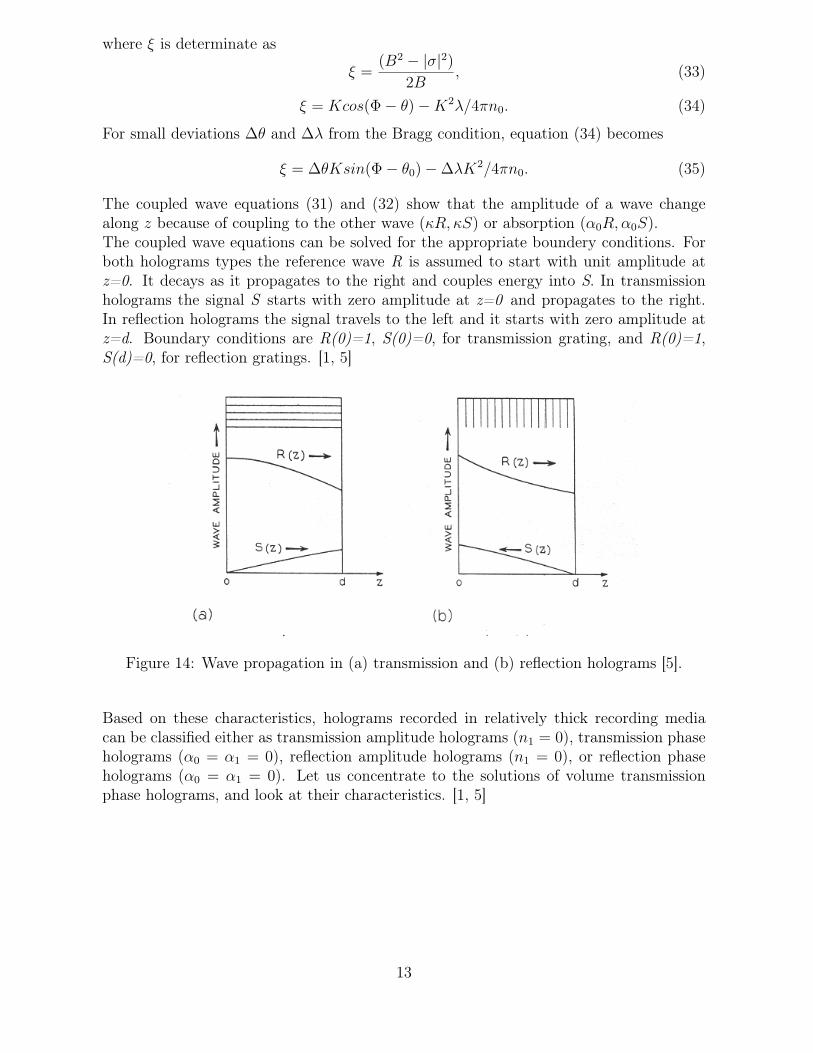
Figure 15: A cross section of a thick-phase hologram. The fringes in this photopolymerare voids separated by polymer [12].
5.1 Volume transmission phase holograms
In a phase grating α0 = α1 = 0. Diffraction is caused by the spatial variation of therefractive index. The diffracted amplitude is then
S(d) =−ie−iχsin(ν2 + χ2)1/2
(1 + χ2
ν2 )1/2, (36)
where
ν =πn1d
λcos(θ), (37)
and
χ =ξd
2cos(θ). (38)
Diffraction efficiency can be defined as the ratio of the energy diffracted into the imageby an element of the hologram to that incident on it from the source used to illuminateit. Since the incident amplitude R(0) is assumed to be unity, the diffraction efficiency is
η = |S(d)|2 =sin2(ν2 + χ2)1/2
(1 + χ2
ν2 ). (39)
The effect of deviation ∆θ and ∆λ from the Bragg condition can be determined, since theyinfluence the diffraction efficiency mainly through the parameter χ, which is a measureof the deviation from the Bragg condition. From equation (34) it can be rewritten in theform
χ = ∆θKd/2, (40)
while the modulation parameter ν can be taken as constant. As either d, the thickness, or
14
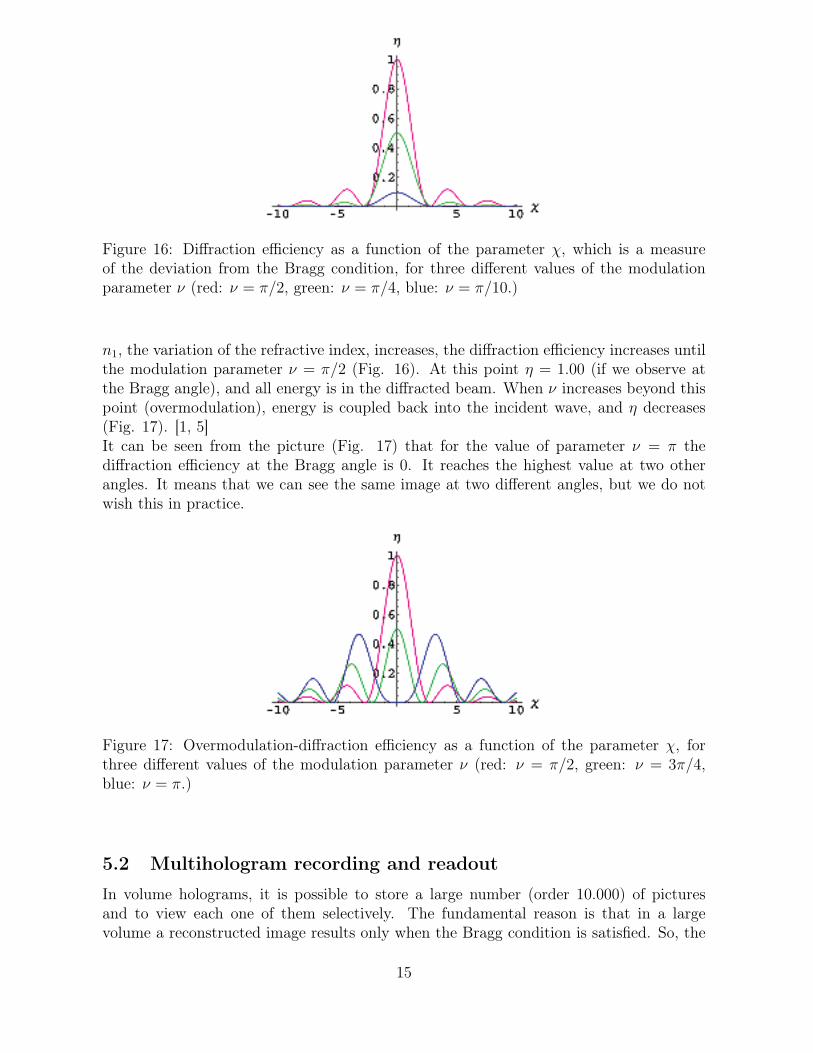
Figure 16: Diffraction efficiency as a function of the parameter χ, which is a measureof the deviation from the Bragg condition, for three different values of the modulationparameter ν (red: ν = π/2, green: ν = π/4, blue: ν = π/10.)
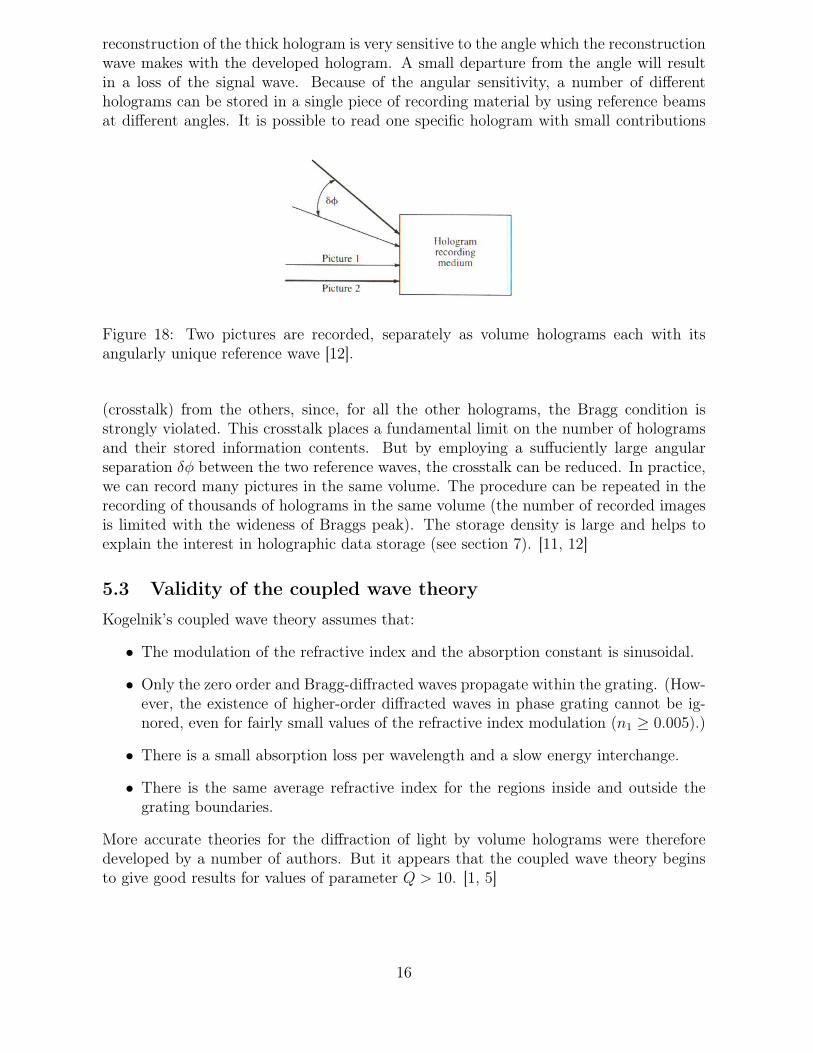
n1, the variation of the refractive index, increases, the diffraction efficiency increases untilthe modulation parameter ν = π/2 (Fig. 16). At this point η = 1.00 (if we observe atthe Bragg angle), and all energy is in the diffracted beam. When ν increases beyond thispoint (overmodulation), energy is coupled back into the incident wave, and η decreases(Fig. 17). [1, 5]It can be seen from the picture (Fig. 17) that for the value of parameter ν = π thediffraction efficiency at the Bragg angle is 0. It reaches the highest value at two otherangles. It means that we can see the same image at two different angles, but we do notwish this in practice.
Figure 17: Overmodulation-diffraction efficiency as a function of the parameter χ, forthree different values of the modulation parameter ν (red: ν = π/2, green: ν = 3π/4,blue: ν = π.)
5.2 Multihologram recording and readout
In volume holograms, it is possible to store a large number (order 10.000) of picturesand to view each one of them selectively. The fundamental reason is that in a largevolume a reconstructed image results only when the Bragg condition is satisfied. So, the
15
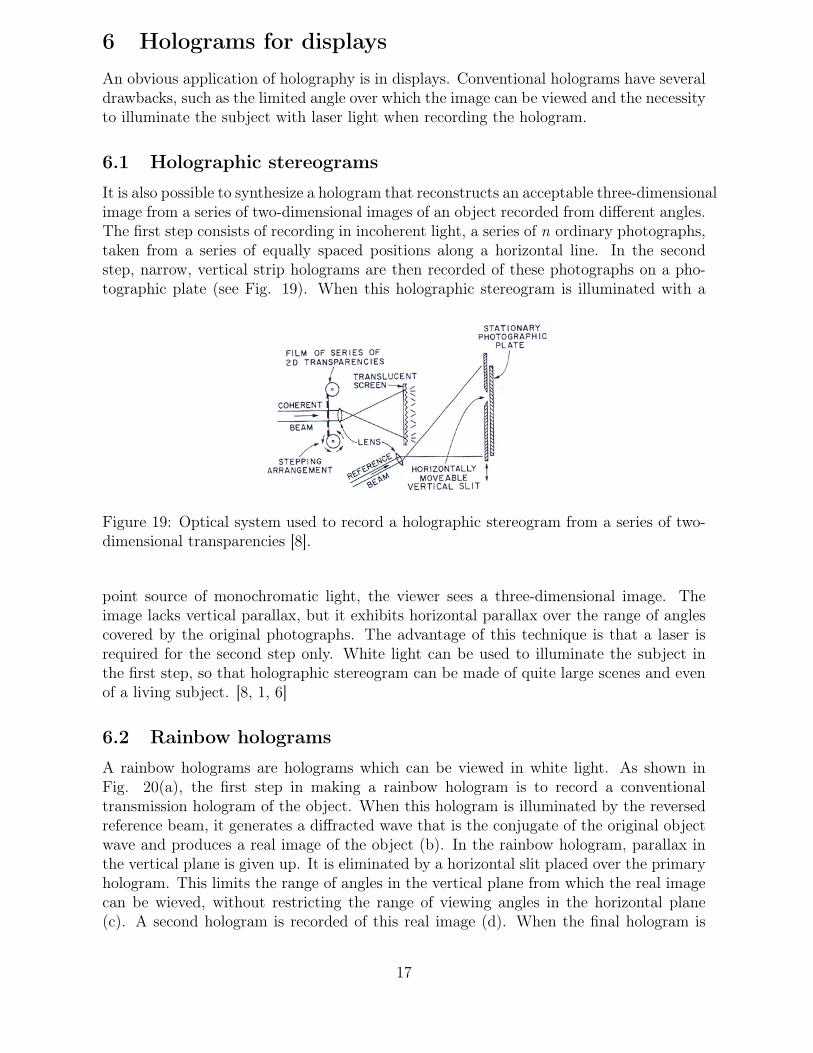
reconstruction of the thick hologram is very sensitive to the angle which the reconstructionwave makes with the developed hologram. A small departure from the angle will resultin a loss of the signal wave. Because of the angular sensitivity, a number of differentholograms can be stored in a single piece of recording material by using reference beamsat different angles. It is possible to read one specific hologram with small contributions
Figure 18: Two pictures are recorded, separately as volume holograms each with itsangularly unique reference wave [12].
(crosstalk) from the others, since, for all the other holograms, the Bragg condition isstrongly violated. This crosstalk places a fundamental limit on the number of hologramsand their stored information contents. But by employing a suffuciently large angularseparation δφ between the two reference waves, the crosstalk can be reduced. In practice,we can record many pictures in the same volume. The procedure can be repeated in therecording of thousands of holograms in the same volume (the number of recorded imagesis limited with the wideness of Braggs peak). The storage density is large and helps toexplain the interest in holographic data storage (see section 7). [11, 12]
5.3 Validity of the coupled wave theory
Kogelnik’s coupled wave theory assumes that:
• The modulation of the refractive index and the absorption constant is sinusoidal.
• Only the zero order and Bragg-diffracted waves propagate within the grating. (How-ever, the existence of higher-order diffracted waves in phase grating cannot be ig-nored, even for fairly small values of the refractive index modulation (n1 ≥ 0.005).)
• There is a small absorption loss per wavelength and a slow energy interchange.
• There is the same average refractive index for the regions inside and outside thegrating boundaries.
More accurate theories for the diffraction of light by volume holograms were thereforedeveloped by a number of authors. But it appears that the coupled wave theory beginsto give good results for values of parameter Q > 10. [1, 5]
16
6 Holograms for displays
An obvious application of holography is in displays. Conventional holograms have severaldrawbacks, such as the limited angle over which the image can be viewed and the necessityto illuminate the subject with laser light when recording the hologram.
6.1 Holographic stereograms
It is also possible to synthesize a hologram that reconstructs an acceptable three-dimensionalimage from a series of two-dimensional images of an object recorded from different angles.The first step consists of recording in incoherent light, a series of n ordinary photographs,taken from a series of equally spaced positions along a horizontal line. In the secondstep, narrow, vertical strip holograms are then recorded of these photographs on a pho-tographic plate (see Fig. 19). When this holographic stereogram is illuminated with a
Figure 19: Optical system used to record a holographic stereogram from a series of two-dimensional transparencies [8].
point source of monochromatic light, the viewer sees a three-dimensional image. Theimage lacks vertical parallax, but it exhibits horizontal parallax over the range of anglescovered by the original photographs. The advantage of this technique is that a laser isrequired for the second step only. White light can be used to illuminate the subject inthe first step, so that holographic stereogram can be made of quite large scenes and evenof a living subject. [8, 1, 6]
6.2 Rainbow holograms
A rainbow holograms are holograms which can be viewed in white light. As shown inFig. 20(a), the first step in making a rainbow hologram is to record a conventionaltransmission hologram of the object. When this hologram is illuminated by the reversedreference beam, it generates a diffracted wave that is the conjugate of the original objectwave and produces a real image of the object (b). In the rainbow hologram, parallax inthe vertical plane is given up. It is eliminated by a horizontal slit placed over the primaryhologram. This limits the range of angles in the vertical plane from which the real imagecan be wieved, without restricting the range of viewing angles in the horizontal plane(c). A second hologram is recorded of this real image (d). When the final hologram is
17
Figure 20: Steps involved in the production of the rainbow hologram [1].
illuminated with the conjugate of the reference beam used to make it, it forms a realimage of the object near the hologram (Fig. 21 a). In addition, it forms a real image ofthe slit placed across the primary hologram. If the observer’s eyes move outside this slitpupil, the image disappears. It corresponds to the almost complete elimination of verticalparallax. If the hologram is viewed from within the slit pupil, a very bright image of theobject is seen (Fig. 20(a)).The image of an object can be seen also in white light. How is it possible? As we havealready said, we need coherent light (laser) in order to record an interference pattern.However, for a reconstruction of an image we need just diffraction. In the above case, ourhologram is a volume grating. The grating diffracts light, if gaps (of a volume grating)are close together. If we choose the grating pitch (Λ) approximately in the order of thewavelength of visible light, and the radius of the light source is 0.05m, and the source isat the distance of 1m, we get about 20Λ in the coherent area of white ligth. Since thecoherent area is much larger that the grating pitch, we can see the reconstructed image
18
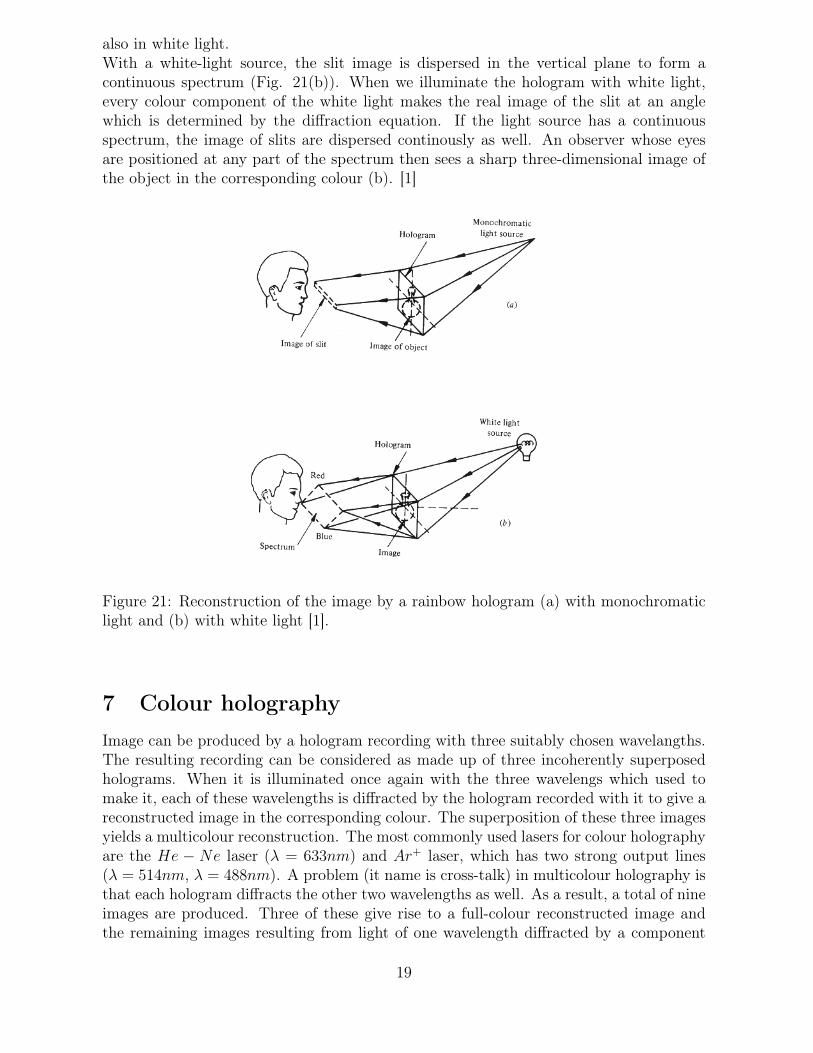
also in white light.With a white-light source, the slit image is dispersed in the vertical plane to form acontinuous spectrum (Fig. 21(b)). When we illuminate the hologram with white light,every colour component of the white light makes the real image of the slit at an anglewhich is determined by the diffraction equation. If the light source has a continuousspectrum, the image of slits are dispersed continously as well. An observer whose eyesare positioned at any part of the spectrum then sees a sharp three-dimensional image ofthe object in the corresponding colour (b). [1]
Figure 21: Reconstruction of the image by a rainbow hologram (a) with monochromaticlight and (b) with white light [1].
7 Colour holography
Image can be produced by a hologram recording with three suitably chosen wavelangths.The resulting recording can be considered as made up of three incoherently superposedholograms. When it is illuminated once again with the three wavelengs which used tomake it, each of these wavelengths is diffracted by the hologram recorded with it to give areconstructed image in the corresponding colour. The superposition of these three imagesyields a multicolour reconstruction. The most commonly used lasers for colour holographyare the He − Ne laser (λ = 633nm) and Ar+ laser, which has two strong output lines(λ = 514nm, λ = 488nm). A problem (it name is cross-talk) in multicolour holography isthat each hologram diffracts the other two wavelengths as well. As a result, a total of nineimages are produced. Three of these give rise to a full-colour reconstructed image andthe remaining images resulting from light of one wavelength diffracted by a component
19
hologram recorded with another wavelength are formed in other positions and overlapwith the multicoloured images.One of the methods to eliminate cross-talk are based on the use of volume holograms. Ahologram recorded with several wavelength in thick medium contains a set of regularlyspaced fringe planes for each wavelength. When this hologram is illuminated once againwith the original multiwavelength beam, each wavelength is diffracted by the set of fringeplanes created originally by it, produce a multicolour image. But the cross-talk imagesare severely attenuated since they do not satisfy the Bragg condition. [1]
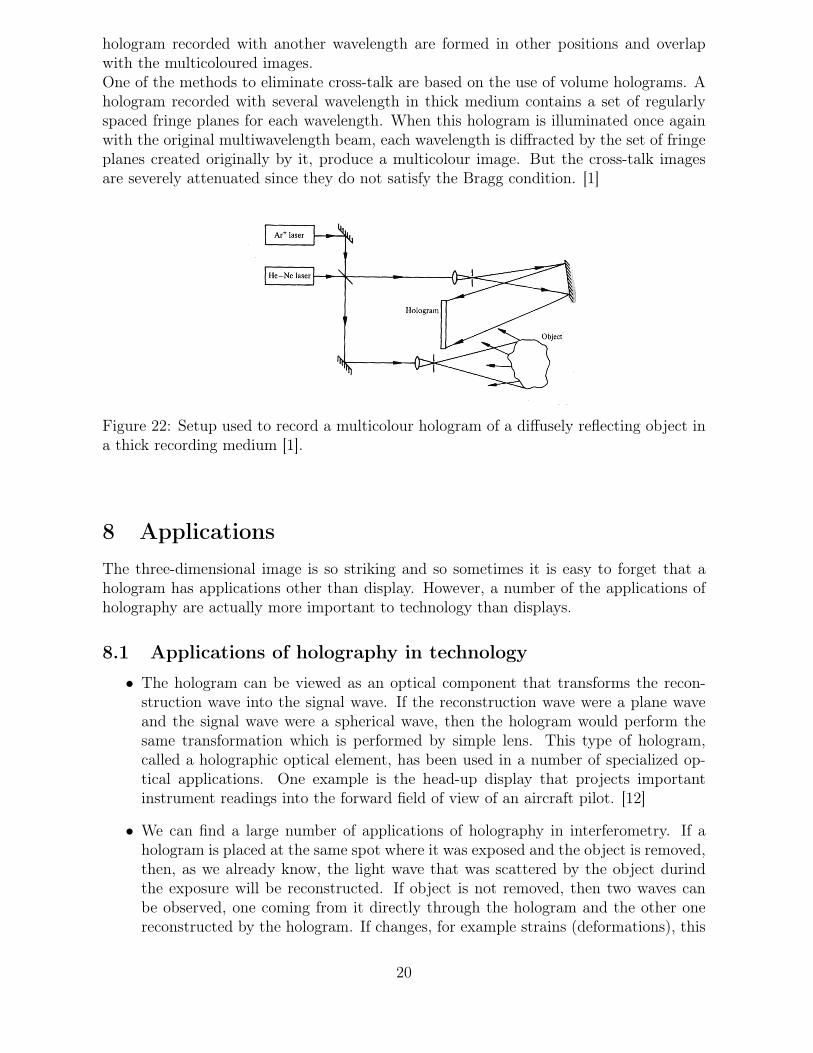
Figure 22: Setup used to record a multicolour hologram of a diffusely reflecting object ina thick recording medium [1].
8 Applications
The three-dimensional image is so striking and so sometimes it is easy to forget that ahologram has applications other than display. However, a number of the applications ofholography are actually more important to technology than displays.
8.1 Applications of holography in technology
• The hologram can be viewed as an optical component that transforms the recon-struction wave into the signal wave. If the reconstruction wave were a plane waveand the signal wave were a spherical wave, then the hologram would perform thesame transformation which is performed by simple lens. This type of hologram,called a holographic optical element, has been used in a number of specialized op-tical applications. One example is the head-up display that projects importantinstrument readings into the forward field of view of an aircraft pilot. [12]
• We can find a large number of applications of holography in interferometry. If ahologram is placed at the same spot where it was exposed and the object is removed,then, as we already know, the light wave that was scattered by the object durindthe exposure will be reconstructed. If object is not removed, then two waves canbe observed, one coming from it directly through the hologram and the other onereconstructed by the hologram. If changes, for example strains (deformations), this
20
will immediately be noted on the picture observed. Applications of holographic in-terferometry can be found in medical and dental research, aerodynamics and plasmadiagnostic. [13]
• Volume reflection holograms recorded in dichromate gelatin can be used as narrow-band rejection filters. [1]
• To better understand phytoplankton, researchers have developed an undersea holo-graphic camera that generates in-line and off-axis holograms of the organism. [2]
• Optical computers, which use holograms as storage material for data, could havea dramatic impact on the overall holography market. Optical computers will beable to deliver trillions of bits of information faster than the current generation ofcomputers, because lightwaves are capable of recording and storing infinitely moreinformation than the magnetic particles that are the basis of current computertechnology. [2, 15]
9 Conclusion
A hologram can be made not only with a light waves of the laser, but also with soundwaves and other waves in the electro-magnetic spectrum. Holograms made with X-rays canrecord images of particles, such as atoms or molecules. Acoustical holography uses soundwaves to see through solid objects. Holography ability to record and reconstruct bothlight and sound waves makes it a valuable tool for industry, science, business, commerceand art.
References
[1] Hariharan P. : Optical Holography, second edition, Cambridge University Press, 1996
[2] http://www.holophile.com/history.htm
[3] http://laser.physics.sunysb.edu/ dbennett/optics2/optics2.htm
[4] Fontecchio A. K. : Multiplexing Studies of Holographically-formed Polymer DispersedLiquid Crystals Dissertation, Degree of Doctor, Brown University, Providence, RhodeIsland, May 2003
[5] Kogelnik H. : Coupled wave theory for thick hologram gratings, Technical Journal,November 1969, vol. 48, 2909-2946
[6] McCrickerd J. T. & George N. : Holographic stereograms from sequential componentphotographs, Applied physics letters, January, 1968, Vol.12, No.1
[7] http://www.holophile.com/about.htm
[8] DeBitetto D. J. : Holographic Panoramic Stereograms Synthesized from White LightRecording, Applied Optics, Vol. 8, No. 8, August 1969
21
[9] Mallick S. : Pulse Holography of uniformly moving object, Applied Optics, Vol. 14,No. 3, March 1975
[10] Crawford G. P. : Bragg gratings, Optics & Photonics News, April 2003
[11] Guenther Robert D. : Modern Optics , John Wiley & Sons, Inc.; Canada, 1990
[12] Yariv A. : Optical electronics in modern communications, fifth edition, Oxford Uni-versity Press, New York, 1997
[13] Ostrovsky Yu.I. : Holography and its Application , Mir Publishers, Moscow, 1977
[14] Stroke George : Coherent optics and holography , Second edition, Academic press,New York, 1969
[15] http://www.pro.on.ca
22