Embed Size (px)
Citation preview
Optical heterodyne detection in the mid-infrared: capabilities and new molecular sensing applications
Gerard Wysocki
Electrical Engineering Dept., Princeton University, Princeton NJ
email: [email protected]; web: pulse.princeton.edu
ARPA-E
Workshop 2012 Washington, DC
March 29, 2012
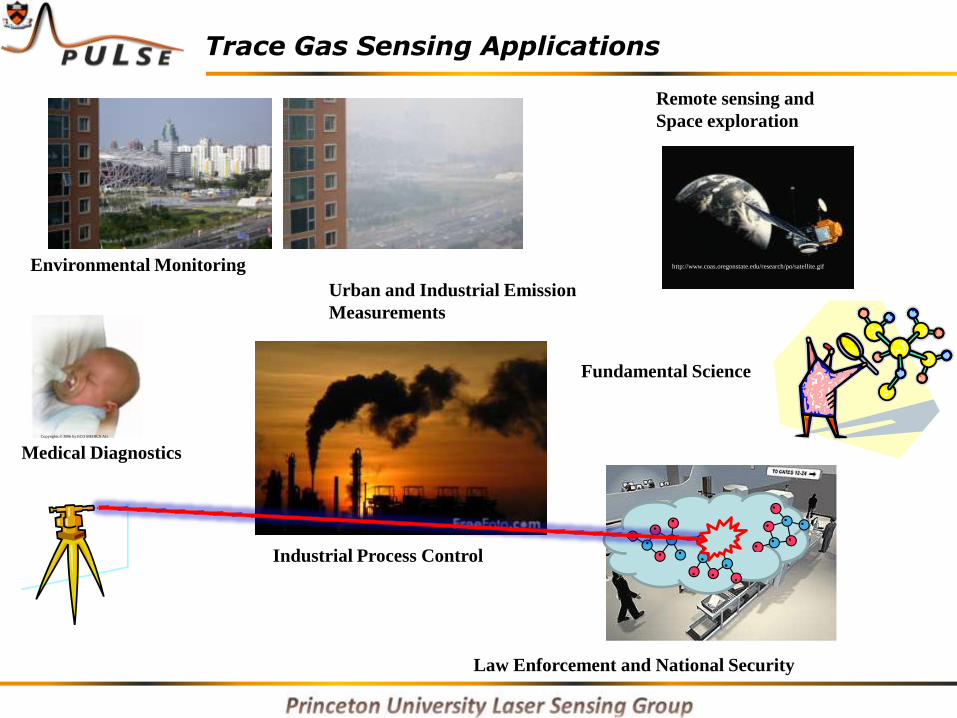
Trace Gas Sensing Applications
Copyrights © 2006 by ECO MEDICS AG
Urban and Industrial Emission
Measurements
Environmental Monitoring
Industrial Process Control
Law Enforcement and National Security
Fundamental Science
http://www.coas.oregonstate.edu/research/po/satellite.gif
Remote sensing and
Space exploration
Medical Diagnostics
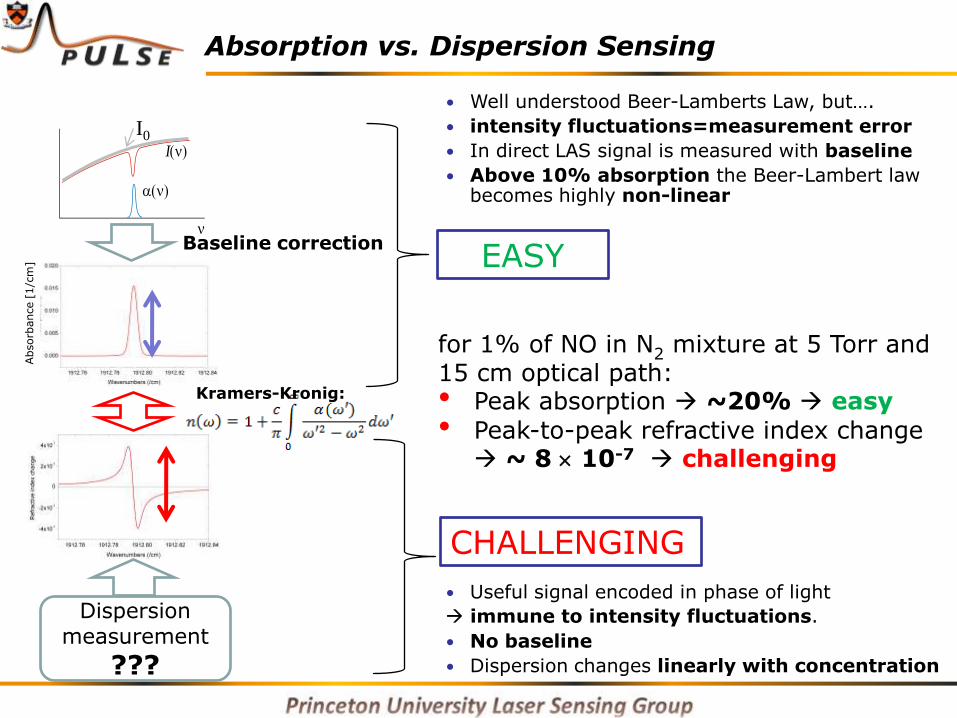
Absorption vs. Dispersion Sensing
for 1% of NO in N2 mixture at 5 Torr and 15 cm optical path: • Peak absorption ~20% easy
• Peak-to-peak refractive index change ~ 8 10-7 challenging
EASY
CHALLENGING
Absorb
ance [
1/c
m]
I
I0
Baseline correction
Dispersion measurement
???
• Well understood Beer-Lamberts Law, but….
• intensity fluctuations=measurement error
• In direct LAS signal is measured with baseline
• Above 10% absorption the Beer-Lambert law becomes highly non-linear
• Useful signal encoded in phase of light
immune to intensity fluctuations.
• No baseline
• Dispersion changes linearly with concentration
Kramers-Kronig:
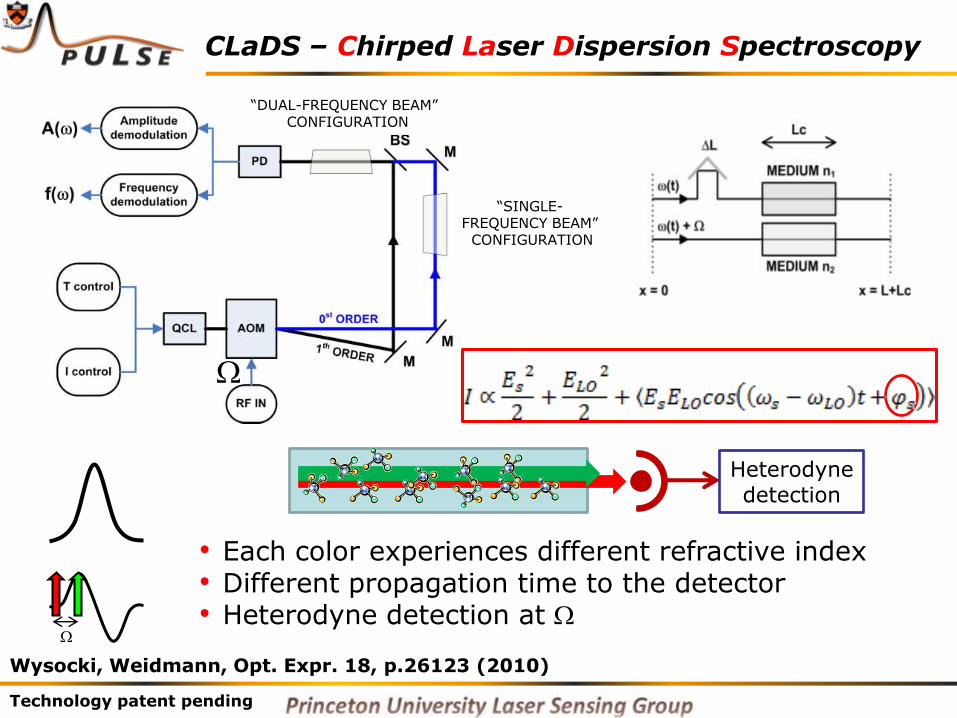
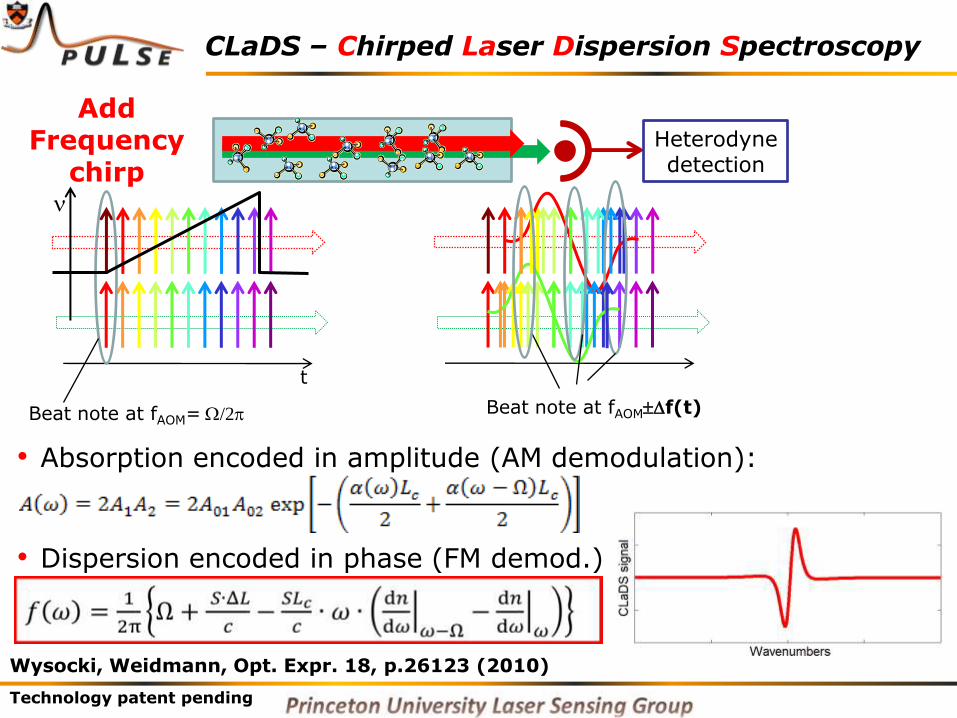
CLaDS – Chirped Laser Dispersion Spectroscopy
• Each color experiences different refractive index • Different propagation time to the detector • Heterodyne detection at
Heterodyne detection
Technology patent pending
“DUAL-FREQUENCY BEAM” CONFIGURATION
“SINGLE-FREQUENCY BEAM” CONFIGURATION
Wysocki, Weidmann, Opt. Expr. 18, p.26123 (2010)
CLaDS – Chirped Laser Dispersion Spectroscopy
Heterodyne detection
t
Beat note at fAOM= /2 Beat note at fAOMf(t)
Add Frequency
chirp
Technology patent pending
• Absorption encoded in amplitude (AM demodulation):
• Dispersion encoded in phase (FM demod.)
Wysocki, Weidmann, Opt. Expr. 18, p.26123 (2010)
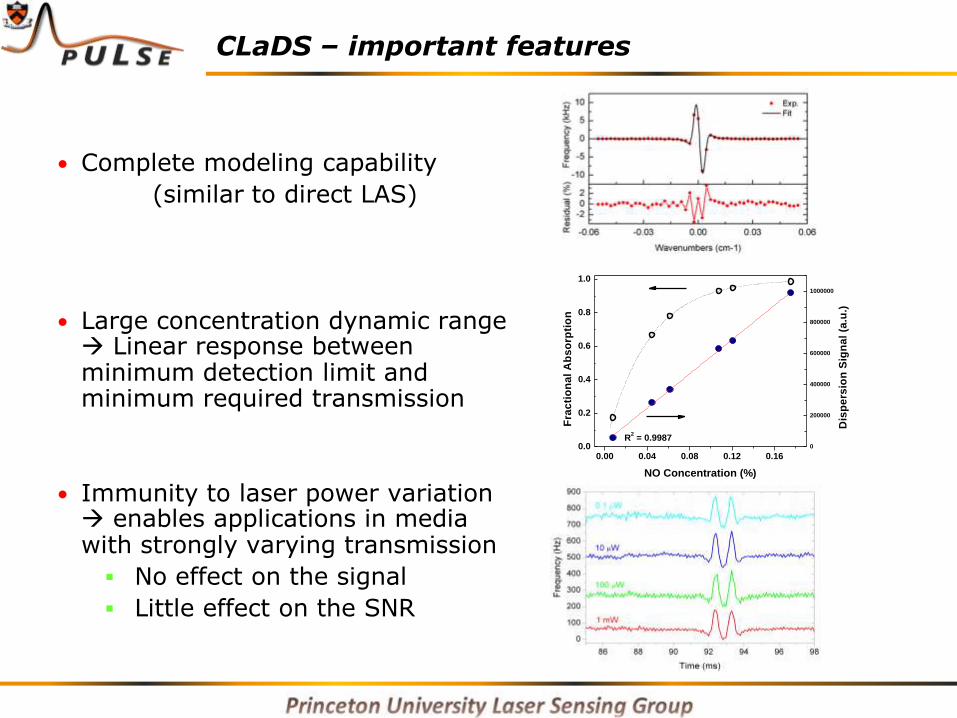
CLaDS – important features
0.00 0.04 0.08 0.12 0.160.0
0.2
0.4
0.6
0.8
1.0
Fra
cti
on
al
Ab
so
rpti
on
NO Concentration (%)
0
200000
400000
600000
800000
1000000
Dis
pe
rsio
n S
ign
al
(a.u
.)
R2 = 0.9987
• Complete modeling capability
(similar to direct LAS)
• Large concentration dynamic range Linear response between minimum detection limit and minimum required transmission
• Immunity to laser power variation enables applications in media with strongly varying transmission
No effect on the signal
Little effect on the SNR
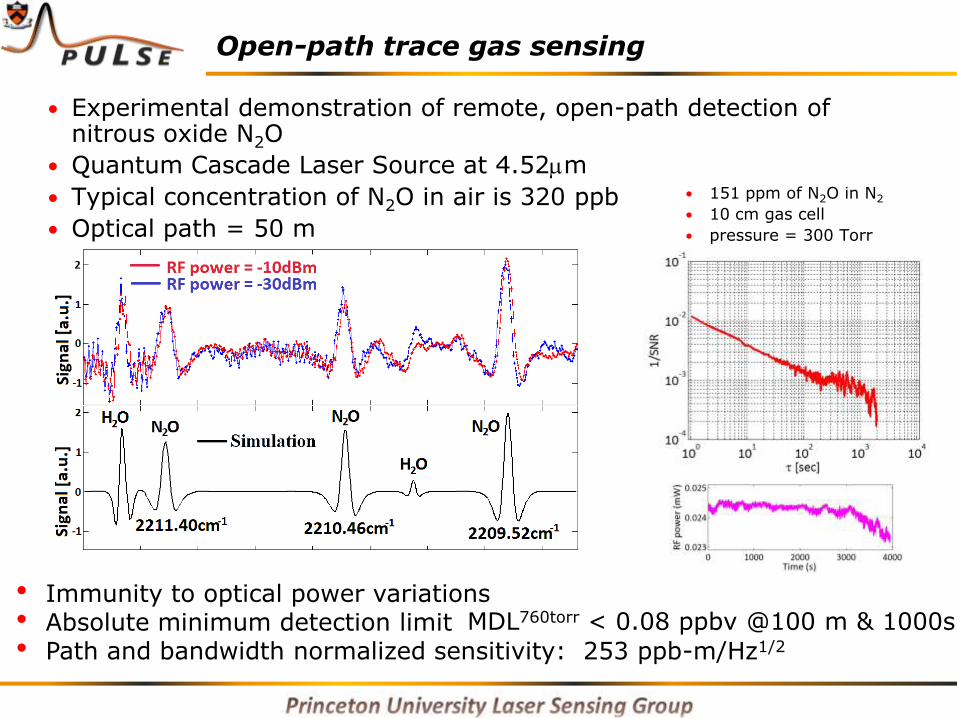
Open-path trace gas sensing
• Experimental demonstration of remote, open-path detection of nitrous oxide N2O
• Quantum Cascade Laser Source at 4.52m
• Typical concentration of N2O in air is 320 ppb
• Optical path = 50 m
• Immunity to optical power variations • Absolute minimum detection limit • Path and bandwidth normalized sensitivity: 253 ppb-m/Hz1/2
• 151 ppm of N2O in N2
• 10 cm gas cell
• pressure = 300 Torr
MDL760torr < 0.08 ppbv @100 m & 1000s
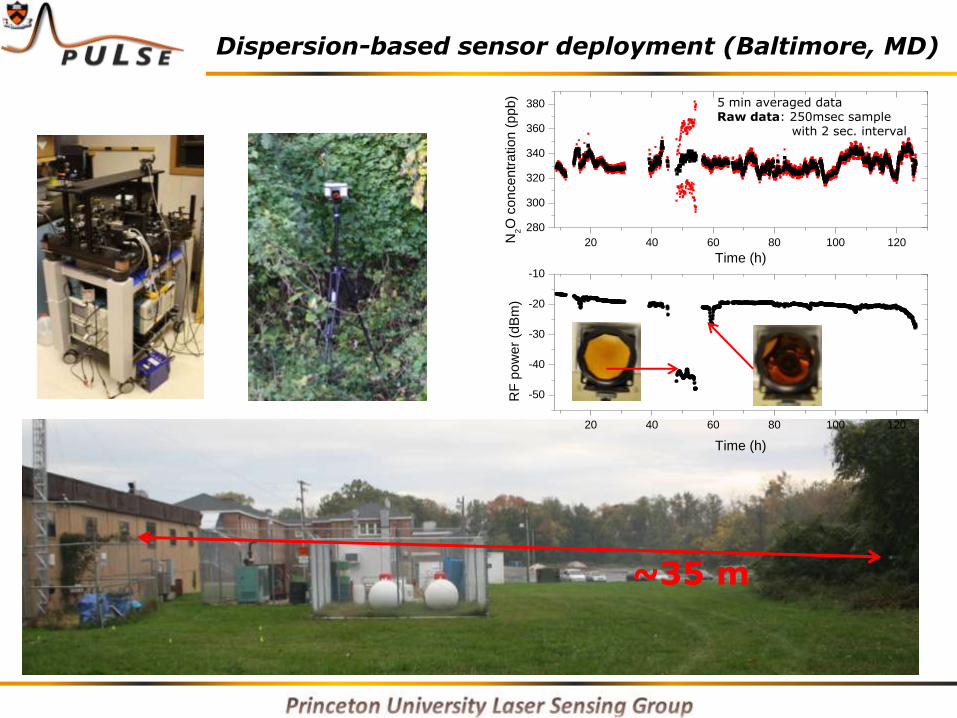
Dispersion-based sensor deployment (Baltimore, MD)
~35 m
20 40 60 80 100 120
-50
-40
-30
-20
-10
RF
po
we
r (d
Bm
)
Time (h)
20 40 60 80 100 120
280
300
320
340
360
380
N2O
co
nce
ntr
atio
n (
pp
b)
Time (h)
5 min averaged data Raw data: 250msec sample with 2 sec. interval
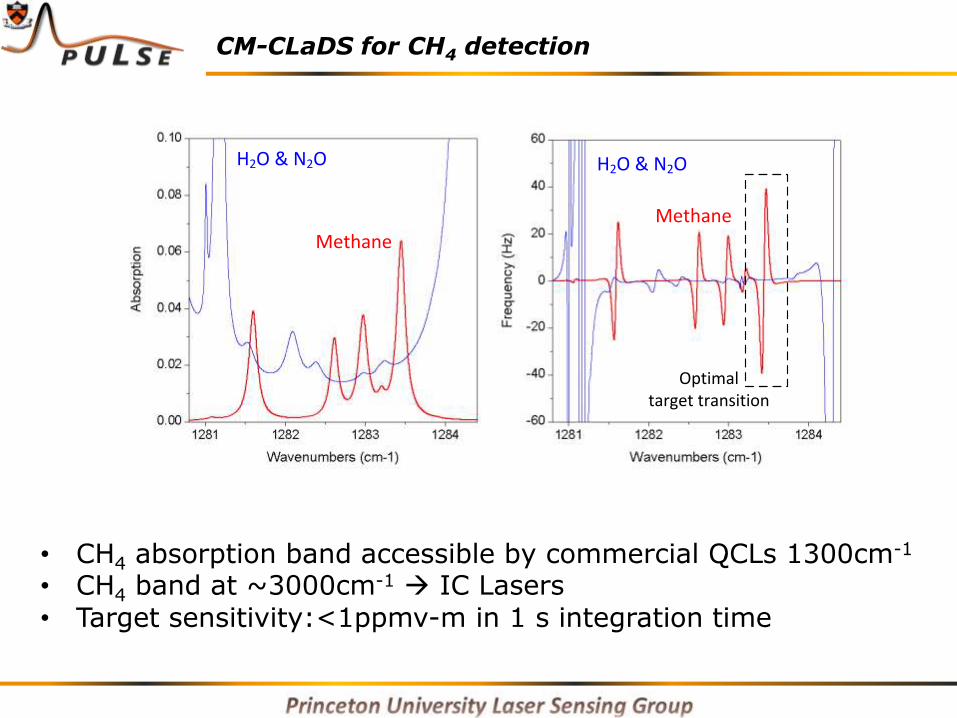
CM-CLaDS for CH4 detection
Optimal target transition
Methane
H2O & N2O
Methane
H2O & N2O
• CH4 absorption band accessible by commercial QCLs 1300cm-1 • CH4 band at ~3000cm-1 IC Lasers • Target sensitivity:<1ppmv-m in 1 s integration time
Summary
• New dispersion-based detection scheme enables unique capabilities
• CLaDS technique and its application to remote gas sensing has been developed
• CH4 sensing at atmospheric levels is feasible
• CLaDS provides: • Sensitive photodetection (through the optical heterodyning)
• Molecular information is encoded in the frequency not amplitude
• Large dynamic range with linear response
• Immunity to amplitude noise and power variations
• Fast measurement (s time scale)
• Complete modeling capability (similarly to LAS)
• Excellent match with QCL technology
• Suitability for remote, open-path trace-gas detection
Acknowledgements
• NSF CMMI CAREER grant
• NSF ERC MIRTHE
• Corning for a 4.5um DFB QCL
My group:
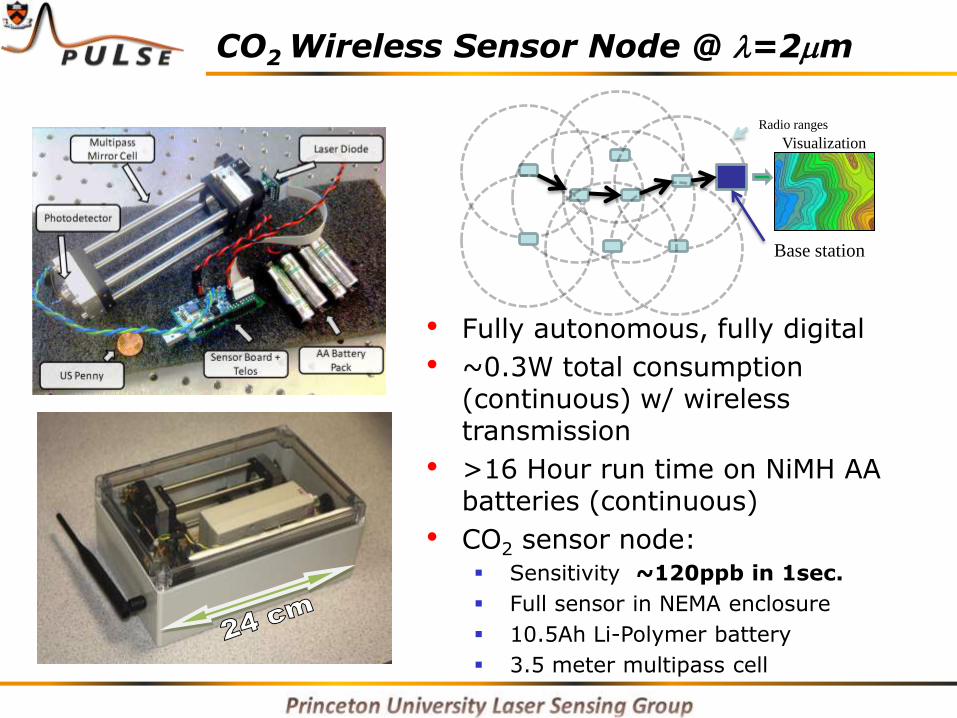
CO2 Wireless Sensor Node @ =2m
• Fully autonomous, fully digital
• ~0.3W total consumption (continuous) w/ wireless transmission
• >16 Hour run time on NiMH AA batteries (continuous)
• CO2 sensor node: Sensitivity ~120ppb in 1sec.
Full sensor in NEMA enclosure
10.5Ah Li-Polymer battery
3.5 meter multipass cell
Radio ranges
Base station
Visualization
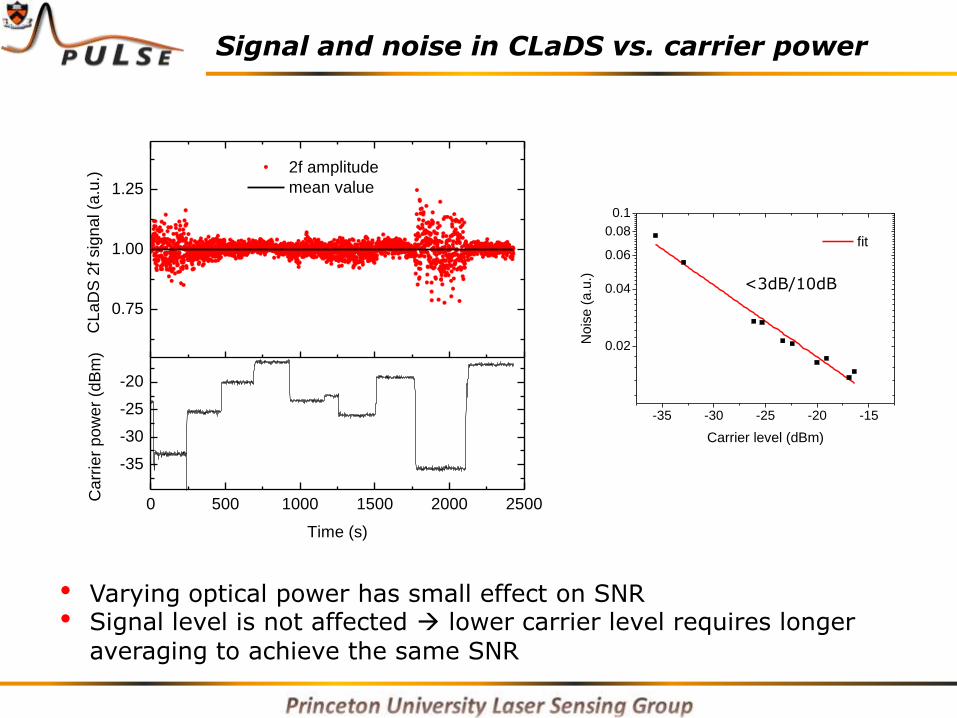
Signal and noise in CLaDS vs. carrier power
0 500 1000 1500 2000 2500
-35
-30
-25
-20
0.75
1.00
1.25
Ca
rrie
r p
ow
er
(dB
m)
Time (s)
CL
aD
S 2
f sig
na
l (a
.u.)
2f amplitude
mean value
-35 -30 -25 -20 -15
0.02
0.04
0.06
0.08
0.1
fit
Nois
e (
a.u
.)
Carrier level (dBm)
Equation y = a + b*x
Weight No Weighting
Residual Sum of Squares
0.01189
Pearson's r -0.98907
Adj. R-Square 0.97555
Value Standard Error
C Intercept -2.51398 0.04917
C Slope -0.03796 0.002
<3dB/10dB
• Varying optical power has small effect on SNR • Signal level is not affected lower carrier level requires longer
averaging to achieve the same SNR
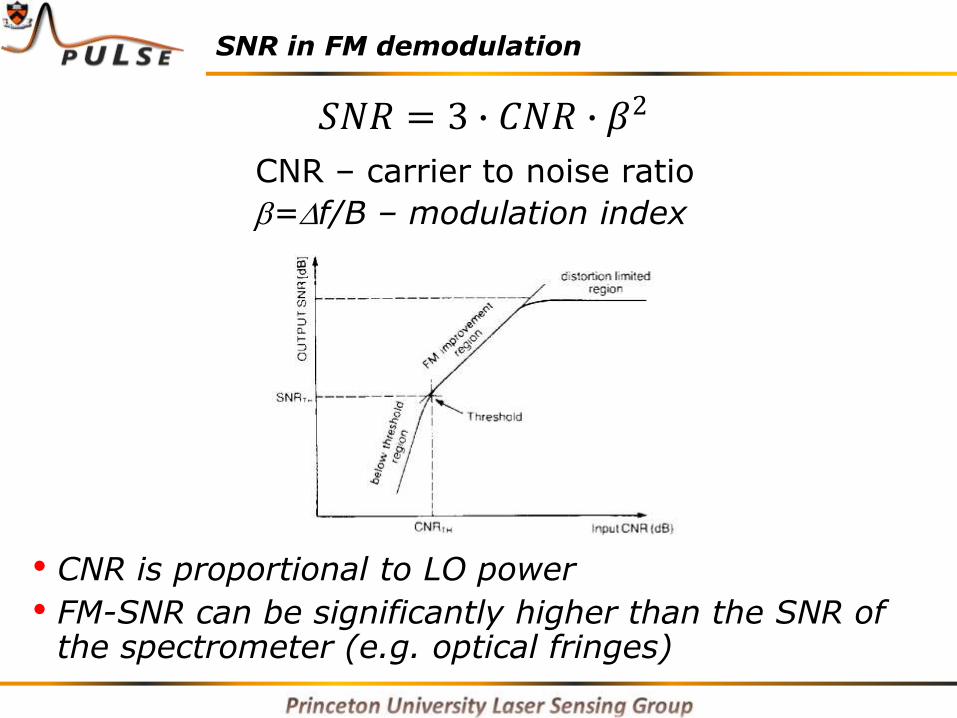
SNR in FM demodulation
CNR – carrier to noise ratio
=f/B – modulation index
𝑆𝑁𝑅 = 3 ∙ 𝐶𝑁𝑅 ∙ 𝛽2
• CNR is proportional to LO power
• FM-SNR can be significantly higher than the SNR of the spectrometer (e.g. optical fringes)
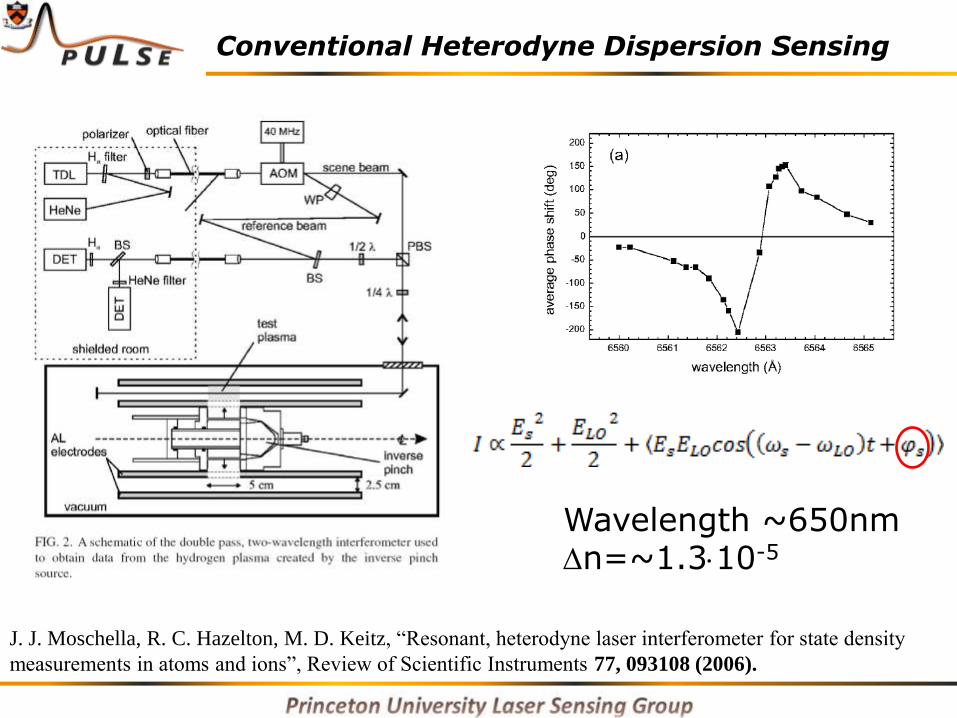
Conventional Heterodyne Dispersion Sensing
J. J. Moschella, R. C. Hazelton, M. D. Keitz, “Resonant, heterodyne laser interferometer for state density
measurements in atoms and ions”, Review of Scientific Instruments 77, 093108 (2006).
Wavelength ~650nm n=~1.310-5