Embed Size (px)
Citation preview
November 19, 2001 9:35 WSPC/145-JNOPM 00070
Journal of Nonlinear Optical Physics & MaterialsVol. 10, No. 3 (2001) 355–370c© World Scientific Publishing Company
OPTICAL GAIN IN AN INHOMOGENEOUS DISTRIBUTION OF
CdS QUANTUM DOTS EMBEDDED IN GLASS MATRIX
SHARMILA BANERJEE∗ and PRATIMA SEN†
Department of Applied Physics,Shri G S Institute of Technology & Science,
Indore – 452003, India†pratima [email protected]
Received 1 May 2001
The optical gain spectra of inhomogeneously distributed semiconductor Quantum dots(QDs) embedded in a dielectric matrix has been examined theoretically using densitymatrix treatment. The expression for the threshold field is required to obtain opticalgain. We have examined the role of excitons and biexcitons in gain mechanism and foundthat the gain arising due to excitonic nonlinearity enhances in presence of biexcitons. Acomparison of the optical gain spectra of single quantum dot (SQD) and inhomogeneousdistribution of quantum dots (IDQ) shows that the exciton peak in SQD gets red shiftedin IDQ while biexciton peak in SQD exhibits a blue shift. A detailed numerical analysisestablishes a strong dependence of optical gain on size distribution function and it isfound that an increased size distribution width yields larger gain and increased gainbandwidth. The nonlinear gain is also found to increase in a matrix possessing largerdielectric constant.
1. Introduction
The semiconductor quantum dots (QD) have attracted attention from the funda-
mental physics point of view as well as from the point of view of its vast applications
in integrated optics because of the enhanced optical nonlinearities and fast response
time in these structures.1 Their optical properties are highly sensitive to dot size and
the environment in which they are embedded in. The effect of size dependence arises
due to the fact that the confinement energy in a QD is inversely proportional to
the square of the dot size. As a consequence of strong confinement in QDs, the
electronic structure collapses to a series of discrete levels.2 The reduced dimension-
ality of QDs also causes increased spatial overlap between electrons and holes. As
a result, apart from excitons, biexcitons also play an important role in determining
the optical properties of semiconductor quantum dots. The optical properties of
∗Present address: University of Wales, Bangor, School of Informatics, Bangor – LL 57 1 UT,Wales, UK.
355
J. N
onlin
ear
Opt
ic. P
hys.
Mat
. 200
1.10
:355
-370
. Dow
nloa
ded
from
ww
w.w
orld
scie
ntif
ic.c
omby
PE
NN
SYL
VA
NIA
ST
AT
E U
NIV
ER
SIT
Y o
n 10
/02/
13. F
or p
erso
nal u
se o
nly.
November 19, 2001 9:35 WSPC/145-JNOPM 00070
356 S. Banerjee & P. Sen
QDs are thus determined from both ground (|o〉) to exciton (|e〉) as well as exciton(|e〉) to biexciton (|b〉) transitions. The optical gain in photopumped bulk CuCl
crystal was reported to be high due to biexciton to exciton transition3,4 and lasing
was predicted.5 Masumoto et al.6 were the first to report observation of lasing in
CuCl QDs embedded in a NaCl single crystal. Although they could not provide
a satisfactory explaination of the occurrence of large optical gain, however, they
predicted that the confinement of excitons and biexcitons in CuCl microcrystals
possibly gave rise to large population inversion causing the gain. Later, the optical
gain in sol-gel derived QDs of CdS was reported by Butty et al.7,8 They found
that the optical gain had a long tail extended to low energy side of the absorption
edge and ascribed its origin to the biexciton to exciton transitions. Recently, we
have theoretically analyzed the absorption spectra of small semiconductor quantum
dots9 using semiclassical density matrix approach and found that a negative change
in absorption coefficient occurs in the shorter wavelength region as has been ob-
served by Butty et al.7 In our opinion, a clear understanding of optical gain in QDs
is still lacking and needs further investigations.
In the present paper, we have made an attempt to study the gain mechanism
in CdS QDs which are inhomogeneously distributed in a glass matrix. Recently
Hwang et al.10 have studied the effect of glass electronic states on carrier dynamics
in QDs. A systematic analysis has been made by proceeding in the following
manner; using semiclassical density matrix approach, and considering |o〉 ↔ |e〉and |e〉 ↔ |b〉 transitions, the expression for the induced polarization in a small
semiconductor single QD (SQD) has been made in Sec. 2.1 where we found that
excitons contribute to linear as well as nonlinear polarization both while the con-
tribution of biexcitons is signatured only in nonlinear polarization. Also the con-
dition of threshold field has been obtained beyond which nonlinear gain can be
expected to occur in SQD. The effect of the inhomogeneous distribution of QDs
has been incorporated in Sec. 2.2 while Sec. 2.3 deals with the effect of embed-
ding QDs in a matrix. In Sec. 3 we have applied our analysis to experimental
conditions similar to the one used by Butty et al.7 In this section, the absorp-
tion spectra of single QD (SQD) and inhomogeneous distribution of QDs (IDQ)
have been obtained. A comparison of the spectra revealed the fact that the gain
characteristics corresponding to |o〉 ↔ |e〉 and |e〉 ↔ |b〉 transitions occurring at
high and low energy side in a SQD exhibits a reversed character in IDQ. Such
interesting feature has been further analyzed critically by individually inspecting
the role of excitons, biexcitons, inhomogeneous distribution and effect of embed-
ding QDs in glass matrix. In order to compare our results with the experimental
observations of Butty et al.7 we have also studied the differential transmission
spectra of QDS and we found that the origin of gain lies in the |o〉 ↔ |e〉 tran-sitions which is further enhanced due to the presence of biexcitonic state. The
effect of size distribution on DTS showed that the larger distribution width yields
better gain.
J. N
onlin
ear
Opt
ic. P
hys.
Mat
. 200
1.10
:355
-370
. Dow
nloa
ded
from
ww
w.w
orld
scie
ntif
ic.c
omby
PE
NN
SYL
VA
NIA
ST
AT
E U
NIV
ER
SIT
Y o
n 10
/02/
13. F
or p
erso
nal u
se o
nly.
November 19, 2001 9:35 WSPC/145-JNOPM 00070
Optical Gain in an Inhomogeneous Distribution 357
2. Theoretical Formulations
2.1. Induced polarization in a single quantum dot (SQD)
We have used the semiclassical density matrix approach to study the linear and
nonlinear absorption spectra in small semiconductor quantum dots. We consider
the optical transitions to occur between the crystal ground state |o〉 and a single
electron-hole pair state (i.e. exciton state |e〉) and that between exciton and biex-
citon |b〉 state. We have ignored the parity violating direct transitions between the
ground and the biexcitonic states by assuming that the two-photon absorption is
absent. Accordingly, we define the unperturbed Hamiltonian of the QD as
Ho =
ωoo 0 0
0 ωee 0
0 0 ωbb
(1)
with ωoo(ee,bb) being the unperturbed energies of the ground (exciton, biexciton)
state.
In the present calculations, we have considered the pump frequency to be in near
resonance with the crystal band gap frequency. Thus, by incorporating both the
exciton and biexciton states of a QD, the semiclassical Hamiltonian is represented
by the dipole type interaction as
Ho +H1 with HI =
0 −µoeE 0
−µoeE∗ 0 −µebE
∗
0 −µbeE∗ 0
. (2)
Here E is the amplitude of the electromagnetic field and is assumed to act parallel to
the transition dipole moment operators, µ. We consider the dipole allowed transition
for a small quantum dot of dimensions smaller than the bulk exciton Bohr radius
and the transition dipole moment for |o〉 ↔ |e〉 and |e〉 ↔ |b〉 (here onwards writtenas oe and eb transitions, respectively) states are defined as11
〈e|µ|o〉 = µoe
∫ϕ(r, r)dr . (3a)
Here, µoe = epab/moωoe, ϕ(r, r) and ϕ(re, r, rh, r) are the exciton and biexciton
wave functions, respectively related to the single particle wave function ϕ(r) as11
ϕ(re, rh) = ϕ(re)ϕ(rh) and ϕ(re, r, rh, r) = ϕ(re)ϕ(r)ϕ(rh)ϕ(r) (4a)
with
ϕ(r) =
√2a3BR3
jl(αnl|r|/R)jl+1(αnl)
Ylm(θ, ϕ) (4b)
is the single particle wave function and R is the radius of the quantum dot. For
a small QD of radius R much smaller than the bulk exciton Bohr radius aB, the
J. N
onlin
ear
Opt
ic. P
hys.
Mat
. 200
1.10
:355
-370
. Dow
nloa
ded
from
ww
w.w
orld
scie
ntif
ic.c
omby
PE
NN
SYL
VA
NIA
ST
AT
E U
NIV
ER
SIT
Y o
n 10
/02/
13. F
or p
erso
nal u
se o
nly.
November 19, 2001 9:35 WSPC/145-JNOPM 00070
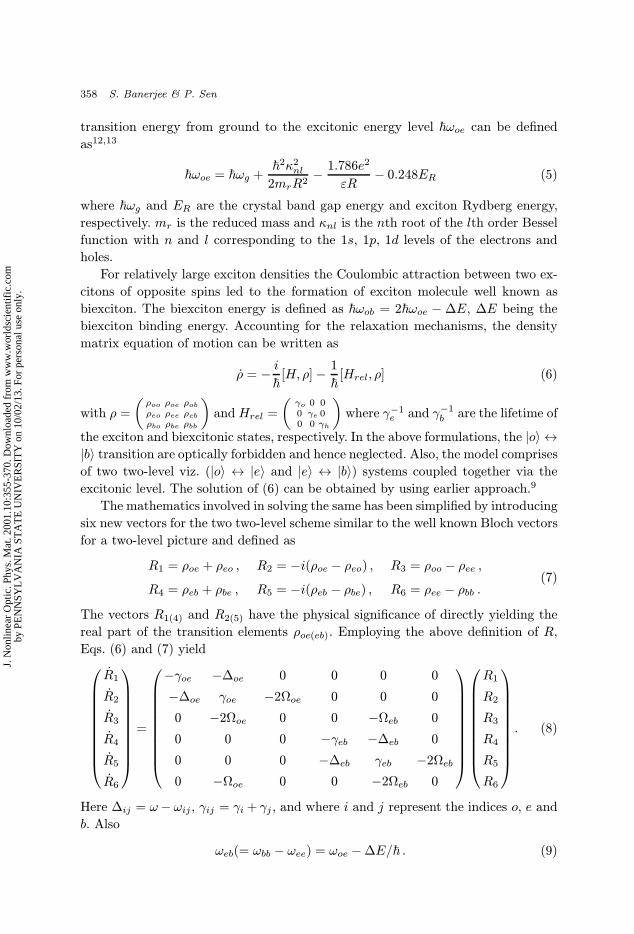
358 S. Banerjee & P. Sen
transition energy from ground to the excitonic energy level ωoe can be defined
as12,13
ωoe = ωg +2κ2nl
2mrR2− 1.786e2
εR− 0.248ER (5)
where ωg and ER are the crystal band gap energy and exciton Rydberg energy,
respectively. mr is the reduced mass and κnl is the nth root of the lth order Bessel
function with n and l corresponding to the 1s, 1p, 1d levels of the electrons and
holes.
For relatively large exciton densities the Coulombic attraction between two ex-
citons of opposite spins led to the formation of exciton molecule well known as
biexciton. The biexciton energy is defined as ωob = 2ωoe − ∆E, ∆E being the
biexciton binding energy. Accounting for the relaxation mechanisms, the density
matrix equation of motion can be written as
ρ = − i
[H, ρ]− 1
[Hrel, ρ] (6)
with ρ =
(ρoo ρoe ρobρeo ρee ρebρbo ρbe ρbb
)and Hrel =
(γo 0 00 γe 00 0 γh
)where γ−1e and γ−1b are the lifetime of
the exciton and biexcitonic states, respectively. In the above formulations, the |o〉 ↔|b〉 transition are optically forbidden and hence neglected. Also, the model comprisesof two two-level viz. (|o〉 ↔ |e〉 and |e〉 ↔ |b〉) systems coupled together via the
excitonic level. The solution of (6) can be obtained by using earlier approach.9
The mathematics involved in solving the same has been simplified by introducing
six new vectors for the two two-level scheme similar to the well known Bloch vectors
for a two-level picture and defined as
R1 = ρoe + ρeo , R2 = −i(ρoe − ρeo) , R3 = ρoo − ρee ,
R4 = ρeb + ρbe , R5 = −i(ρeb − ρbe) , R6 = ρee − ρbb .(7)
The vectors R1(4) and R2(5) have the physical significance of directly yielding the
real part of the transition elements ρoe(eb). Employing the above definition of R,
Eqs. (6) and (7) yield
R1
R2
R3
R4
R5
R6
=
−γoe −∆oe 0 0 0 0
−∆oe γoe −2Ωoe 0 0 0
0 −2Ωoe 0 0 −Ωeb 0
0 0 0 −γeb −∆eb 0
0 0 0 −∆eb γeb −2Ωeb0 −Ωoe 0 0 −2Ωeb 0
R1
R2
R3
R4
R5
R6
. (8)
Here ∆ij = ω− ωij , γij = γi+ γj , and where i and j represent the indices o, e and
b. Also
ωeb(= ωbb − ωee) = ωoe −∆E/ . (9)
J. N
onlin
ear
Opt
ic. P
hys.
Mat
. 200
1.10
:355
-370
. Dow
nloa
ded
from
ww
w.w
orld
scie
ntif
ic.c
omby
PE
NN
SYL
VA
NIA
ST
AT
E U
NIV
ER
SIT
Y o
n 10
/02/
13. F
or p
erso
nal u
se o
nly.
November 19, 2001 9:35 WSPC/145-JNOPM 00070
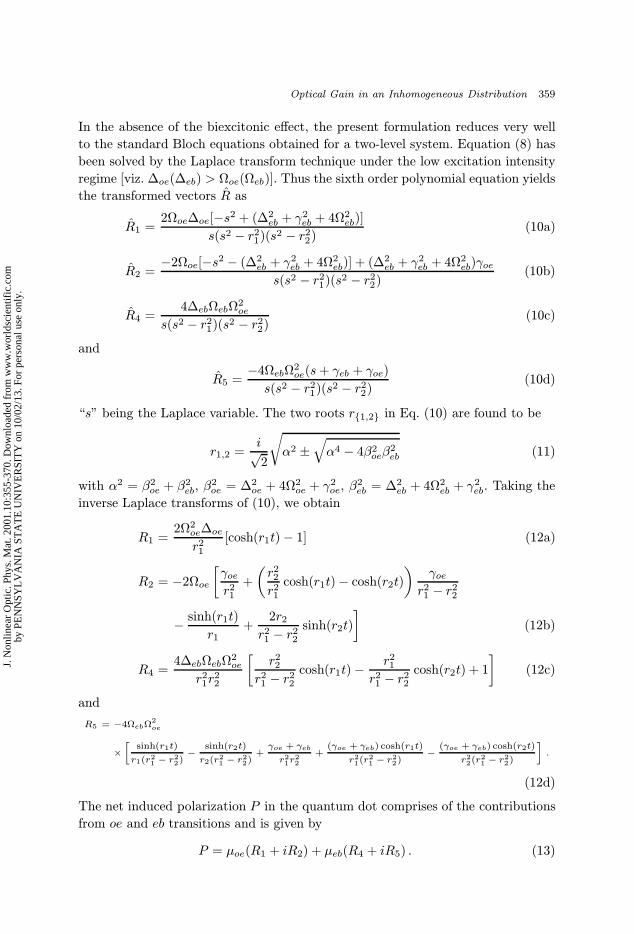
Optical Gain in an Inhomogeneous Distribution 359
In the absence of the biexcitonic effect, the present formulation reduces very well
to the standard Bloch equations obtained for a two-level system. Equation (8) has
been solved by the Laplace transform technique under the low excitation intensity
regime [viz. ∆oe(∆eb) > Ωoe(Ωeb)]. Thus the sixth order polynomial equation yields
the transformed vectors R as
R1 =2Ωoe∆oe[−s2 + (∆2eb + γ2eb + 4Ω2eb)]
s(s2 − r21)(s2 − r22)
(10a)
R2 =−2Ωoe[−s2 − (∆2eb + γ2eb + 4Ω2eb)] + (∆2eb + γ2eb + 4Ω2eb)γoe
s(s2 − r21)(s2 − r22)
(10b)
R4 =4∆ebΩebΩ
2oe
s(s2 − r21)(s2 − r22)
(10c)
and
R5 =−4ΩebΩ2oe(s+ γeb + γoe)
s(s2 − r21)(s2 − r22)
(10d)
“s” being the Laplace variable. The two roots r1,2 in Eq. (10) are found to be
r1,2 =i√2
√α2 ±
√α4 − 4β2oeβ
2eb (11)
with α2 = β2oe + β2eb, β2oe = ∆2oe + 4Ω2oe + γ2oe, β2eb = ∆2eb + 4Ω2eb + γ2eb. Taking the
inverse Laplace transforms of (10), we obtain
R1 =2Ω2oe∆oe
r21[cosh(r1t)− 1] (12a)
R2 = −2Ωoe[γoe
r21+
(r22r21
cosh(r1t)− cosh(r2t)
)γoe
r21 − r22
− sinh(r1t)
r1+
2r2r21 − r22
sinh(r2t)
](12b)
R4 =4∆ebΩebΩ
2oe
r21r22
[r22
r21 − r22cosh(r1t)−
r21r21 − r22
cosh(r2t) + 1
](12c)
and
R5 = −4ΩebΩ2oe
×[sinh(r1t)
r1(r21 − r22)−sinh(r2t)
r2(r21 − r22)+γoe + γeb
r21r22
+(γoe + γeb) cosh(r1t)
r21(r21 − r22)
−(γoe + γeb) cosh(r2t)
r22(r21 − r22)
].
(12d)
The net induced polarization P in the quantum dot comprises of the contributions
from oe and eb transitions and is given by
P = µoe(R1 + iR2) + µeb(R4 + iR5) . (13)
J. N
onlin
ear
Opt
ic. P
hys.
Mat
. 200
1.10
:355
-370
. Dow
nloa
ded
from
ww
w.w
orld
scie
ntif
ic.c
omby
PE
NN
SYL
VA
NIA
ST
AT
E U
NIV
ER
SIT
Y o
n 10
/02/
13. F
or p
erso
nal u
se o
nly.
November 19, 2001 9:35 WSPC/145-JNOPM 00070
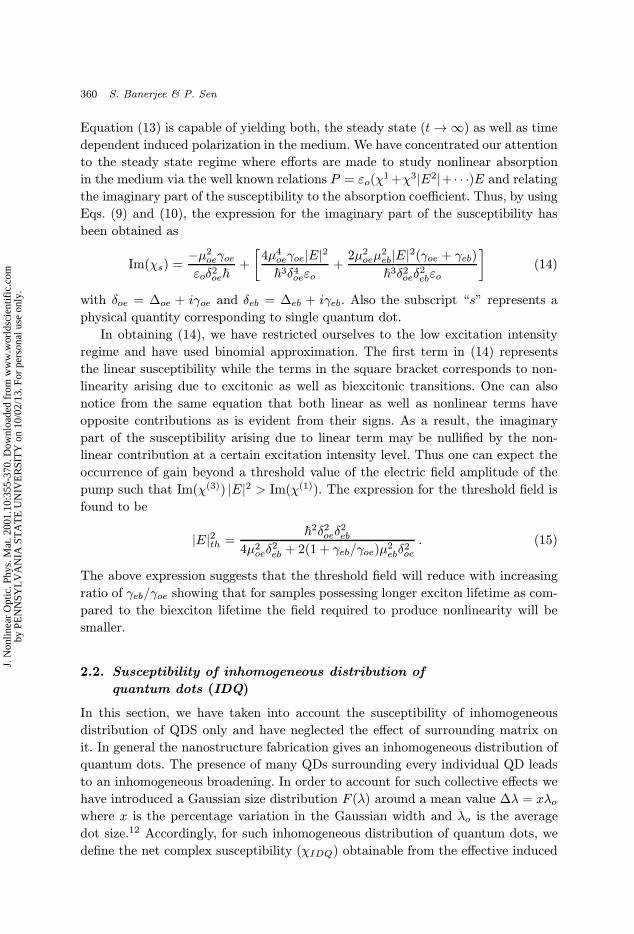
360 S. Banerjee & P. Sen
Equation (13) is capable of yielding both, the steady state (t→∞) as well as time
dependent induced polarization in the medium. We have concentrated our attention
to the steady state regime where efforts are made to study nonlinear absorption
in the medium via the well known relations P = εo(χ1+χ3|E2|+ · · ·)E and relating
the imaginary part of the susceptibility to the absorption coefficient. Thus, by using
Eqs. (9) and (10), the expression for the imaginary part of the susceptibility has
been obtained as
Im(χs) =−µ2oeγoe
εoδ2oe+
[4µ4oeγoe|E|23δ4oeεo
+2µ2oeµ
2eb|E|2(γoe + γeb)
3δ2oeδ2ebεo
](14)
with δoe = ∆oe + iγoe and δeb = ∆eb + iγeb. Also the subscript “s” represents a
physical quantity corresponding to single quantum dot.
In obtaining (14), we have restricted ourselves to the low excitation intensity
regime and have used binomial approximation. The first term in (14) represents
the linear susceptibility while the terms in the square bracket corresponds to non-
linearity arising due to excitonic as well as biexcitonic transitions. One can also
notice from the same equation that both linear as well as nonlinear terms have
opposite contributions as is evident from their signs. As a result, the imaginary
part of the susceptibility arising due to linear term may be nullified by the non-
linear contribution at a certain excitation intensity level. Thus one can expect the
occurrence of gain beyond a threshold value of the electric field amplitude of the
pump such that Im(χ(3)) |E|2 > Im(χ(1)). The expression for the threshold field is
found to be
|E|2th =2δ2oeδ
2eb
4µ2oeδ2eb + 2(1 + γeb/γoe)µ2ebδ
2oe
. (15)
The above expression suggests that the threshold field will reduce with increasing
ratio of γeb/γoe showing that for samples possessing longer exciton lifetime as com-
pared to the biexciton lifetime the field required to produce nonlinearity will be
smaller.
2.2. Susceptibility of inhomogeneous distribution of
quantum dots (IDQ)
In this section, we have taken into account the susceptibility of inhomogeneous
distribution of QDS only and have neglected the effect of surrounding matrix on
it. In general the nanostructure fabrication gives an inhomogeneous distribution of
quantum dots. The presence of many QDs surrounding every individual QD leads
to an inhomogeneous broadening. In order to account for such collective effects we
have introduced a Gaussian size distribution F (λ) around a mean value ∆λ = xλowhere x is the percentage variation in the Gaussian width and λo is the average
dot size.12 Accordingly, for such inhomogeneous distribution of quantum dots, we
define the net complex susceptibility (χIDQ) obtainable from the effective induced
J. N
onlin
ear
Opt
ic. P
hys.
Mat
. 200
1.10
:355
-370
. Dow
nloa
ded
from
ww
w.w
orld
scie
ntif
ic.c
omby
PE
NN
SYL
VA
NIA
ST
AT
E U
NIV
ER
SIT
Y o
n 10
/02/
13. F
or p
erso
nal u
se o
nly.
November 19, 2001 9:35 WSPC/145-JNOPM 00070
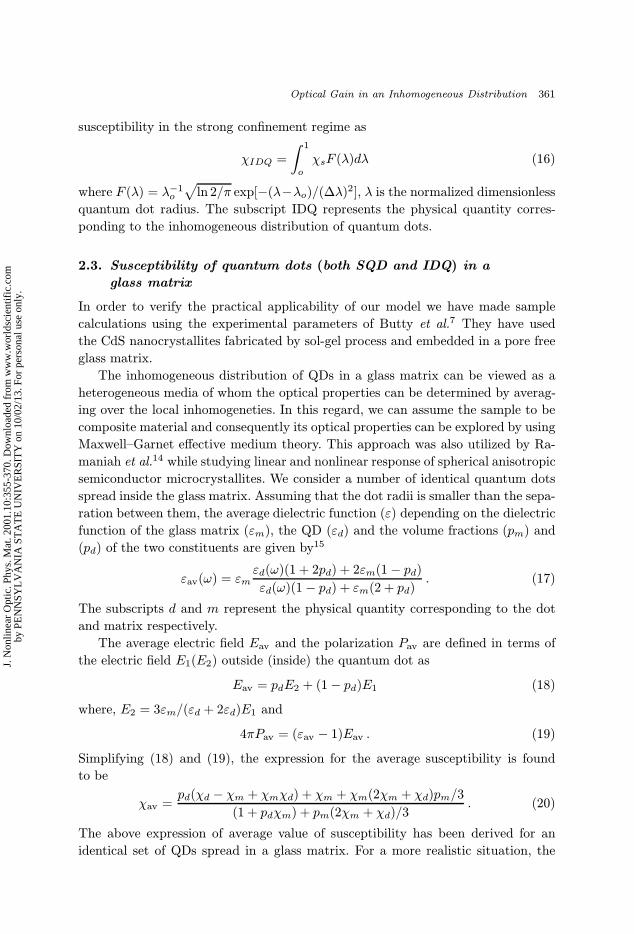
Optical Gain in an Inhomogeneous Distribution 361
susceptibility in the strong confinement regime as
χIDQ =
∫ 1o
χsF (λ)dλ (16)
where F (λ) = λ−1o√ln 2/π exp[−(λ−λo)/(∆λ)2], λ is the normalized dimensionless
quantum dot radius. The subscript IDQ represents the physical quantity corres-
ponding to the inhomogeneous distribution of quantum dots.
2.3. Susceptibility of quantum dots (both SQD and IDQ) in a
glass matrix
In order to verify the practical applicability of our model we have made sample
calculations using the experimental parameters of Butty et al.7 They have used
the CdS nanocrystallites fabricated by sol-gel process and embedded in a pore free
glass matrix.
The inhomogeneous distribution of QDs in a glass matrix can be viewed as a
heterogeneous media of whom the optical properties can be determined by averag-
ing over the local inhomogeneties. In this regard, we can assume the sample to be
composite material and consequently its optical properties can be explored by using
Maxwell–Garnet effective medium theory. This approach was also utilized by Ra-
maniah et al.14 while studying linear and nonlinear response of spherical anisotropic
semiconductor microcrystallites. We consider a number of identical quantum dots
spread inside the glass matrix. Assuming that the dot radii is smaller than the sepa-
ration between them, the average dielectric function (ε) depending on the dielectric
function of the glass matrix (εm), the QD (εd) and the volume fractions (pm) and
(pd) of the two constituents are given by15
εav(ω) = εmεd(ω)(1 + 2pd) + 2εm(1− pd)
εd(ω)(1− pd) + εm(2 + pd). (17)
The subscripts d and m represent the physical quantity corresponding to the dot
and matrix respectively.
The average electric field Eav and the polarization Pav are defined in terms of
the electric field E1(E2) outside (inside) the quantum dot as
Eav = pdE2 + (1− pd)E1 (18)
where, E2 = 3εm/(εd + 2εd)E1 and
4πPav = (εav − 1)Eav . (19)
Simplifying (18) and (19), the expression for the average susceptibility is found
to be
χav =pd(χd − χm + χmχd) + χm + χm(2χm + χd)pm/3
(1 + pdχm) + pm(2χm + χd)/3. (20)
The above expression of average value of susceptibility has been derived for an
identical set of QDs spread in a glass matrix. For a more realistic situation, the
J. N
onlin
ear
Opt
ic. P
hys.
Mat
. 200
1.10
:355
-370
. Dow
nloa
ded
from
ww
w.w
orld
scie
ntif
ic.c
omby
PE
NN
SYL
VA
NIA
ST
AT
E U
NIV
ER
SIT
Y o
n 10
/02/
13. F
or p
erso
nal u
se o
nly.
November 19, 2001 9:35 WSPC/145-JNOPM 00070
362 S. Banerjee & P. Sen
dot sizes generally vary and one is bound to take into account the inhomogeneous
distribution of QDs. For this purpose, the susceptibility for the IDQ has been
obtained by integrating the susceptibility of SQD over the Gaussian distribution
function and subsequently, the average susceptibility of IDQ in glass matrix is
obtained by replacing χd by χIDQ in Eq. (20).
3. Results and Discussions
This section aims at the study of nonlinear absorption and biexcitonic gain in CdS
quantum dots embedded in glass matrix. For this purpose the expressions of the
susceptibility given by Eqs. (14), (16) and (20) have been utilized to obtain the
absorption coefficient of SQD, IDQ, identical QDs embedded in glass matrix and
IDQ embedded in glass matrix respectively via the relation
α = −k Im(χ) . (21)
The validity of our theoretical model has been checked by applying our analysis
to experimental conditions of Butty et al.7 The system parameters are chosen as
follows:7,15 me = 0.14mo, mh = 1.35mo, γ−1oe = 2.27 ps, γeb = 2γoe, ∆E = 5.6 meV,
ωg = 2.56 eV, aB = 2.9 nm, εm = 2.23, εd = 6 and R = 1.75 nm. The different
roots of the Bessel function are taken to be κ10 = π, κ11 = 4.4934, κ12 = 5.765,
κ20 = 6.2832, κ21 = 7.7253, κ22 = 9.0950, κ30 = 9.4248 etc.
In order to explicitly analyze the effect of quantum dot size distribution as well
as the effect of matrix on absorption spectra we have obtained α from (21) for (i)
single QD (SQD) using Eqs. (14) (ii) inhomogeneous distribution of QDs (IDQ)
using Eq. (16) (iii) identical quantum dots in glass matrix making use of Eqs. (14)
and (20) and (iv) inhomogeneous distribution of QDs in glass matrix using Eqs. (16)
and (20). The average dot size was chosen to be 0.6 aB.
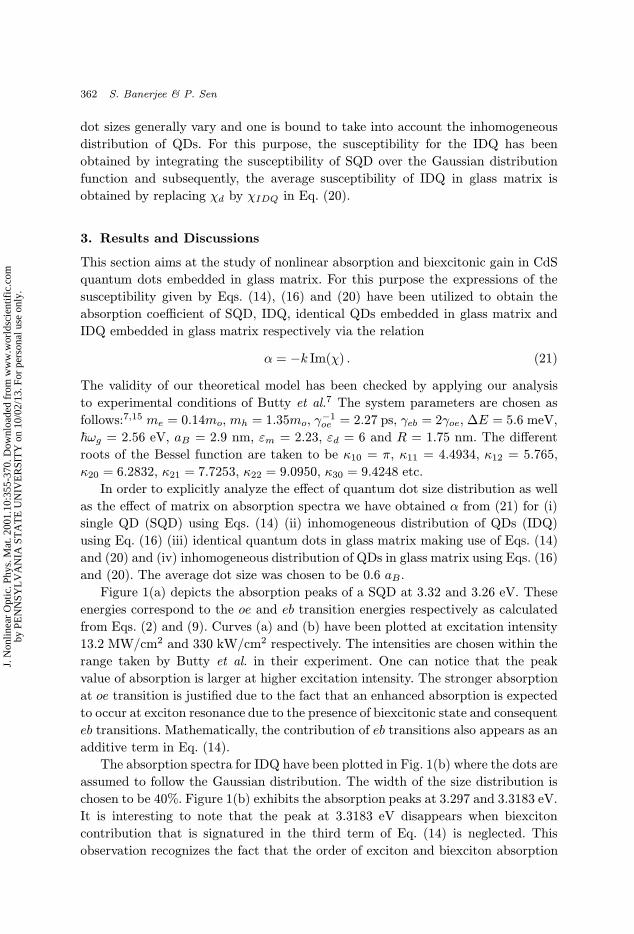
Figure 1(a) depicts the absorption peaks of a SQD at 3.32 and 3.26 eV. These
energies correspond to the oe and eb transition energies respectively as calculated
from Eqs. (2) and (9). Curves (a) and (b) have been plotted at excitation intensity
13.2 MW/cm2 and 330 kW/cm2 respectively. The intensities are chosen within the
range taken by Butty et al. in their experiment. One can notice that the peak
value of absorption is larger at higher excitation intensity. The stronger absorption
at oe transition is justified due to the fact that an enhanced absorption is expected
to occur at exciton resonance due to the presence of biexcitonic state and consequent
eb transitions. Mathematically, the contribution of eb transitions also appears as an
additive term in Eq. (14).
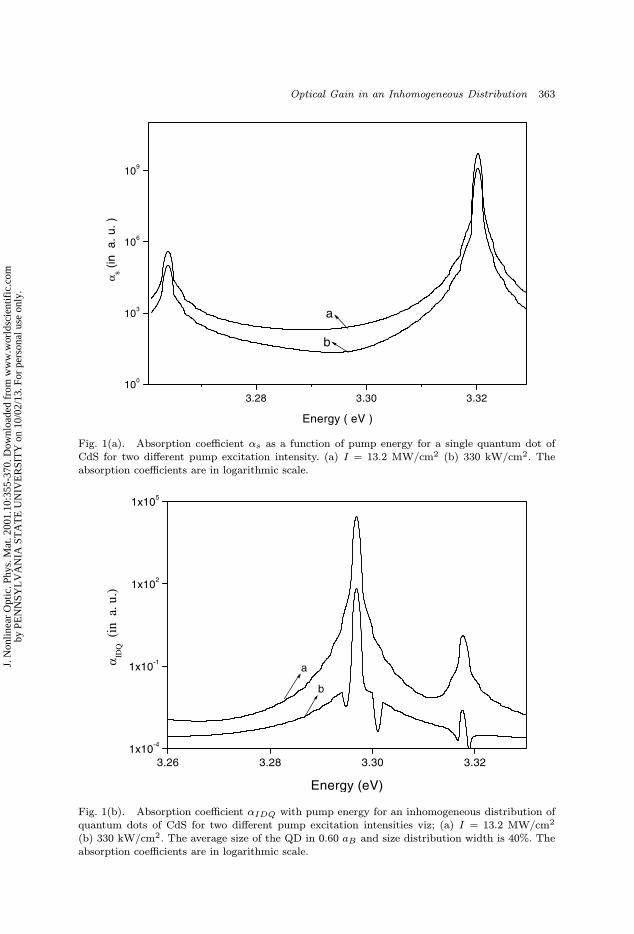
The absorption spectra for IDQ have been plotted in Fig. 1(b) where the dots are
assumed to follow the Gaussian distribution. The width of the size distribution is
chosen to be 40%. Figure 1(b) exhibits the absorption peaks at 3.297 and 3.3183 eV.
It is interesting to note that the peak at 3.3183 eV disappears when biexciton
contribution that is signatured in the third term of Eq. (14) is neglected. This
observation recognizes the fact that the order of exciton and biexciton absorption
J. N
onlin
ear
Opt
ic. P
hys.
Mat
. 200
1.10
:355
-370
. Dow
nloa
ded
from
ww
w.w
orld
scie
ntif
ic.c
omby
PE
NN
SYL
VA
NIA
ST
AT
E U
NIV
ER
SIT
Y o
n 10
/02/
13. F
or p
erso
nal u
se o
nly.
November 19, 2001 9:35 WSPC/145-JNOPM 00070
Optical Gain in an Inhomogeneous Distribution 363
3.28 3.30 3.32100
103
106
109
b
a
α s (in
a. u
. )
Energy ( eV )
Fig. 1(a). Absorption coefficient αs as a function of pump energy for a single quantum dot ofCdS for two different pump excitation intensity. (a) I = 13.2 MW/cm2 (b) 330 kW/cm2. Theabsorption coefficients are in logarithmic scale.
3.26 3.28 3.30 3.321x10⁻⁴
1x10⁻¹
1x10²
1x10⁵
b
aαID
Q (
in a
. u.)
Energy (eV)
Fig. 1(b). Absorption coefficient αIDQ with pump energy for an inhomogeneous distribution ofquantum dots of CdS for two different pump excitation intensities viz; (a) I = 13.2 MW/cm2
(b) 330 kW/cm2. The average size of the QD in 0.60 aB and size distribution width is 40%. Theabsorption coefficients are in logarithmic scale.
J. N
onlin
ear
Opt
ic. P
hys.
Mat
. 200
1.10
:355
-370
. Dow
nloa
ded
from
ww
w.w
orld
scie
ntif
ic.c
omby
PE
NN
SYL
VA
NIA
ST
AT
E U
NIV
ER
SIT
Y o
n 10
/02/
13. F
or p
erso
nal u
se o
nly.
November 19, 2001 9:35 WSPC/145-JNOPM 00070
364 S. Banerjee & P. Sen
peaks is reversed in case of IDQ as compared to SQD. Consequently, the absorption
peaks are not only shifted in the inhomogeneously distributed QDs but the peak
at low energy side is higher than the peak at high-energy side. The reversal is
interesting and demands a deeper insight into the understanding of the effect of QD
size distribution. For this purpose we have first concentrated on linear absorption
spectra.
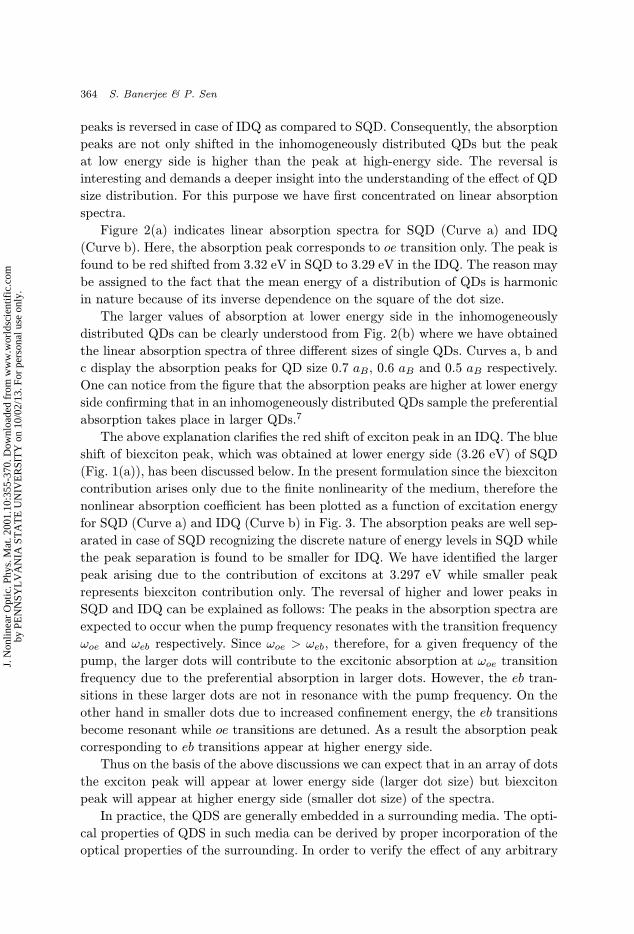
Figure 2(a) indicates linear absorption spectra for SQD (Curve a) and IDQ
(Curve b). Here, the absorption peak corresponds to oe transition only. The peak is
found to be red shifted from 3.32 eV in SQD to 3.29 eV in the IDQ. The reason may
be assigned to the fact that the mean energy of a distribution of QDs is harmonic
in nature because of its inverse dependence on the square of the dot size.
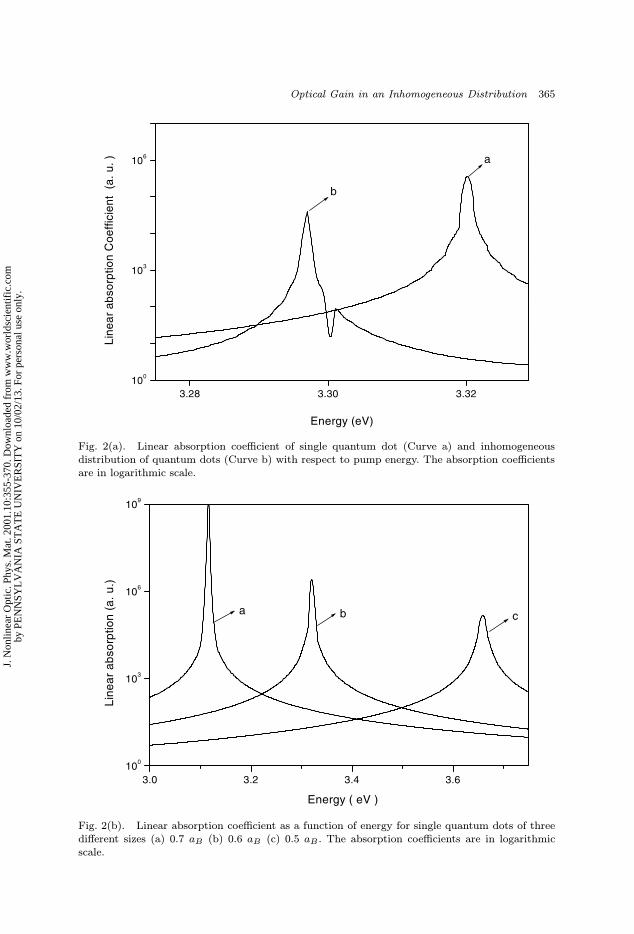
The larger values of absorption at lower energy side in the inhomogeneously
distributed QDs can be clearly understood from Fig. 2(b) where we have obtained
the linear absorption spectra of three different sizes of single QDs. Curves a, b and
c display the absorption peaks for QD size 0.7 aB, 0.6 aB and 0.5 aB respectively.
One can notice from the figure that the absorption peaks are higher at lower energy
side confirming that in an inhomogeneously distributed QDs sample the preferential
absorption takes place in larger QDs.7
The above explanation clarifies the red shift of exciton peak in an IDQ. The blue
shift of biexciton peak, which was obtained at lower energy side (3.26 eV) of SQD
(Fig. 1(a)), has been discussed below. In the present formulation since the biexciton
contribution arises only due to the finite nonlinearity of the medium, therefore the
nonlinear absorption coefficient has been plotted as a function of excitation energy
for SQD (Curve a) and IDQ (Curve b) in Fig. 3. The absorption peaks are well sep-
arated in case of SQD recognizing the discrete nature of energy levels in SQD while
the peak separation is found to be smaller for IDQ. We have identified the larger
peak arising due to the contribution of excitons at 3.297 eV while smaller peak
represents biexciton contribution only. The reversal of higher and lower peaks in
SQD and IDQ can be explained as follows: The peaks in the absorption spectra are
expected to occur when the pump frequency resonates with the transition frequency
ωoe and ωeb respectively. Since ωoe > ωeb, therefore, for a given frequency of the
pump, the larger dots will contribute to the excitonic absorption at ωoe transition
frequency due to the preferential absorption in larger dots. However, the eb tran-
sitions in these larger dots are not in resonance with the pump frequency. On the
other hand in smaller dots due to increased confinement energy, the eb transitions
become resonant while oe transitions are detuned. As a result the absorption peak
corresponding to eb transitions appear at higher energy side.
Thus on the basis of the above discussions we can expect that in an array of dots
the exciton peak will appear at lower energy side (larger dot size) but biexciton
peak will appear at higher energy side (smaller dot size) of the spectra.
In practice, the QDS are generally embedded in a surrounding media. The opti-
cal properties of QDS in such media can be derived by proper incorporation of the
optical properties of the surrounding. In order to verify the effect of any arbitrary
J. N
onlin
ear
Opt
ic. P
hys.
Mat
. 200
1.10
:355
-370
. Dow
nloa
ded
from
ww
w.w
orld
scie
ntif
ic.c
omby
PE
NN
SYL
VA
NIA
ST
AT
E U
NIV
ER
SIT
Y o
n 10
/02/
13. F
or p
erso
nal u
se o
nly.
November 19, 2001 9:35 WSPC/145-JNOPM 00070
Optical Gain in an Inhomogeneous Distribution 365
3.28 3.30 3.32100
103
106
b
a
Line
ar a
bsor
ptio
n C
oeffi
cien
t (a
. u. )
Energy (eV)
Fig. 2(a). Linear absorption coefficient of single quantum dot (Curve a) and inhomogeneousdistribution of quantum dots (Curve b) with respect to pump energy. The absorption coefficientsare in logarithmic scale.
3.0 3.2 3.4 3.6100
103
106
109
cba
Line
ar a
bsor
ptio
n (a
. u.)
Energy ( eV )
Fig. 2(b). Linear absorption coefficient as a function of energy for single quantum dots of threedifferent sizes (a) 0.7 aB (b) 0.6 aB (c) 0.5 aB . The absorption coefficients are in logarithmicscale.
J. N
onlin
ear
Opt
ic. P
hys.
Mat
. 200
1.10
:355
-370
. Dow
nloa
ded
from
ww
w.w
orld
scie
ntif
ic.c
omby
PE
NN
SYL
VA
NIA
ST
AT
E U
NIV
ER
SIT
Y o
n 10
/02/
13. F
or p
erso
nal u
se o
nly.
November 19, 2001 9:35 WSPC/145-JNOPM 00070
366 S. Banerjee & P. Sen
3.28 3.30 3.32100
103
106
109
b
a
Energy (e V)
Non
linea
r ab
sorp
tion
Coe
ffici
ent (
a. u
.)
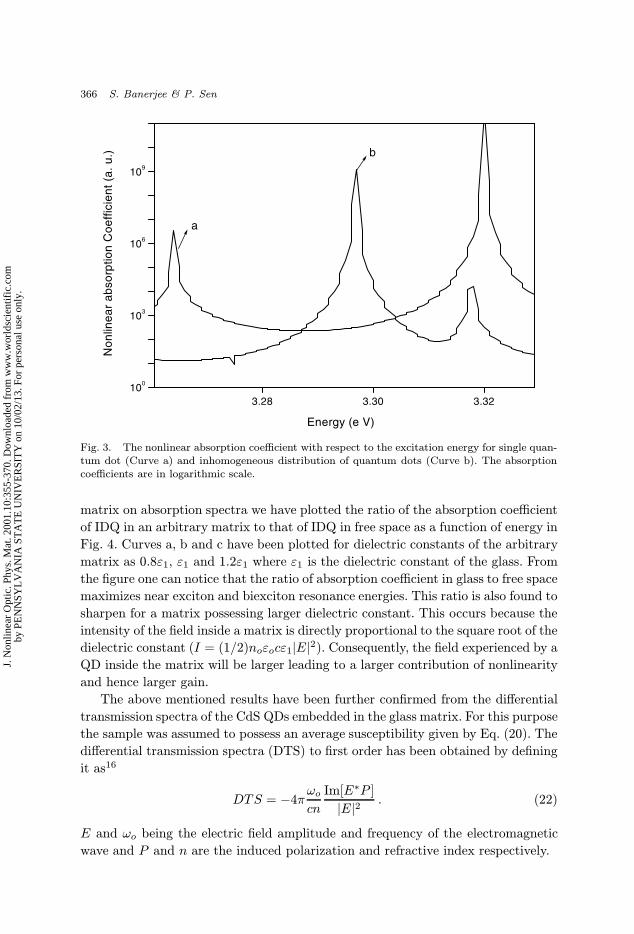
Fig. 3. The nonlinear absorption coefficient with respect to the excitation energy for single quan-tum dot (Curve a) and inhomogeneous distribution of quantum dots (Curve b). The absorptioncoefficients are in logarithmic scale.
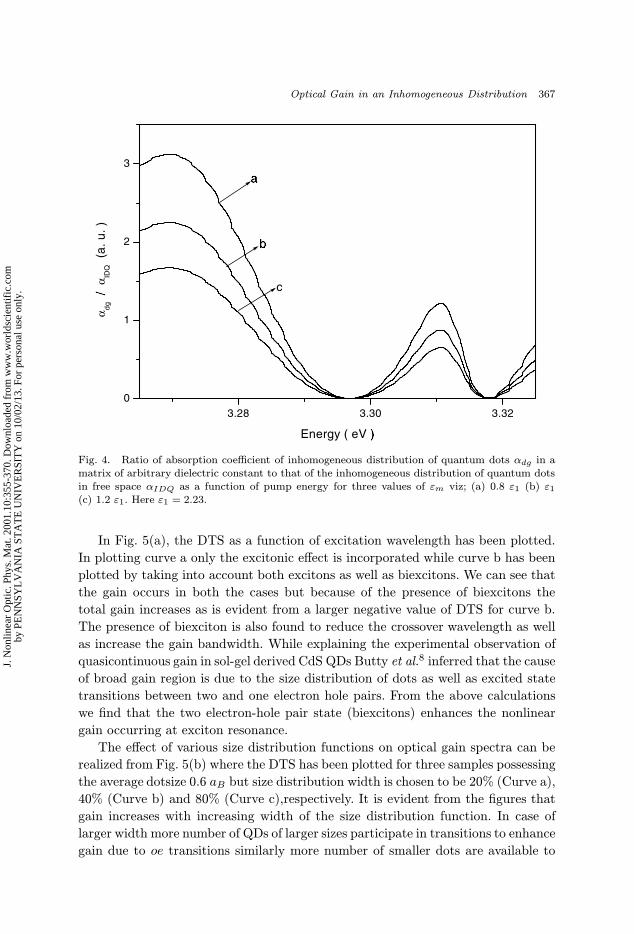
matrix on absorption spectra we have plotted the ratio of the absorption coefficient
of IDQ in an arbitrary matrix to that of IDQ in free space as a function of energy in
Fig. 4. Curves a, b and c have been plotted for dielectric constants of the arbitrary
matrix as 0.8ε1, ε1 and 1.2ε1 where ε1 is the dielectric constant of the glass. From
the figure one can notice that the ratio of absorption coefficient in glass to free space
maximizes near exciton and biexciton resonance energies. This ratio is also found to
sharpen for a matrix possessing larger dielectric constant. This occurs because the
intensity of the field inside a matrix is directly proportional to the square root of the
dielectric constant (I = (1/2)noεocε1|E|2). Consequently, the field experienced by aQD inside the matrix will be larger leading to a larger contribution of nonlinearity
and hence larger gain.
The above mentioned results have been further confirmed from the differential
transmission spectra of the CdS QDs embedded in the glass matrix. For this purpose
the sample was assumed to possess an average susceptibility given by Eq. (20). The
differential transmission spectra (DTS) to first order has been obtained by defining
it as16
DTS = −4πωo
cn
Im[E∗P ]
|E|2 . (22)
E and ωo being the electric field amplitude and frequency of the electromagnetic
wave and P and n are the induced polarization and refractive index respectively.
J. N
onlin
ear
Opt
ic. P
hys.
Mat
. 200
1.10
:355
-370
. Dow
nloa
ded
from
ww
w.w
orld
scie
ntif
ic.c
omby
PE
NN
SYL
VA
NIA
ST
AT
E U
NIV
ER
SIT
Y o
n 10
/02/
13. F
or p
erso
nal u
se o
nly.
November 19, 2001 9:35 WSPC/145-JNOPM 00070
Optical Gain in an Inhomogeneous Distribution 367
3.28 3.30 3.320
1
2
3
c
bR
aS
α dg /
T α IDQ (
a. u
. )
Energy ( eV )U
Fig. 4. Ratio of absorption coefficient of inhomogeneous distribution of quantum dots αdg in amatrix of arbitrary dielectric constant to that of the inhomogeneous distribution of quantum dotsin free space αIDQ as a function of pump energy for three values of εm viz; (a) 0.8 ε1 (b) ε1(c) 1.2 ε1. Here ε1 = 2.23.
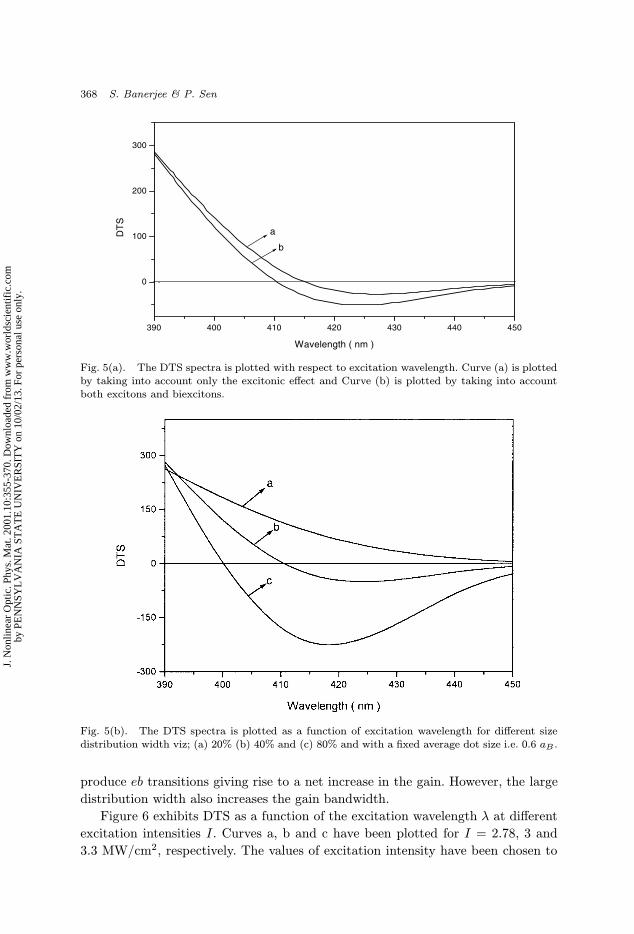
In Fig. 5(a), the DTS as a function of excitation wavelength has been plotted.
In plotting curve a only the excitonic effect is incorporated while curve b has been
plotted by taking into account both excitons as well as biexcitons. We can see that
the gain occurs in both the cases but because of the presence of biexcitons the
total gain increases as is evident from a larger negative value of DTS for curve b.
The presence of biexciton is also found to reduce the crossover wavelength as well
as increase the gain bandwidth. While explaining the experimental observation of
quasicontinuous gain in sol-gel derived CdS QDs Butty et al.8 inferred that the cause
of broad gain region is due to the size distribution of dots as well as excited state
transitions between two and one electron hole pairs. From the above calculations
we find that the two electron-hole pair state (biexcitons) enhances the nonlinear
gain occurring at exciton resonance.
The effect of various size distribution functions on optical gain spectra can be
realized from Fig. 5(b) where the DTS has been plotted for three samples possessing
the average dotsize 0.6 aB but size distribution width is chosen to be 20% (Curve a),
40% (Curve b) and 80% (Curve c),respectively. It is evident from the figures that
gain increases with increasing width of the size distribution function. In case of
larger width more number of QDs of larger sizes participate in transitions to enhance
gain due to oe transitions similarly more number of smaller dots are available to
J. N
onlin
ear
Opt
ic. P
hys.
Mat
. 200
1.10
:355
-370
. Dow
nloa
ded
from
ww
w.w
orld
scie
ntif
ic.c
omby
PE
NN
SYL
VA
NIA
ST
AT
E U
NIV
ER
SIT
Y o
n 10
/02/
13. F
or p
erso
nal u
se o
nly.
November 19, 2001 9:35 WSPC/145-JNOPM 00070
368 S. Banerjee & P. Sen
390 400 410 420 430 440 450
0
100
200
300
b
aDT
S
Wavelength ( nm )
Fig. 5(a). The DTS spectra is plotted with respect to excitation wavelength. Curve (a) is plottedby taking into account only the excitonic effect and Curve (b) is plotted by taking into accountboth excitons and biexcitons.
Fig. 5(b). The DTS spectra is plotted as a function of excitation wavelength for different sizedistribution width viz; (a) 20% (b) 40% and (c) 80% and with a fixed average dot size i.e. 0.6 aB .
produce eb transitions giving rise to a net increase in the gain. However, the large
distribution width also increases the gain bandwidth.
Figure 6 exhibits DTS as a function of the excitation wavelength λ at different
excitation intensities I. Curves a, b and c have been plotted for I = 2.78, 3 and
3.3 MW/cm2, respectively. The values of excitation intensity have been chosen to
J. N
onlin
ear
Opt
ic. P
hys.
Mat
. 200
1.10
:355
-370
. Dow
nloa
ded
from
ww
w.w
orld
scie
ntif
ic.c
omby
PE
NN
SYL
VA
NIA
ST
AT
E U
NIV
ER
SIT
Y o
n 10
/02/
13. F
or p
erso
nal u
se o
nly.
November 19, 2001 9:35 WSPC/145-JNOPM 00070
Optical Gain in an Inhomogeneous Distribution 369
400 410 420 430 440 450
-50
0
50
100
150
200
250
c
b
a
DT
S
Wavelength ( nm )
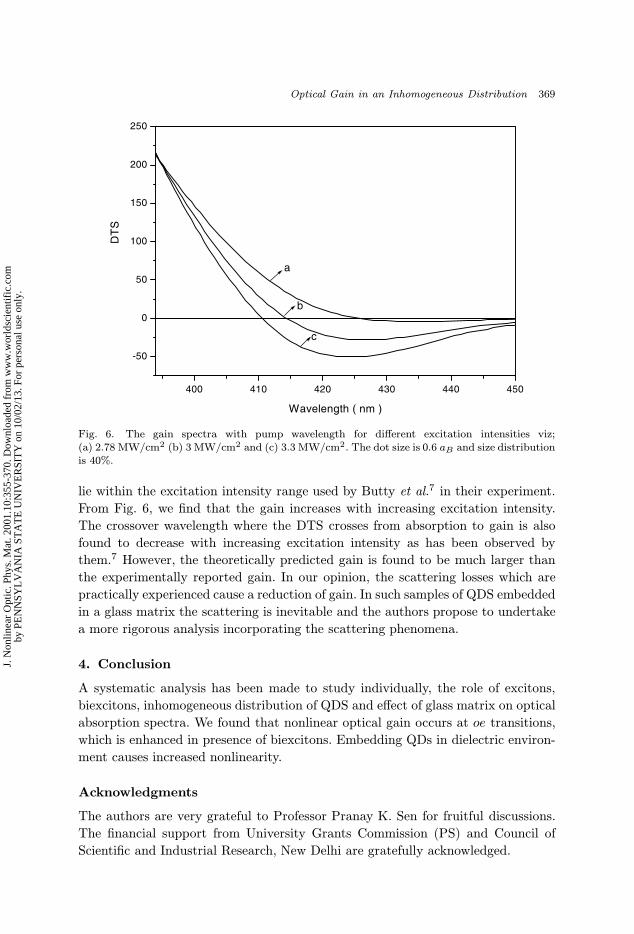
Fig. 6. The gain spectra with pump wavelength for different excitation intensities viz;(a) 2.78 MW/cm2 (b) 3 MW/cm2 and (c) 3.3 MW/cm2. The dot size is 0.6 aB and size distributionis 40%.
lie within the excitation intensity range used by Butty et al.7 in their experiment.
From Fig. 6, we find that the gain increases with increasing excitation intensity.
The crossover wavelength where the DTS crosses from absorption to gain is also
found to decrease with increasing excitation intensity as has been observed by
them.7 However, the theoretically predicted gain is found to be much larger than
the experimentally reported gain. In our opinion, the scattering losses which are
practically experienced cause a reduction of gain. In such samples of QDS embedded
in a glass matrix the scattering is inevitable and the authors propose to undertake
a more rigorous analysis incorporating the scattering phenomena.
4. Conclusion
A systematic analysis has been made to study individually, the role of excitons,
biexcitons, inhomogeneous distribution of QDS and effect of glass matrix on optical
absorption spectra. We found that nonlinear optical gain occurs at oe transitions,
which is enhanced in presence of biexcitons. Embedding QDs in dielectric environ-
ment causes increased nonlinearity.
Acknowledgments
The authors are very grateful to Professor Pranay K. Sen for fruitful discussions.
The financial support from University Grants Commission (PS) and Council of
Scientific and Industrial Research, New Delhi are gratefully acknowledged.
J. N
onlin
ear
Opt
ic. P
hys.
Mat
. 200
1.10
:355
-370
. Dow
nloa
ded
from
ww
w.w
orld
scie
ntif
ic.c
omby
PE
NN
SYL
VA
NIA
ST
AT
E U
NIV
ER
SIT
Y o
n 10
/02/
13. F
or p
erso
nal u
se o
nly.
November 19, 2001 9:35 WSPC/145-JNOPM 00070
370 S. Banerjee & P. Sen
References
1. D. A. B. Miller, D. S. Chemla and S. Schmitt-Rink, Optical Nonlinearitiesand Instabilities in Semiconductors, ed. H. Haug (Academic, San Diego, 1998),pp. 325–260.
2. T. Takagahara, Phys. Rev. B19, 10206 (1989).3. K. L. Shaklee, R. F. Leheny and R. E. Nahory, Phys. Rev. Lett. 26, 888 (1971).4. M. Ojima, Y. Oka, T. Kushida and S. Shionoya, Solid State Commun. 24, 845 (1977).5. D. A. Weinberger, N. Peyghambarian, M. C. Rushford and H. M. Gibbs, 1984 AnnualMeeting of Opt. Soc. Am. (San Diego, 1984), p. 31.
6. Y. Masumoto, T. Kawamura and K. Era, Appl. Phys. Lett. 63, 225 (1993).7. J. Butty, N. Peyghambarian, Y. H. Kao and J. D. Mackenzie, Appl. Phys. Lett. 69,
3224 (1996).8. J. Butty, Y. Z. Hu, N. Peyghambarian, Y. H. Kao and J. D. Mackenzie, Appl. Phys.Lett. 67, 2672 (1995).
9. J. T. Andrews and P. Sen, Superlattices and Microstructures 26, 171 (1999).10. Y. N. Hwang, C. M. Kim, S. C. Jeoung, D. Kim and S. H. Park, Phys. Rev. B61,
4496 (2000).11. L. Banyai and S. W. Koch, Semiconductor Quantum Dots (World Scientific,
Singapore, 1993), Chaps. 1–5.12. P. K. Basu, in Theory of Optical Processes in Semiconductors: Bulk and Microstruc-
ture (Clarendon, Oxford, 1997), pp. 352–358.13. W. Y. Wu, J. N. Schuan, T. Y. Hsu and U. Efron, Appl. Phys. Lett. 51, 710 (1987).14. L. M. Ramaniah, S. V. Nair and K. C. Rustagi, Phys. Rev. B40, 12423 (1989).15. U. Woggon, Optical Properties of Semiconductor Quantum Dots (Springer, Berlin,
1997), Chap. 4.16. R. Binder and S. W. Koch, Prog. Quantum Electron. 19, 307 (1995).
J. N
onlin
ear
Opt
ic. P
hys.
Mat
. 200
1.10
:355
-370
. Dow
nloa
ded
from
ww
w.w
orld
scie
ntif
ic.c
omby
PE
NN
SYL
VA
NIA
ST
AT
E U
NIV
ER
SIT
Y o
n 10
/02/
13. F
or p
erso
nal u
se o
nly.


![Doubling the power conversion efficiency in CdS/CdSe ...depts.washington.edu/solgel/documents/pub_docs/... · CdS and CdSe quantum dots can be readily achieved by SILAR, CBD [28,29],](https://img.pdfslide.us/doc/110x75/5f3532bb4a6b004308045dd8/doubling-the-power-conversion-efficiency-in-cdscdse-depts-cds-and-cdse-quantum.jpg)


![High-efficiency CdTe/CdS core-shell nanocrystals in water ... · Semiconductor quantum dots (QDs) have found important applications including biological labeling , 2], light-emitting](https://img.pdfslide.us/doc/110x75/5f0d67d67e708231d43a319f/high-efficiency-cdtecds-core-shell-nanocrystals-in-water-semiconductor-quantum.jpg)