Embed Size (px)
Citation preview
242 IEEE TRANSACTIONS ON INSTRUMENTATION A N D MEASUREMENT. VOL. 39. NO. I , FEBRUARY 1990
Optical Detection and Localization of Holes in Strips Using a Fluorescent Fiber Sensor
Abstract-A new noncontact sensor has been developed to detect de- fects in sheet strips arising from opacity variation or lack-of-matter like holes, cracks, rendings, and thickness variation of transparent film. It uses a fluorescent plastic optical fiber and a large luminescent source. A physical model has been developed and computer simulations have been performed in order to analyze the influence of all system param- eters. Numerous experimental results are presented and good agree- ment is observed with the theoretical model.
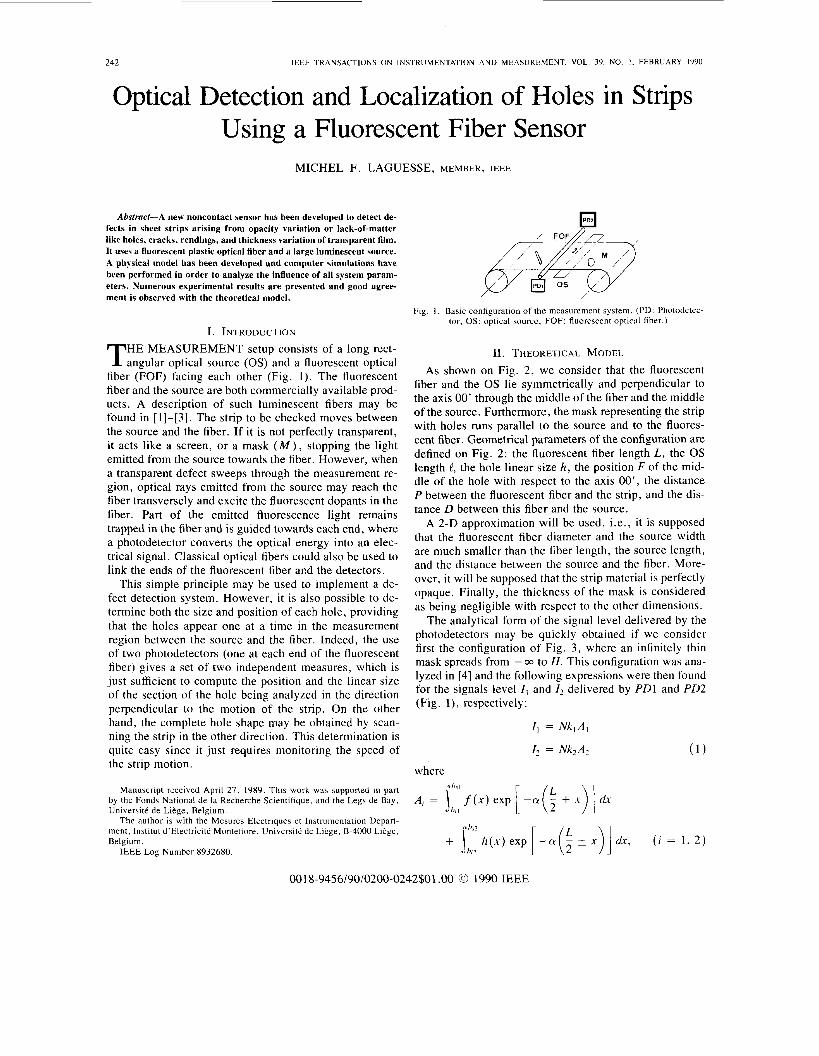
I. INTRODUCTION HE MEASUREMENT setup consists of a long rect- T angular optical source (OS) and a fluorescent optical
fiber (FOF) facing each other (Fig. 1). The fluorescent fiber and the source are both commercially available prod- ucts. A description of such luminescent fibers may be found in [ 11-[3]. The strip to be checked moves between the source and the fiber. If it is not perfectly transparent, it acts like a screen, or a mask ( M ) , stopping the light emitted from the source towards the fiber. However, when a transparent defect sweeps through the measurement re- gion, optical rays emitted from the source may reach the fiber transversely and excite the fluorescent dopants in the fiber. Part of the emitted fluorescence light remains trapped in the fiber and is guided towards each end, where a photodetector converts the optical energy into an elec- trical signal. Classical optical fibers could also be used to link the ends of the fluorescent fiber and the detectors.
This simple principle may be used to implement a de- fect detection system. However, it is also possible to de- termine both the size and position of each hole, providing that the holes appear one at a time in the measurement region between the source and the fiber. Indeed, the use of two photodetectors (one at each end of the fluorescent fiber) gives a set of two independent measures, which is just sufficient to compute the position and the linear size of the section of the hole being analyzed in the direction perpendicular to the motion of the strip. On the other hand, the complete hole shape may be obtained by scan- ning the strip in the other direction. This determination is quite easy since it just requires monitoring the speed of the strip motion.
Manuscript received April 27, 1989. This work was supported in part by the Fonds National de la Recherche Scientifique, and the Legs de Bay, UniversitC de Likge, Belgium.
The author is with the Mesures Electriques et Instrumentation Depart- ment, Institut d’ElectricitC Montefiore, Universite de Liege, B-4000 Liege, Belgium.
IEEE Log Number 8932680.
Fig. 1. Basic configuration of the measurement system. (PD: Photodetec- tor, OS: optical source, FOF: fluorescent optical fiber.)
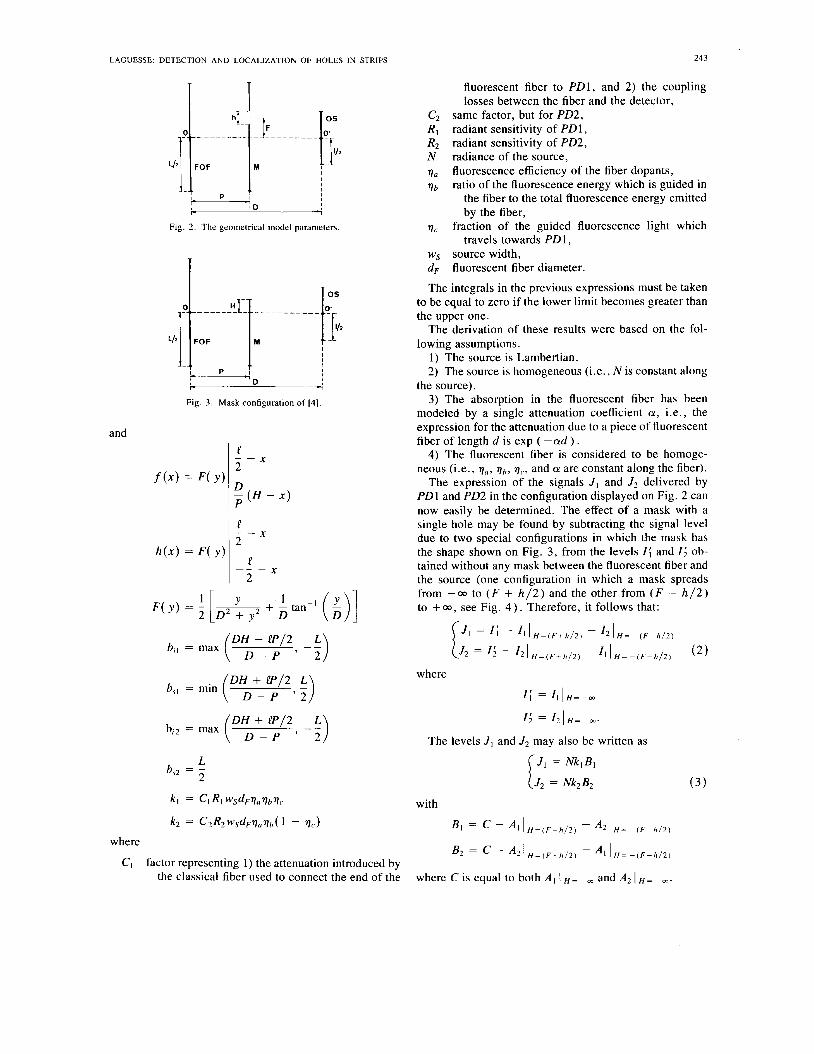
11. THEORETICAL MODEL As shown on Fig. 2, we consider that the fluorescent
fiber and the OS lie symmetrically and perpendicular to the axis 00’ through the middle of the fiber and the middle of the source. Furthermore, the mask representing the strip with holes runs parallel to the source and to the fluores- cent fiber. Geometrical parameters of the configuration are defined on Fig. 2: the fluorescent fiber length L, the OS length e, the hole linear size h, the position F of the mid- dle of the hole with respect to the axis 00’, the distance P between the fluorescent fiber and the strip, and the dis- tance D between this fiber and the source.
A 2-D approximation will be used, i.e., it is supposed that the fluorescent fiber diameter and the source width are much smaller than the fiber length, the source length, and the distance between the source and the fiber. More- over, it will be supposed that the strip material is perfectly opaque. Finally, the thickness of the mask is considered as being negligible with respect to the other dimensions.
The analytical form of the signal level delivered by the photodetectors may be quickly obtained if we consider first the configuration of Fig. 3 , where an infinitely thin mask spreads from - 03 to H . This configuration was ana- lyzed in [4] and the following expressions were then found for the signals level I , and I, delivered by PD1 and PD2 (Fig. l ) , respectively:
I, = N k l A l
I , = Nk,A? ( 1 )
where
001 8-9456/90/0200-0242$01 .OO O 1990 IEEE
LAGUESSE: DETECTION AND LOCALIZATION OF HOLES IN STRIPS
Fig. 2. The geometrical model parameters.
T
Fig. 3. Mask configuration of 141.
and e 2 - - x
f ( x ) = F ( Y ) - ( H - x) P
bSl = min
biz = max ( D y f / ' , -4) L b = -
s2 2
k l = CI W S d F T a ~ b ~ c
k2 = C2R2WSdF9a916(1 - q c )
where
C , factor representing 1) the attenuation introduced by the classical fiber used to connect the end of the
~
where C is equal to both A I 1 p m and A2 I H = --.
243
fluorescent fiber to P D l , and 2 ) the coupling losses between the fiber and the detector,
same factor, but for PD2, radiant sensitivity of PD1, radiant sensitivity of PD2, radiance of the source, fluorescence efficiency of the fiber dopants, ratio of the fluorescence energy which is guided in
the fiber to the total fluorescence energy emitted by the fiber,
fraction of the guided fluorescence light which travels towards PD1,
source width, fluorescent fiber diameter.
The integrals in the previous expressions must be taken to be equal to zero if the lower limit becomes greater than the upper one.
The derivation of these results were based on the fol- lowing assumptions.
1 ) The source is Lambertian. 2 ) The source is homogeneous (i.e., N is constant along
the source). 3) The absorption in the fluorescent fiber has been
modeled by a single attenuation coefficient a , i.e., the expression for the attenuation due to a piece of fluorescent fiber of length d is exp ( -ad ) .
4) The fluorescent fiber is considered to be homoge- neous (i.e., va, vb, qc , and a are constant along the fiber).
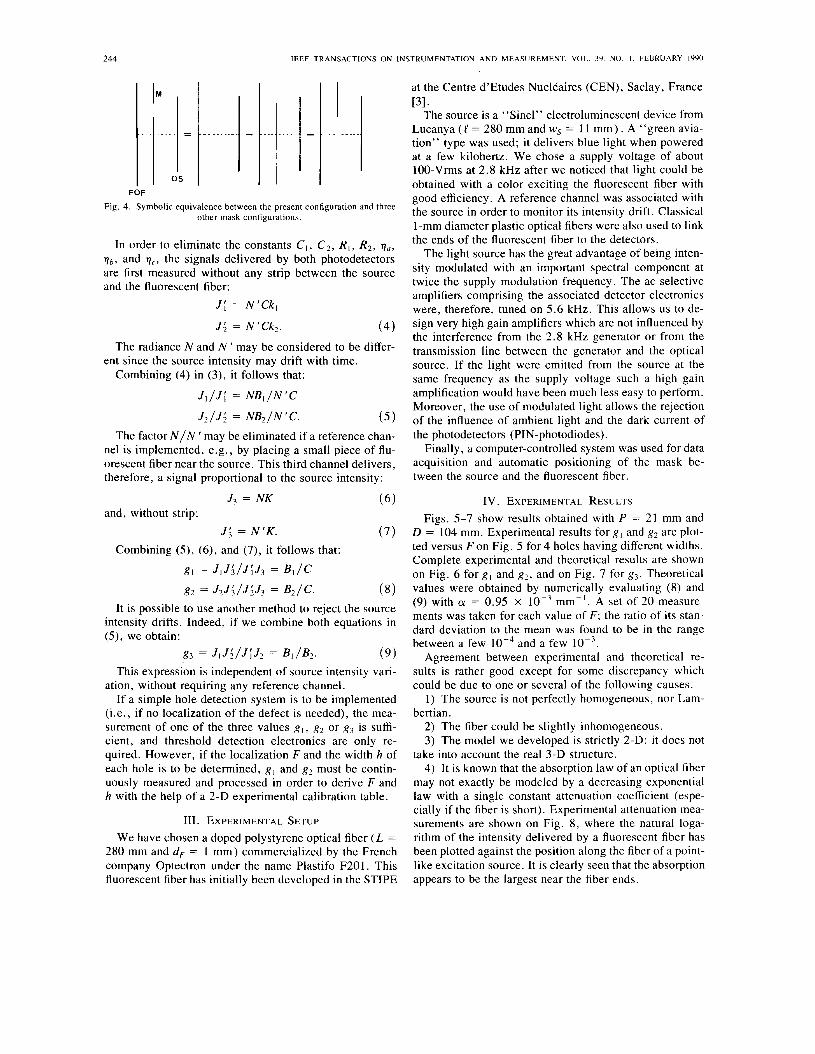
The expression of the signals J I and J 2 delivered by PD1 and PD2 in the configuration displayed on Fig. 2 can now easily be determined. The effect of a mask with a single hole may be found by subtracting the signal level due to two special configurations in which the mask has the shape shown on Fig. 3 , from the levels Z; and Z; ob- tained without any mask between the fluorescent fiber and the source (one configuration in which a mask spreads from --oo to ( F + h / 2 ) and the other from ( F - h / 2 ) to +a, see Fig. 4 ) . Therefore, it follows that:
where
The levels J l and J 2 may also be written as
[ J 1 = N k l B l
(J2 = Nk2B2
with
( 3 )
244 IEEE TRANSACTIONS ON II VSTRUMENTATION A N D MEASUREMENT. VOL. 39. NO. I . FEBRUARY 1990
FOF
Fig. 4. Symbolic equivalence between the present configuration and three other mask configurations.
In order to eliminate the constants C I , C 2 , R I , R 2 , qa, 176, and qc, the signals delivered by both photodetectors are first measured without any strip between the source and the fluorescent fiber:
J i = N ’ C k l
J ; = N ’ C k 2 . (4)
The radiance N and N ’ may be considered to be differ-
Combining (4) in ( 3 ) , it follows that: ent since the source intensity may drift with time.
J l / J i = N B l / N ’ C
J 2 / J ; = N B 2 / N ’ C . ( 5 ) The factor N / N ’ may be eliminated if a reference chan-
nel is implemented, e.g. , by placing a small piece of flu- orescent fiber near the source. This third channel delivers, therefore, a signal proportional to the source intensity:
and, without strip: J3 = N K (6)
J ; = N ’ K . (7) Combining ( 5 ) , (6), and (7), it follows that:
g1 J I J ; / J i J 3 = B I / C
at the Centre d’Etudes Nucltaires (CEN), Saclay, France
The source is a “Sinel” electroluminescent device from Lucanya ( P = 280 mm and ws = 1 1 mm) . A “green avia- tion” type was used; it delivers blue light when powered at a few kilohertz. We chose a supply voltage of about 100-Vrms at 2.8 kHz after we noticed that light could be obtained with a color exciting the fluorescent fiber with good efficiency. A reference channel was associated with the source in order to monitor its intensity drift. Classical 1 -mm diameter plastic optical fibers were also used to link the ends of the fluorescent fiber to the detectors.
The light source has the great advantage of being inten- sity modulated with an important spectral component at twice the supply modulation frequency. The ac selective amplifiers comprising the associated detector electronics were, therefore, tuned on 5.6 kHz. This allows us to de- sign very high gain amplifiers which are not influenced by the interference from the 2.8 kHz generator or from the transmission line between the generator and the optical source. If the light were emitted from the source at the same frequency as the supply voltage such a high gain amplification would have been much less easy to perform. Moreover, the use of modulated light allows the rejection of the influence of ambient light and the dark current of the photodetectors (PIN-photodiodes).
Finally, a computer-controlled system was used for data acquisition and automatic positioning of the mask be- tween the source and the fluorescent fiber.
[31.
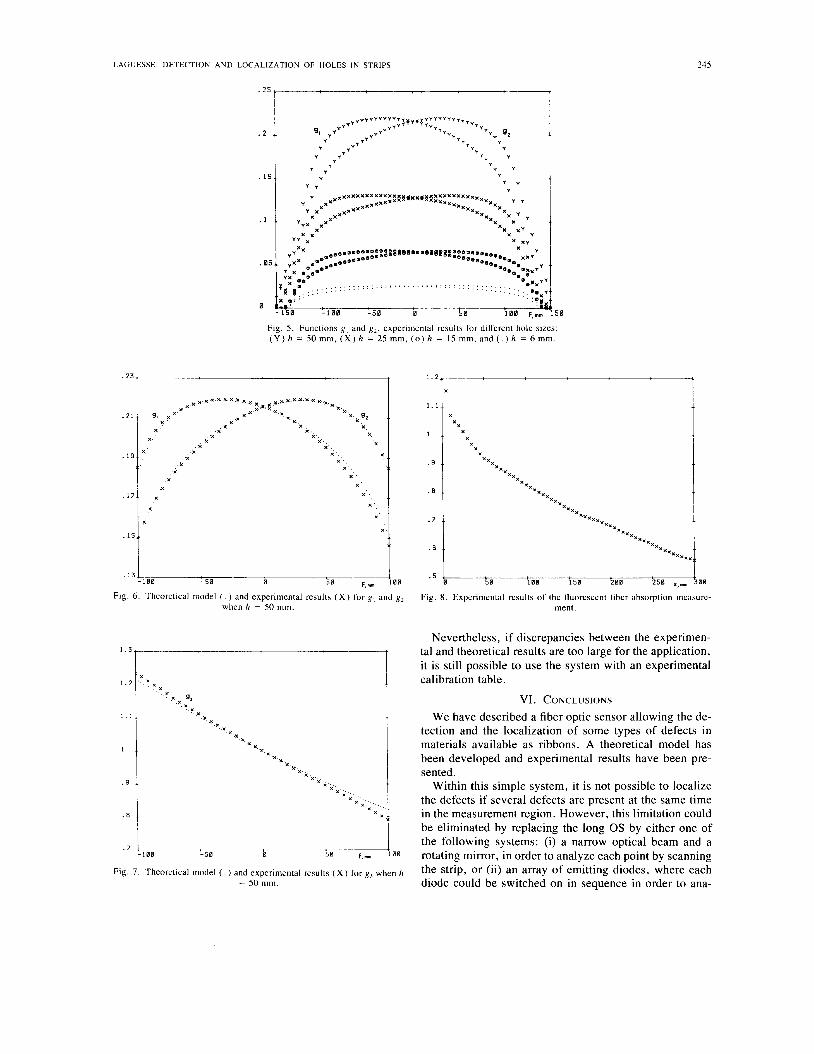
IV. EXPERIMENTAL RESULTS Figs. 5-7 show results obtained with P = 21 mm and
D = 104 mm. Experimental results for g , and g2 are plot- ted versus F on Fig. 5 for 4 holes having different widths. Complete experimental and theoretical results are shown on Fig. 6 for g , and g 2 , and on Fig. 7 for g3. Theoretical
g2 = JZJ; /J;J3 = B 2 / C . ( 8 ) It is possible to use another method to reject the source
intensity drifts. Indeed, if we combine both equations in ( 5 ) , we obtain:
g3 = JI J ; / J i 52 = Bl / B 2 . (9)
values were obtained by numerically evaluating (8) and (9) with a = 0.95 X mm-’. A set of 20 measure- ments was taken for each value of F; the ratio of its stan- dard deviation to the mean was found to be in the range between a few and a few lop3.
Agreement between experimental and theoretical re- This expression is independent of source intensity vari-
ation, without requiring any reference channel. If a simple hole detection system is to be implemented
(i.e., if no localization of the defect is needed), the mea- surement of one of the three values g , , g2 or g3 is suffi- cient, and threshold detection electronics are only re- quired. However, if the localization F and the width h of each hole is to be determined, g l and g2 must be contin- uously measured and processed in order to derive F and h with the help of a 2-D experimental calibration table.
111. EXPERIMENTAL SETUP We have chosen a doped polystyrene optical fiber ( L =
280 mm and dF = 1 mm) commercialized by the French company Optectron under the name Plastifo F201. This fluorescent fiber has initially been developed in the STIPE
sults is rather good except for some discrepancy which could be due to one or several of the following causes.
1) The source is not perfectly homogeneous, nor Lam- bertian.
2) The fiber could be slightly inhomogeneous. 3 ) The model we developed is strictly 2-D: it does not
take into account the real 3-D structure. 4) It is known that the absorption law of an optical fiber
may not exactly be modeled by a decreasing exponential law with a single constant attenuation coefficient (espe- cially if the fiber is short). Experimental attenuation mea- surements are shown on Fig. 8, where the natural loga- rithm of the intensity delivered by a fluorescent fiber has been plotted against the position along the fiber of a point- like excitation source. It is clearly seen that the absorption appears to be the largest near the fiber ends.
LAGUESSE: DETECTION AND LOCALIZATION OF HOLES IN STRIPS
x
. 2 ..
. 15 ..
I<
Y
Y Y
Fig. 5 . Functions g , and gz, experimental results for different hole sizes: ( Y ) h = 50 mm, ( X ) h = 25 mm, ( 0 ) h = 15 mm, and ( . ) h = 6 mm.
245
L 58
'231
X X
.Ill; .15 x .
.x;..,j X.
.13 0 -100 -50 F,mm l E O
Fig. 6 . Theoretical model ( . ) and experimental results ( X ) for g, and gz when h = 50 mm.
1
1'31
.' - e 1 0 0
Fig. 7. Theoretical model ( . ) and experimental results ( X ) for g, when h = SO mm.
1.2
x 7
.5 J 50
I 108 150 200 250 x,nm 5 0 0
Fig. 8 . Experimental results of the fluorescent fiber absorption measure- ment.
Nevertheless, if discrepancies between the experimen- tal and theoretical results are too large for the application, it is still possible to use the system with an experimental calibration table.
VI. CONCLUSIONS We have described a fiber optic sensor allowing the de-
tection and the localization of some types of defects in materials available as ribbons. A theoretical model has been developed and experimental results have been pre- sented.
Within this simple system, it is not possible to localize the defects if several defects are present at the same time in the measurement region. However, this limitation could be eliminated by replacing the long OS by either one of the following systems: (i) a narrow optical beam and a rotating mirror, in order to analyze each point by scanning the strip, or (ii) an array of emitting diodes, where each diode could be switched on in sequence in order to ana-

246 IEEE TRANSACTIONS ON INSTRUMENTATION A N D MEASUREMENT. VOL. 39. NO. I , FEBRUARY I Y Y O
lyze parts of the strip separately [ 5 ] . Notice that, in the REFERENCES latter configurations~ green LED’s even be used in- stead of (more expensive and less powerful) blue ones,
[ I ] L. Reiffel and N . S. Kapani, “Some considerations on luminescent fiber chambers and intensifier screens,” Rev. Sci. Instrum., vol. 3 I , p. 1136, 1960.
Academic, 1967, chaps. 2, 12.
since a new red fluorescent fiber showing an excitation maximum near 560 nm has recently been introduced by [2] N. S . Kapani, Fiber Optics; Principles and Applications. New York:
Optectron. [3] H. Blumenfeld, M. Bourdinaud and J . C. Thevenin, “Plastic fibers in high energy physics,” Nucl. Instrum. Methods, A257, p. 603. 1987.
[4] M. Laguesse, “Optical position sensor using fluorescent fiber and long luminescent source,” IEEE Trans. Instrum. Meas., vol. 38, pp. 804-
[SI M. Laguesse, “Opacity variation detection system for strip defects
ACKNOWLEDGMENT The author wishes to thank Prof. H. W . Vander- 810, June 1989.
schueren for his encouragement and Dr. M . *usloos for carefully reading the manuscript. determination,” to be published.