Embed Size (px)
Citation preview

Materials Research.
Optical Characterization of Europium-doped Indium Hydroxide Nanocubes Obtained by Microwave-Assisted Hydrothermal Method
Fabiana Villela da Mottaa*, Ana Paula de Azevedo Marquesb, Vinícius Dantas de Araújoa,
Mara Tatiane de Souza Tavaresa, Mauricio Roberto Bomio Delmontea, Carlos Alberto Paskocimasa,
Máximo Siu Lic, Rubens Maribondo do Nascimentoa, Elson Longod
aDepartamento de Engenharia de Materiais – DEMAT, Centro de Tecnologia – CT, Universidade Federal do Rio Grande do Norte – UFRN, Av. Sen. Salgado Filho, 3000,
CEP 59072-970, Natal, RN, Brazil bUniversidade Federal de São Paulo – UNIFESP, Rua Prof. Artur Riedel, 275,
CEP 09972-270, Diadema, SP, Brasil cInstituto de Física de São Carlos – IFSC, Universidade de São Paulo – USP, Av. Trabalhador São Carlense, 400, CEP 13566-590, São Carlos, SP, Brazil
dLaboratório Interdisciplinar de Eletroquímica e Cerâmica – LIEC, Instituto de Química – IQ, Universidade Estadual Paulista – UNESP,
Rua Francisco Degni s/n, CEP 14801-907, Araraquara, SP, Brazil
Received: November 25, 2013; Revised: April 6, 2014
Crystalline europium-doped indium hydroxide (In(OH)3:Eu) nanostructures were prepared by rapid
and efficient Microwave-Assisted Hydrothermal (MAH) method. Nanostructures were obtained at low temperature. FE-SEM images confirm that these samples are composed of 3D nanostructures. XRD, optical diffuse reflectance and photoluminescence (PL) measurements were used to characterize the products. Emission spectra of europium-doped indium hydroxide (IH:xEu) samples under excitation (350.7 nm) presented broad band emission regarding the indium hydroxide (IH) matrix and 5D
0 → 7F
0,
5D0 → 7F
1, 5D
0 → 7F
2, 5D
0 → 7F
3 and 5D
0 → 7F
4 europium transitions at 582, 596, 618, 653 and 701 nm,
respectively. Relative intensities of Eu3+ emissions increased as the concentration of this ion increased from 0, 1, 2, 4 and 8 mol %, of Eu3+, but the luminescence is drastically quenched for the IH matrix.
Keywords: indium hydroxide, europium, Microwave-Assisted Hydrothermal, nanostructures
1. IntroductionSelf-assembled micro-, meso- and nanostructures with
specific morphology, novel properties and wide application potential in many fields are of great interest to chemists and material scientists due to their fundamental significance for addressing some basic issues of the quantum confinement effect and space-confined transport phenomena as well as their potential applications as advanced materials in functional nanodevices1.
Indium hydroxides, oxyhydroxides, and oxides are important semiconductor materials, which have attracted much attention in the past decade. Cubic In(OH)
3,
orthorhombic InOOH, and cubic and hexagonal In2O
3 are
their common phases2. In(OH)3 is a wide-gap semiconductor
with Eg = 5.15 eV, with applications as a photocatalyst, among others3-5. InOOH (Eg = 3.5 eV) is also a typical wide-gap semiconductor6. Both cubic and hexagonal In
2O
3 are
good n-type semiconductors with band gaps of 3.55-3.75 eV (which is close to that of GaN), which have been widely used as solar cells7, transparent conductors8, and sensors2.
Regarding indium hydroxide (IH), Shi et al.9 recently reported a IH truncated polyhedral microcrystal formation via conventional hydrothermal treatment at 180°C for 16 h and 18 h that showed PL spectrum with two emission peaks at 496.6 and 419.2 nm using excitation wavelength (380 nm at room temperature). Yan et al.4 showed a broad band PL blue-green emission peak of IH nanocubes centered at 480 nm.
Rare earth ions such as Eu3+ can be added to semiconductors to increase PL. Europium in its trivalent state is one of the most studied among rare earth ions by luminescence spectroscopy due to the simplicity of its spectra and wide application as red phosphor in color TV screens. This ion has also attracted significant research attention due to its potential application as biological sensors, phosphors, electroluminescent devices, optical amplifiers or lasers when used as doping in a variety of materials10,11. Dutta et al.12 showed Eu3+ and Dy3+ doped indium oxide nanoparticles synthesized by a sonochemical technique. Eu3+ transitions were observed after excitation at 235 nm which is possibly due to the highly strained and *e-mail: [email protected]
Motta et al. Materials Research
distorted environment around Eu3+ ions in the In2O
3 lattice
matrix.Indium hydroxides with different morphology such as
spheres13, flowers14,15, cubes16-22, rods23,24, etc., have been synthesized by several synthesis methods. The physical and chemical properties of these powders can be influenced by particle shape and size distribution, which depend on the synthesis method. Conventional hydrothermal synthesis has been used to obtain IH structures using a simple, practical and environmentally friendly method4,13,18.
Komarneni et al.25 proposed the use of microwave radiation in the hydrothermal system by promoting the development of a new technique offering reaction kinetic enhancement, formation of materials with different morphology, low synthesis temperature and reduced processing times. Recently, Microwave-Assisted Hydrothermal (MAH) method was successfully used to obtain IH[21] and other oxides such as ZnO[26,27], BaTiO
3[28]
,
CuO[29], SrMoO4[30], CeO
2[31] and BaMoO
4[32].
In previous publications17,33, the synthesis and characterization of efficient luminescent indium hydroxides nanostructures, pure and doped with Tb3+, was described and it was verified that these materials are highly promising candidates for electronic and optical applications. Thus, studies on the effect of different rare earth dopants, such as Eu3+, on the synthesis and optical properties of indium hydroxide nanostructures synthesized by the MAH method are required to improve the scientific knowledge regarding future photoluminescent applications.
In this paper, we report the synthesis of In(OH)3:Eu
(IH:xEu) nanostructures with concentrations of x = 0, 1,
2, 4 and 8 mol % of Eu3+ using the MAH method at a low temperature of 140°C for 30 min. IH:Eu nanoarchitectures, the morphology and PL properties of these samples were investigated.
2. Experimental ProceduresUsing the previously reported MAH method33,
In(OH)3:Eu (IH:xEu) powders were obtained. About 3.6
Mmol of Indium (III) chloride (99% purity, Aldrich) and europium nitrate were dissolved in 80 mL of deionized water under constant stirring. Europium nitrate reagent was obtained by adding nitric acid to europium (III) oxide (Aldrich, USA, 99.999%) at 70°C. Eu3+ ion was added in the following percentages: 0, 1, 2, 4 and 8 mol %. The solution pH was adjusted to 10 by adding NH
4OH. After stirring for
10 min, 1 mL of polyethyleneglycol PEG (Mw 600) was added to the solution, and the mixture was then transferred to a Teflon autoclave. The system was sealed and placed in domestic microwave oven (2.45 GHz, maximum power of 800 W). The reaction system was heat treated at 140°C for 30 min (heating rate fixed at 25°C/min).
After MAH treatment, the white precipitate was washed with distilled water and dried at room temperature. The powders were characterized by X-ray diffraction (XRD) using Rigaku diffractometer (Model D/max-2500/PC) with Cu Kα radiation. IH morphology and size were observed by field emission scanning electron microscopy (FE-SEM; Jeol JSM 6330F) images. UV–Vis reflectance spectra of IH powders were taken using Cary 5G equipment. PL spectra
were measured using Thermal Jarrel-Ash Monospec 27 monochromator and Hamamatsu R446 photomultiplier. The 350.7 nm line of a krypton ion laser (Coherent Innova 90 K) was used as the excitation source with output power of lasers kept at 200 mW. All measurements were taken at room temperature.
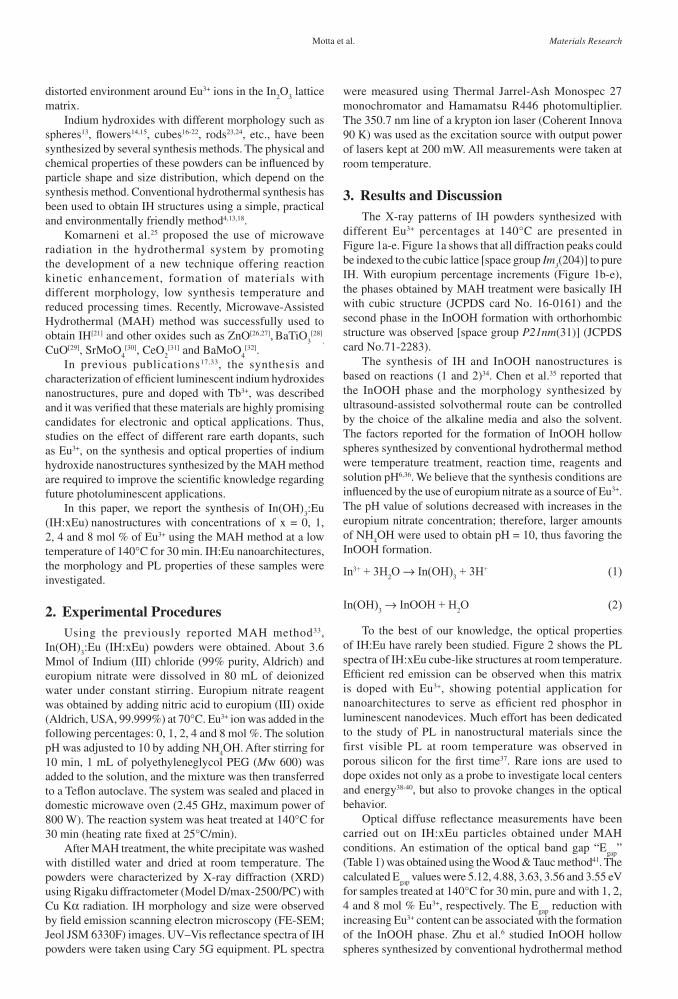
3. Results and DiscussionThe X-ray patterns of IH powders synthesized with
different Eu3+ percentages at 140°C are presented in Figure 1a-e. Figure 1a shows that all diffraction peaks could be indexed to the cubic lattice [space group Im
3(204)] to pure
IH. With europium percentage increments (Figure 1b-e), the phases obtained by MAH treatment were basically IH with cubic structure (JCPDS card No. 16-0161) and the second phase in the InOOH formation with orthorhombic structure was observed [space group P21nm(31)] (JCPDS card No.71-2283).
The synthesis of IH and InOOH nanostructures is based on reactions (1 and 2)34. Chen et al.35 reported that the InOOH phase and the morphology synthesized by ultrasound-assisted solvothermal route can be controlled by the choice of the alkaline media and also the solvent. The factors reported for the formation of InOOH hollow spheres synthesized by conventional hydrothermal method were temperature treatment, reaction time, reagents and solution pH6,36. We believe that the synthesis conditions are influenced by the use of europium nitrate as a source of Eu3+. The pH value of solutions decreased with increases in the europium nitrate concentration; therefore, larger amounts of NH
4OH were used to obtain pH = 10, thus favoring the
InOOH formation.
In3+ + 3H2O → In(OH)3 + 3H+ (1)
In(OH)3 → InOOH + H2O (2)
To the best of our knowledge, the optical properties of IH:Eu have rarely been studied. Figure 2 shows the PL spectra of IH:xEu cube-like structures at room temperature. Efficient red emission can be observed when this matrix is doped with Eu3+, showing potential application for nanoarchitectures to serve as efficient red phosphor in luminescent nanodevices. Much effort has been dedicated to the study of PL in nanostructural materials since the first visible PL at room temperature was observed in porous silicon for the first time37. Rare ions are used to dope oxides not only as a probe to investigate local centers and energy38-40, but also to provoke changes in the optical behavior.
Optical diffuse reflectance measurements have been carried out on IH:xEu particles obtained under MAH conditions. An estimation of the optical band gap “E
gap”
(Table 1) was obtained using the Wood & Tauc method41. The calculated E
gap values were 5.12, 4.88, 3.63, 3.56 and 3.55 eV
for samples treated at 140°C for 30 min, pure and with 1, 2, 4 and 8 mol % Eu3+, respectively. The E
gap reduction with
increasing Eu3+ content can be associated with the formation of the InOOH phase. Zhu et al.6 studied InOOH hollow spheres synthesized by conventional hydrothermal method

Optical Characterization of Europium-doped Indium Hydroxide Nanocubes Obtained by Microwave-Assisted Hydrothermal Method
and estimated that the optical band gap was 3.5eV and the E
gap value for crystalline In(OH)
3 powders was 5.15 eV[5].
Pure IH or IH:Eu belongs to n-type semi-conductors where oxygen vacancies can induce the formation of new energy levels in the band gap. The generation of oxygen defects in the crystalline structure of cube-like crystals of pure IH and IH:Eu are apparent. The formation of InOOH during synthesis for samples with europium releases molecular water (reaction 2) and provides oxygen vacancies in the lattice. Thus, during the MAH process, the displacement of oxygen related to In or Eu modulates different species of trapped holes (V
o•, V
ox and V
o•• species) around [InO
5V
ox]
clusters and gives rise to complex cluster vacancies26.Emission spectra in Figure 2 were obtained under
excitation of 350.7nm. The efficient sharp peak is attributed to 5D
0 → 7F
j emission transition, indicating the presence
of Eu3+ ion in the IH lattice. Emission spectra of IH:Eu structures exhibit an efficient red PL emission peak centered at around 618 nm, corresponding to the forced electric dipole transition 5D
0 → 7F
2 which is allowed in this particular case
since europium does not occupy a symmetry center in the indium hydroxide. Another weaker emission at 5D
0 → 7F
0, 5D
0 → 7F
1, 5D
0 → 7F
3 and 5D
0 → 7F
4 corresponding to Eu3+
transitions can be observed at around 582, 596, 653 and 701 nm, respectively42,43.
The relative intensities of Eu3+ emissions increase as the concentration of this ion increases from 1 to 8 mol %; however the luminescent emission of the IH matrix is drastically quenched. When the Eu3+ concentration is higher, the mechanism that prevails is the energy transfer from the IH matrix to Eu3+. This energy migration process is responsible for the increase in Eu3+ luminescence43,44.
For Eu-doped inorganic materials, optical transitions occur mainly from 5D
0 to 7F
J (0 <J < 6) manifold, giving rise
to a series of red emission lines with intensities depending on the local Eu3+ environment. From all possible transitions, only 5D
0 → 7F
1 is magnetically dipole allowed in the free
ion; all others require J-level mixing induced by the crystal field. Whereas the odd-parity components of the crystal field enable electric dipole transitions between 5D
0 and 7F
2,4,6 in
the first order, a combination of odd and even crystal-field terms gives rise to faint second-order transitions for the remaining J = 0, 3, 5 values. The intensities of the different J transitions, and in particular the hypersensitive J = 2 peak provide a good measure of the local crystal field acting on Eu3+ ions[45].
Assuming the PL emission peaks can be described with a Gaussian function, the emission envelope in Figure 2 can be fitted to multiple peaks (Figure 3a-e). In the emission envelope from IH:xEu, each color represents a different type of electronic transition and can be linked to a specific structural arrangement46. To better understanding PL properties, the curves were analyzed using the PeakFit deconvolution software47. Based on the Gaussian line broadening mechanism for luminescence processes, the fine features in the PL spectra of the IH matrix were deconvoluted and extracted from deconvolution curves. Figure 3a-e illustrates such decompositions while Table 1 lists the areas under the curve of the respective transitions.
Figure 1. XRD patterns of IH:xEu powders obtained by the MAH method at 140°C for 30 min: (a) x = 0, (b) x = 1, (c) x = 2, (d) x = 4 and (e) x = 8 mol %.
Table 1. Optical band gap (Egap
) and fitting parameters of the Gaussian peaks for PL of the IH matrix obtained with excitation wavelength at 350.7 nm.
IH:xEu Egap (eV) Peak center (nm)
450 512 570 623
%a %a %a %a
x = 0 5.12 18 55 13 14
x = 1 4.88 29 49 14 8
x = 2 3.63 25 31 26 18
x = 4 3.56 21 19 27 33
x = 8 3.55 11 18 39 32aPercentage obtained by dividing the area of each decomposed PL curves by the total PL area.
Figure 2. PL spectra of IH:xEu structures obtained by the MAH method at 140°C for 30 min: (a) x = 0, (b) x = 1, (c) x = 2, (d) x = 4 and (e) x = 8 mol %.

Motta et al. Materials Research
Figure 3. Deconvolution of a PL curve fitted for IH:xEu samples and respective Fe-SEM images (on the side): (a) x = 0, (b) x = 1, (c) x = 2, (d) x = 4 and (e) x = 8 mol %..

Optical Characterization of Europium-doped Indium Hydroxide Nanocubes Obtained by Microwave-Assisted Hydrothermal Method
The IH matrix PL curves for all samples are composed of four PL components with the following maxima nm: blue = 450 nm, green = 512 nm, yellow = 570 nm and orange = 623 nm. The PL deconvolution shows the IH matrix ordered-to- disordered structure changing with the increase percentage in the Eu3+ ion which favors yellow and orange light emission (higher wavelength) for smaller energies. According to the calculated band gap values (E
gap), the
increase percentage in the Eu3+ ion decreased the Egap
value and therefore increased the short-range disorder for clusters in the matrix. The appropriate structural disorder can result in better PL emission as compared with a completely ordered emission. Structurally disordered materials in general present oxygen vacancies, lattice defects, impurities and/or local bond distortions which yield localized electronic levels in their band gap43. Figure 3a-e (on the side) depicts FE-SEM images of IH:xEu nanostructures obtained at 140°C for 30 min. Figure 3a shows cubic and irregularly-shaped structures of pure IH with smooth and uniform surface where the angle between adjacent edges is relatively close to 90°; however, differences in the morphology of IH to IH:1%Eu were apparent. In sample with 1% Eu the
formation of a well-defined cube-like structure and a slight decrease were observed. It is speculated that europium at this concentration (1%) promotes disorder in the IH matrix. This characteristic can be confirmed with an increase in the PL property observed in IH:1%Eu as compared with the IH matrix. The increase in the europium concentration from 2% to 8% Eu promotes reorganization of the system and an increase in the cube-like structure is again observed. A decrease in the IH matrix PL property was observed with an increase in the europium concentration, suggesting that the order in the system increases.
4. ConclusionsIH:xEu powders (where x=0, 1, 2, 4 and 8 mol %) were
efficiently obtained in their crystalline phase using the MAH method at 140°C for 30 min. The relative intensities of Eu3+ ion emissions increase as the concentration of this ion increases from 1 to 8 mol % while in the IH matrix sample the luminescence intensity was drastically quenched. The mechanism that prevails in this case is the energy transfer from the IH matrix to Eu3+. These optical properties
exhibited by IH:xEu suggest that this material is a highly promising candidate for photoluminescent applications.
AcknowledgementsThe authors thank the financial support of the
Brazilian research financing institutions: FAPESP-CDMF 2013/07296-2, CNPq and CAPES. In memory of M. F. C. Abreu.
References1. Cao AM, Hu JS, Liang HP and Wan LJ. Self-assembled
vanadium pentoxide (V2O
5) hollow microspheres from nanorods
and their application in lithium-ion batteries. Angewandte Chemie. 2005; 44(28):4391-4395. PMid:15942965. http://dx.doi.org/10.1002/anie.200500946
2. Zhuang Z, Peng Q, Liu J, Wang X and Li Y. Indium hydroxides, oxyhydroxides, and oxides nanocrystals series. Inorganic Chemistry. 2007; 46(13):5179-5187. PMid:17530840. http://dx.doi.org/10.1021/ic061999f
3. Lei ZB, Ma GL, Liu MY, You WS, Yan HJ, Wu GP et al. Sulfur-substituted and zinc-doped In(OH)
3: a new class of catalyst for
photocatalytic H2 production from water under visible light
illumination. Journal of Catalysis. 2006; 237(2):322-329. http://dx.doi.org/10.1016/j.jcat.2005.11.022
4. Yan T, Wang X, Long J, Liu P, Fu X, Zhang G et al. Urea-based hydrothermal growth, optical and photocatalytic properties of single-crystal line In(OH)
3 nanocubes. Journal of Colloid and
Interface Science. 2008; 325(2):425-431. PMid:18555265. http://dx.doi.org/10.1016/j.jcis.2008.05.065
5. Avivi S, Mastai Y and Gedanken A. Sonohydrolysis of In3+ ions: formation of needlelike particles of indium hydroxide. Chemistry of Materials. 2000; 12(5):1229-1233. http://dx.doi.org/10.1021/cm9903677
6. Zhu HL, Yao KH, Zhang H and Yang DR. In OOH hollow spheres synthesized by a simple hydrothermal reaction.
Journal of Physical Chemistry B. 2005; 109(44):20676-20679. PMid:16853679. http://dx.doi.org/10.1021/jp0511911
7. Katoh R, Furube A, Yoshihara T, Hara K, Fujihashi G, Takano S et al. Efficiencies of electron injection from excited N
3
dye into nanocrystalline semiconductor (ZrO2, TiO
2, ZnO,
Nb2O
5, SnO
2, In
2O
3) films. Journal of Physical Chemistry
B. 2004; 108(15):4818-4822. http://dx.doi.org/10.1021/jp031260g
8. Kim H, Horwitz JS, Kushto GP, Qadri SB, Kafafi ZH and Chrisey DB. Transparent conducting Zr-doped In
2O
3
thin films for organic light-emitting diodes. Applied Physics Letters. 2001; 78(8):1050-1052. http://dx.doi.org/10.1063/1.1350595
9. Shi Z, Wang W and Zhang Z. Synthesis and characterization of indium hydroxide truncated polyhedral microcrystals. Materials Letters. 2008; 62(27):4293-4295. http://dx.doi.org/10.1016/j.matlet.2008.07.006
10. Silva CC, Filho FP, Sombra ASB, Rosa ILV, Leite ER, Longo E et al. Study of structural and photoluminescent properties of Ca
8Eu
2(PO
4)
6O
2. Journal of Fluorescence. 2008; 18(2):253-
259. PMid:18049883. http://dx.doi.org/10.1007/s10895-007-0242-9
11. Morais EA, Scalvi LVA, Tabata A, Oliveira JBB and Ribeiro SJL. Photoluminescence of Eu3+ ion in SnO
2 obtained by sol-
gel. Journal of Materials Science. 2008; 43(1):345-349. http://dx.doi.org/10.1007/s10853-007-1610-1
12. Dutta DP, Sudarsan V, Srinivasu P, Vinu A and Tyagi AK. Indium oxide and europium/dysprosium doped indium oxide nanoparticles: Sonochemical synthesis, characterization, and photoluminescence studies. Journal of Physical Chemistry C. 2008; 112(17):6781-6785. http://dx.doi.org/10.1021/jp800576y
13. Li B, Xie Y, Jing M, Rong G, Tang Y and Zhang G. In2O
3
hollow microspheres: synthesis from designed in (OH)(3) precursors and applications in gas sensors and photocatalysis. Langmuir. 2006; 22(22):9380-9385. PMid:17042557. http://dx.doi.org/10.1021/la061844k

Motta et al. Materials Research
14. Zhu H, Wang X, Wang Z, Yang C, Yang F and Yang X. Self-assembled 3D microflowery In(OH)(3) architecture and its conversion to In
2O
3. Journal of Physical Chemistry
C. 2008; 112(39):15285-15292. http://dx.doi.org/10.1021/jp804768w
15. Zhu H, Wang X, Yang F and Yang X. Template-free, surfactantless route to fabricate In(OH)
3 monocrystalline
nanoarchitectures and their conversion to In2O
3. Crystal Growth
& Design. 2008; 8(3):950-956. http://dx.doi.org/10.1021/cg700850e
16. Motta FV, Lima RC, Marques APA, Leite ER, Varela JA and Longo E. In
2O
3 microcrystals obtained from rapid
calcination in domestic microwave oven. Materials Research Bulletin. 2010; 45(11):1703-1706. http://dx.doi.org/10.1016/j.materresbull.2010.06.056
17. Motta FV, Lima RC, Marques APA, Li MS, Leite ER, Varela JA et al. Indium hydroxide nanocubes and microcubes obtained by microwave-assisted hydrothermal method. Journal of Alloys and Compounds. 2010; 497(1-2):L25-L28. http://dx.doi.org/10.1016/j.jallcom.2010.03.069
18. Zhu HL, Wang NY, Wang L, Yao KH and Shen XF. In situ x-ray diffraction study of the phase transition of nanocrystalline In(OH)
3 to In
2O
3. Inorganic Materials. 2005; 41(6):609-612.
http://dx.doi.org/10.1007/s10789-005-0178-x
19. Tang Q, Zhou WJ, Zhang W, Ou SM, Jiang K, Yu WC et al. Size-controllable growth of single crystal In(OH)(3) and In
2O
3
nanocubes. Crystal Growth & Design. 2005; 5(1):147-150. http://dx.doi.org/10.1021/cg049914d
20. Zhu HL, Wang Y, Wang NY, Li Y and Yang J. Hydrothermal synthesis of indium hydroxide nanocubes. Materials Letters. 2004; 58(21):2631-2634. http://dx.doi.org/10.1016/j.matlet.2004.03.030
21. Koga N and Kimizu T. Thermal Decomposition of Indium(III) Hydroxide Prepared by the Microwave-Assisted Hydrothermal Method. Journal of the American Ceramic Society. 2008; 91(12):4052-4058. http://dx.doi.org/10.1111/j.1551-2916.2008.02811.x
22. Chen LY, Zhang YG, Wang WZ and Zhang ZD. Tunable synthesis of various hierarchical structures of In(OH)(3) and In
2O
3 assembled by nanocubes. European Journal of Inorganic
Chemistry. 2008; (9):1445-1451. http://dx.doi.org/10.1002/ejic.200700936
23. Wang L, Perez-Maqueda LA and Matijevic E. Rapid preparation of uniform colloidal indium hydroxide by the controlled double jet precipitation. Colloid and Polymer Science. 1998; 276(9):847-850. http://dx.doi.org/10.1007/s003960050320
24. Perez-Maqueda LA, Wang LF and Matijevic E. Nanosize indium hydroxide by peptization of colloidal precipitates. Langmuir. 1998; 14(16):4397-4401. http://dx.doi.org/10.1021/la980149c
25. Komarnen i S , Roy R and L i QH. Mic rowave-hydrothermal Synthesis of Ceramic Powders. Materials Research Bulletin. 1992; 27(12):1393-1405. http://dx.doi.org/10.1016/0025-5408(92)90004-J
26. Lima RC, Macario LR, Espinosa JWM, Longo VM, Erlo R, Marana NL et al. Toward an understanding of intermediate- and short-range defects in ZnO single crystals: a combined experimental and theoretical study. Journal of Physical Chemistry A. 2008; 112(38):8970-8978. PMid:18652436. http://dx.doi.org/10.1021/jp8022474
27. Milao TM, Mendonça VR, Araujo VD, Avansi W, Ribeiro C, Longo E et al. Microwave hydrothermal synthesis and photocatalytic performance of ZnO and M:ZnO nanostructures
(M = V, Fe, Co). Science of Advanced Materials. 2012; 4(1):54-60. http://dx.doi.org/10.1166/sam.2012.1251
28. Moreira ML, Mambrini GP, Volanti DP, Leite ER, Orlandi MO, Pizani PS et al. Hydrothermal microwave: a new route to obtain photoluminescent crystalline BaTiO
3 nanoparticles.
Chemistry of Materials. 2008; 20(16):5381-5387. http://dx.doi.org/10.1021/cm801638d
29. Volanti DP, Keyson D, Cavalcante LS, Simões AZ, Joya MR, Longo E et al. Synthesis and characterization of CuO flower-nanostructure processing by a domestic hydrothermal microwave. Journal of Alloys and Compounds. 2008; 459(1-2):537-542. http://dx.doi.org/10.1016/j.jallcom.2007.05.023
30. Sczancoski JC, Cavalcante LS, Joya MR, Varela JA, Pizani PS and Longo E. SrMoO
4 powders processed in microwave-
hydrothermal: synthesis, characterization and optical properties. Chemical Engineering Journal. 2008; 140(1-3):632-637. http://dx.doi.org/10.1016/j.cej.2008.01.015
31. Araújo VD, Avansi W, Carvalho HB, Moreira ML, Longo E, Ribeiro C et al. CeO
2 nanoparticles synthesized by a
microwave-assisted hydrothermal method: evolution from nanospheres to nanorods. CrystEngComm. 2012; 14(3):1150-1154. http://dx.doi.org/10.1039/c1ce06188g
32. Sczancoski JC, Cavalcante LS, Marana NL, Silva RO, Tranquilin RL, Joya MR et al. Electronic structure and optical properties of BaMoO
4 powders. Current Applied
Physics. 2010; 10(2):614-624. http://dx.doi.org/10.1016/j.cap.2009.08.006
33. Motta FV, Marques APA, Li MS, Abreu MFC, Paskocimas CA, Bomio MRD et al. Preparation and photoluminescence characteristics of In(OH)
3:xTb3+ obtained by Microwave-
Assisted Hydrothermal method. Journal of Alloys and Compounds. 2013; 553:338-342. http://dx.doi.org/10.1016/j.jallcom.2012.11.063
34. Xu X and Wang X. Size- and surface-determined transformations: from ultrathin InOOH nanowires to uniform c-In
2O
3 Nanocubes and rh-In
2O
3 nanowires. Inorganic
Chemistry. 2009; 48(8):3890-3895. PMid:19326893. http://dx.doi.org/10.1021/ic802449w
35. Chen L, Ma X, Liu Y, Zhang YG, Wang W, Liang Y et al. 3D architectures of InOOH: ultrasonic-assisted synthesis, growth mechanism, and optical properties. European Journal of Inorganic Chemistry. 2007; (28):4508-4513. http://dx.doi.org/10.1002/ejic.200700364
36. Chen SG, Huang YF, Cheng Y, Xia Q, Liao HW and Long CG. Shape-controlled growth of In(OH)
3 crystals
synthesized by diglycol-mediated solvothermal process. Materials Letters. 2008; 62(10-11):1634-1637. http://dx.doi.org/10.1016/j.matlet.2007.09.048
37. Canham LT. Silicon quantum wire array fabrication by electrochemical and chemical dissolution of wafers. Applied Physics Letters. 1990; 57(10):1046-1048. http://dx.doi.org/10.1063/1.103561
38. Xiong HM, Liu DP, Xia YY and Chen JS. Polyether-grafted ZnO nanoparticles with tunable and stable photoluminescence at room temperature. Chemistry of Materials. 2005; 17(12):3062-3064. http://dx.doi.org/10.1021/cm050556r
39. Fujihara S, Ogawa Y and Kasai A. Tunable visible photoluminescence from ZnO thin films through Mg-doping and annealing. Chemistry of Materials. 2004; 16(15):2965-2968. http://dx.doi.org/10.1021/cm049599i
40. Draeger EW, Grossman JC, Williamson AJ and Galli G. Optical properties of passivated silicon nanoclusters: The role of synthesis. Journal of Chemical Physics, 2004; 120(22):10807-10814. PMid:15268108. http://dx.doi.org/10.1063/1.1738633

Optical Characterization of Europium-doped Indium Hydroxide Nanocubes Obtained by Microwave-Assisted Hydrothermal Method
41. Wood DL and Tauc J. Weak absorption tails in amorphous semiconductors. Physical Review B. 1972; 5(8):3144-3151. http://dx.doi.org/10.1103/PhysRevB.5.3144
42. Chong MK, Pita K and Kam CH. Photoluminescence of sol-gel-derived Y
2O
3: Eu3+ thin-film phosphors with Mg2+
and Al3+ co-doping. Applied Physics A: Materials Science & Processing. 2004; 79(3):433-437. http://dx.doi.org/10.1007/s00339-004-2737-4
43. Rosa ILV, Marques APA, Tanaka MTS, Motta FV, Varela JA, Leite ER et al. Europium(III) Concentration effect on the spectroscopic and photoluminescent properties of BaMoO
4:Eu. Journal of Fluorescence. 2009; 19(3):495-500.
PMid:19002571. http://dx.doi.org/10.1007/s10895-008-0438-7
44. Yu Y, Chen D, Wang Y, Huang P, Weng F and Niu M. Enhanced photoluminescence of Eu3+ induced by energy transfer from In
2O
3 nano-crystals embedded in glassy matrix. Physical
Chemistry Chemical Physics. 2009; 11(39): 8774-8778. PMid:20449022. http://dx.doi.org/10.1039/b907065f
45. Stavale F, Pascua L, Nilius N and Freund HJ. From embedded nanoislands to thin films: Topographic and optical properties of europium oxide on MgO(001) films. Physical Review B. 2012; 86(8). http://dx.doi.org/10.1103/PhysRevB.86.085448
46. Motta FV, Figueiredo AT, Longo VM, Mastelaro VR, Freitas AZ, Gomes L et al. Disorder-dependent photoluminescence in Ba
0.8Ca
0.2TiO
3 at room temperature.
Journal of Luminescence. 2009; 129(7):686-690. http://dx.doi.org/10.1016/j.jlumin.2009.01.014
47. Ding T, Zheng WT, Tian HW, Zang JF, Zhao ZD, Yu SS et al. Temperature-dependent photoluminescence in La
2/3Ca
1/3MnO
3.
Solid State Communications. 2004; 132(12):815-819. http://dx.doi.org/10.1016/j.ssc.2004.09.047