Embed Size (px)
Citation preview
ARTICLE IN PRESS
Optics and Lasers in Engineering 47 (2009) 667–672
Contents lists available at ScienceDirect
Optics and Lasers in Engineering
0143-81
doi:10.1
� Corr
E-m
journal homepage: www.elsevier.com/locate/optlaseng
Optical characterization and composition of abdominal wall muscle from rat
Luıs Oliveira a,�, Armindo Lage b, M. Pais Clemente a, Valery Tuchin c,d
a CETO—Centro de Ciencias e Tecnologias Opticas, Rua Caldas Xavier, No 38–6o E, 4150 Porto, Portugalb Electro-technical and Computers Department, Porto University—School of Engineering, Rua Dr. Roberto Frias, 4200-465 Porto, Portugalc Institute of Optics and Biophotonics, Saratov State University, Saratov 410012, Russiad Institute of Precise Mechanics and Control of RAS, Saratov 410028, Russia
a r t i c l e i n f o
Article history:
Received 20 November 2007
Received in revised form
22 November 2008
Accepted 29 December 2008Available online 5 February 2009
Keywords:
Muscle characterization
Refractive index
Biomedical optics
Optical clearing
66/$ - see front matter & 2009 Elsevier Ltd. A
016/j.optlaseng.2008.12.005
esponding author. Tel.: +351 226002471; fax:
ail address: [email protected] (L. O
a b s t r a c t
Complete optical characterization of biological tissue is desirable to develop clinical methods using
optical technologies. Particularly, to develop optical clearing methods in biological tissues, it is
necessary to know the composition of the tissue, the percentage of each constituent and corresponding
refractive indexes. To obtain such information for rat muscle, we used a simple method to characterize
tissue constituents for both content percentage and refractive index. The study consisted on measuring
mass with a precision weighting scale and the refractive index with an Abbe refractometer during tissue
dehydration. With the collected data, we used a theoretical model to calculate the refractive index and
percentage for both interstitial fluid and solid part of the rat muscle. The results obtained are in good
agreement with data published by other authors, and were considered of vital information for the
optical clearing studies that we planned to perform.
& 2009 Elsevier Ltd. All rights reserved.
1. Introduction
Skeletal muscle tissue exists throughout the entire humanbody and can be roughly described as a collection of muscle fibersdistributed through a background material, which is composedmainly by water and a small percentage of certain salts andminerals, the so-called interstitial fluid (IF) [1]. Considering theoptical properties of muscle, its physical heterogeneous constitu-tion implies a refractive index profile that presents localizeddiscontinuities at the boundaries between the muscle fibers andthe inter-fiber liquid [1].
It is of essential importance in clinical and pharmacologicalpractice to know the water content of biological tissues [2]. Inparticular, tissue water content variations provide information ontissue physiology changes that are associated with tissue weightincrease, such as the development of edema [2].
On the other hand, considering biomedical optics applications,and in particular the recently discovered optical clearing treat-ments to modify tissue transparency, it is important to knowtissue composition and refractive index profile before theexperimental studies are initiated. With such information, wecan calculate the refractive index mismatch originated by theinternal structure of the tissue and consequently the amount oflight scattering that the tissue can create [1]. Water presents asmall refractive index when compared to its neighbors inside a
ll rights reserved.
+351226007002.
liveira).
biological tissue. For visible wavelengths, water presents arefractive index of 1.33, while its common neighbors insidebiological materials have refractive index values that grossly rangebetween 1.35 and 1.60, for the same range of wavelengths. Someexamples are the melanin particles with a refractive index of 1.6and fat tissue with a refractive index of 1.45 [1].
The refractive index of biological tissues may have a compleximaginary component. The imaginary part of a refractive index isrelated to absorption of light, while the real part is related to lightscattering [1]. Considering this correspondence between refrac-tive index components and the attenuation phenomena, and infact of the refractive index mismatch that occurs at the physicalboundaries between muscular fibers and IF of a muscle tissue,we should expect great scattering of a light beam traveling inside.As a consequence, in any clinical procedure that uses lighttraveling inside tissues, the optical radiation suffers considerableattenuation.
Human and animal bodies present a great variety of biologicaltissues. In particular, skeletal muscle can be found in greatabundance both in humans and in animals. The human muscularfibers have a refractive index of 1.41 [3], which is considerablyhigher than the refractive index of water distributed around thefibers.
Rats are frequently used in clinical research due to the greatsimilarity between their tissues and human tissues. Suchsimilarity is based on tissue function, tissue internal compositionand characteristics. In particular, the skeletal muscles are verygood examples of such similarity. The rat skeletal muscles havethe same internal structure as human muscles and their purpose
ARTICLE IN PRESS
L. Oliveira et al. / Optics and Lasers in Engineering 47 (2009) 667–672668
is the same: to provide movement of bones and body. They alsoconsist of orientated muscle fibers surrounded by IF. If we intendto simulate the study of human muscle, the rat skeletal muscle isa good sample to use. Considering this fact, we have recentlystudied the optical clearing process created in rat abdominal wallmuscle by impregnating tissue samples with some biocompatibleand hyperosmotic solutions, such as glycerol, propylene glycol orglucose, and we verified that tissue transmittance has improved ina short period of time [4]. For the majority of the solutionsstudied, and after a 15 min of immersion, the natural spectraltransmittance of the tissue almost doubled its values. At thebeginning of this experimental study, we have performed ananalysis on the composition of the rat muscle and also determinedthe refractive index of the muscle fibers inside, assuming thattheir density is similar to the density of bovine muscle [5]. Themethodology and results obtained in this study are presented inthe following sections.
As we have already described, the refractive index of biologicaltissues is a very important optical parameter in the studyand development of photo medicine techniques [6,7]. Severalmethods have been used to perform in vitro or in vivo measure-ments of refractive index in blood and tissue samples [8]. It isimperative to select the correct instrumentation and method toperform refractive index measurements from in vivo or in vitro
samples. The accuracy in the final measurements is also veryimportant.
One of the methods used to measure refractive index fromhighly absorbing and scattering biological samples is opticalcoherence tomography (OCT). The OCT instrumentation is basedon a fiber-optic Michelson interferometer. The illumination ismade by a low-coherent light source, usually a superluminescentdiode (SLD), with an emission bandwidth of 20–50 nm. The maindisadvantage of this method is the low accuracy that can beprovided, which is only 10�2–10�3. Such low accuracy is definedby the coherence length of the SLD [8].
Another example of refractive index measurement is thelight phase retardation with Nomarski polarizing-interferencemicroscope. The refractive indices of intact and dried erythrocytescan be estimated from measurements obtained with thismethod. The calculated values were obtained with the accuracy5�10�4 [9].
The most precise measurements of refractive index of highlyabsorbing and scattering biological fluids can be achieved by themethod of intracavity laser refractometry in reflection (ILRR).The ILRR method is based on controlling the laser spectrum. It isused a two-frequency laser with phase anisotropy in reflection.The sample is placed inside the laser cavity, and this type of laserrepresents a detector itself. Such method allows to measurerefractive index with a sensitivity of up to 10�8 and a measure-ment time of several microseconds. However, this method isnot applicable to study tissue samples with thickness used inhistology [10].
In our study, we intended to measure refractive index fromtissue samples with thicknesses of approximately 0.5 mm. Wehave adopted the Abbe refractometer to perform these measure-ments at a reference wavelength of 589 nm. The accuracy in themeasurements with this equipment is about 5�10�4. A light-emitting diode (LED) with the wavelength 633 nm was used as alight source for the refractive index measurement [4]. The use of ahigh brightness and quasi-monochromatic LED is necessary toilluminate the refractive index scale of the refractometer andconsequently increase the contrast in the readings to perform.With such a set-up we could acquire more precise and stablerefractive index measurements from the highly scattering sample.Measured values of refractive index correspond to refractive indexat 589 nm because of Amici prism action [1].
2. Experimental study
We have adopted abdominal wall muscle samples from the rat(species Wistar Han) to study internal composition and performrefractive index discrimination. After animal sacrifice and muscledissection, samples were prepared in a square form with super-ficial areas of approximately 1.5 cm�1.5 cm, and then sliced in acryostat with thickness between 0.4 and 0.5 mm. Muscle is verymalleable and difficult to work with. To perform the slices incryostat, muscle blocks had to be frozen in ice water. It is knownthat temperature variation changes the optical transparency andvolume of samples [1]. This way, we should expect to observesome volume variations on the sample after the natural post-slicing defreezing that the sample undergoes. Also, due to thisvolume variation, the above-presented dimensions are onlyapproximate. Since the superficial square area dimension of thesample is much bigger than its thickness, we should only expect aconsiderable variation in thickness and not on the transversaldimensions. The exact value of tissue thickness shall bedetermined based on measurements made in histological photo-graphs that were acquired from the natural muscle sample.
To obtain muscle samples for refractive index measurement,we have calibrated the cryostat with thickness values between 0.4and 0.5 mm. These samples were tested in the Abbe refractometerto obtain their global refractive index. To improve contrast inmeasurements, we have used a red LED [11]. Due to muscle highturbidity, it was not possible to acquire precise measurementsfrom samples with thickness of 0.5 mm, even with contrastillumination. It is known that in biological samples, turbidity isproportional to the sample thickness. With this lack of results forthe 0.5-mm-thickness sample, we have tested other samples withlower thickness values in the refractometer with contrastillumination, to verify which thickness value permits to obtainprecise measurements. For a sample with 0.4 mm thickness, wecould correctly measure its global refractive index. This thicknesswas adopted for the following study.
The study to determine refractive index of the muscle fibersand volumetric composition inside the tissue sample wasperformed by acquiring refractive index and mass measurementsfrom the sample between consecutive dehydrated states exter-nally induced. This process was made until we had acquired 10pairs of measurements. These values were used in the calculationsto determine volumetric composition and refractive indexdiscrimination inside the sample.
At the end of the dehydration study, we have processed anatural tissue sample to be photographed at microscope, andmake some measurements to determine its mean thickness andevaluate the distribution of muscle fibers inside.
2.1. Sample characterization
As previously mentioned, two samples were prepared incryostat with adequate physical dimensions to submit to experi-mental study. The cryostat was calibrated with 0.4 mm thicknessto obtain the first sample for the dehydration study. For thesecond sample to be photographed at microscope in natural state,we have calibrated the cryostat for 0.5 mm thickness. To slicetissue samples in cryostat, it is necessary to freeze tissue blocks at�20 1C, so it becomes solid to perform slice. After slicing, samplesdefreeze naturally at room temperature. To freeze a tissue blockinside the cryostat chamber, we have used a water bathsurrounding the muscle block. Other products are not used inthis process to prevent IF contamination.
The first sample was submitted to the experimental measure-ments during dehydration, and the second was processed without
ARTICLE IN PRESS
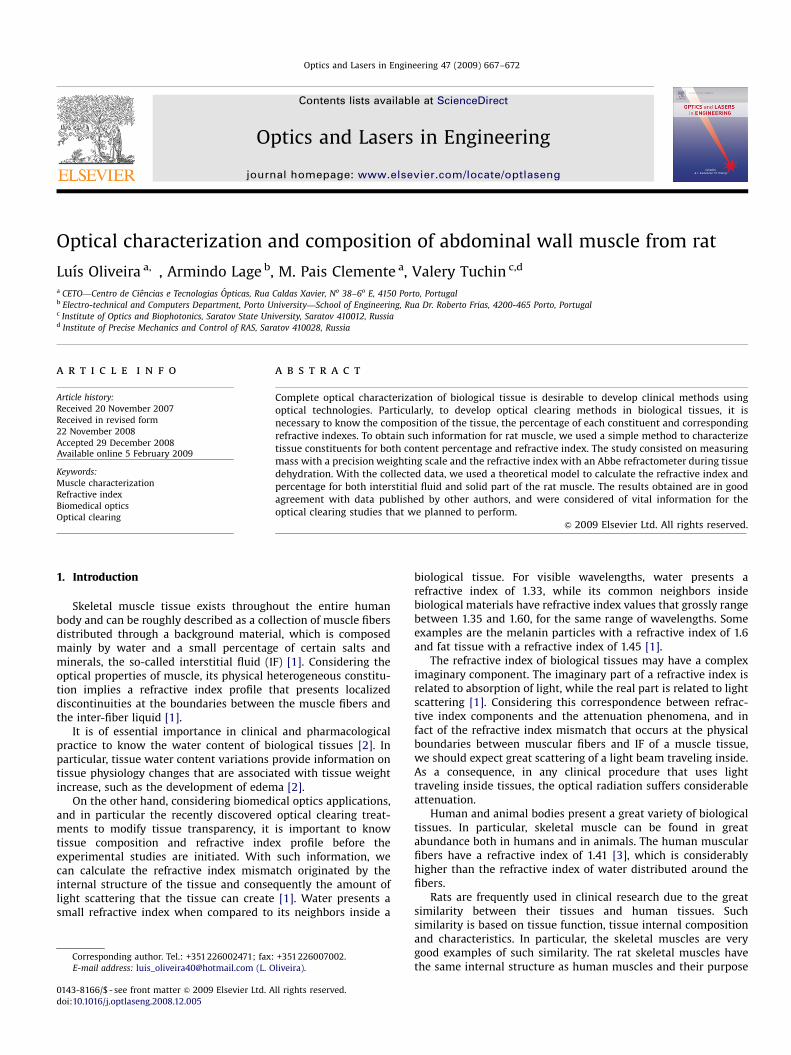
Fig. 1. The 2� optical magnification photograph of sample cross-section.
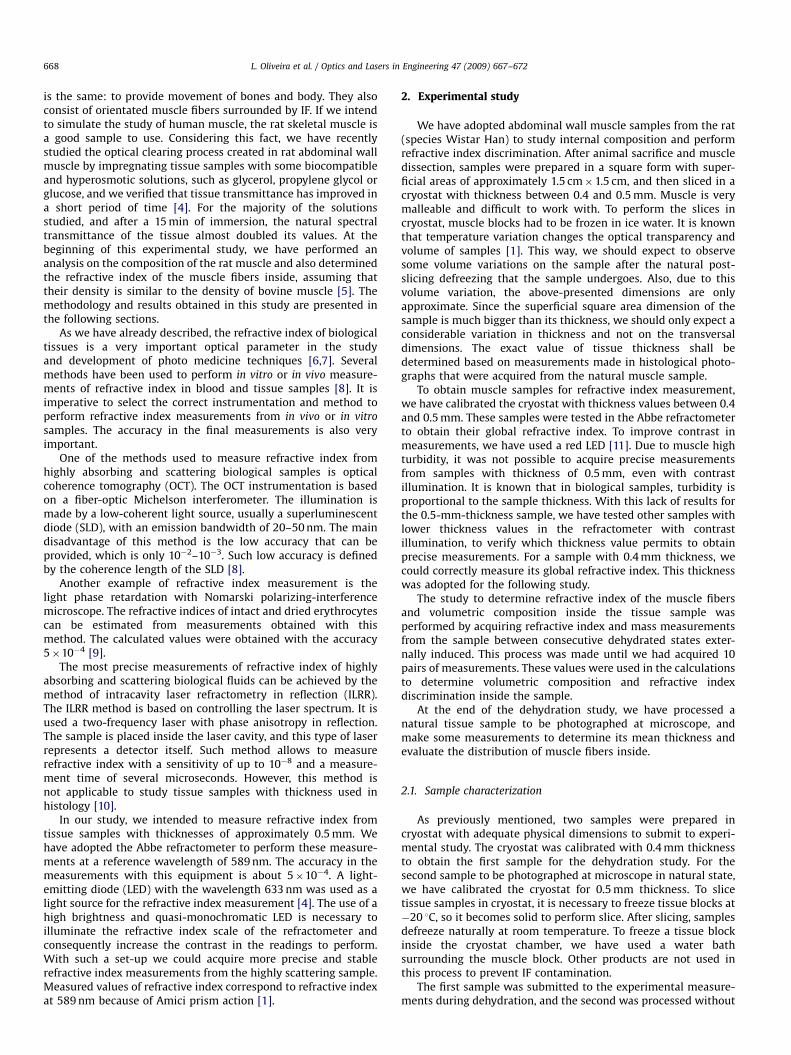
Fig. 2. The 10� optical magnification photograph of the sample.
L. Oliveira et al. / Optics and Lasers in Engineering 47 (2009) 667–672 669
being dehydrated to be studied at microscope. This second samplewas cross-sectioned to observe fiber distribution inside musclelayer and to evaluate sample thickness. We have used 2� and10� optical magnifications at microscope to obtain goodresolution photographs for the intended evaluation. The cross-section photograph of the tissue sample, obtained with 2�optical magnification is represented in Fig. 1.
With the same optical magnification, we have obtained aphotograph of a length scale to perform thickness measurements.By positioning the scale photograph (in transparent paper) overthe tissue photograph, we measured thickness in several pointsalong the tissue cross-section. From these measurements, we haveused statistics to calculate mean thickness and correspondingstandard deviation
dnatural ¼ 0:51� 0:08 mm.
We observe that the mean sample thickness is not exactly0.5 mm as it was calibrated in cryostat, nor the cut presents aconstant value for this parameter, as shown in Fig. 1: thicknesschanges along the cut. Since the sample was submitted to freezingand consequent defreezing, it has suffered temperature variationsthat originated volume change. Such volume change is identifiedby thickness variation along the cut. The calculated meanthickness is not too different from the one that we have calibratedin cryostat.
The distribution of muscle fibers inside the tissue sample canbe observed in the 10� optical magnification photographpresented in Fig. 2.
From Fig. 2, we can verify that the muscle fibers cross-sectionsdo not have the same physical dimensions. This means that thefibers present different diameters or that they do not have thesame orientation. The space around fibers, presented in light greyin Fig. 2, represents the IF. We can see in this photograph, a largeextension of boundaries between IF and fibers, where therefractive index mismatch that originates light scattering islocated.
2.2. Refractive index measurements and theoretical development
With the objective to evaluate and discriminate the refractiveindex of tissue constituents and to quantify the volume fractionsthat each one occupies inside the tissue, we began the dehydra-
tion study by measuring the global refractive index of tissuesample and its natural mass. Before these measurements, thesample was carefully dried with absorbing paper to eliminate anywater present on tissue surface. We measured the refractive indexwith an Abbe refractometer and mass with a digital weightingscale. The refractive index of the tissue sample was 1.3980 and itsmass was 0.1623 g. These two values are the natural references ofthe tissue sample for the dehydration to be applied. The precisionin the above values is imposed by the instruments used. This way,we have 0.0001 g of uncertainty in the mass measurement and0.0005 of uncertainty in the refractive index.
After obtaining the natural values of mass and refractive index,we began by dehydrating the tissue sample with the help of ahairdryer. This process of heating the tissue was done for almost1 min. We then measured mass and refractive index from thesample for the first dehydrated state. We repeated this procedureof dehydration and measurement until we got 10 pairs of valuesfor the parameters considered. These measurements wereperformed at 27 1C.
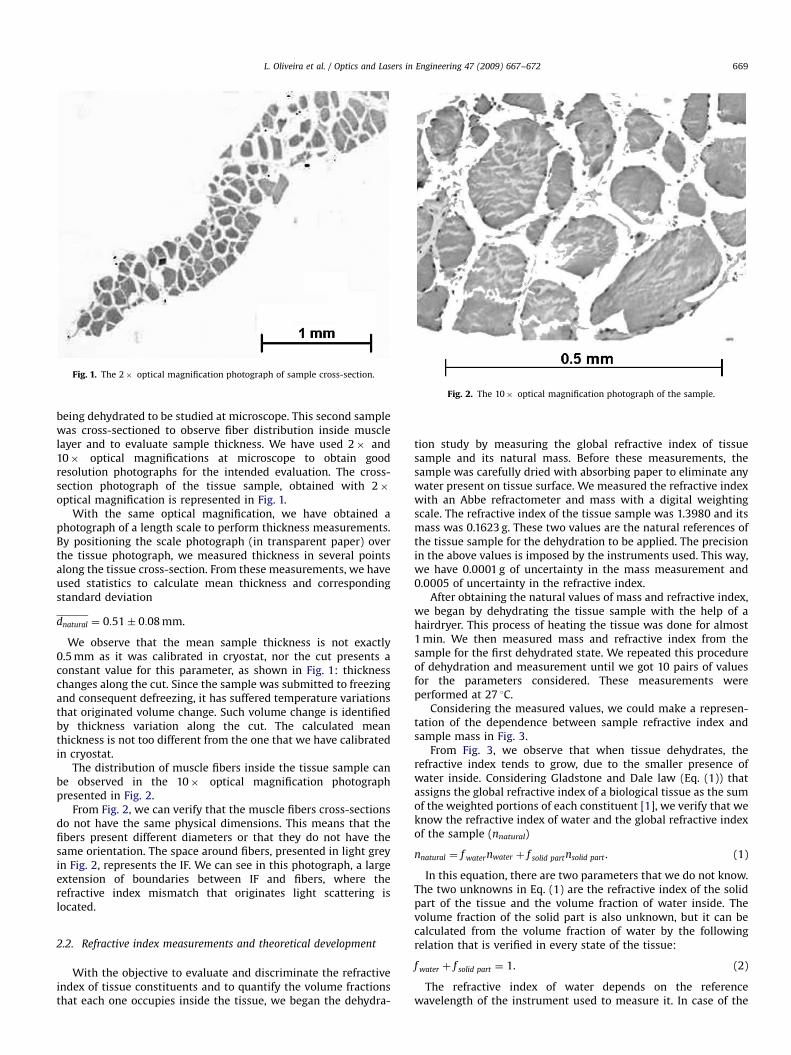
Considering the measured values, we could make a represen-tation of the dependence between sample refractive index andsample mass in Fig. 3.
From Fig. 3, we observe that when tissue dehydrates, therefractive index tends to grow, due to the smaller presence ofwater inside. Considering Gladstone and Dale law (Eq. (1)) thatassigns the global refractive index of a biological tissue as the sumof the weighted portions of each constituent [1], we verify that weknow the refractive index of water and the global refractive indexof the sample (nnatural)
nnatural ¼ f waternwater þ f solid partnsolid part . (1)
In this equation, there are two parameters that we do not know.The two unknowns in Eq. (1) are the refractive index of the solidpart of the tissue and the volume fraction of water inside. Thevolume fraction of the solid part is also unknown, but it can becalculated from the volume fraction of water by the followingrelation that is verified in every state of the tissue:
f water þ f solid part ¼ 1. (2)
The refractive index of water depends on the referencewavelength of the instrument used to measure it. In case of the
ARTICLE IN PRESS
Fig. 3. Refractive index–mass dependence of the tissue sample during dehydra-
tion.
L. Oliveira et al. / Optics and Lasers in Engineering 47 (2009) 667–672670
Abbe refractometer, used to perform our measurements, thereference wavelength is 589 nm [11]. Since it is difficult to collecta sample of tissue water, and to obtain a refractive index of watervalue consistent with our measurements, we can calculate it byEq. (3), using the reference wavelength [1]
nwaterðlÞ ¼ 1:31848þ6:662
l� 129:2
ffi 1:3199þ6878
l2�
1:132� 109
l4þ
1:11� 1014
l6. (3)
With this calculation we obtain 1.3330 for water refractiveindex, referred to 589 nm. Considering the volume fractions ofwater and solid part of tissue sample, we can derive someexpressions for their calculation based on the definition ofdensity. As we know, for a certain material, we can calculate itsdensity (r) as the quotient of its mass per volume
r ¼ mass
Vol. (4)
From this relation, we observe that by interchanging volumeand density, we obtain a relation to calculate volume as a functionof mass and density. For our tissue sample in natural state, we candetermine water volume fraction as water volume divided by totalsample volume
f water natural ¼Vw
Vsample�natural. (5)
The mass of water contained in the sample is calculated as thedifference of masses measured for natural and completely drytissue. Also, by considering and discriminating water density (rw)and dry matter density (rdry), we can write Eq. (5) in a moreexpanded manner
f water natural ¼ðmassnatural �massdryÞr�1
w
r�1w ðmassnatural �massdryÞ þ r�1
drymassdry
. (6)
Since rw ¼ 1, the previous relation takes the following form:
f water natural ¼massnatural �massdry
massnatural � ð1� r�1dryÞmassdry
. (7)
Performing a similar deduction, the dry matter volume fractionin the natural sample can be calculated by the following relation:
f naturaldry ¼
r�1drymassdry
massnatural � ð1� r�1dryÞmassdry
. (8)
Since we have performed measurements in different states ofdehydration, we need to correct above formulas to calculate thevolume fractions of water and dry matter. This way, for anydehydrated state i, we have the following relations to determinethe corresponding volume fractions
f iwater ¼
massi �massdry
massi � ð1� r�1dryÞmassdry
, (9)
f idry ¼
r�1drymassdry
massi � ð1� r�1dryÞmassdry
. (10)
For every sample state, natural or during dehydration, thefollowing relation is always satisfied:
f water þ f dry ¼ 1. (11)
When using the above equations to calculate water and drymatter volume fractions for each dehydrated state, we use themeasured mass values represented in Fig. 3. In these equationsthere are two other parameters that we do not know: drymatter density and dry matter mass. One thing we do knowabout these two characteristic parameters of dry matter:they are not changed in the dehydration process. Dry matterdensity for rat muscle has not been reported yet as far as weknow. On the other hand, for no fat bovine muscle, some valueshave been reported [5,12,13]. These values will be used incalculations below as the possible estimation available. Thedry matter mass corresponding to our sample can be calculatedif we know natural water content in the muscle. Natural watervolume fraction in rat skeletal muscle has been published as 0.756[2]. In the following sections, we will use the data available toestimate the variation of sample water content in the dehydrationprocess.
2.3. Dry mass estimation
Considering the above-presented value for water content innatural rat muscle [2], we have used the natural-state watercontent formula (Eq. (7)) to estimate dry matter mass for ratskeletal muscle. In these calculations we have used for dry matterdensity, the values published for no fat bovine muscle that weremeasured by different research groups [12,13]. For natural mass,we have used the mass measured from our sample in naturalstate, before applying any dehydration: 0.1623 g. In accordancewith data from Ref. [12] the density of dry matter from bovinemuscle is r (g/cm3) ¼ 1.551—0.349�10�3T, where T is theabsolute temperature of the sample (measured in Kelvin). For27 1C (300 K) and dry matter density of 1.446 g/cm3, we obtain adry mass of 0.0516 g. Another group [13] has reported a density of1.348 g/cm3 for the dry matter of bovine muscle at 10 1C (283 K).This data correspond to 0.0492 g for dry matter mass in our case.These dry matter mass values will be used in the followingcalculations.
2.4. Water content and dry matter refractive index estimated on the
basis of data from Ref. [12]
When using Eq. (7) to calculate dry mass for our musclesample, we have assumed that the sample has naturalwater content according to the literature: 0.756 [2]. For thefollowing dehydrated states, we have used Eq. (9) to calculatewater content in the sample. The obtained values are presented inTable 1.
Based on the previous calculated values, we have determinedthe refractive index of dry matter for each tissue state (natural anddehydrated). For these calculations, we have used the following
ARTICLE IN PRESS
Table 1Calculated values for water content and dry matter R.I. during dehydration based on data from Ref. [12].
State
Natural Dehydrated
i ¼ 1 i ¼ 2 i ¼ 3 i ¼ 4 i ¼ 5 i ¼ 6 i ¼ 7 i ¼ 8 i ¼ 9 i ¼ 10
f iwater
0.7560 0.7245 0.7030 0.6734 0.6376 0.6007 0.5515 0.4907 0.3929 0.2788 0.0893
nidry
1.5995 1.5742 1.5939 1.5995 1.5993 1.6036 1.5996 1.5902 1.5727 1.5521 1.5203
Table 2Calculated values for water content and dry matter R.I. during dehydration based on data from Ref. [13].
State
Natural Dehydrated
i ¼ 1 i ¼ 2 i ¼ 3 i ¼ 4 i ¼ 5 i ¼ 6 i ¼ 7 i ¼ 8 i ¼ 9 i ¼ 10
f iwater
0.7560 0.7252 0.7042 0.6756 0.6411 0.6058 0.5592 0.5020 0.4113 0.3074 0.1392
nidry
1.5995 1.5750 1.5950 1.6011 1.6018 1.6071 1.6041 1.5960 1.5801 1.5611 1.5310
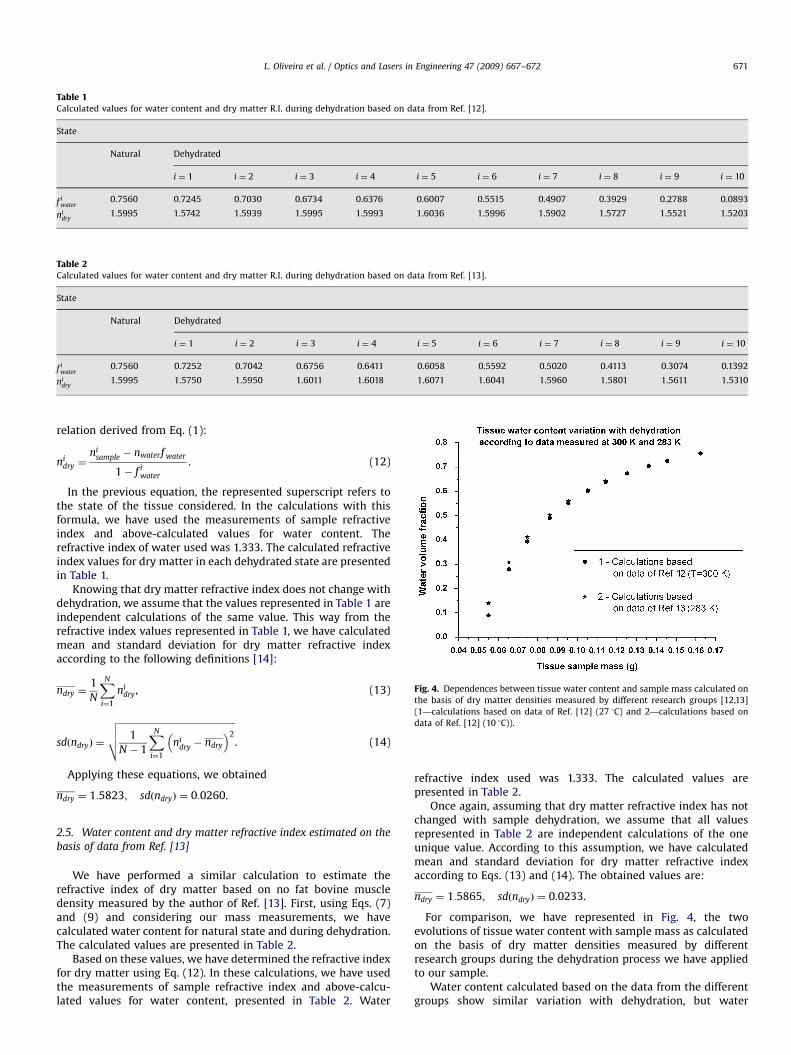
Fig. 4. Dependences between tissue water content and sample mass calculated on
the basis of dry matter densities measured by different research groups [12,13]
(1—calculations based on data of Ref. [12] (27 1C) and 2—calculations based on
data of Ref. [12] (10 1C)).
L. Oliveira et al. / Optics and Lasers in Engineering 47 (2009) 667–672 671
relation derived from Eq. (1):
nidry ¼
nisample � nwaterf water
1� f iwater
. (12)
In the previous equation, the represented superscript refers tothe state of the tissue considered. In the calculations with thisformula, we have used the measurements of sample refractiveindex and above-calculated values for water content. Therefractive index of water used was 1.333. The calculated refractiveindex values for dry matter in each dehydrated state are presentedin Table 1.
Knowing that dry matter refractive index does not change withdehydration, we assume that the values represented in Table 1 areindependent calculations of the same value. This way from therefractive index values represented in Table 1, we have calculatedmean and standard deviation for dry matter refractive indexaccording to the following definitions [14]:
ndry ¼1
N
XN
i¼1
nidry, (13)
sdðndryÞ ¼
ffiffiffiffiffiffiffiffiffiffiffiffiffiffiffiffiffiffiffiffiffiffiffiffiffiffiffiffiffiffiffiffiffiffiffiffiffiffiffiffiffiffiffiffiffiffiffiffiffiffiffi1
N � 1
XN
i¼1
nidry � ndry
� �2
vuut . (14)
Applying these equations, we obtained
ndry ¼ 1:5823; sdðndryÞ ¼ 0:0260.
2.5. Water content and dry matter refractive index estimated on the
basis of data from Ref. [13]
We have performed a similar calculation to estimate therefractive index of dry matter based on no fat bovine muscledensity measured by the author of Ref. [13]. First, using Eqs. (7)and (9) and considering our mass measurements, we havecalculated water content for natural state and during dehydration.The calculated values are presented in Table 2.
Based on these values, we have determined the refractive indexfor dry matter using Eq. (12). In these calculations, we have usedthe measurements of sample refractive index and above-calcu-lated values for water content, presented in Table 2. Water
refractive index used was 1.333. The calculated values arepresented in Table 2.
Once again, assuming that dry matter refractive index has notchanged with sample dehydration, we assume that all valuesrepresented in Table 2 are independent calculations of the oneunique value. According to this assumption, we have calculatedmean and standard deviation for dry matter refractive indexaccording to Eqs. (13) and (14). The obtained values are:
ndry ¼ 1:5865; sdðndryÞ ¼ 0:0233.
For comparison, we have represented in Fig. 4, the twoevolutions of tissue water content with sample mass as calculatedon the basis of dry matter densities measured by differentresearch groups during the dehydration process we have appliedto our sample.
Water content calculated based on the data from the differentgroups show similar variation with dehydration, but water
ARTICLE IN PRESS
Table 3Parameters that characterize the natural tissue.
Natural rat muscle
Global refractive index 1.3980
Water content 0.75670.003
Solid part content 0.24470.003
Solid part refractive index (mean from both cases calculated above
based on data from Refs. [12,13])
1.58470.025
L. Oliveira et al. / Optics and Lasers in Engineering 47 (2009) 667–672672
content values for data from Ref. [13] tend to be a little bit higheralong the dehydration process.
3. Results and discussion
The natural water content for rat muscle has been reported as0.75670.003 [2]. From this value and using Eq. (11), we couldcalculate the dry matter content in natural rat muscle as 0.244.For this parameter, we considered the same uncertainty that hasbeen reported for the volume fraction of water in the naturaltissue.
Finally, we can present in Table 3 all the natural parameterscharacteristic of rat skeletal muscle.
We observe that the two refractive index values calculatedfrom the data measured by different research groups are not toodissimilar. On the other hand, we have to account that thesevalues were calculated assuming that dry matter from rat musclepresents the same density as dry matter from no fat bovinemuscle, since this data is not available for rat muscle.
The knowledge of these values has great interest for otherstudies like for instance optical clearing treatments applied to thetissues that we have performed [4], and that will be publishedsoon.
As shown in the previous sections, it is possible to use a simpleexperimental method to obtain information about the constitu-tion of a fibrous tissue and to discriminate the internal opticalproperties. The information obtained is of great importance forother studies that consider the development of optical diagnosisand treatment. Also for clinical and pharmacological studies thatconcern physiological modifications and drug distribution ontissues, it is very important to know the natural water content. Weintend to perform similar analysis to other types of tissues, to
acquire information on their natural composition and discrimi-nate the values of refractive index of tissue components.
Acknowledgements
The authors would like to thank Professor Deolinda LimaTeixeira and the Institute of Histology and Embryology ofProfessor Abel Salazar for all the support given to accomplishthe present work.
VVT is thankful for the support by Grant nos. 1.4.06,RNP.2.1.1.4473 of Federal Agency of Education of RF, RUXO-006-SR-06 of CRDF BRHE, and No. 06-02-16740-a of RFBR.
References
[1] Tuchin VV. Optical clearing of tissues and blood. Bellingham: SPIE Press;2006.
[2] Reinoso RF, Telfer BA, Rowland M. Tissue water content in rats measured bydesiccation. Journal of Pharmacological and Toxicological Methods 1997;38:87–92.
[3] Mobley J, Vo-Dinh T. Optical properties of tissue. In: Vo-Dinh T, editor.Biomedical photonics handbook. Boca Raton: CRC Press LLC; 2003.
[4] Oliveira L. Study of the spectral transmition response of biological tissuesunder the influence of different osmotic agents. Msc Thesis: Faculdade deEngenharia da Universidade do Porto, Portugal; 2007.
[5] Ginzburg AS, Gromov MA, Krasovskaya GI. Handbook on thermophysicalcharacteristics of food products. Moscow: Agropromizdat; 1990.
[6] Ma X, Lu JQ, Ding H, Hu Xin-Hua. Bulk optical parameters of porcine skindermis at eight wavelengths from 325 to 1557 nm. Optics Letters 2005;30(4).
[7] Galanzha EI, Solovieva AV, Tuchin VV, Wang RK, Proskurin SG. Application ofoptical coherence tomography for diagnosis and measurements of glycatedhemoglobin. In: Drexler W, editor. Proceedings of the SPIE, vol. 5140, 2003.p. 125–32.
[8] Tuchin VV. Tissue optics: light scattering methods and instruments formedical diagnosis. 2nd ed. WA, USA: Bellingham; 2007 [PM 166].
[9] Mazarevica G, Freivalds T, Jurka A. Properties of erythrocyte light refraction indiabetic patients. Journal of Biomedical Optics 2002;7(2):244–7.
[10] Gonchukov SA, Lazarev Yu B. Laser refractometry in medicine and biology.Laser Physics 2003;13(5):749–55.
[11] Zhernovaya OS, Tuchin VV. Measurements of refractive index of hemoglobinmixed with glucose at physiological concentrations. In: Tuchin VV, editor.Proceedings of the SPIE 6163, 61631Q-1-6; 2006.
[12] Latyshev VP, Gritsyn MN, Tsyrulnikova NA. Study of thermophysical proper-ties of food products in the temperature range 77–373 K. In: Proceedingsof the all union research institute of refrigerating industry. Moscow: 1980.p. 119–33.
[13] Kostaropoulos AE. Die Warme–and Temperature leitfahigkeit getrocketerLebensmittel. Diss Karlsruhe. 1971, 128 s.
[14] Maroco J. Analise estatıstica com utilizac- ao do SPSS. 2nd ed. Lisboa: Edic- oesSılabo; 2003.


![Unilateral partial absence of rectus abdominis muscle · abdominal wall muscles is very rare and its reported to occur in 7% of individuals [2]. The abdominal muscle that is absent](https://img.pdfslide.us/doc/110x75/5ecd2065420d6e300c51fe8e/unilateral-partial-absence-of-rectus-abdominis-muscle-abdominal-wall-muscles-is.jpg)


![Arthur Veis1,4, Kevin Tompkins1, Keith Alvares1, Kuiru ... · A rat incisor tooth odontoblast-pulp cDNA library was screened using ... [8,11] by embryonic rat muscle fibroblasts (EMF)](https://img.pdfslide.us/doc/110x75/5e88b9b3a5a6643ec265d245/arthur-veis14-kevin-tompkins1-keith-alvares1-kuiru-a-rat-incisor-tooth-odontoblast-pulp.jpg)