Embed Size (px)
Citation preview

ESD-TR-89-150
Technical Report 853
Optical Anti-aliasing Filters
R.E. Knowlden J.R. Leger
G.J. Swanson A.L. Kachelmyer
13 September 1989
Lincoln Laboratory MASSACHUSETTS INSTITUTE OF TECHNOLOGY
LEXINGTON, MASSACHUSETTS
Prepared for the Defense Advanced Research Projects Agency under Air Force Contract F19628-85-C-0002.
Approved for public release; distribution is unlimited.
BEST AVAILABLE COPY
A P4x/s ru

This report is based on studies performed at Lincoln Laboratory, a center for research operated by Massachusetts Institute of Technology. The work was sponsored by the Tactical Technology Office, Defense Advanced Research Projects Agency with the support of the Balanced Technology Initiative Program under Air Force Contract F19628-85-C-0002 (DARPA Order Number 600).
This report may be reproduced to satisfy needs of U.S. Government agencies.
The ESD Public Affairs Office has reviewed this report, and it is releasable to the National Technical Information Service, where it will be available to the general public, including foreign nationals.
This technical report has been reviewed and is approved for publication.
FOR THE COMMANDER
/vW/ J% ScruibuU
Hugh L. Southall, Lt. Col., USAF Chief, ESD Lincoln Laboratory Project Office
Non-Lincoln Recipients
PLEASE DO NOT RETURN
Permission is given to destroy this document when it is no longer needed.

MASSACHUSETTS INSTITUTE OF TECHNOLOGY
LINCOLN LABORATORY
OPTICAL ANTI-ALIASING FILTERS
R.E. KNOWLDEN JR. LEGER
G.J. SWANSON A.L. KACHELMYER
Group 52
TECHNICAL REPORT 853
13 SEPTEMBER 1989
Approved for public release; distribution is unlimited.
LEXINGTON MASSACHUSETTS

ABSTRACT
In an electro-optical imager, a readout device (e.g., CCD or vidicon) samples an image discretely. Often the sampling spatial frequency is much less than the Nyquist rate for the system optics. Scene clutter at higher spatial frequencies than the readout passband is aliased into the band, giving excess clutter in the observed image. A number of designs of pupil plane phase-only spatial filters to reduce this excess clutter, while maintaining the system transmittance, are described. The designs include continuous and binary phase filters in rectangular and polar coordinates. Some of the designs give significant reduction in the out-of-band clutter.
in

TABLE OF CONTENTS
Abstract iii
List of Illustrations vii
1. INTRODUCTION 1
2. COMMON CONSIDERATIONS 3
2.1 Sampling with Detectors of Finite Size 3 2.2 Clutter Reduction Figure of Merit 3
3. FILTER DESIGNS 5
3.1 Golay Codes for One-Dimensional Filtering 5 3.2 Square Biphase Masks for Two-Dimensional Filtering 6 3.3 Rotationally Symmetric Continuous Phase Masks 6 3.4 Rotationally Symmetric Binary Phase Masks 6
4. SUMMARY 9

LIST OF ILLUSTRATIONS
Figure No. Page
1 Aliasing with a One-Dimensional Signal 10
2 Typical Optical Readout Techniques 1 1
3 (a) Chirp Grating, (b) Filtered Chirp Grating, and (c) Sampled then Filtered Chirp Grating, Showing Aliasing 12
4 (a) MTF of Large Aperture (Solid) and Small Aperture (Dashes), (b) OTF of Finite Detector, (c) MTF of Large Aperture Plus Finite Detector, and (d) MTF of Small Aperture Plus Finite Detector 13
5 (a) MTF of One-Dimensional Optics, (b) OTF of Finite Detector, (c) Sampling Due to Detector Spacing (Solid), and Detector OTF
(Long Dashes), and (d) PSD Envelope with Sampling: Diffraction Limited (Dashes), Diffraction Limited Plus Finite Detector Size (Solid) 14
6 (a) Golay Code of Length 4, (b) Complementary Golay Code, (c) Autocorrelation of Golay Code (Solid) and Complement (Dashes), and (d) Sum of Autocorrelations 15
7 Golay Masks for One-Dimensional Filtering 16
8 Surface Plot of OTF of Golay Mask 17
9 Two-Dimensional Golay Masks 18
10 Surface Plot of OTF of Golay Mask Shown in Figure 9 19
11 Square Binary Mask for Two-Dimensional Filtering 19
12 Surface Plot of OTF of Mask Shown in Figure 11 20
13 MTF of Continuous Phase Mask (Solid) and Small Aperture (Dashes) 21
14 Radial Continuous Phase Function 21
15 Radial Phase Function After Removal of Best-Fit rms Focus 22
16 MTF for a Rotationally Symmetric Biphase Mask (Solid) and Small Aperture (Dashes) 22
17 Representation of a Biphase Mask: 0 Phase (White), n Phase (Black), and 0 Amplitude (Gray) 23
18 Generating Function for Biphase Mask 23
19 MTF of Biphase Mask Plus One Wave of Focus Error 24
VII
1. INTRODUCTION
Anti-aliasing filters are used with discrete time sampled electronic systems to prevent signal spectrum foldover (Figure 1). The filters reduce spurious signals due to aliasing and reduce the bandwidth of the noise.
Optical systems with electronic readout typically sample in one dimension (e.g., raster or pushbroom scanning) or two dimensions (CCDs). Figure 2 shows these cases. When the diffraction cutoff spatial frequency of the optics exceeds one-half the sampling spatial frequency of the readout, aliasing occurs. Aliasing introduces false spatial frequencies into the signal (spurious resolution), as shown in Figure 3. If high spatial frequency clutter is present, it can be aliased into the passband of the readout, giving excess clutter in the signal.
The simplest means of preventing aliasing would be to reduce the aperture of the optical system (stop it down) until its cutoff frequency becomes less than half of the readout sampling frequency. Consider a system with a CCD readout with a sampling increment of 25 (im, for use with visible (0.55-p.m wavelength) light. To prevent aliasing completely, the system f/number would have to be greater than 90. A more practical compromise would be f/45, giving some aliasing but increased signal per pixel. Depending on the number of pixels in the readout (which may be limited by data handling rates or detector technology), the need for low light level performance, and the desired angular field coverage of the sensor, a high f/number may be unacceptable.
This study is to examine the possibility of making phase-only modifications to an existing optical system that would give an anti-aliasing effect without reducing the throughput of the optics. The goal is to achieve the highest possible incoherent modulation transfer function (MTF) in the passband of the readout, with the MTF being as close to zero as possible everywhere outside the passband. Recall that the MTF is the modulus of the optical transfer function (OTF), which is equal to the scaled complex autocorrelation of the pupil function of the optics. Because of the autocorrelation, a phase-only mask can have the desired properties.
Because the phase (in waves or radians) introduced by such a mask is inversely proportional to wavelength, the spectral band of operation of the mask is important. The masks to be studied below are intended for operation over the bands 500 ±15 nm (Band 1) and 600 ±5 nm (Band 2).
Several different types of phase-only masks have been examined by numerical calculation. Some of these masks will be made and tested in the laboratory. No single design has been identified as ideal for all applications, so the virtues and drawbacks of each type will be discussed.

2. COMMON CONSIDERATIONS
2.1 SAMPLING WITH DETECTORS OF FINITE SIZE
In a real optical system, the detectors in the readout have finite area: they are not point samplers. Assume all the detectors are identical, and that each detector responds as a function of position; call this r (x.y). Assume also that the detectors are uniformly spaced on a rectangular grid of spacings Ax and Ay. Then, the sampling process can be represented mathematically as follows: take the cross correlation of the detector spatial response function with the image, and sample that at (Ax.Ay). In the Fourier transform plane, the correlation becomes a product with the flipped transform of the response function: call this R (- £.- h). If the response function is a square of size Ax, and Ay = Ax (100% fill factor), then a one-dimensional representa- tion of the spectrum of the sampling process is as shown in Figure 4. The finite detector size effects some prefiltering that reduces the aliasing.
2.2 CLUTTER REDUCTION FIGURE OF MERIT
The clutter in the scene will be assumed to have a uniform power spectral density (PSD) in order to give white spatial noise. Total noise power is then proportional to the integral over all spatial frequencies of the square of the product of the MTFof the optics and the two-dimensional sine function from the finite detector size. (The square is taken to obtain the PSD for the image; this is the correct PSD definition for an incoherent imaging system.) The figure of merit is defined as the quotient of the integral of the PSD of a diffraction limited optical system (including the finite detector size) outside the desired passband of the system and the integral of the out-of-band PSD of the system plus the anti-aliasing filter. For two-dimensional symmetrical sampling, the desired passband of the system is a circle in frequency space, centered at the origin, and of diameter 1/Ax in both axes (cutoff at radius l/2Ax). Figure 5 represents this pictorially. Note that if the anti- aliasing filter is perfect (its PSD is zero outside the passband), the figure of merit goes to infinity. The fig- ure of merit is always greater than or equal to 1.
Note that this figure of merit does not include clutter in the passband of the system readout. The figure of merit also does not include any consideration of the reduction in the PSD of the signal, so it is easy to define systems with little aliased clutter that give poor imagery. Other criteria (e.g., having the MTF be approximately equal to that of a stopped-down system) must be used to retain contrast. The figure of merit is only a measure of the effectiveness of the system in rejecting out-of-band clutter. A figure of merit of 1 means that the system has no better rejection than a diffraction limited system of the same aperture; a figure of merit of infinity means that no better rejection is possible.

3. FILTER DESIGNS
3.1 GOLAY CODES FOR ONE-DIMENSIONAL FILTERING
If the image readout in the optical system samples in one dimension, as with a raster or pushbroom scan system, a one-dimensional anti-aliasing filter may be all that is needed. If electronic time-domain sampling is to be done in the scan direction, electronic filtering can be used to prevent aliasing in that dimension. (For a pushbroom scan system, this may require one filter per scan line.) One-dimensional filtering can be per- formed with a binary phase mask.
Golay codes1 are binary codes. A complementary pair of Golay codes of length N have the property that the sum of the autocorrelations of the two codes is equal to 2N times the autocorrelation of a single "chip" (Figure 6), where a chip is the smallest element of the code. There are Golay code pairs for any N that is a power of 2.
Figure 7 shows one scheme for using one-dimensional Golay codes for filtering. The optics* aperture of diameter D is clipped to a square of side S (S < D/V 2). The square is then divided into sections of width S/4. Sections 1 and 3 are made to be binary phase masks that are Golay complements, with the correct half- wave depth for Band 1. Sections 2 and 4 are made Golay complements of the correct depth for Band 2. (Spectral filters prevent crosstalk between the pairs of sections.) Figure 8 shows a surface plot of the OTF of a mask with Golay codes of length 4. Note that the scale of the autocorrelation is such that the cutoff frequency for the square aperture of side S would be S/lf, where 1 is the wavelength, and f is the focal length of the optical system. Note also that a mask of this form gives a band of spatial frequencies where the MTF is zero beyond the passband.
The disadvantage of this technique is that the aperture area is cut to 1/n (= 0.318) that of the full cir- cular aperture per wave band. (The throughput remains much greater than for a stopped-down aperture, particularly if the readout passband is much less than the cutoff spatial frequency for the aperture.) The method is also intended for one-dimensional use, although the secondary maxima in the MTF are much less than the central peak.
A two-dimensional clutter figure of merit is defined above. The similar one-dimensional quantity (where the integrals are taken only along the spatial frequency axis corresponding to the direction along the code) for the Golay code of length 8 is infinity at the design wavelength. The reference MTF was for a diffraction limited aperture width of S.
The Golay masks may also be extended to two dimensions. Figure 9 shows a two-dimensional mask generated by taking two, length 16, one-dimensional codes, and writing them in sequence along rows into a 2 by 8 array. (In general, if a pair of codes of length N = 2m+n are written into a pair of arrays each 2m by 2n, then the sum of the autocorrelations of the resulting arrays has the Golay property in two dimensions.) Shown in Figure 10 is a surface plot of the autocorrelation of the mask in Figure 9.
M. J. E. Golay, IRE Trans. Inform. Theory, IT-7, April 1961, pp. 82-87.

3.2 SQUARE BIPHASE MASKS FOR TWO-DIMENSIONAL FILTERING
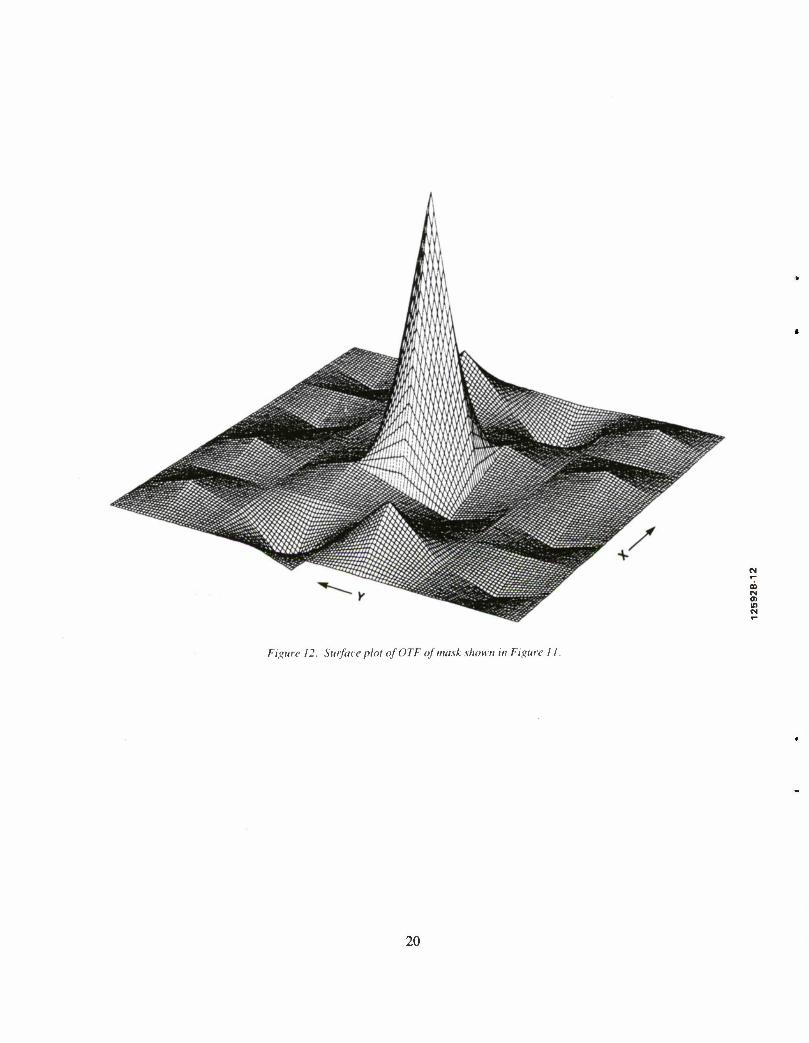
Figure 11 shows a square biphase mask that is designed to be a two-dimensional anti-aliasing filter. The mask was created by using a global search technique to find a pattern with minimal secondary correlations close to the central peak. (This method would be impractical for masks much larger than 4 by 4.) Figure 12 is a surface plot of the OTF produced for this mask. The largest absolute value of a secondary correlation is 3/16 (the peak is 1), and it occurs at high spatial frequencies.
3.3 ROTATIONALLY SYMMETRIC CONTINUOUS PHASE MASKS
A rotationally symmetric phase function may be placed on an optical surface by conventional figuring techniques or with a diffractive optic. The rotationally symmetric phase function here was taken as a radial polynomial including orders 2, 4, 6, 8, and 10.
The coefficients of the radial polynomial were determined by an optimization procedure. The goal of the optimization was to give a best match (in the rms error sense) to the MTF of a reduced aperture. (An alternate view of this method is generating a phase-only hologram in the system pupil that approximately gives the same point spread function as a smaller circular aperture.) The figure of merit defined above was not used in the optimization because it would tend to give a low MTF within the passband.
Figure 13 shows the monochromatic MTF for a continuous phase function that is intended to give a passband that cuts off at one-tenth the diffraction limited cutoff of the full aperture. It has a figure of merit of 423.8. The Figure of merit for a reduced aperture would be infinite. Figure 14 gives the phase function itself, and Figure 15 shows the residual phase after the best-fit focus error of 2.181 waves is removed. (Note that this is not the same as setting the second-order term in the polynomial to zero; the radial polynomial terms are not orthogonal.)
The dominant term in the radial phase function is the focus error. In practice, only the fourth- and higher-order terms in the polynomial would be needed, with the quadratic term supplied by defocusing the system. Unfortunately, this implies that the MTF would then be sensitive to focus errors and system aberrations. In a real system, this may be a serious limitation.
3.4 ROTATIONALLY SYMMETRIC BINARY PHASE MASKS
For the continuous radial phase function above, the sign of the phase error is unimportant; changing the sign does not change the resulting MTF. A biphase (binary phase) mask is a diffractive optical element that has phase values of zero or n only (alternately, it has amplitude values of+ 1 or -1).
If the mask is generated from a continuous phase function by taking the cosine of the phase and setting all nonnegative values to +1, and all negative values to -1, then the mask has the following properties:
(a) All of its even diffractive orders (including the zero order) are absent;
(b) The phase for each diffractive order is equal to the product of the order number and the original generating phase function;

(c) As a consequence of (b), adding a constant phase to the generating phase function changes the MTF of the system, because this leads to a constant phase in each diffracted order that is equal to the product of the added phase and the order number.
The idea behind using a biphase mask is to produce a similar effect as using a continuous phase mask, but because both positive and negative orders are present, the sensitivity to focus shifts may be less (i.e.. putting the system in focus for the +1 order would cause it to be out of focus for the -1 order). It was hoped that sensitivity to aberrations other than focus would also be lower than with the continuous phase function.
The generating phase function for the biphase mask was computed by the same sort of optimization as used above for the continuous phase mask, but the radial polynomial included orders 0,2,4,6, and 8 only.
Figure 16 shows the MTF for a system designed for a passband of width one-tenth of the diffraction limited system cutoff frequency. It has a figure of merit of 587.9. Figure 17 is a two-dimensional representation of the mask: white is phase 0, black is phase n, and gray is zero transmittance. Figure 18 gives the phase generating function. Because the dominant term is of the second order, the mask is nearly the same as a biphase Fresnel zone plate.
3.4.1 Sensitivity of Biphase Mask to Wavelength
A rotationally symmetric biphase mask was computed for a wavelength of 542 nm. It gave a figure of merit (as defined above) of 8.56. At the upper extreme of Band 1 (615 nm) the optical path step of the mask was in error (with respect to 0.5 waves) by approximately -0.06 waves, giving a merit function of 319.6. At 485 nm (the short wavelength extreme of Band 1), the error was +0.06 waves, and the figure of merit was 324.8. The MTFs at the different wavelengths were nearly identical to the MTF at the design wavelength. The performance of the biphase mask appears to be adequate over the two wavelength bands if the design wavelength of the mask is chosen correctly.
3.4.2 Sensitivity of Biphase Mask to Aberrations
Figure 19 gives the MTF of the above rotationally symmetric biphase mask with one wave of focus error added. Its corresponding figure of merit was 18.0. This shows that the biphase mask is relatively insensitive to aberrations in the optical system whose MTF is modified by the mask.

4. SUMMARY
Several different approaches were examined to provide an optical anti-aliasing function in a sensor system that minimizes the amount of light that must be discarded to reduce the clutter signal. The optimum approach has not been identified, but binary phase masks appear to provide a practical approach to the problem.
Further analysis needs to be performed for a real sensor, with known optical and readout character- istics. The addition of a single binary optical element (or binary surface on an existing element) can significantly improve the clutter rejection of a sensor.

SAMPLED FUNCTION
AX SAMPLING PERIOD )
REPLICATED SPECTRA
h-1/AX-H
• \ CM en to
ALIASED FREQUENCIES
Figure I. Aliasing with a one-dimensional signal.
10

• • O-
PUSHBROOM (ID Array, rj.
1-D Sampling) rj. D- D- • •
RASTER (Single Detector,
1-D Sampling)
DDDDDDDDDO DDDDDDDDDD DDDDDDDDDD DDDDnDDDDD
2 - D ARRAY DDDDDDDDDD 2 - D SAMPLING DDDDDDDDDD
f DDDDDDDDDD S DDDDDDDDDD S nnDDDDDnnn 2 DDDDDDDDDD
Figure 2. Typical optical readout techniques.
II

10 \ u I 1 j 1
1 1
0.8 -\
g 06 UJ
5 0.4 in 0.2 -I lUllllI
0.2 0.4 0.6 0
ARBITRARY UNITS
(a)
8 1.0
0.2 0.4 0.6 0.8
ARBITRARY UNITS
(b)
0.2 04 0.6 0.8
ARBITRARY UNITS
(c)
00
Figure 3. (a) Chirp grating, (b) filtered chirp grating, and (c) sampled then filtered chirp grating, showing aliasing.
12

0.2 0.4 0.6 0.8 1.0
SPATIAL FREQUENCY
0.2 0.4 0 6 0 8 1 0
SPATIAL FREQUENCY
CD (S CD in
0.2 04 0.6 0.8
SPATIAL FREQUENCY
I ' ' ' '« 08 — —
£ 06
E. 0.4 :
£ 02 -
0 V i i i i 0.2 0.4 0.6 0.8 1.0
SPATIAL FREQUENCY
Figure 4. (a) MTF of large aperture (solid) and .small aperture! dashes I lb) OTF of finite detector, (c) MTF of large aperture plus finite detector, and (dt MTF of small aperture plus finite detector.
13

-0.5 0 0 5 10
SPATIAL FREQUENCY
1.0 -0.5 0 0.5 10
SPATIAL FREQUENCY
10 _ (c) ~
0.8
0.6
\
\
JJ. 0.4
O 0.2
0
-02
'— \
\
\
—
\ y
-04 1 1 0.1 0.2 0 3
SPATIAL FREQUENCY
04
UJ a O _i LU > z LU
Q
a.
-0.5 0 0.5 1.0
SPATIAL FREQUENCY
O) in
Figure 5. (a) MTF of one-dimensional optics, (h) OTF of finite detector, (c) sampling due to detector spacing (solid), and detector OTF (long dashes), and id) PSD envelope with sampling: diffraction limited (dashes), diffraction limited plus finite detector size (solid).
14

1 — LU D
Q. 3 <
1 1 1 1 1 1 (a)
1 1 1 1 1 1 12 3 4 5 6
ARBITRARY UNITS
D
Q. s <
1 1 1 1 1 1 (b)
1 1 1 1 1 1 1 2 3 4 5 6 7
ARBITRARY UNITS
00
in
8
CE tr O o o t-
<
4 —
I I I 1 1 1 (c)
— - 1
1
1 1 '
• •
1 1 1 1 1 1
2 —
1/3
O cc
i ° <* o
K
<
0 12 3 4 5 6
ARBITRARY UNITS
B
6
I I I I I I (d)
4 —
2
0
•?
—
I I I I I I 1 2 3 4 5 6
ARBITRARY UNITS
Figure 6. la) Golay code of length 4, (h) complementary Golay code, (c) autocorrelation of Golay code (solid) and complement f dashes), and fdi sum of autocorrelations.
15

as
BAND 1 BAND 2
Figure 7. Golay masks for one-dimensional filtering.
16

CM 01
Figure 8. Surface plot of OIF ofGolay mask.
17

CO CM (7)
BAND 1 BAND 2
Figure 9. Two-dimensional Goluy masks.
IX

CM
Figure 10. Surface plot ofOTF ofGolax mask shown in Figure 9.
CO CM o> in CM
Figure II. Square binary mask for two-dimensional filtering.
19
s
Figure 12. Surface plot ofOTF of mask shown in Figure II.
20

CO cs c> in CM
0.2 0.4 0.6 0.8
SPATIAL FREQUENCY
10
Figure 13. MTF of continuous phase mask (solid) and small aperture (dashes).
en
CM
02 0.4 0.6
RADIUS IN PUPIL
1 0
Figure 14. Radial continuous phase function.
21

0.2 0.4 0.6
RADIUS IN PUPIL
08 CM
Figure 15. Radial phase function after removal of best-fit rms focus.
0.2 0.4 0.6 0.8
SPATIAL FREQUENCY
10 CM
2 CM
Figure 16. MTF for a rotationally symmetric biphase mask (solid) and small aperture (dashes).
22

Figure 17. Representation of a biphase mask: I) phase t while), n phase (black), and 0 amplitude (grayl
in (SI
02 04 06
RADIUS IN PUPIL
1 o
Figure Iti. Generating function for biphase mask.
23

0.2 0.4 0.6 0.8
SPATIAL FREQUENCY
10 rvi
in CM
Figure 19. MTF of biphase mask plus one wave of focus error.
24

UNCLASSIFIED SECURITY CLASSIFICATION OF THIS PAGE
REPORT DOCUMENTATION PAGE 1a. REPORT SECURITY CLASSIFICATION
Unclassified
1b. RESTRICTIVE MARKINGS
2a. SECURITY CLASSIFICATION AUTHORITY
2b. DECLASSIFICATION/DOWNGRADING SCHEDULE
3. DISTRIBUTION/AVAILABILITY OF REPORT
Approved for public release; distribution is unlimited.
4. PERFORMING ORGANIZATION REPORT NUMBER(S)
Technical Report 853
5. MONITORING ORGANIZATION REPORT NUMBER(S)
ESD-TR-89-150
6a. NAME OF PERFORMING ORGANIZATION
Lincoln Laboratory, MIT
6b. OFFICE SYMBOL (If applicable)
7a. NAME OF MONITORING ORGANIZATION
Electronic Systems Division
6c. ADDRESS (City. State, and Zip Code)
P.O. Box 73 Lexington, MA 02173-0073
7b. ADDRESS (City, State, and Zip Code)
Hanscom AFB, MA 01731
8a. NAME OF FUNDING/SPONSORING ORGANIZATION
Defense Advanced Research Projects Agency
8b. OFFICE SYMBOL (If applicable)
9. PROCUREMENT INSTRUMENT IDENTIFICATION NUMBER
F19628-85-C-0002 (DARPA Order Number 600)
8c. ADDRESS (City, State, and Zip Code)
1400 Wilson Boulevard Arlington, VA 22209
10. SOURCE OF FUNDING NUMBERS
PROGRAM ELEMENT NO.
PROJECT NO.
305
TASK NO.
WORK UNIT ACCESSION NO
11. TITLE (Include Security Classification) Optical Anti-aliasing Filters
12. PERSONAL AUTHOR(S) R.E. Knowlden, J.R. Leger, G.J. Swanson, A.L. Kachelmyer
13a. TYPE OF REPORT Technical Report
13b. TIME COVERED FROM TO .
14. DATE OF REPORT (Year. Month, Day) 1989, September 13
15 PAGE COUNT 34
16. SUPPLEMENTARY NOTATION
None
17 COSATI CODES
FIELD GROUP SUB-GROUP
18. SUBJECT TERMS (Continue on reverse if necessary and identify by block number)
incoherent optical processing spatial filters phase-only spatial filters
binary phase spatial filters Golay codes
19. ABSTRACT (Continue on reverse if necessary and identify by block number)
In an electro-optical imager, a readout device (e.g., CCD or vidicon) samples an image discretely. Often the sampling spatial frequency is much less than the Nyquist rate for the system optics. Scene clutter at higher spatial frequencies than the readout passband is aliased into the band, giving excess clutter in the observed image. A number of designs of pupil plane phase-only spatial filters to reduce this excess clutter, while maintaining the system transmittance, are described. The designs include continuous and binary phase filters in rectangular and polar coordinates. Some of the designs give significant reduction in the out-of- band clutter.
20. DISTRIBUTION/AVAILABILITY OF ABSTRACT
O UNCLASSIFIED/UNLIMITED B SAME AS RPT. D DTIC USERS
21. ABSTRACT SECURITY CLASSIFICATION Unclassified
22a. NAME OF RESPONSIBLE INDIVIDUAL
Lt. Col. Hugh L. Southall, USAF
22b. TELEPHONE (Include Area Code) (617) 981-2330
22c. OFFICE SYMBOL ESD/TML
DD FORM 1473. 84 MAR 83 APR edition may be used until exhausted. All other editions are obsolete.
UNCLASSIFIED SECURITY CLASSIFICATION OF THIS PAGE