Embed Size (px)
Citation preview
Department of Mechanical and Aerospace Engineering
Opportunity for Mechanical Ventilation Heat Recovery
System in Hotel Sector
Author: Pradheep Ganesan
Supervisor: Fiona F. Bradley
A thesis submitted in partial fulfilment for the requirement of the degree
Master of Science
Sustainable Engineering: Renewable Energy Systems and the Environment
2013
2
Department of Mechanical & Aerospace Engineering
Copyright Declaration
This thesis is the result of the author’s original research. It has been composed by the author
and has not been previously submitted for examination which has led to the award of a
degree.
The copyright of this thesis belongs to the author under the terms of the United Kingdom
Copyright Acts as qualified by University of Strathclyde Regulation 3.50. Due
acknowledgement must always be made of the use of any material contained in, or derived
from, this thesis.
Signed: Pradheep Ganesan Date: 6/09/2013
3
Department of Mechanical & Aerospace Engineering
ABSTRACT
Consumption of electrical energy and CO2 emission was high in hotel sector. Therefore to
curb power consumption and to improve the indoor comfort a new approach had proposed by
re-use of warm air or moist exist in the hotel with the application of Mechanical Ventilation
Heat Recovery hotel (MVHR) system and energy required for operation was investigated in
this report.
Literature review on low carbon and energy conservation measures adopted in hotels across
various country was examined. Later cause and effects of indoor air quality issues affecting
the building environment and human health was reviewed with the recommendations to
overcome the problems. Consequently different ventilation strategies and distinct reason for
selecting MVHR system was examined. Beside methodology and steps implemented to
model a hotel and plant system was explained
Model a storey hotel (ground floor and first floor) with their actual construction materials,
optical properties and employing an air handling unit incorporated with heating coil and
cooling coil was simulated in Building Energy Management Tool (ESP-r). Spread sheet
calculation are carried out for modelling the duct system.
A model without plant system was primarily simulated at summer and winter seasons to
examine the zones- indoor environment comfort, DB temperature, wind speed & direction,
relative humidity and power and hours required for cooling and heating purposes. Further,
analysis is carried out with employing plant system and result obtained is compared with the
previous result. Besides the effective utilization of electric power is determined by
calculating the power factor with the findings of real and reactive power consumption in kWh
over each month. In addition, post occupancy evaluation of the building is carried out and
compared with energy bench mark to find the standard of the building.
Result analysis and discussion highlight the improvement obtained in indoor comfort of the
zone with the correspondence change in dB temperature and relative humidity level.
Furthermore, recommendation to improve the efficiency of the plant as well as to reduce the
hotel power consumption was discussed.
MVHR system appears to be the best way to provide both heating and cooling to the zones of
hotel to improve the human comfort by the way of utilizing the heat or moist air. On adopting
this methodology would minimizes the power consumption as well as carbon emission.
4
Department of Mechanical & Aerospace Engineering
Acknowledgements
I would like to thank my supervisor Miss. Fiona F. Bradley for her advice and guidance on
the project.
I would also like to thank the General Manager of Holiday Inn (Theatre Land) and all the
staff who were responsible for their involvement and enthusiasm in this project.
5
Department of Mechanical & Aerospace Engineering
Contents ABSTRACT ............................................................................................................................... 3
Acknowledgements .................................................................................................................... 4
List of Figures ............................................................................................................................ 7
List of tables ............................................................................................................................. 10
NOMENCLATURE ................................................................................................................ 11
1 INTRODUCTION ................................................................................................................ 12
2 LITERATURE REVIEW ON LOW CARBON TECHNOLOGIES AT HOTEL SECTOR
IN VARIOUS COUNTRIES ................................................................................................... 14
2.1 UNITED KINGDOM (UK) ........................................................................................... 15
2.2 GERMANY ................................................................................................................... 17
2.3 INDIA ............................................................................................................................ 17
2.5 DUBAI ........................................................................................................................... 18
2.6 AUSTRALIA ................................................................................................................. 19
2.7 USA................................................................................................................................ 20
3 INDOOR AIR QUALITY .................................................................................................... 22
3.1 AIR QUALITY ISSUES AFFECTING THE BUILDING & HUMAN HEALH ......... 22
3.1.1 Sick Building Syndrome (SBS) .............................................................................. 22
3.1.2 Moulds and Moisture .............................................................................................. 24
3.1.3 Dust mites ............................................................................................................... 25
3.1.4 Tobacco smoke ....................................................................................................... 26
3.1.5 Carbon monoxide (CO)........................................................................................... 27
3.1.6 Nitrogen dioxide (NO2)........................................................................................... 28
3.1.7 Volatile Organic Compounds (VOC) ..................................................................... 29
4 NEED FOR VENTILATION SYSTEM .............................................................................. 31
4.1 VENTILATION STRATEGIES .................................................................................... 31
4.1.1 Natural ventilation .................................................................................................. 31
4.1.2 Passive stack ventilation ......................................................................................... 32
6
Department of Mechanical & Aerospace Engineering
4.1.3 Mechanical extract ventilation ................................................................................ 33
5 MECHANICAL VENTILATION HEAT RECOVERY SYSTEM (MVHR) ..................... 35
5.1 OPERATION OF MVHR SYSTEM ............................................................................. 35
5.2 ADVANTAGES OF MVHR SYSTEM ........................................................................ 36
5.3 DISADVANTAGES OF MVHR SYSTEM [51] .......................................................... 39
5.4 MVHR SYSTEM TYPES ............................................................................................. 39
6 METHODOLOGY ............................................................................................................... 43
7 MODELLING ....................................................................................................................... 44
7.1 CONTEXT ..................................................................................................................... 44
7.2 MODEL DESCRIPTION .............................................................................................. 45
7.3 GEOMETRY DESCRIPTION ...................................................................................... 47
7.4 CONSTRUCTION MATERIALS ................................................................................. 50
7.5 OPERATIONAL DETAILS .......................................................................................... 52
7.6 PLANT SYSTEM .......................................................................................................... 57
8 ENERGY PERFORMANCE ANALYSIS ........................................................................... 66
9 RESULT ............................................................................................................................... 69
9.1 MODEL WITHOUT PLANT SYSTEM ....................................................................... 69
9.1.1 Winter simulation.................................................................................................... 69
9.1.2 Summer simulation ................................................................................................. 75
9.2 MODEL WITH PLANT SYSTEM ............................................................................... 82
9.2.1 Winter simulation.................................................................................................... 82
9.2.2 Summer simulation ................................................................................................. 89
9.3 COMPARISON OF INDOOR ENVIRONMENT COMFORT .................................... 92
Winter season- A model without plant system and with plant system ............................ 93
Summer season- A model without plant system and with plant system .............................. 97
9.4 ENERGY ANALYSIS................................................................................................... 99
ENERGY COMPARISON ................................................................................................ 101
7
Department of Mechanical & Aerospace Engineering
10 ANALYSIS AND DISCUSSION .................................................................................... 103
CONCLUSION ...................................................................................................................... 108
APPENDIX-A........................................................................................................................ 109
APPENDIX-B ........................................................................................................................ 111
REFERENCES ...................................................................................................................... 117
List of Figures
Figure 1: Sick building Syndrome [64] ................................................................................... 23
Figure 2: Condensation on walls [65] ...................................................................................... 24
Figure 3: Mould growth on windows [66] ............................................................................... 25
Figure 4: Dust mites [67] ......................................................................................................... 26
Figure 5: Tobacco smoke [68] ................................................................................................. 27
Figure 6: Sources of CO [69] ................................................................................................... 28
Figure 7: Source of NO2 [70] ................................................................................................... 29
Figure 8: Outdoor and indoor VOC source model ................................................................... 29
Figure 9: Indoor VOC sources (source: http://www.airpurifierguide.org ) ............................. 30
Figure 10: Natural ventilation through windows (Source: http://www.edsl.net)..................... 31
Figure 11: Passive stack ventilation (source: http://www.tek.kingspan.com) ......................... 32
Figure 12: Mechanical extract ventilation system(source: http://www.homeventilation.co.uk)
.................................................................................................................................................. 33
Figure 13: MVHR system in domestic sector (source: http://www.polypipe.com) ................ 35
Figure 14: Relative Humidity (Source: http://www.air-conditioning-advice.com) ................. 36
Figure 15: Environmental and Personal factors affecting thermal comfort [57] ..................... 38
Figure 16: Winter and summer comfort (Source: http://isvox.blogspot.co.uk) ....................... 38
Figure 17: Cross flow plate heat exchanger (Source: http://www.xetexinc.com) ................... 40
Figure 18: Thermal wheel (Source: http://www.datacenterknowledge.com) .......................... 41
Figure 19: Holiday inn (Source: http://www.ga-taxis.co.uk) .................................................. 44
Figure 20: Ground floor model ................................................................................................ 46
Figure 21: First floor model ..................................................................................................... 46
Figure 22: Holiday inn model ................................................................................................. 47
Figure 23: Model of restaurant ................................................................................................ 47
8
Department of Mechanical & Aerospace Engineering
Figure 24: Model of kitchen .................................................................................................... 48
Figure 25: Model of office ....................................................................................................... 48
Figure 26: Model of lobby ....................................................................................................... 49
Figure 27: Model of bedroom1 ................................................................................................ 49
Figure 28: People doing moderate office work........................................................................ 52
Figure 29: People involved in cooking or cleaning ................................................................. 52
Figure 30: People sleeping ....................................................................................................... 53
Figure 31: Sensible gain from lighting .................................................................................... 53
Figure 32: Casual gain of restaurant ........................................................................................ 54
Figure 33: Casual gain of kitchen ............................................................................................ 55
Figure 34: Casual gain of office............................................................................................... 55
Figure 35: Casual gain of lobby ............................................................................................... 56
Figure 36: Casual gain of bedroom1 ........................................................................................ 57
Figure 37: Plant system model ................................................................................................. 58
Figure 38: Parameter calculations for duct system at ground and top floor ............................ 59
Figure 39: Volume flow rate VS Pressure drop ....................................................................... 60
Figure 40: List of components and connections ...................................................................... 61
Figure 41: Connection of components and plant linkage to zones .......................................... 62
Figure 42: Connection of components and plant linkage to zones .......................................... 63
Figure 43: Parameter calculations for duct system at ground floor ......................................... 64
Figure 44: List of components and connections ...................................................................... 64
Figure 45: Connection of components and plant linkage to zones .......................................... 65
Figure 46: Electricity consumption of the building ................................................................. 66
Figure 47: Gas consumption of the building............................................................................ 67
Figure 48: Electrical power calculations .................................................................................. 68
Figure 49: Graphical representation of ambient DB ................................................................ 69
Figure 50: Graphical representation of DN solar intensity ...................................................... 70
Figure 51: DB temperature of KN and RT .............................................................................. 71
Figure 52: DB temperature of LY and OE............................................................................... 71
Figure 53: RH of KN and RT .................................................................................................. 72
Figure 54: RH of OE and LY ................................................................................................... 72
Figure 55: DB temperature of B1 and B2 ................................................................................ 73
Figure 56: DB temperature of B3 and B4 ................................................................................ 74
Figure 57: RH of B1 and B2 ................................................................................................... 74
9
Department of Mechanical & Aerospace Engineering
Figure 58: RH of B3 and B4 .................................................................................................... 75
Figure 59: Graphical representation of ambient DB temperature ............................................ 76
Figure 60: Graphical representation of DN solar intensity ...................................................... 77
Figure 61: DB temperature of KN and RT .............................................................................. 78
Figure 62: DB temperature of LY and OE............................................................................... 78
Figure 63: RH of KN and RT .................................................................................................. 79
Figure 64: RH of OE and LY ................................................................................................... 79
Figure 65: DB temperature of B1 and B2 ................................................................................ 80
Figure 66: DB temperature of B3 and B4 ................................................................................ 81
Figure 67: RH of B1 and B2 .................................................................................................... 81
Figure 68: RH of B3 and B4 .................................................................................................... 82
Figure 69: DB temperature of KN and RT .............................................................................. 83
Figure 70: DB temperature of LY and OE............................................................................... 83
Figure 71: RH of RT ................................................................................................................ 84
Figure 72: RH of KN ............................................................................................................... 84
Figure 73: RH of OE ................................................................................................................ 85
Figure 74: RH of LY ................................................................................................................ 85
Figure 75: DB temperature of B1 and B2 ................................................................................ 86
Figure 76: DB temperature of B3 and B4 ................................................................................ 86
Figure 77: RH of B1 ................................................................................................................ 87
Figure 78: RH of B2 ................................................................................................................ 87
Figure 79: RH of B3 ................................................................................................................ 88
Figure 80: RH of B3 ................................................................................................................ 88
Figure 81: DB temperature of KN and RT .............................................................................. 89
Figure 82: DB temperature of LY and OE............................................................................... 90
Figure 83: RH of RT ................................................................................................................ 90
Figure 84: RH of KN ............................................................................................................... 91
Figure 85: RH of OE ................................................................................................................ 91
Figure 86: RH of LY ................................................................................................................ 92
Figure 87: Indoor air comfort of restaurant ............................................................................. 93
Figure 88: Indoor air comfort of kitchen ................................................................................. 94
Figure 89: Indoor air comfort of bedroom1 ............................................................................. 95
Figure 90: Indoor air comfort of bedroom2 ............................................................................. 96
Figure 91: Indoor air comfort of restaurant ............................................................................. 97
10
Department of Mechanical & Aerospace Engineering
Figure 92: Indoor air comfort of kitchen ................................................................................. 98
Figure 93: Annual electricity consumption comparison .......................................................... 99
Figure 94: Annual CO2 Emission comparison ...................................................................... 100
Figure 95: Annual gas consumption comparison................................................................... 100
Figure 96: Annual CO2 Emission comparison ...................................................................... 101
Figure 97: Energy delivered................................................................................................... 101
List of tables
Table 1: Representation of zones, subcategories and energy type [2]. .................................... 14
Table 2: Energy benchmark ..................................................................................................... 67
Table 3: Climate parameters ................................................................................................... 69
Table 4: DB temperature and relative humidity for ground floor zones .................................. 71
Table 5: DB temperature and relative humidity of top floor zones ......................................... 73
Table 6: Climate parameters ................................................................................................... 76
Table 7: DB temperature and relative humidity of ground floor zones ................................... 77
Table 8: DB temperature and relative humidity of top floor zones ......................................... 80
Table 9: DB temperature and relative humidity of ground floor zones ................................... 82
Table 10: DB temperature and relative humidity of ground floor zones ................................. 86
Table 11: DB temperature and relative humidity of ground floor zones ................................. 89
Table 12: Annual electricity consumption comparison ........................................................... 99
Table 13: Annual CO2 Emission comparison ......................................................................... 99
Table 14: Annual CO2 Emission comparison ....................................................................... 100
Table 15: Annual CO2 Emission comparison ....................................................................... 101
Table 16: kWhr energy delivered .......................................................................................... 102
Table 17: ASHARE thermal comfort table ............................................................................ 105
Table 18: ESP-r thermal comfort table .................................................................................. 105
11
Department of Mechanical & Aerospace Engineering
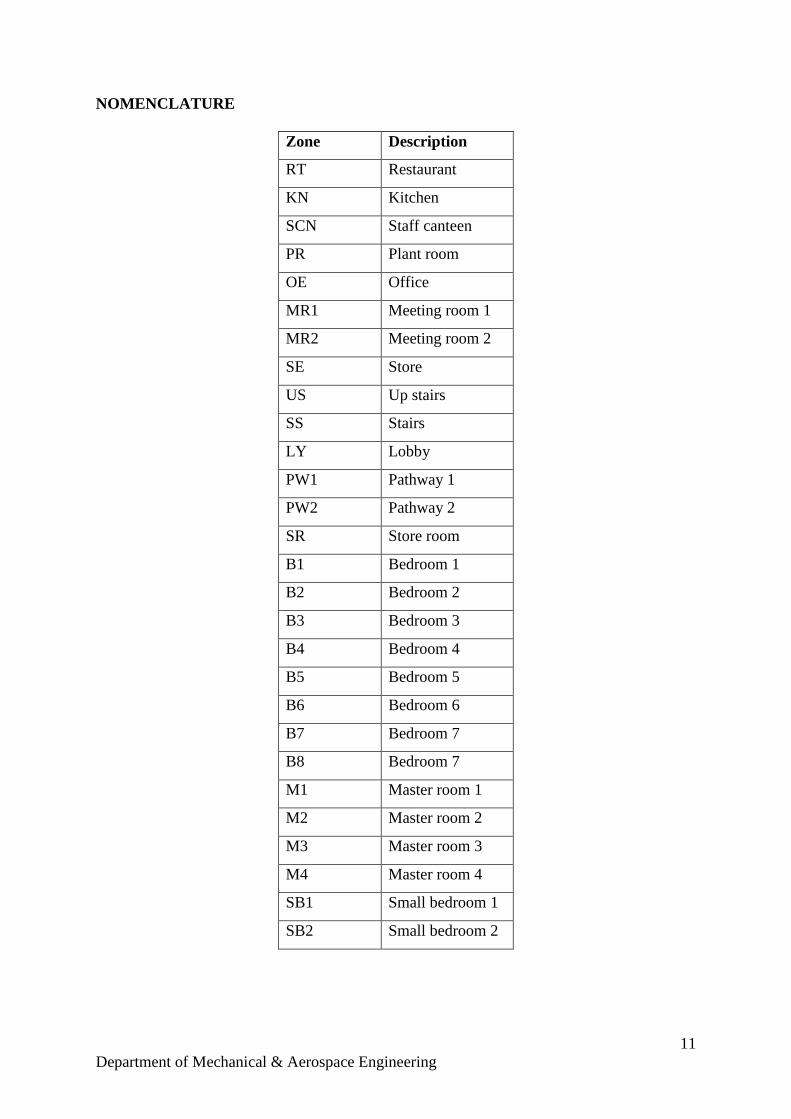
NOMENCLATURE
Zone Description
RT Restaurant
KN Kitchen
SCN Staff canteen
PR Plant room
OE Office
MR1 Meeting room 1
MR2 Meeting room 2
SE Store
US Up stairs
SS Stairs
LY Lobby
PW1 Pathway 1
PW2 Pathway 2
SR Store room
B1 Bedroom 1
B2 Bedroom 2
B3 Bedroom 3
B4 Bedroom 4
B5 Bedroom 5
B6 Bedroom 6
B7 Bedroom 7
B8 Bedroom 7
M1 Master room 1
M2 Master room 2
M3 Master room 3
M4 Master room 4
SB1 Small bedroom 1
SB2 Small bedroom 2
12
Department of Mechanical & Aerospace Engineering
1 INTRODUCTION
Globally, hotel sector is one of the fast growing industry providing jobs for over 200 million
people and leads to a status of greatest employee recruiter. People generally prefer hotel for
various reasons like leisure, business and entertainment. Among this, it is mainly connected
to tourism and flow rate is high as well as holds the main revenue contribution. In many
countries it plays as one of the most important economy flow sector. Throughout the world
there are over 2155 hotel groups with 61076 hotels which encompasses 8119731 rooms [1].
Hence to attract the tourist, huge amount of money is invested in amenities, entertainment
and hotel environment comfort.
Hotels are classified in to one star, two star, three star, four star and five star hotels. This
assortments are made in terms of building infrastructure, room space and comfort, high-tech
equipment in each room, swimming pool and gym, furniture’s and lighting facilities [2]. The
hotel which incorporates the above facilities to increase the customer inflow, consumes large
amount of resources like water, food, electricity and fuel. This resource utilization will differ
substantially from various hotel types and influenced by size, class, number of rooms,
locations and climate zone. Besides consumption of the above resources, this results in
potential emissions like carbon dioxide, nitrous oxide, hydro fluorocarbons, etc. released to
air, water and land. The potential emissions from this sector causes furthermore increase in
environmental threat like global warming, acid rain etc. Therefore to reduce this negative
effect on the environment as well as to reduce the energy consumption and cost, use of low
carbon technologies and efficient devices have emerged in each and every sector.
Low carbon technologies have a crucial role to play imminently in a green economy. This
promising technology have a tendency to reduce the carbon foot print at every stage of
process from low carbon energy generation, through storage and transmission, to end user
efficiency. This technology is associated with low carbon building, low carbon fuel standard
and low carbon power. Low carbon buildings are designed and constructed in a way to
decrease greenhouse gas emission throughout its life time. Buildings are responsible for
38% of CO2 emission (20% residential, 18% commercial) [3]. CO2 emissions associated
with building operations are mainly from:
Electricity consumption
On-site waste water treatment
On-site solid wastes treatment
13
Department of Mechanical & Aerospace Engineering
An energy efficiency measure accomplished to curb greenhouse gas emission and to save the
energy bills are achieved through the architectural building design such as natural ventilation,
open space for solar absorption, etc. Further many technologies like cavity wall and loft
insulation, double glazing, triple glazing and energy efficiency machines like CHP, MVHR,
HVAC and heat pumps are emerged to reduce carbon emissions, power consumption, indoor
air contaminants, etc. Coupling MVHR with heat pumps reduces the electricity consumption
but it’s is expensive [4].
Ventilation serves a major part in indoor air quality. There is a standard value allocated for
air exchange and when it deviates the standard value then discomfort and indoor air quality
issues are created inside the building. According to the National Institute for Occupational
Safety and Health’s (NIOSH) finding, “in 52% of our investigations, the building ventilation
has been inadequate”. This inadequate ventilation cause serious health problems and
discomfort [5].
Recent surveys show that the UK is one of the countries with the highest prevalence of
respiratory symptoms and asthma worldwide, both for children and adults (Janson C. et al.,
2001; ISAAC Steering Committee, 1998). A number of studies indicate that between the
mid-1960s and the mid-1990s there was an increase in asthma prevalence in the UK of
approximately 5% per year (Devereux G. et al., 2003). This is due to indoor dust mites and
moulds form at higher indoor moisture level. This could be avoided by installing
dehumidifiers or ventilation system [5].
The project benefited from access to a Holiday inn hotel at theatreland in Glasgow granted
through Chardon Hotel Management Ltd. The theme of the dissertation is to improve the
indoor environment comfort of the guest rooms by the use of exhausted heat or warm air
from the hotel. For this purpose MVHR system is installed in the building.
14
Department of Mechanical & Aerospace Engineering
2 LITERATURE REVIEW ON LOW CARBON TECHNOLOGIES AT HOTEL
SECTOR IN VARIOUS COUNTRIES
In worldwide commercial sector, hotel industry is the major consumer of power and water
and high producer of waste. Hence the awareness among the hoteliers have emerged
regarding the social and environmental impacts and drive them towards the sustainability
through their operation and development. To achieve sustainability hoteliers are greatly aims
on to diminish the impact on the environment as well as to improve their operational
efficiency in three major sectors
Energy
Water and
Waste
ENERGY
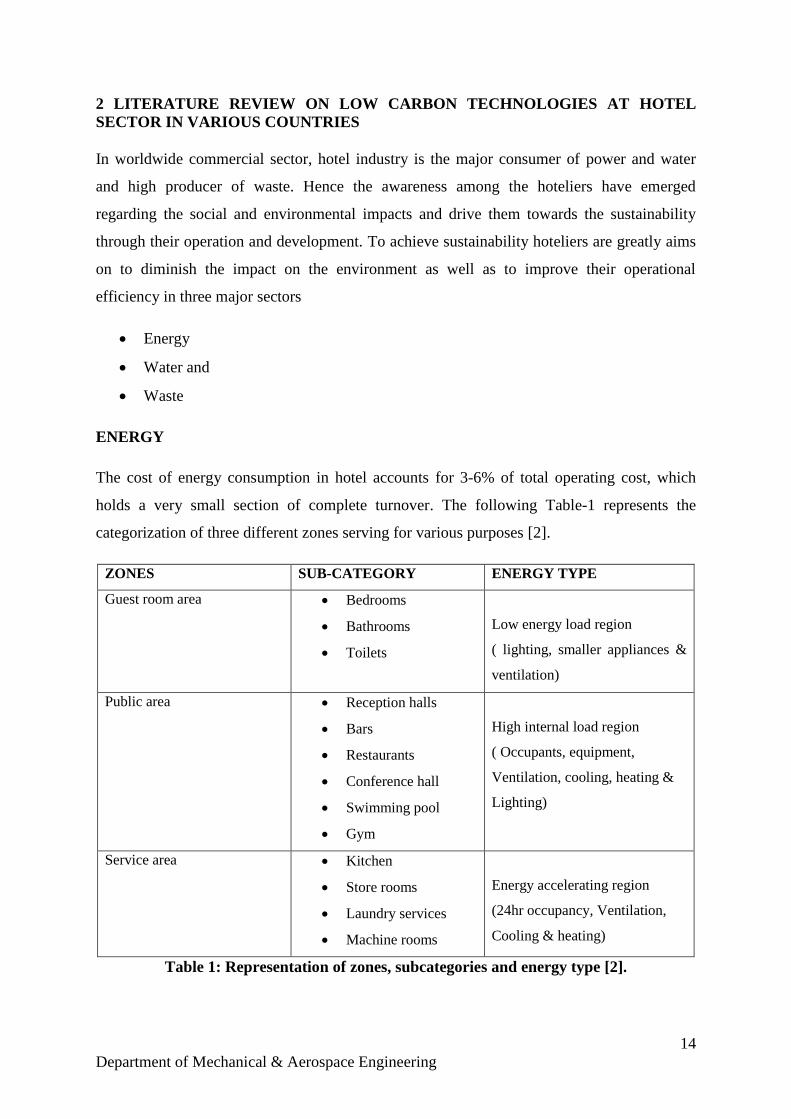
The cost of energy consumption in hotel accounts for 3-6% of total operating cost, which
holds a very small section of complete turnover. The following Table-1 represents the
categorization of three different zones serving for various purposes [2].
ZONES SUB-CATEGORY ENERGY TYPE
Guest room area Bedrooms
Bathrooms
Toilets
Low energy load region
( lighting, smaller appliances &
ventilation)
Public area Reception halls
Bars
Restaurants
Conference hall
Swimming pool
Gym
High internal load region
( Occupants, equipment,
Ventilation, cooling, heating &
Lighting)
Service area Kitchen
Store rooms
Laundry services
Machine rooms
Energy accelerating region
(24hr occupancy, Ventilation,
Cooling & heating)
Table 1: Representation of zones, subcategories and energy type [2].
15
Department of Mechanical & Aerospace Engineering
The energy flow rate in the above regions vary from time to time and it has to be handled in
an appropriate way. Monitoring and record keeping of the energy flows in each region by an
advance equipment is possible but it is costlier and complicate to implement it. By installing
energy efficient devices for lighting, heating and cooling systems hoteliers can diminish the
cost of energy consumption and recycle the waste effectively. The following hotels represents
the practices executed by the hotelier in some countries across the world.
Resource conservation measures taken by hotels in the countries:
2.1 UNITED KINGDOM (UK)
The Great Hallingbury Manor:
The hotel has imposed various energy saving technologies during construction as well as in
the retrofit. The energy conservation technology equipped by the hotel are the following:
Insulation and double glazed windows are installed to reduce the thermal losses in the
building.
Ground source heat pump is installed to extract the natural heat from the earth surface
to heat the water which is supplied to hotel and restaurant.
Nordic converters are used to provide cooling and heating for the offices and
conference room.
The portion of hotel electricity is provided by a bio-diesel generator, which takes
recycled cooking oil as a fuel.
Waste food is recycled using food waste disposer device in terms of high grade soil
fertilizer for vegetables, fruits, herbs, etc. [6].
The Guoman Hotel:
Light Emitting Diode (LED) is equipped as a basic standard in the building, specially
designed motion sensors have been installed in conference rooms and energy efficient air
conditioning units are installed to conserve energy usage. Moreover water usage is effectively
reduced by installing tap restrictors and dual flush [7].
16
Department of Mechanical & Aerospace Engineering
Manor House Hotel:
Hotel is equipped with LED and solar panels. Solar panel is used to heat the water and
supplied to sanitary service. The hotels have installed toilets that use less water. Manor House
also instituted a policy of using its washer only when it has a full load ready to be cleaned. It
uses low-energy light bulbs, and it heats its water with solar panels [8].
Swinton Park:
The hotel provides heat and hot water is supplied by a wood-chip boiler. Clear sky hotels
says the system "uses a renewable energy source which has had the effect of making the
hotel's heating and water requirements carbon neutral." Swinton Park also put in a laundry
system that uses 30 percent less energy than traditional machines [9].
Apex hotels
The hotel have installed the following technologies to save energy, water and waste.
Dual flush toilets to save water.
Energy efficient windows to improve thermal performance resulting in less of a
requirement for heating in winter and air conditioning in summer.
Dedicated recycling unit.
Separate walk in showers to encourage guests to use the shower instead of the bath
resulting in water saving.
Re-use of furniture and fittings after our refurbishments by donating to local charities
and businesses.
Installation of low energy light bulbs.
Favour supplies derived from recycled materials or renewable resources
The new apex hotel at Dundee has the following features
Key card systems control lighting, heating and air coolers when room not in use.
Building management systems are in place to control temperatures throughout the
building.
Existing lifts have been replaced with energy efficient lifts.
Energy saving lighting, dimmers and motion detectors are in place [10].
17
Department of Mechanical & Aerospace Engineering
2.2 GERMANY
The Maritime Hotels:
In this hove natural gas or district heating is used for heating purpose. Water is heated by
solar thermal collector equipped on the roofs. Water saving devices are installed on taps and
showers to save water. Hotel is equipped with LED for lighting and they says: compared to
conventional light sources it saves around 80% of power. Electronic control air circulators are
used to power the air conditioning systems [11].
Adlon Kempinski:
Hotel has reduces 80% of its power consumption by replacing the halogen lighting with LED
in 382 hotel guest rooms. Seven thousand GE LED lamps have been installed at the hotel in
Berlin. This saves around 140,000 kWh per year [12].
2.3 INDIA
The Orchid:
The architecture of the hotel is designed in a manner to save the energy by passive methods.
The passive methods adopted in the hotel are: the facade, plan configuration, natural lighting
in the atrium and roof top. In facade, desolation and projection play a major role in reducing
the surface radiation. The plan configuration is made in such a way that all the rooms are face
towards the atrium, so it reduces the direct sunlight radiation. Triple glazing windows and
aqua zone drinking water system is employed in the building. Key card system and energy
efficient PL lamps are used to curb the energy consumption [13].
Hotel Rodas:
The rodas hotel uses a new approach to reduce the power consumption, which was a chilling
tank. This tank is attached to the air conditioning unit. During off-peak hours it stores the
cold energy and supply during peak hours. By this approach it reduces the work of condenser
unit [14].
IN Accor:
To reduce the electricity consumption and to improve the heating and cooling efficiency the
hotel have installed an efficient chiller for air conditioning system, insulated duct for heat
recovery system. Besides LED lamp and CFL lamp are installed as well as an electronic
18
Department of Mechanical & Aerospace Engineering
ballast are installed for fluorescent tube light. Key card system is installed to access the room
as well as to turn on the supply for the rooms. In order to control and reduce the water usage
at sanitary services sensors are installed on all taps [15].
Hotel Oberai:
The hotel adopted various techniques to save energy and water resource as well as reuse of
waste from the hotel effectively
Energy
The hotel installed a building management system which establish the efficient operation and
control according to load demands and occupancy.
The hotel pools are heated by solar panels installed on building roof tops.
Waste heat from the chillers are recovered to heat all domestic hot water.
A backup diesel generator is turned on approximately one hour per day during the hot
summer months when the power supply fails from the distribution company. The
diesel generator located in a room reduces noise pollution.
Water
Rain water harvesting is installed on roof top
Ground water is used for the whole hotel water supply
Reverse osmosis is engaged to supply purified water for all domestic use
Waste
Solid waste from the hotel is dried and used as a fertilizers in the garden
Waste oil from the kitchen is disposed to soap manufacturing industry [16]
2.5 DUBAI
Radisson blue:
The hotel have use of biodegradable chemicals and recycling initiatives. Furthermore the
hotel uses efficient air conditioning system, thermal wheel to maintain indoor air comfort
[17].
19
Department of Mechanical & Aerospace Engineering
Fairmont Dubai:
The hotel took very effective steps to cut the carbon emission some of them are: temperature
control and building humidity settings are optimized resulting in a 17.1% reduction in
greenhouse gases over the last four years. Two oil boilers are replaced with electric boilers,
which cut more than 75% of carbon emission. It employed a use of thermostat in rooms to
control HVAC scheduling [18].
The Kempinski Hotel Mall:
The hotel uses Eco-Smart to reduce overall electricity and chilled water consumption. To
ensure the continued comfort of guests, Eco-Smart will integrate fully with the hotel's work
order management system, streamlining response times to any reported issues in guestrooms
[19].
2.6 AUSTRALIA
Alto hotel
The hotel initiated various power, water and waste conservation technologies. Some of them
in each areas are:
Energy
High star rating HVAC inverters, with sensor controls
Hot water reticulation system
Fluoro or LED lamps
Double glazing windows are used to reduce the noise from outside as well as to maintain the
indoor temperature. Stud wall construction is used for interior walls to reduce noise and heat.
Water
Water recirculation system is installed in the hotel to water wastage.
The hotel basement has rain water storage tanks and water from basement is used for
sanitary service.
20
Department of Mechanical & Aerospace Engineering
Waste
In the rooms, recyclable and non-recyclable bins are placed to collect the waste. All waste
from the kitchen is dumped into a compost bin. The fluorescent lamps are recycled for their
mercury content and glass. The waste oil is collected and converted to bio diesel [20].
Crown plaza
The hotel have installed the following technologies to reduce the power consumption:
Energy efficient light bulbs (LED bulbs)
Since the demand of the hotel is variable, for the effective control of pumps and
motors variable speed drives are used. This saves 30% of its energy use.
Centralised temperature control depends on occupancy is achieved through building
management system.
A sensor is installed at each guest rooms to manage the light and temperature.
Energy efficient air dryers are used.
Special shower jet heads and flow restrictors are used to reduce the water wastage.
Conventional flush toilets are replaced with dual flush toilets
Traditional urinals are replaced with water less urinals [21]
Green hotelier:
Water efficient low- flow shower heads and aerator taps are used to save 30% to 40% of
water usage. Grey water recycling plant is installed in the hotel to collect and supply the
water from different zones like kitchen, sanitary service, guestrooms etc. [22].
2.7 USA
The Hyatt at Olive 8’s:
The hotel have installed green roof to reduce the storm water runoff by 75%. It also reduces
the power required to heat and cool of the hotel [23].
The Proximity Hotel:
The hotel is located at Greensboro which has limited water resource hence it have installed
high efficiency plumbing device, which saves 33% of water in the first year. Hundred solar
21
Department of Mechanical & Aerospace Engineering
panels have installed on the roof top and used to supply hot water to entire hotel. It
diminishes 50% of hot water heating use [23].
Hotel Indigo:
The hotel have procured HVAC system and variable refrigerant volume heat pump to
maximize the building energy performance. These systems are 30% more efficient than the
air conditioning system used in guest rooms. This system also helps in improving the indoor
air quality as well as comfort of the occupant [23].
Bardessono Yountville:
A hotel space heating and domestic water heating is supplied by ground source heat pump
system. The system installed also recovers the air conditioning waste heat for domestic water
heating during the summer. Solar panels are installed on roof tops and generate power. This
power is utilized for hotel lighting and small power equipment. These system almost saves
40% of power utilization and saves $90,000 in a year [23].
The literature review having laid foundation to existing technologies paved way to discuss
furthermore on other strategies such as ventilation systems. The report will now set focus on
the importance of improving the indoor air quality system such as through the incorporation
of ventilation systems and then the report describes the methodology used for the installation
of a ventilation system in a hotel.
22
Department of Mechanical & Aerospace Engineering
3 INDOOR AIR QUALITY
Indoor air quality indicates the quality of air in the living area of the houses, commercial
buildings, hospitals, etc. Characteristic of air in the building play an important role in the
physical health of the residents, some properties of air are: gas type, temperature and
humidity of air, volume, pressure and speed. The quality of air can be determined by
observing the health of an occupier and the comfort in the living place. In this technological
world, living standard of people has improved and started to spend 90% of their time in
indoors, where they are frequently brought in to indoor air pollutants [24]. Over the past
several decades our exposure to indoor air pollutants is believed to have increased due to
variety of factors such as air tight building, shortage of sufficient ventilation, domestic
impurities like interior furnishing, smoking tobaccos, burning fuels, pets, etc. In recent years
comparative risk studies performed by EPA and Science Advisory Board (SAB) have
consistently ranked indoor air pollution among the top five environmental risks to public
health. As a result of these studies people began to realize that the indoor air quality is
important to comfort and health [5].
3.1 AIR QUALITY ISSUES AFFECTING THE BUILDING & HUMAN HEALH
Sick building syndrome
Moulds and moisture
Dust mites
Tobacco smoke
Carbon monoxide
Nitrogen dioxide
Volatile organic compounds
3.1.1 Sick Building Syndrome (SBS)
Sick building syndrome represents the intense health comfort issues which is tied up to the
time settled in the building. This problem could occur throughout the building or may be in
specific zone/room. A report suggested that there is 30% of new and remodelled building
worldwide may be subjected of complaints related to poor indoor air quality (1988, World
Health Organisation) [25]. The sick buildings are generally energy efficient and characterized
by airtight envelopes.
23
Department of Mechanical & Aerospace Engineering
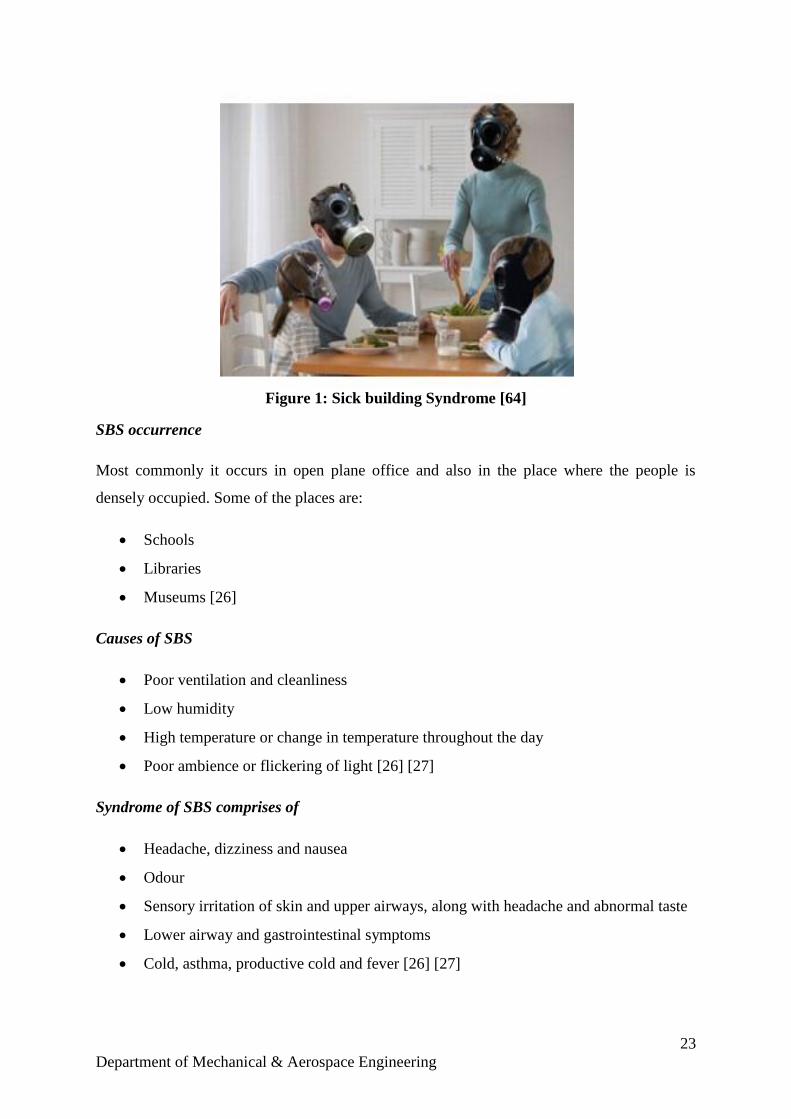
Figure 1: Sick building Syndrome [64]
SBS occurrence
Most commonly it occurs in open plane office and also in the place where the people is
densely occupied. Some of the places are:
Schools
Libraries
Museums [26]
Causes of SBS
Poor ventilation and cleanliness
Low humidity
High temperature or change in temperature throughout the day
Poor ambience or flickering of light [26] [27]
Syndrome of SBS comprises of
Headache, dizziness and nausea
Odour
Sensory irritation of skin and upper airways, along with headache and abnormal taste
Lower airway and gastrointestinal symptoms
Cold, asthma, productive cold and fever [26] [27]
24
Department of Mechanical & Aerospace Engineering
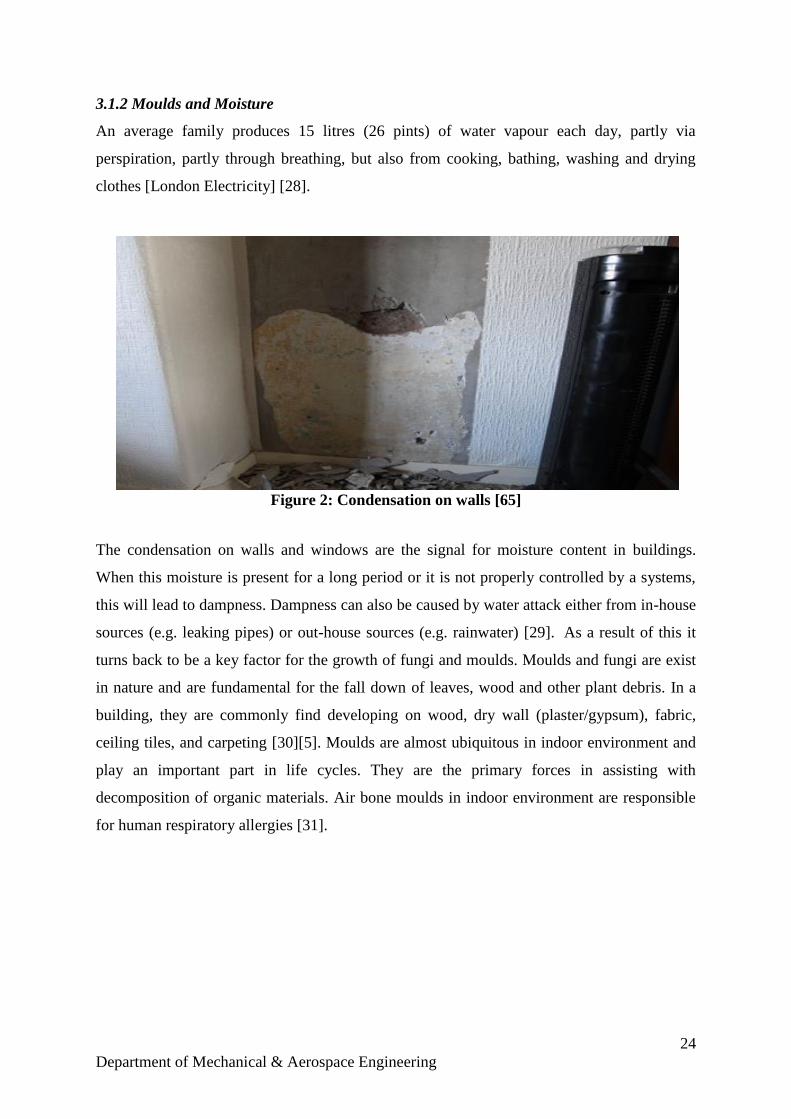
3.1.2 Moulds and Moisture
An average family produces 15 litres (26 pints) of water vapour each day, partly via
perspiration, partly through breathing, but also from cooking, bathing, washing and drying
clothes [London Electricity] [28].
Figure 2: Condensation on walls [65]
The condensation on walls and windows are the signal for moisture content in buildings.
When this moisture is present for a long period or it is not properly controlled by a systems,
this will lead to dampness. Dampness can also be caused by water attack either from in-house
sources (e.g. leaking pipes) or out-house sources (e.g. rainwater) [29]. As a result of this it
turns back to be a key factor for the growth of fungi and moulds. Moulds and fungi are exist
in nature and are fundamental for the fall down of leaves, wood and other plant debris. In a
building, they are commonly find developing on wood, dry wall (plaster/gypsum), fabric,
ceiling tiles, and carpeting [30][5]. Moulds are almost ubiquitous in indoor environment and
play an important part in life cycles. They are the primary forces in assisting with
decomposition of organic materials. Air bone moulds in indoor environment are responsible
for human respiratory allergies [31].
25
Department of Mechanical & Aerospace Engineering
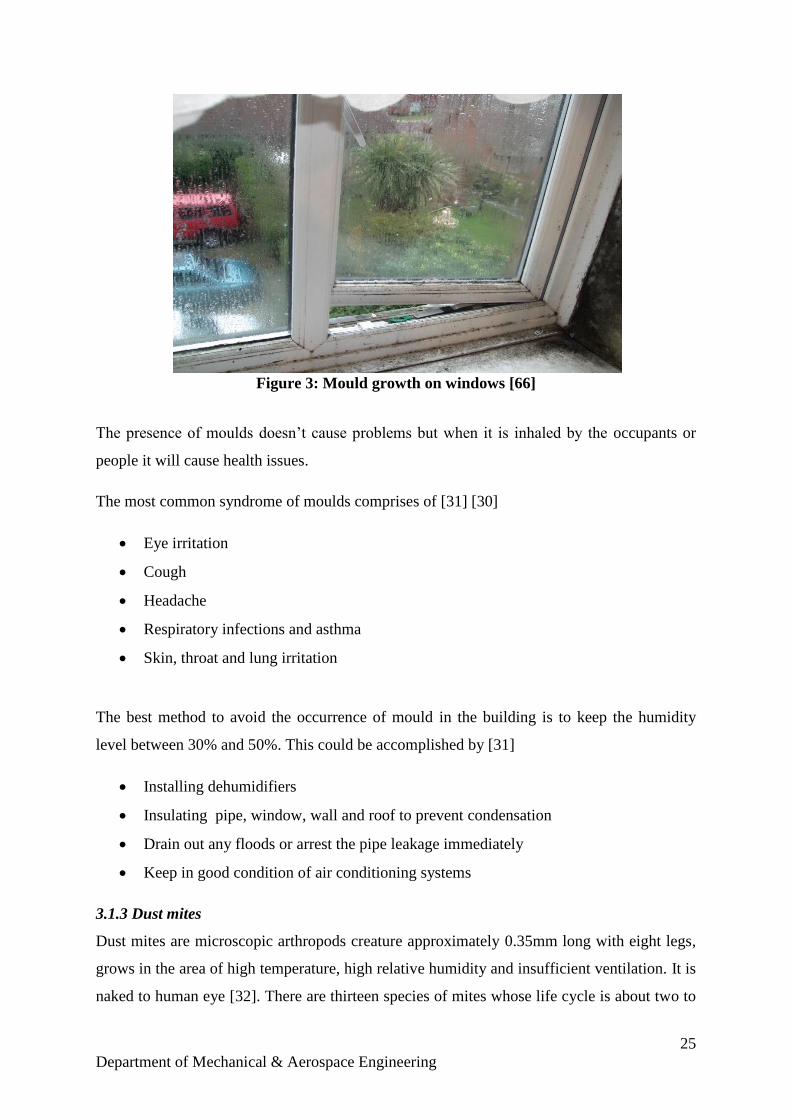
Figure 3: Mould growth on windows [66]
The presence of moulds doesn’t cause problems but when it is inhaled by the occupants or
people it will cause health issues.
The most common syndrome of moulds comprises of [31] [30]
Eye irritation
Cough
Headache
Respiratory infections and asthma
Skin, throat and lung irritation
The best method to avoid the occurrence of mould in the building is to keep the humidity
level between 30% and 50%. This could be accomplished by [31]
Installing dehumidifiers
Insulating pipe, window, wall and roof to prevent condensation
Drain out any floods or arrest the pipe leakage immediately
Keep in good condition of air conditioning systems
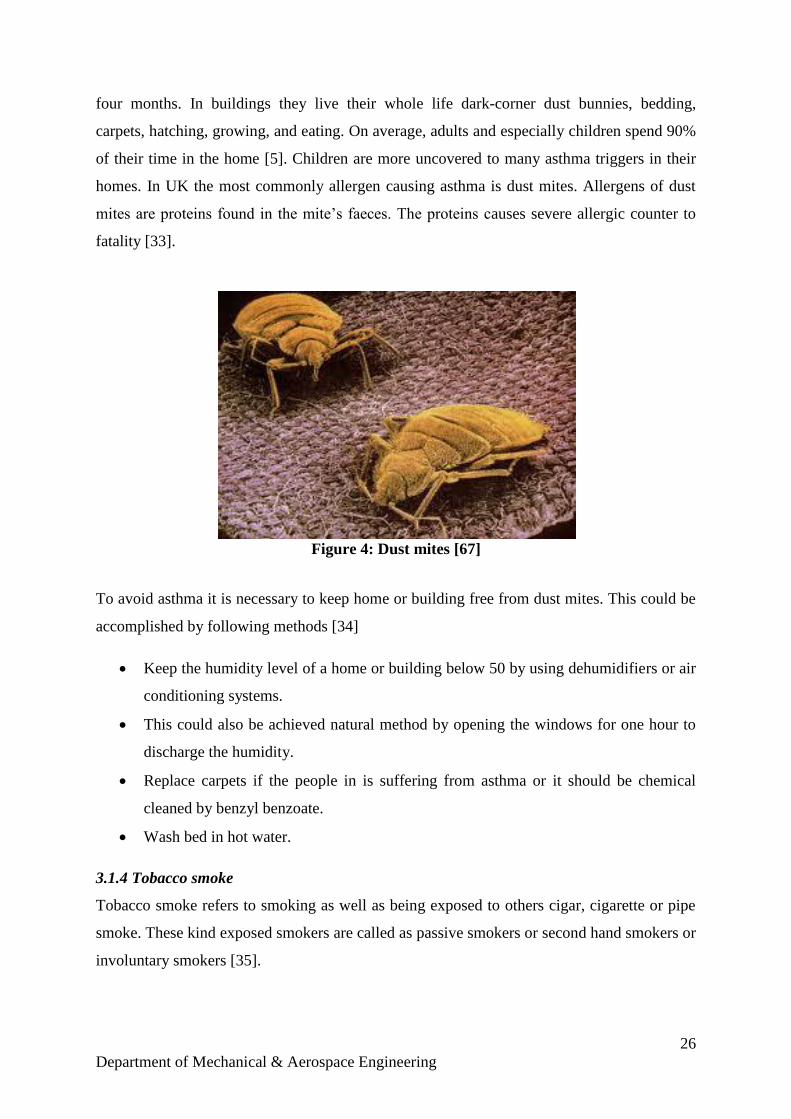
3.1.3 Dust mites
Dust mites are microscopic arthropods creature approximately 0.35mm long with eight legs,
grows in the area of high temperature, high relative humidity and insufficient ventilation. It is
naked to human eye [32]. There are thirteen species of mites whose life cycle is about two to
26
Department of Mechanical & Aerospace Engineering
four months. In buildings they live their whole life dark-corner dust bunnies, bedding,
carpets, hatching, growing, and eating. On average, adults and especially children spend 90%
of their time in the home [5]. Children are more uncovered to many asthma triggers in their
homes. In UK the most commonly allergen causing asthma is dust mites. Allergens of dust
mites are proteins found in the mite’s faeces. The proteins causes severe allergic counter to
fatality [33].
Figure 4: Dust mites [67]
To avoid asthma it is necessary to keep home or building free from dust mites. This could be
accomplished by following methods [34]
Keep the humidity level of a home or building below 50 by using dehumidifiers or air
conditioning systems.
This could also be achieved natural method by opening the windows for one hour to
discharge the humidity.
Replace carpets if the people in is suffering from asthma or it should be chemical
cleaned by benzyl benzoate.
Wash bed in hot water.
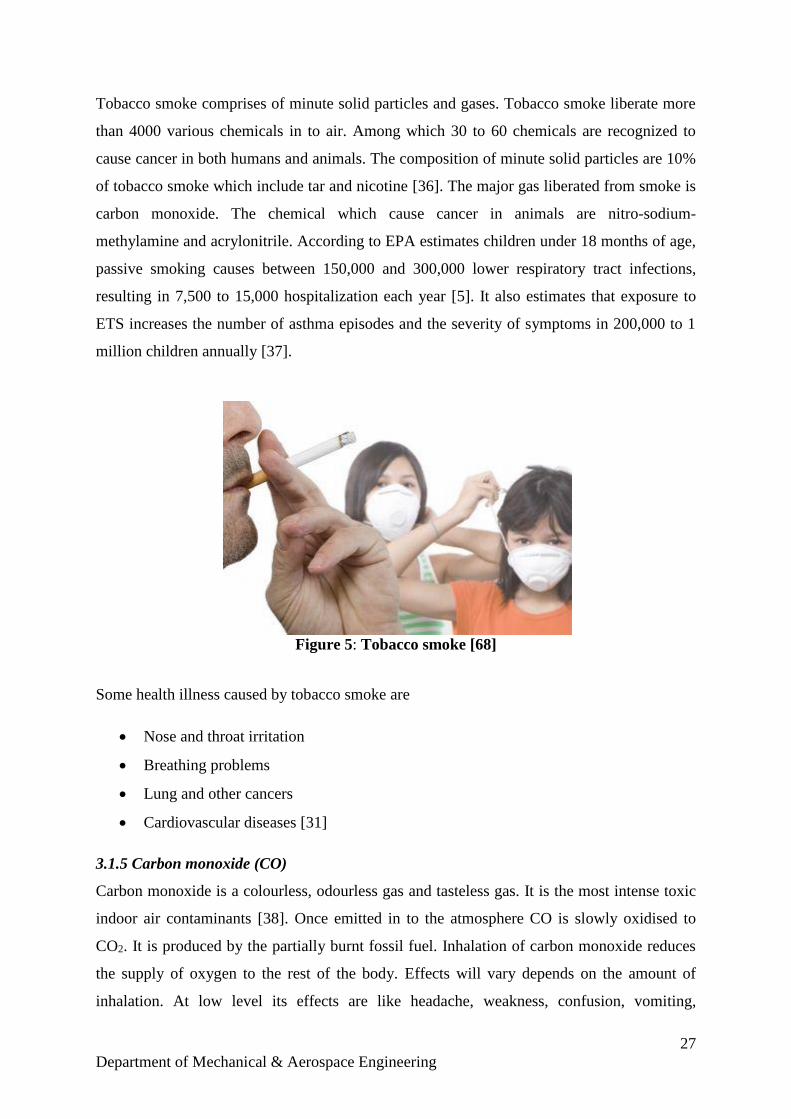
3.1.4 Tobacco smoke
Tobacco smoke refers to smoking as well as being exposed to others cigar, cigarette or pipe
smoke. These kind exposed smokers are called as passive smokers or second hand smokers or
involuntary smokers [35].
27
Department of Mechanical & Aerospace Engineering
Tobacco smoke comprises of minute solid particles and gases. Tobacco smoke liberate more
than 4000 various chemicals in to air. Among which 30 to 60 chemicals are recognized to
cause cancer in both humans and animals. The composition of minute solid particles are 10%
of tobacco smoke which include tar and nicotine [36]. The major gas liberated from smoke is
carbon monoxide. The chemical which cause cancer in animals are nitro-sodium-
methylamine and acrylonitrile. According to EPA estimates children under 18 months of age,
passive smoking causes between 150,000 and 300,000 lower respiratory tract infections,
resulting in 7,500 to 15,000 hospitalization each year [5]. It also estimates that exposure to
ETS increases the number of asthma episodes and the severity of symptoms in 200,000 to 1
million children annually [37].
Figure 5: Tobacco smoke [68]
Some health illness caused by tobacco smoke are
Nose and throat irritation
Breathing problems
Lung and other cancers
Cardiovascular diseases [31]
3.1.5 Carbon monoxide (CO)
Carbon monoxide is a colourless, odourless gas and tasteless gas. It is the most intense toxic
indoor air contaminants [38]. Once emitted in to the atmosphere CO is slowly oxidised to
CO2. It is produced by the partially burnt fossil fuel. Inhalation of carbon monoxide reduces
the supply of oxygen to the rest of the body. Effects will vary depends on the amount of
inhalation. At low level its effects are like headache, weakness, confusion, vomiting,
28
Department of Mechanical & Aerospace Engineering
faintness and fatigue [39]. This symptom is sometime confused with flu or food poisoning. At
moderate level its effects are like decrease in brain function and damage the vision. A high
level of carbon monoxide inhalation leads to death [5].
Figure 6: Sources of CO [69]
Sources of carbon monoxide are:
Badly installed or poor ventilated cooking or heating appliances which use fossil
fuels, including gas, coal, wood or paraffin.
Cigarette smoke.
Parking vehicle in an attached garage of the home may cause carbon monoxide to get
inside. [31]
3.1.6 Nitrogen dioxide (NO2)
Nitrogen dioxide is a harmful gas which is highly reactive to oxygen and corrosive. The
oxides of nitrogen comprise several gases, including nitric oxide (NO) and nitrogen dioxide
(NO2). In atmospheric air NO2 is probably the most important for human health [40]. The
main sources at indoors are: absence ventilation for combustion devices for example: burning
oil and wood inside, unvented gas stove, tobacco smoke and heaters. Health effects
associated with nitrogen dioxide are: eye, nose and throat irritation. Extreme exposure to NO2
may cause pulmonary edema and diffuse lung injury [31].
29
Department of Mechanical & Aerospace Engineering
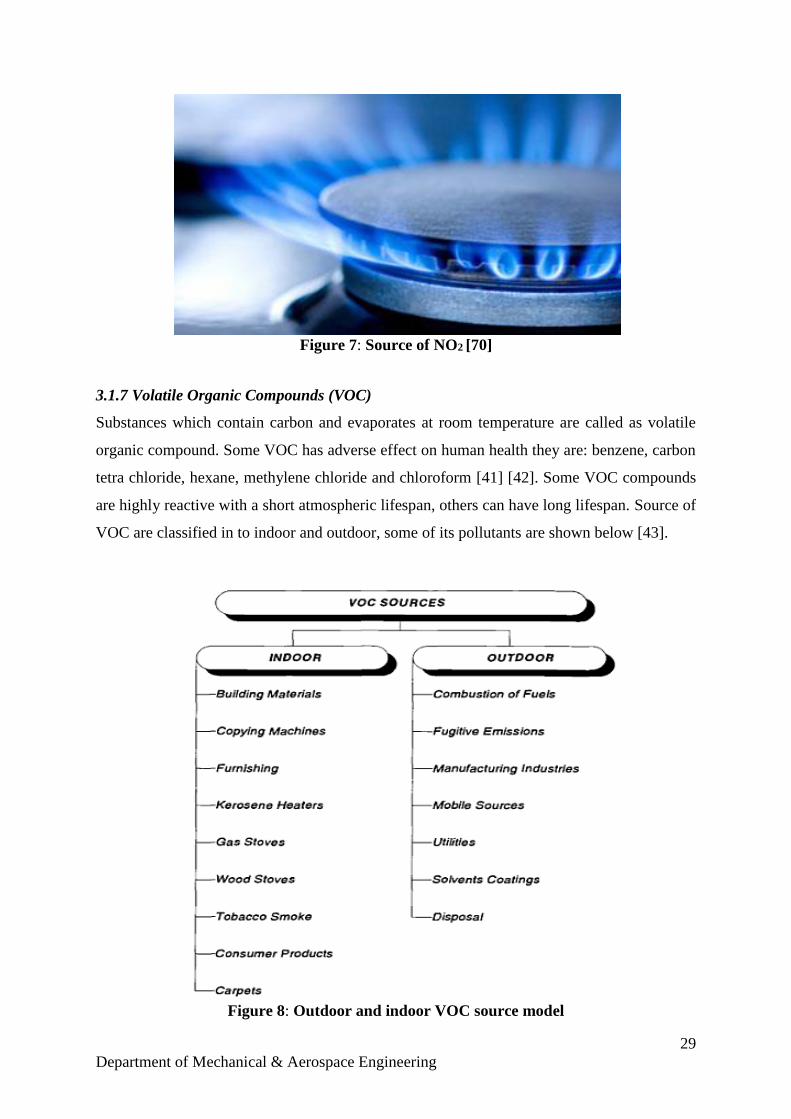
Figure 7: Source of NO2 [70]
3.1.7 Volatile Organic Compounds (VOC)
Substances which contain carbon and evaporates at room temperature are called as volatile
organic compound. Some VOC has adverse effect on human health they are: benzene, carbon
tetra chloride, hexane, methylene chloride and chloroform [41] [42]. Some VOC compounds
are highly reactive with a short atmospheric lifespan, others can have long lifespan. Source of
VOC are classified in to indoor and outdoor, some of its pollutants are shown below [43].
Figure 8: Outdoor and indoor VOC source model
30
Department of Mechanical & Aerospace Engineering
Indoor movements which release VOC are glues, cosmetics, paints, varnishes, cooking as
well as tobacco smoke [43].
Figure 9: Indoor VOC sources (source: http://www.airpurifierguide.org )
Some of short-term and long-term intense to high stage of VOCs are
Short-term effects are:
Eye, nose and throat irritation
Headaches
Nausea or vomiting
Dizziness
Worsening of asthma symptoms [31]
Long-term effects are
Increased risk of
Cancer
Liver damage
Kidney damage
Central nervous system damage [31]
31
Department of Mechanical & Aerospace Engineering
4 NEED FOR VENTILATION SYSTEM
In modern technology era use of electric power supply, number of vehicles, different
amenities has increased due to population increase, improved in living standard of people,
etc. This increases cause decrease in: air quality, water availability, increase in Green House
Gas (GHG) emission, water pollution, etc. Especially increase in greenhouse gas emission
cause a drastic change in climate around the world.
As discussed earlier in the chapter3, in most of the cases the main problem is no proper
ventilation in buildings. To overcome the above negative impacts on the environment, it is
necessary to have a ventilation system in every home or building to have a healthy life.
4.1 VENTILATION STRATEGIES
While considering the ventilation there are different strategies in it. Some of them are:
Natural ventilation
Passive stack ventilation
Mechanical extract ventilation
Mechanical ventilation with heat recovery
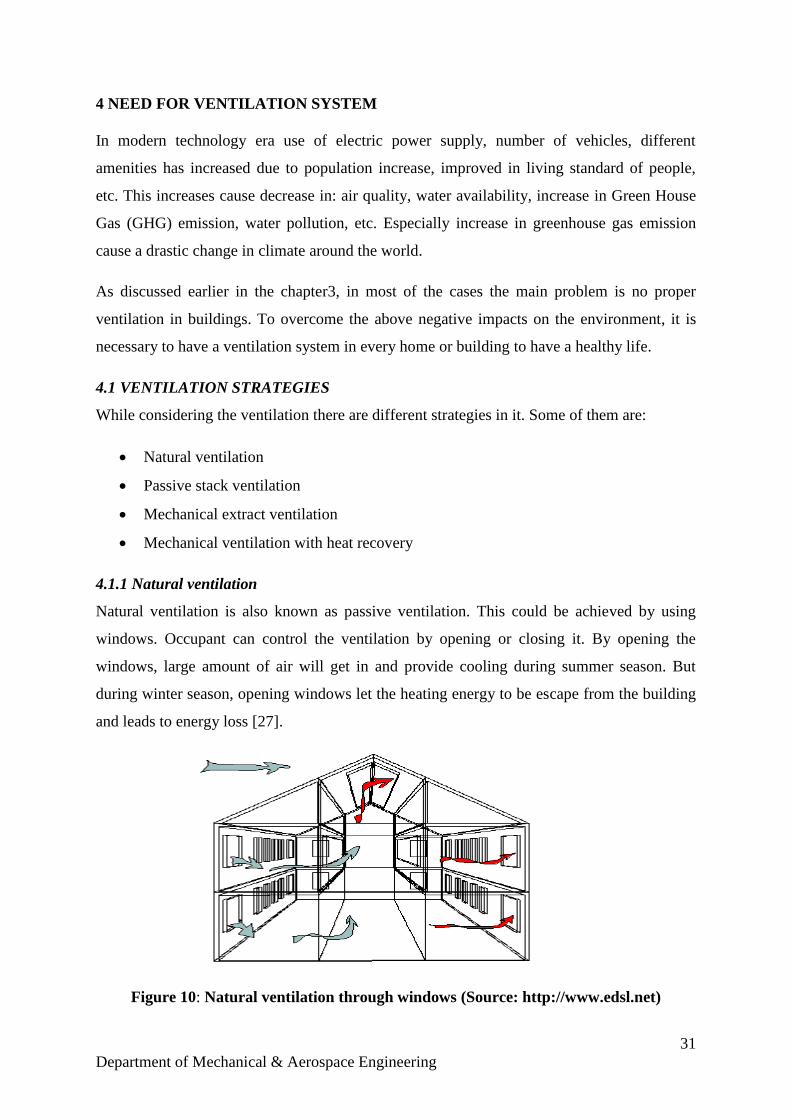
4.1.1 Natural ventilation
Natural ventilation is also known as passive ventilation. This could be achieved by using
windows. Occupant can control the ventilation by opening or closing it. By opening the
windows, large amount of air will get in and provide cooling during summer season. But
during winter season, opening windows let the heating energy to be escape from the building
and leads to energy loss [27].
Figure 10: Natural ventilation through windows (Source: http://www.edsl.net)
32
Department of Mechanical & Aerospace Engineering
Advantages
Installation cost is less
Provide some ventilation[27]
Disadvantages
Ventilation rate cannot be controlled
Heat loss occurs by opening the windows
Uneven distribution of air takes place
It cause noise pollution
Provide a path to outdoor pollutant to get enter in to the building [27]
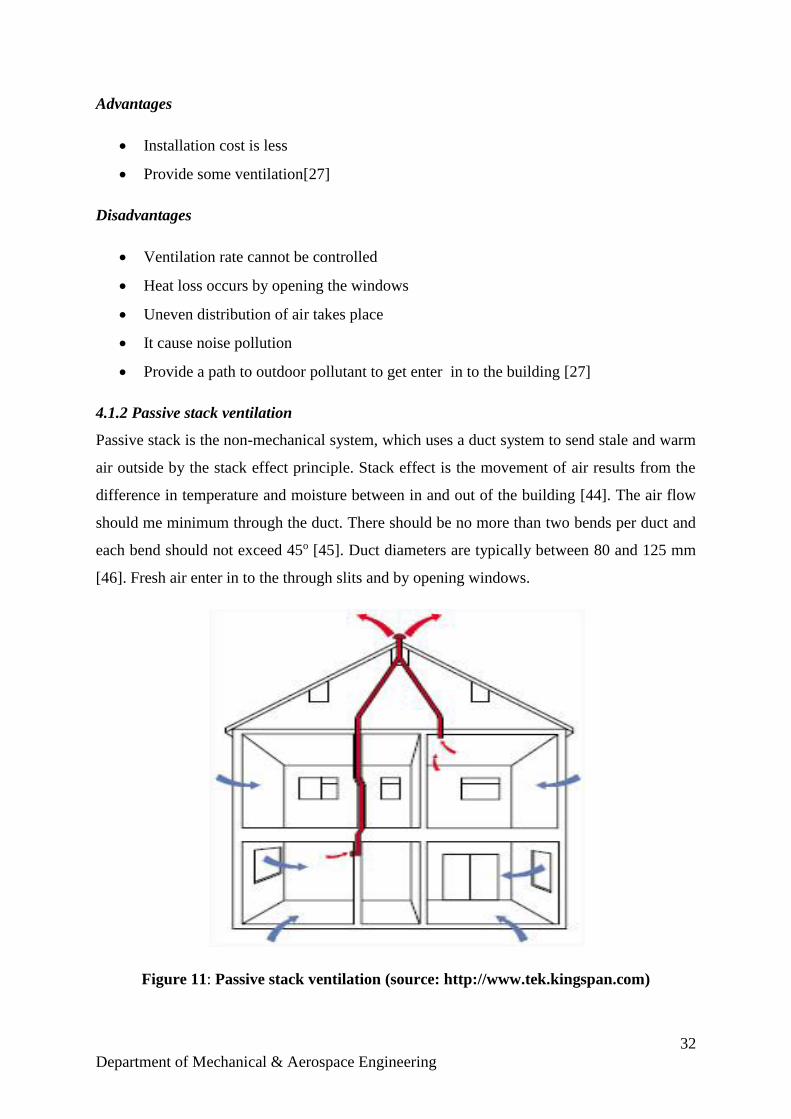
4.1.2 Passive stack ventilation
Passive stack is the non-mechanical system, which uses a duct system to send stale and warm
air outside by the stack effect principle. Stack effect is the movement of air results from the
difference in temperature and moisture between in and out of the building [44]. The air flow
should me minimum through the duct. There should be no more than two bends per duct and
each bend should not exceed 45o [45]. Duct diameters are typically between 80 and 125 mm
[46]. Fresh air enter in to the through slits and by opening windows.
Figure 11: Passive stack ventilation (source: http://www.tek.kingspan.com)
33
Department of Mechanical & Aerospace Engineering
Advantages
Less installation and running cost
Continuous passive ventilation [47] [27]
Disadvantages
Proper space is required for duct installation
Heat loss will occur through the vent provided
Incoming cold air should be heated
Back-draught may occur [47] [27]
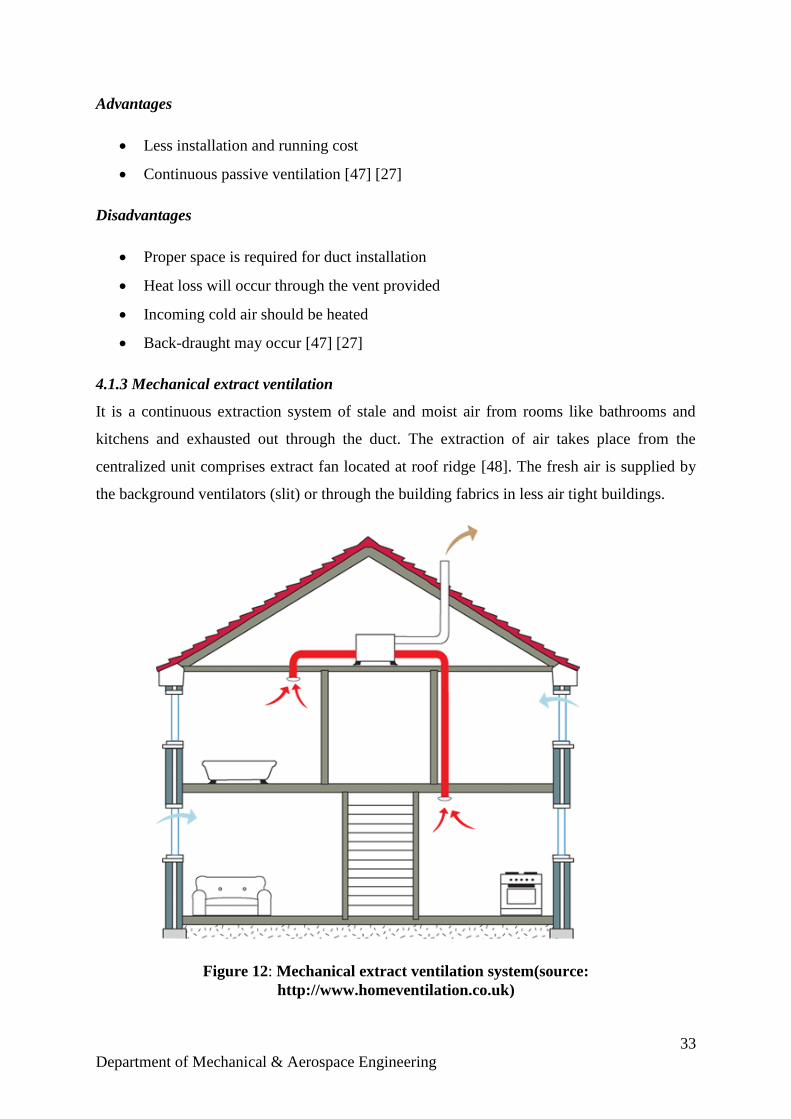
4.1.3 Mechanical extract ventilation
It is a continuous extraction system of stale and moist air from rooms like bathrooms and
kitchens and exhausted out through the duct. The extraction of air takes place from the
centralized unit comprises extract fan located at roof ridge [48]. The fresh air is supplied by
the background ventilators (slit) or through the building fabrics in less air tight buildings.
Figure 12: Mechanical extract ventilation system(source:
http://www.homeventilation.co.uk)
34
Department of Mechanical & Aerospace Engineering
Advantages
Condensation preventer
Less cost and easy to install
Moist and stale air exhaust directly [49]
Disadvantages
Regular maintenance is required
Heat loss occurs through vented warm air
Fan noise might be an issue
Poor distribution of fresh air [49]
Among the above ventilation strategies, MVHR system finds to be a best solution. The reason
behind is discussed in next chapter.
35
Department of Mechanical & Aerospace Engineering
5 MECHANICAL VENTILATION HEAT RECOVERY SYSTEM (MVHR)
Mechanical Ventilation Heat Recovery (MVHR) is simple and packed air management unit
which provides good ventilation with the efficient removal of pollutants in the buildings as
well as greater efficiency in heat recovery from the exhaust air.
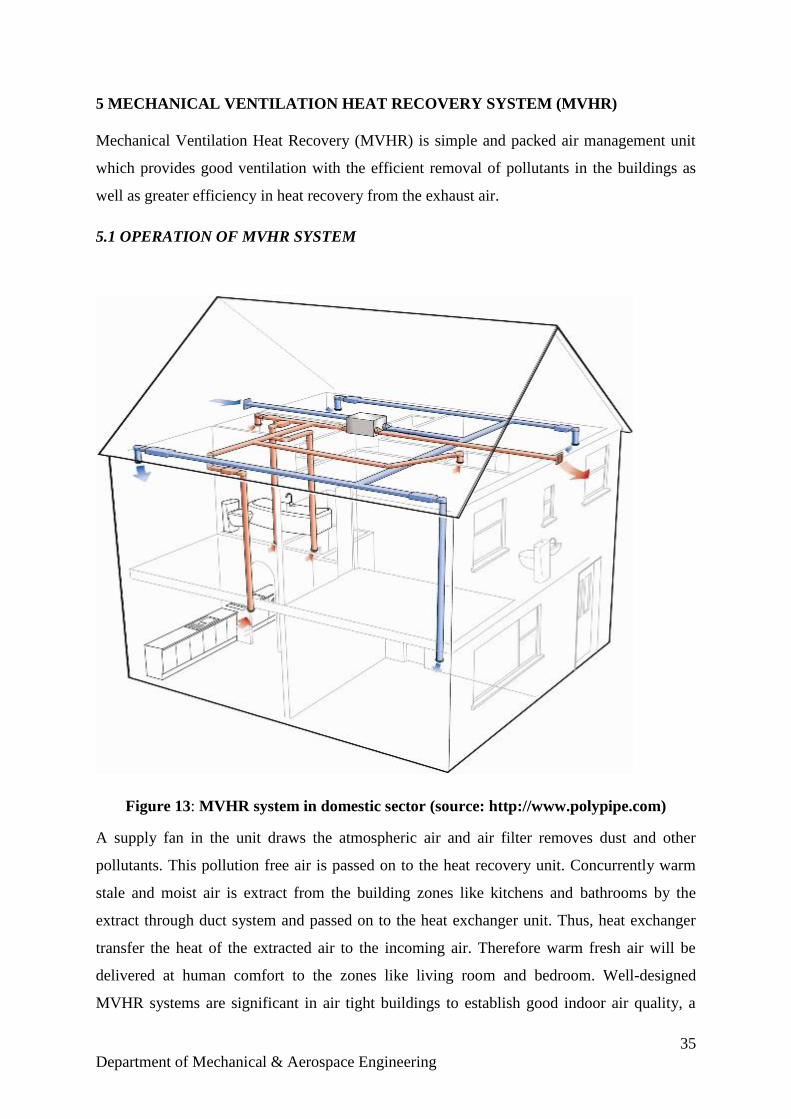
5.1 OPERATION OF MVHR SYSTEM
Figure 13: MVHR system in domestic sector (source: http://www.polypipe.com)
A supply fan in the unit draws the atmospheric air and air filter removes dust and other
pollutants. This pollution free air is passed on to the heat recovery unit. Concurrently warm
stale and moist air is extract from the building zones like kitchens and bathrooms by the
extract through duct system and passed on to the heat exchanger unit. Thus, heat exchanger
transfer the heat of the extracted air to the incoming air. Therefore warm fresh air will be
delivered at human comfort to the zones like living room and bedroom. Well-designed
MVHR systems are significant in air tight buildings to establish good indoor air quality, a
36
Department of Mechanical & Aerospace Engineering
comfortable draft free environment and lower energy demands. The system should be
balanced by maintaining an equal supply and exhaust flow rates, so that it prevents any
pressure difference that occurs between inside and outside of the building [50] [51].
5.2 ADVANTAGES OF MVHR SYSTEM
Some important advantage of using MVHR system comprises control of
Relative humidity
Thermal comfort
Air quality and
Energy saving [52]
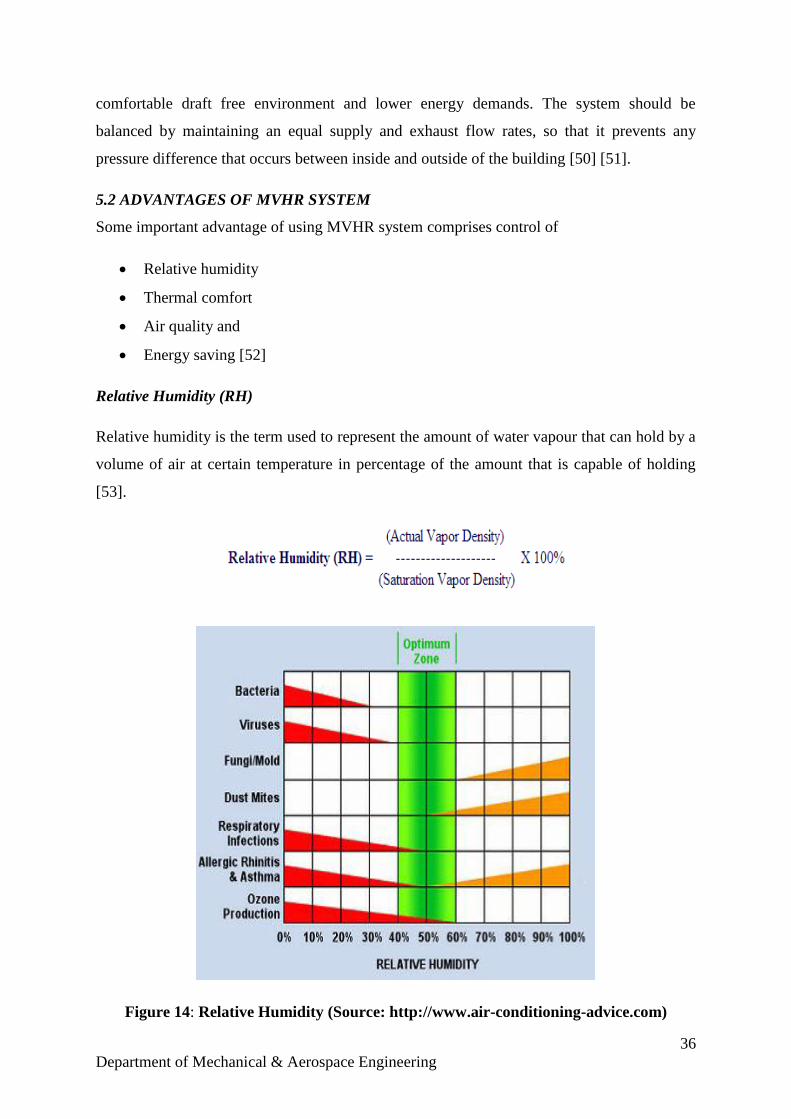
Relative Humidity (RH)
Relative humidity is the term used to represent the amount of water vapour that can hold by a
volume of air at certain temperature in percentage of the amount that is capable of holding
[53].
Figure 14: Relative Humidity (Source: http://www.air-conditioning-advice.com)
37
Department of Mechanical & Aerospace Engineering
Hence the amount of moisture which can occur for a given volume of air depends only on
temperature and is expressed in Kg per Kg of dry air. Discomfort or problem will occur only
when the relative humidity is very high or very low. In general most people will feel comfort
with the RH in the range of 40% to 60%, couple with temperature in the region of 18C to
22C. Low level of relative humidity will result in sore throats and dry eyes. Condensation
occurs only when the air volume has high RH and approaching its saturation point as well as
when the air temperature get lowered and tends to reach its dew point results it suddenly start
condensing cold surfaces like walls and windows. As discussed in section 3.1.3 of chapter 3
high RH cause dust mites, therefore to avoid this at least exhaust ventilation system has to be
installed at bathroom and kitchen or MVHR has to be installed in the building to provide
proper ventilation and live a healthy life [53] [54].
Thermal comfort
Ventilation play a major role in providing comfort to the occupant in the building. The
thermal comfort a person experiences is defined as 'that condition of mind that expresses
satisfaction with the thermal environment' [British Standard BS EN ISO 7730] [55]. It
determines the psychological state of the occupant whether they feel hot or cold. When the
rate of heat loss from the body is low occupant feel hot and when the heat loss is high they
feel cold [56]. Thermal comfort varies from person to person based on their clothing,
metabolic rate and air velocity in the zone. The metabolic rate varies from the activity
carrying out, for example: cooking, swimming, jogging, etc. each clothing has its thermal
value, based on climate the clothing will change. It cannot be measured in degrees but one
possible way is to give their status like unpleasant, shivering, pleasant, acceptable and hot.
Heat losses from the body is transferred to the indoor environment by three principles 1)
convection 2) radiation and 3) evaporation. In convection heat loss takes place from outer
surface of clothed body to air. Whereas in radiation heat loss takes place from outer surface
of clothed body to its environment and in evaporation heat loss takes place from the skin
[57].
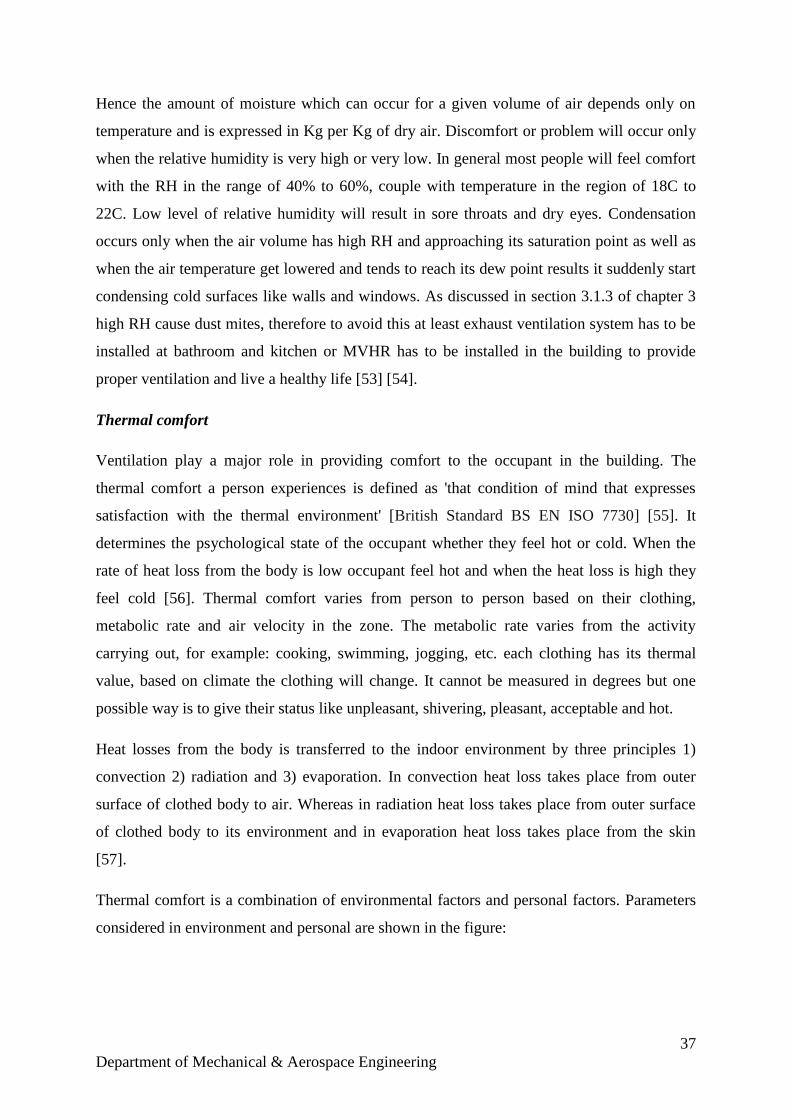
Thermal comfort is a combination of environmental factors and personal factors. Parameters
considered in environment and personal are shown in the figure:
38
Department of Mechanical & Aerospace Engineering
Figure 15: Environmental and Personal factors affecting thermal comfort [57]
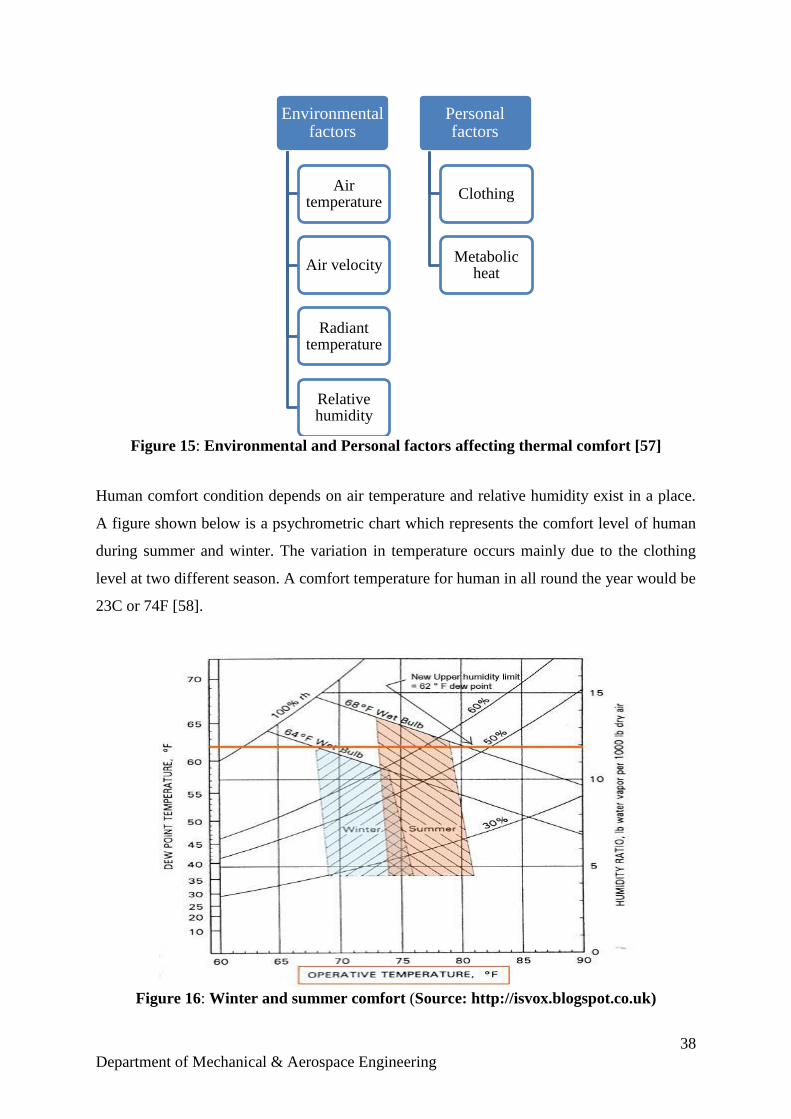
Human comfort condition depends on air temperature and relative humidity exist in a place.
A figure shown below is a psychrometric chart which represents the comfort level of human
during summer and winter. The variation in temperature occurs mainly due to the clothing
level at two different season. A comfort temperature for human in all round the year would be
23C or 74F [58].
Figure 16: Winter and summer comfort (Source: http://isvox.blogspot.co.uk)
Environmental factors
Air temperature
Air velocity
Radiant temperature
Relative humidity
Personal factors
Clothing
Metabolic heat
39
Department of Mechanical & Aerospace Engineering
To maintain the thermal comfort in a building all-round the year needs necessary cooling and
heating at desirable seasons. Therefore use of MVHR system with heating and cooling over
summer and winter helps to accomplish the thermal comfort.
Air quality [50]
Exhaust and supply do not get mix in heat exchange, so it ensures continuous supply
of fresh air.
No radical CO2 spikes
Charcoal and pollen filters are used to provide pollution free supply air as well as to
avoid diesel fumes and rural odour.
Energy saving [50]
Heat recovery unit in MVHR transfer the heat from stale and moist air in the rooms to the
supply air. Hence thirty percentage of heating bill could be save by installing MVHR system
in the building.
5.3 DISADVANTAGES OF MVHR SYSTEM [51]
Proper filter maintenance or replacement check is required regularly to avoid
blockage as well as stale air.
Depend on electricity for its continuous operation.
5.4 MVHR SYSTEM TYPES
In MVHR heat exchanger system is mainly classified into
Plate heat exchangers
Thermal wheel
Plate heat exchangers
Plate heat exchanger is commonly employed for heat transfer in MVHR system. Plate heat
exchanger consist of number of thin, thermally conductive material like aluminium, resin
coated paper etc. theses plates are arranged in parallel to form a stack and each plates are
separated by certain spacing. Here two air streams pass through the carrier formed between
two plates [59]. While flowing through the channel it never get mix-up. Sensible energy from
40
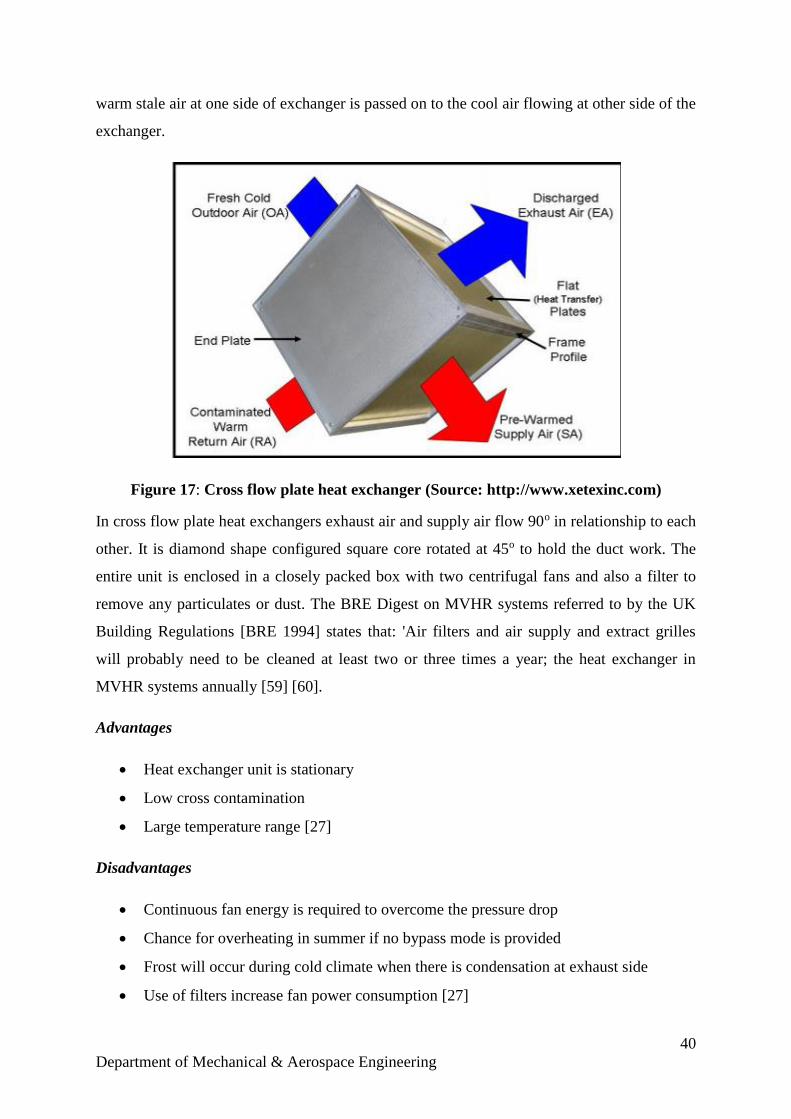
Department of Mechanical & Aerospace Engineering
warm stale air at one side of exchanger is passed on to the cool air flowing at other side of the
exchanger.
Figure 17: Cross flow plate heat exchanger (Source: http://www.xetexinc.com)
In cross flow plate heat exchangers exhaust air and supply air flow 90o in relationship to each
other. It is diamond shape configured square core rotated at 45o to hold the duct work. The
entire unit is enclosed in a closely packed box with two centrifugal fans and also a filter to
remove any particulates or dust. The BRE Digest on MVHR systems referred to by the UK
Building Regulations [BRE 1994] states that: 'Air filters and air supply and extract grilles
will probably need to be cleaned at least two or three times a year; the heat exchanger in
MVHR systems annually [59] [60].
Advantages
Heat exchanger unit is stationary
Low cross contamination
Large temperature range [27]
Disadvantages
Continuous fan energy is required to overcome the pressure drop
Chance for overheating in summer if no bypass mode is provided
Frost will occur during cold climate when there is condensation at exhaust side
Use of filters increase fan power consumption [27]
41
Department of Mechanical & Aerospace Engineering
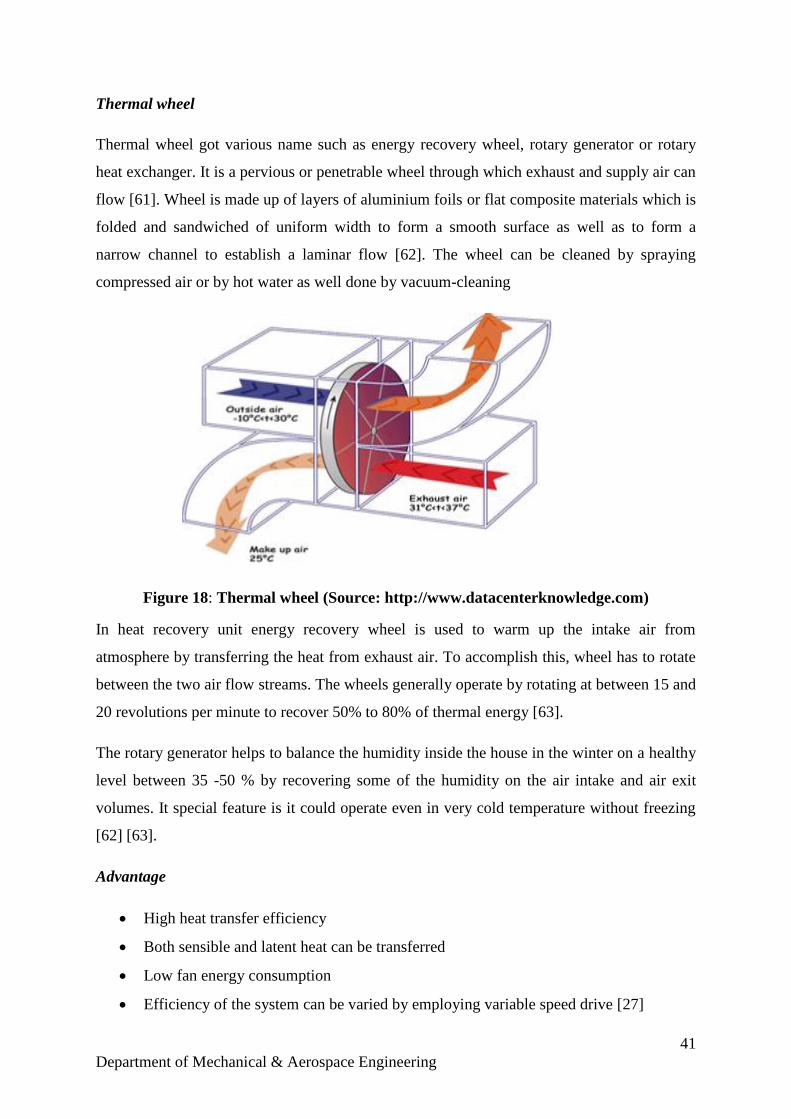
Thermal wheel
Thermal wheel got various name such as energy recovery wheel, rotary generator or rotary
heat exchanger. It is a pervious or penetrable wheel through which exhaust and supply air can
flow [61]. Wheel is made up of layers of aluminium foils or flat composite materials which is
folded and sandwiched of uniform width to form a smooth surface as well as to form a
narrow channel to establish a laminar flow [62]. The wheel can be cleaned by spraying
compressed air or by hot water as well done by vacuum-cleaning
Figure 18: Thermal wheel (Source: http://www.datacenterknowledge.com)
In heat recovery unit energy recovery wheel is used to warm up the intake air from
atmosphere by transferring the heat from exhaust air. To accomplish this, wheel has to rotate
between the two air flow streams. The wheels generally operate by rotating at between 15 and
20 revolutions per minute to recover 50% to 80% of thermal energy [63].
The rotary generator helps to balance the humidity inside the house in the winter on a healthy
level between 35 -50 % by recovering some of the humidity on the air intake and air exit
volumes. It special feature is it could operate even in very cold temperature without freezing
[62] [63].
Advantage
High heat transfer efficiency
Both sensible and latent heat can be transferred
Low fan energy consumption
Efficiency of the system can be varied by employing variable speed drive [27]
42
Department of Mechanical & Aerospace Engineering
Disadvantages
Additional energy is needed to rotate the wheel
Air intake and air exit duct should be close to each other [27]
43
Department of Mechanical & Aerospace Engineering
6 METHODOLOGY
The effective modelling of hotel environment was done in ESP-r with the knowledge gained
from the literature review.
Initially the project tend to be a continuation of a feasibility study for CCHP in the hospitality
sector but according to the client interest, the project’s focus shifted towards the recovery of
waste heat exhausted from the building. This ended up with the installation of MVHR system
for the building.
The floor plans was obtained from the client and attached in the Appendix-A. The
dimensions of sections like restaurant, lobby, reception, bar, plant room, bedroom etc. was
measured manually.
In ESP-r, the model begins at geometry phase and ends at defining the surface connection and
boundary in order to run the simulation. Polygon method was chosen to model each zone. On
the other hand construction material and its U-value play an important role in indoor
environment comfort. Hence careful and accurate selection of material was made. The
spreadsheet calculation was carried out to define sensible and latent gain of lighting, people
and equipment. Finally the boundary and surface connection of each zone was defined to
carry out the simulation process.
Mechanical ventilation system was modelled with the knowledge obtained from the thorough
review of MVHR example models in ESP-r as well as literature review on MVHR system.
The description and assumptions made for modelling of zones and plant system is described
in the chapter:
The energy standard of the building was assessed by comparing annual power and gas
consumption in kWhr /m2 and annual CO2 emission from the building with the energy bench
mark TM46:2008.
The electricity consumption of the hotel was measured and power factor over each month
was calculated to view the effective utilization of power. The energy delivered to the zones
by duct system was compared with the electricity consumption of the hotel and prove the
MVHR system was effective to the hotel.
44
Department of Mechanical & Aerospace Engineering
7 MODELLING
7.1 CONTEXT
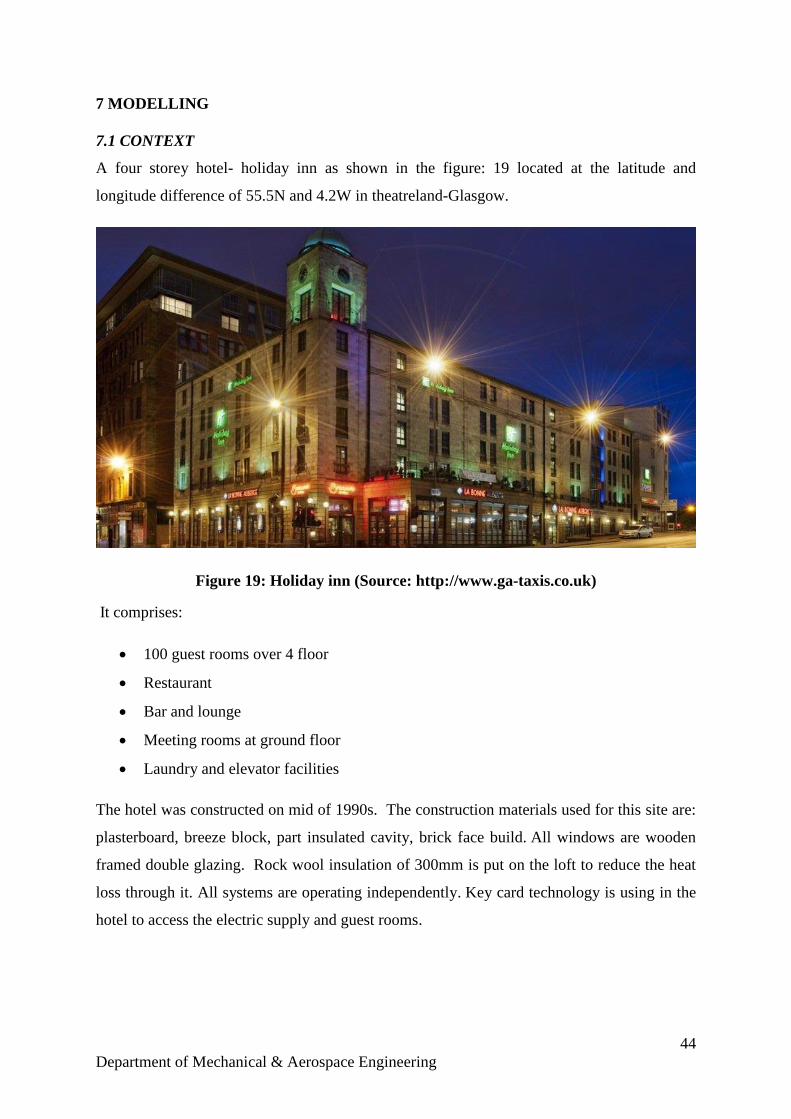
A four storey hotel- holiday inn as shown in the figure: 19 located at the latitude and
longitude difference of 55.5N and 4.2W in theatreland-Glasgow.
Figure 19: Holiday inn (Source: http://www.ga-taxis.co.uk)
It comprises:
100 guest rooms over 4 floor
Restaurant
Bar and lounge
Meeting rooms at ground floor
Laundry and elevator facilities
The hotel was constructed on mid of 1990s. The construction materials used for this site are:
plasterboard, breeze block, part insulated cavity, brick face build. All windows are wooden
framed double glazing. Rock wool insulation of 300mm is put on the loft to reduce the heat
loss through it. All systems are operating independently. Key card technology is using in the
hotel to access the electric supply and guest rooms.
45
Department of Mechanical & Aerospace Engineering
Common ground floor areas are heated by gas fired wet central heating through built in
radiators. Guest rooms and meeting rooms are heated and cool by condensers. Hot water to
the hotel is supplied from the storage tank which is fed by gas fired water heaters.
The Kitchen servicing operate between 06:00 and 23:00 which utilises both gas and
electricity for its facilities. The hotel mainly has business clients during the week and thus
comparatively few guests remain in their rooms during the day. The hotel is part of the 'Green
Tourism Business Scheme' and is operated in a proactive 'Energy Aware' manner.
7.2 MODEL DESCRIPTION
ESP-r is a building performance energy modelling software which has certain distinct
features through which one can assess the building’s thermal, air, mean radiant, wet bulb
temperature, gaseous emissions, relative humidity, indoor environment comfort, etc.
In ESP-r the first stage in developing the model starts at geometry phase. There are different
options to model a building in ESP-r, some of them are: polygon, rectangular, 3D model and
bitmap.
The hotel rooms are created as a zone by polygon approach. To reduce the software
complexity as well as to bring a better result certain assumptions are made at both floors,
some of them are: Conservatory, lounge, bar and restaurant are considered as one zone.
Further reception, foyer and office are coupled as another zone. Due to certain constraints,
only one storey was constructed in ESP-r, the constraints are given below
Zone modelling should start and proceed in anti-clockwise direction, otherwise it
takes top surface as a ground and bottom surface as a ceiling.
It cannot hold more than 58 vertex coordinates in a single zone.
ESP-r has a rule that every surface has one boundary condition.
Only 72 zones/ sections could model in ESP-r
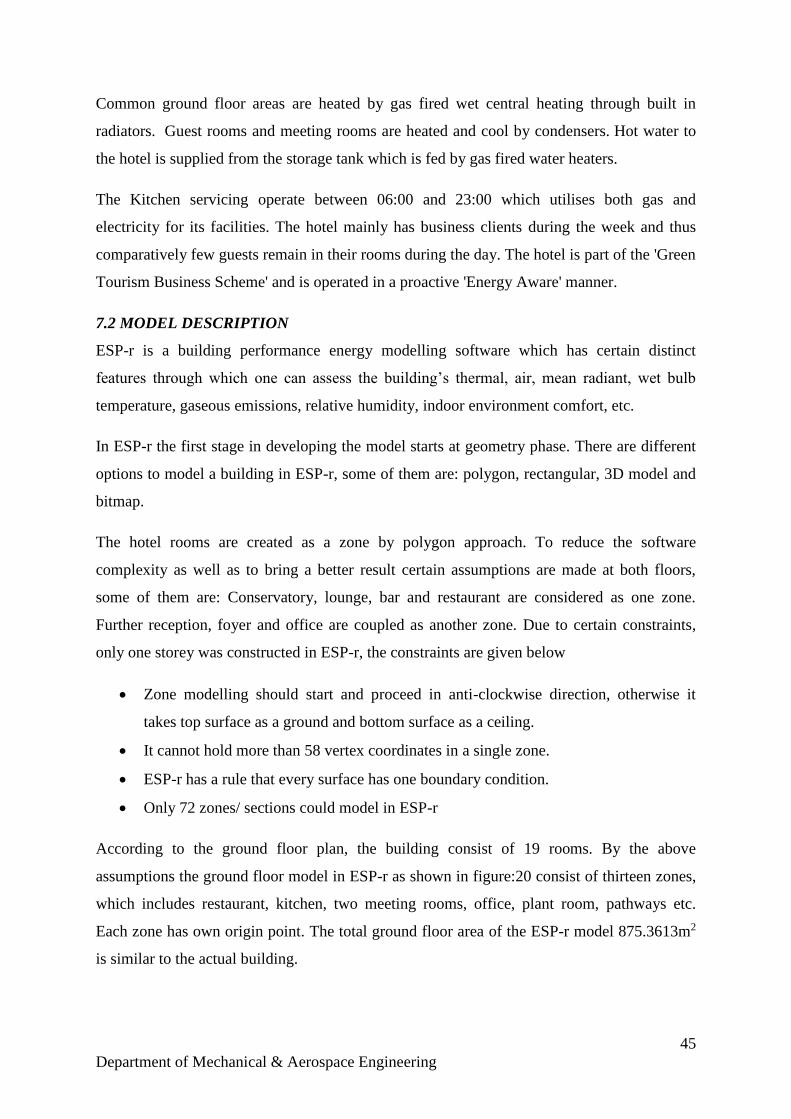
According to the ground floor plan, the building consist of 19 rooms. By the above
assumptions the ground floor model in ESP-r as shown in figure:20 consist of thirteen zones,
which includes restaurant, kitchen, two meeting rooms, office, plant room, pathways etc.
Each zone has own origin point. The total ground floor area of the ESP-r model 875.3613m2
is similar to the actual building.
46
Department of Mechanical & Aerospace Engineering
Figure 20: Ground floor model
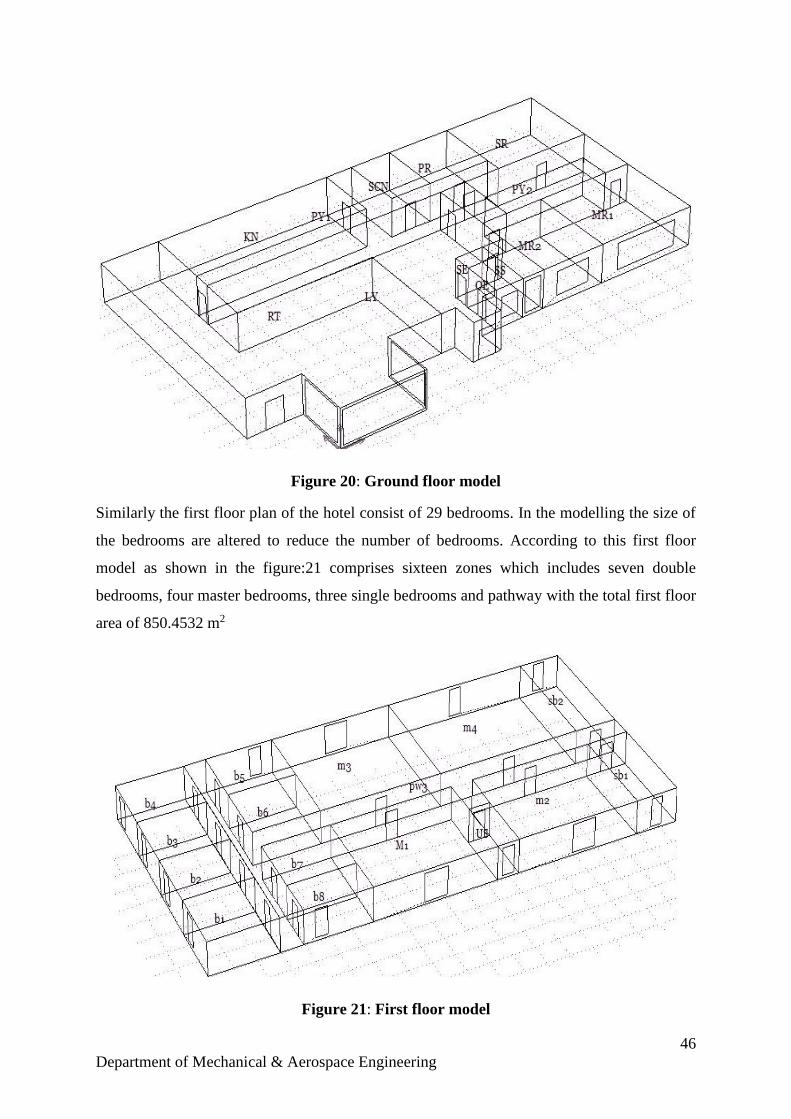
Similarly the first floor plan of the hotel consist of 29 bedrooms. In the modelling the size of
the bedrooms are altered to reduce the number of bedrooms. According to this first floor
model as shown in the figure:21 comprises sixteen zones which includes seven double
bedrooms, four master bedrooms, three single bedrooms and pathway with the total first floor
area of 850.4532 m2
Figure 21: First floor model
47
Department of Mechanical & Aerospace Engineering
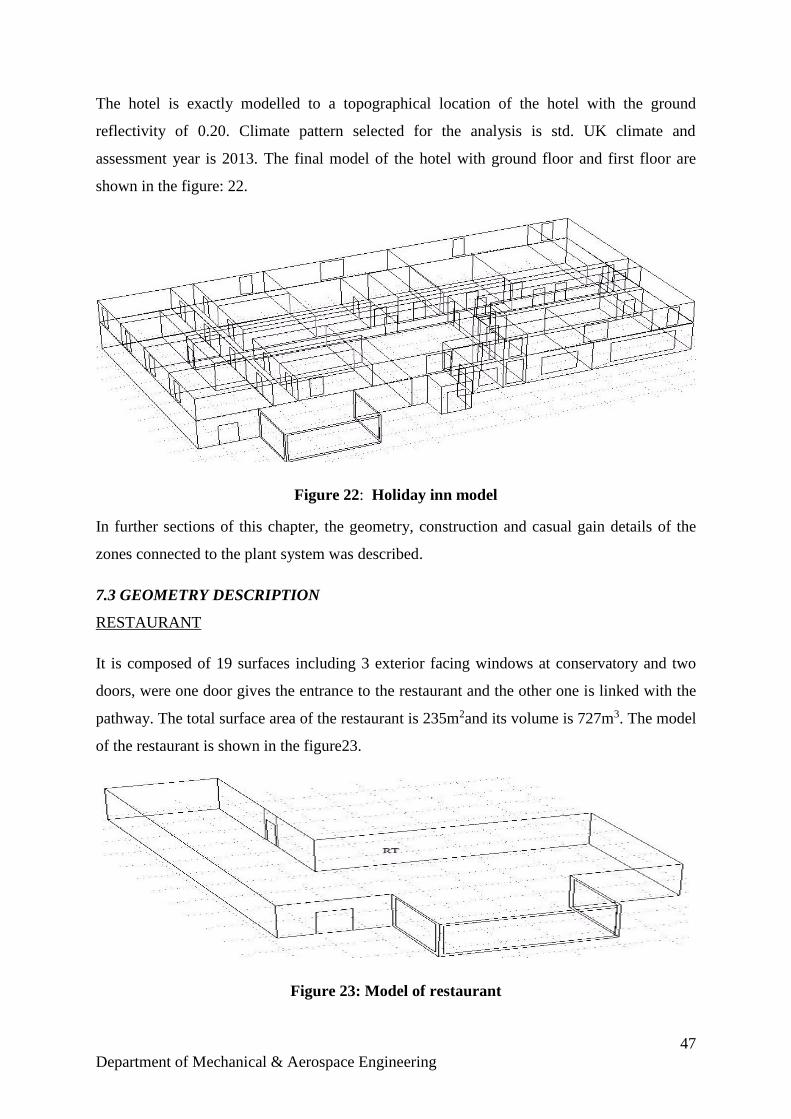
The hotel is exactly modelled to a topographical location of the hotel with the ground
reflectivity of 0.20. Climate pattern selected for the analysis is std. UK climate and
assessment year is 2013. The final model of the hotel with ground floor and first floor are
shown in the figure: 22.
Figure 22: Holiday inn model
In further sections of this chapter, the geometry, construction and casual gain details of the
zones connected to the plant system was described.
7.3 GEOMETRY DESCRIPTION
RESTAURANT
It is composed of 19 surfaces including 3 exterior facing windows at conservatory and two
doors, were one door gives the entrance to the restaurant and the other one is linked with the
pathway. The total surface area of the restaurant is 235m2and its volume is 727m3. The model
of the restaurant is shown in the figure23.
Figure 23: Model of restaurant
48
Department of Mechanical & Aerospace Engineering
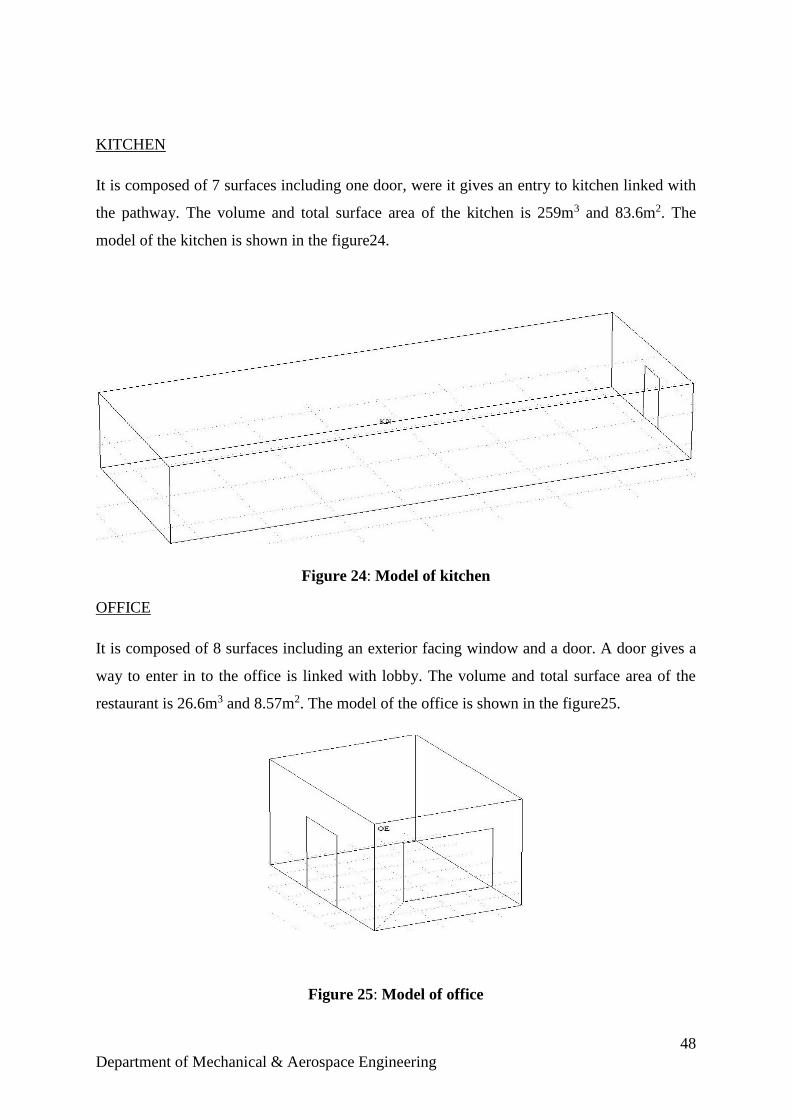
KITCHEN
It is composed of 7 surfaces including one door, were it gives an entry to kitchen linked with
the pathway. The volume and total surface area of the kitchen is 259m3 and 83.6m2. The
model of the kitchen is shown in the figure24.
Figure 24: Model of kitchen
OFFICE
It is composed of 8 surfaces including an exterior facing window and a door. A door gives a
way to enter in to the office is linked with lobby. The volume and total surface area of the
restaurant is 26.6m3 and 8.57m2. The model of the office is shown in the figure25.
Figure 25: Model of office
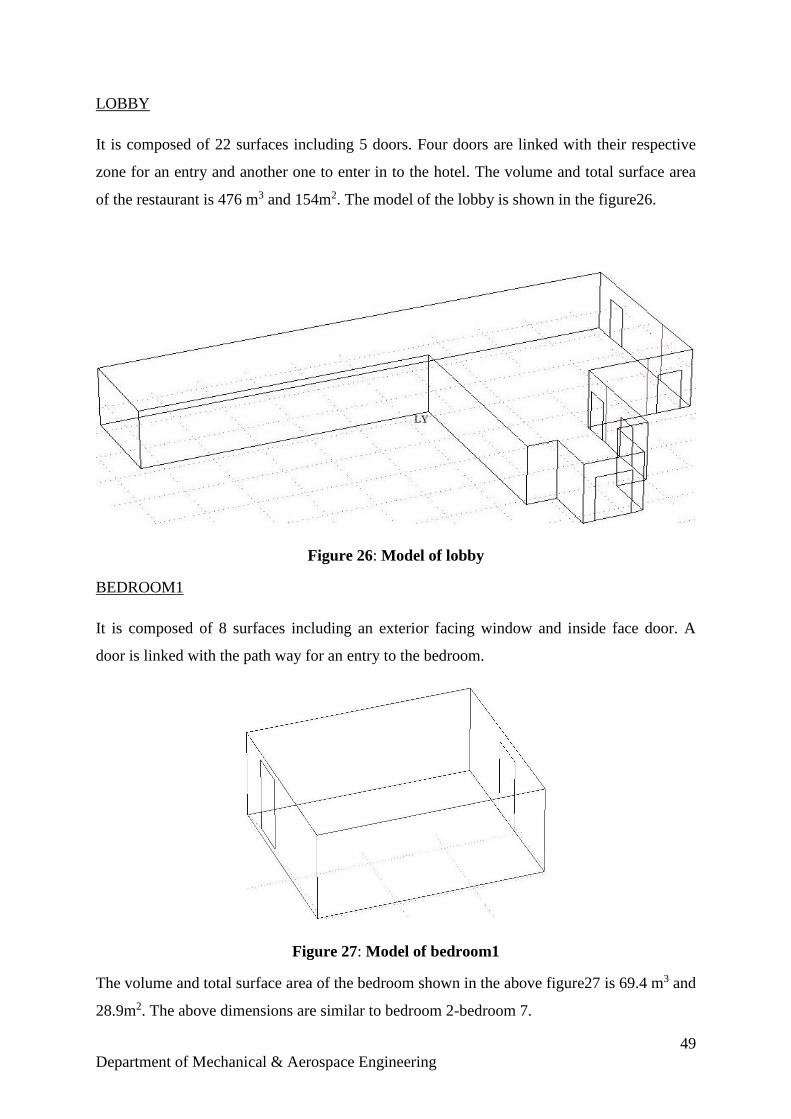
49
Department of Mechanical & Aerospace Engineering
LOBBY
It is composed of 22 surfaces including 5 doors. Four doors are linked with their respective
zone for an entry and another one to enter in to the hotel. The volume and total surface area
of the restaurant is 476 m3 and 154m2. The model of the lobby is shown in the figure26.
Figure 26: Model of lobby
BEDROOM1
It is composed of 8 surfaces including an exterior facing window and inside face door. A
door is linked with the path way for an entry to the bedroom.
Figure 27: Model of bedroom1
The volume and total surface area of the bedroom shown in the above figure27 is 69.4 m3 and
28.9m2. The above dimensions are similar to bedroom 2-bedroom 7.
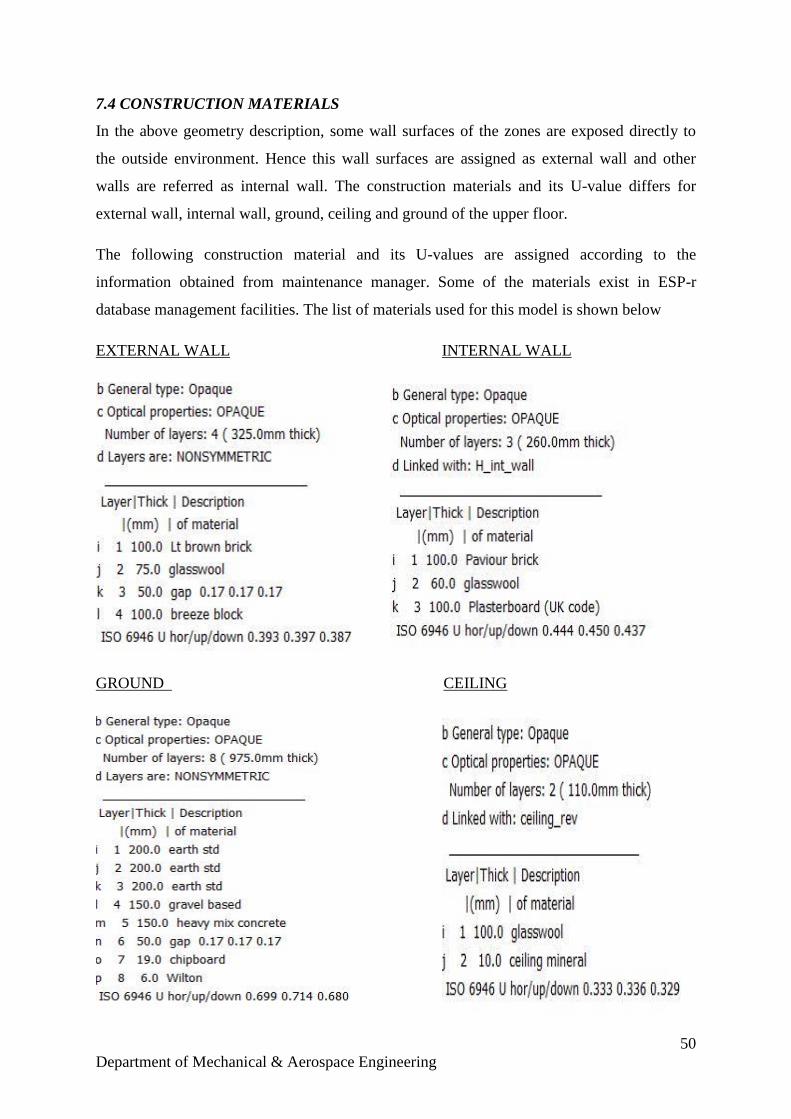
50
Department of Mechanical & Aerospace Engineering
7.4 CONSTRUCTION MATERIALS
In the above geometry description, some wall surfaces of the zones are exposed directly to
the outside environment. Hence this wall surfaces are assigned as external wall and other
walls are referred as internal wall. The construction materials and its U-value differs for
external wall, internal wall, ground, ceiling and ground of the upper floor.
The following construction material and its U-values are assigned according to the
information obtained from maintenance manager. Some of the materials exist in ESP-r
database management facilities. The list of materials used for this model is shown below
EXTERNAL WALL INTERNAL WALL
GROUND CEILING
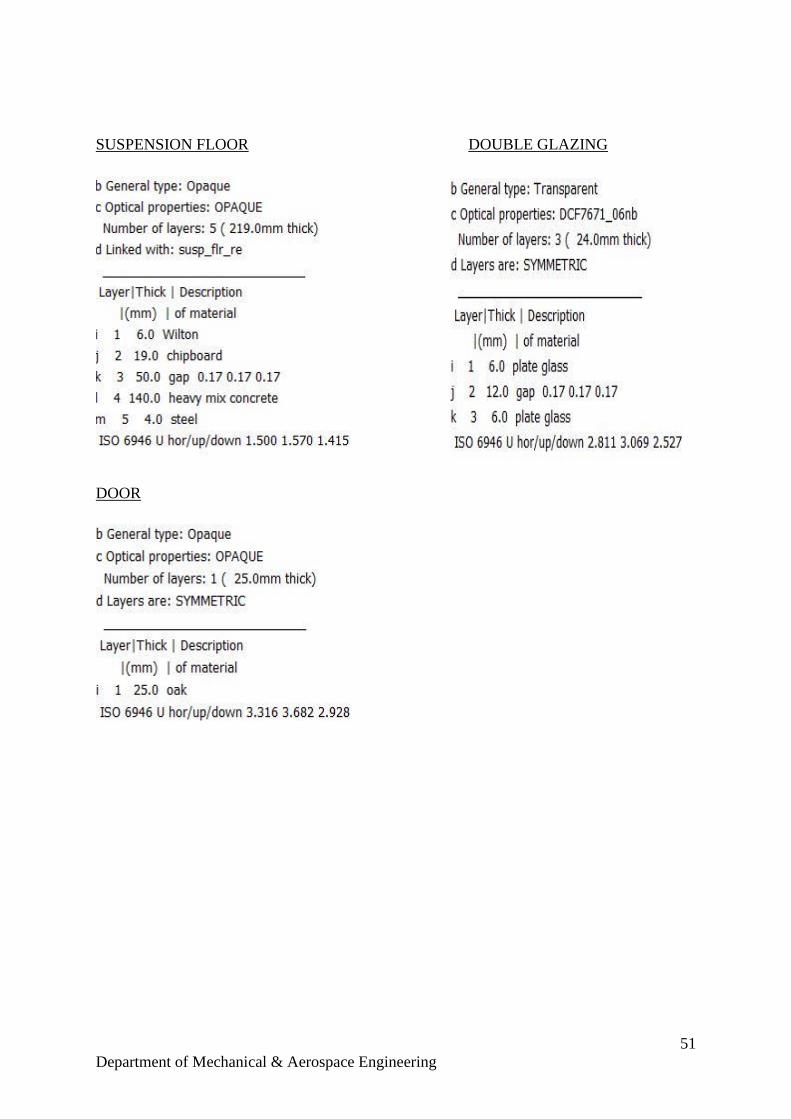
51
Department of Mechanical & Aerospace Engineering
SUSPENSION FLOOR DOUBLE GLAZING
DOOR
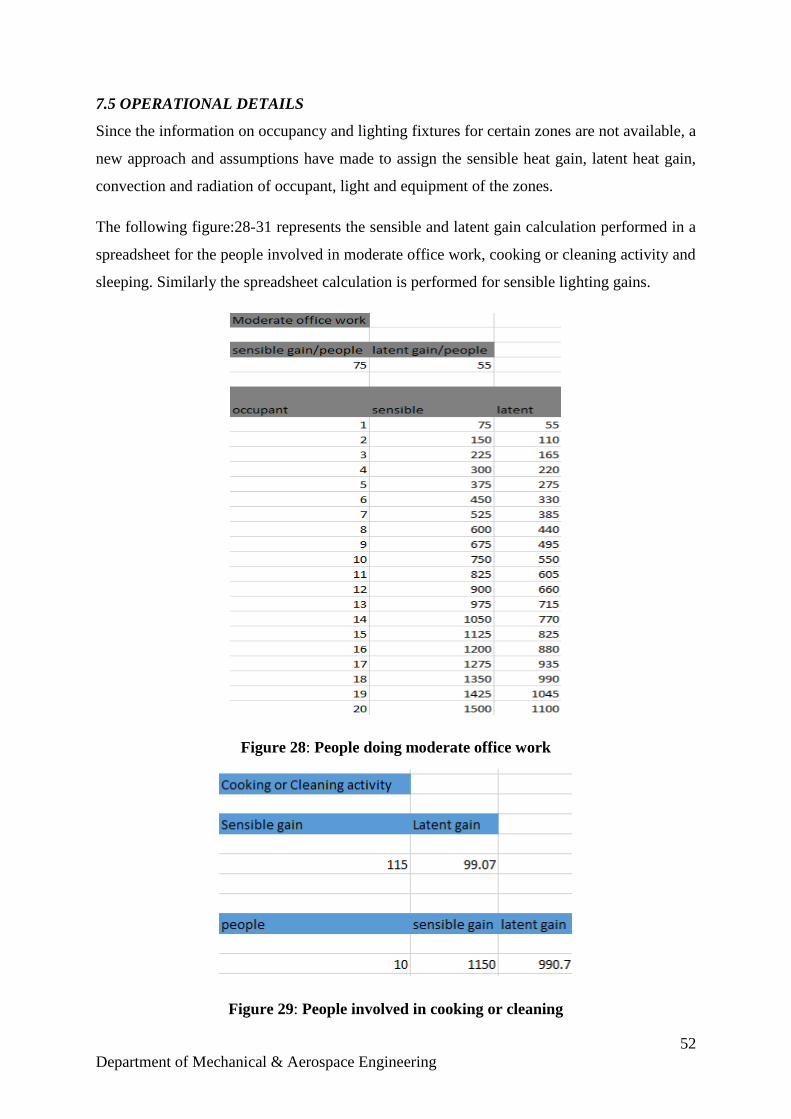
52
Department of Mechanical & Aerospace Engineering
7.5 OPERATIONAL DETAILS
Since the information on occupancy and lighting fixtures for certain zones are not available, a
new approach and assumptions have made to assign the sensible heat gain, latent heat gain,
convection and radiation of occupant, light and equipment of the zones.
The following figure:28-31 represents the sensible and latent gain calculation performed in a
spreadsheet for the people involved in moderate office work, cooking or cleaning activity and
sleeping. Similarly the spreadsheet calculation is performed for sensible lighting gains.
Figure 28: People doing moderate office work
Figure 29: People involved in cooking or cleaning
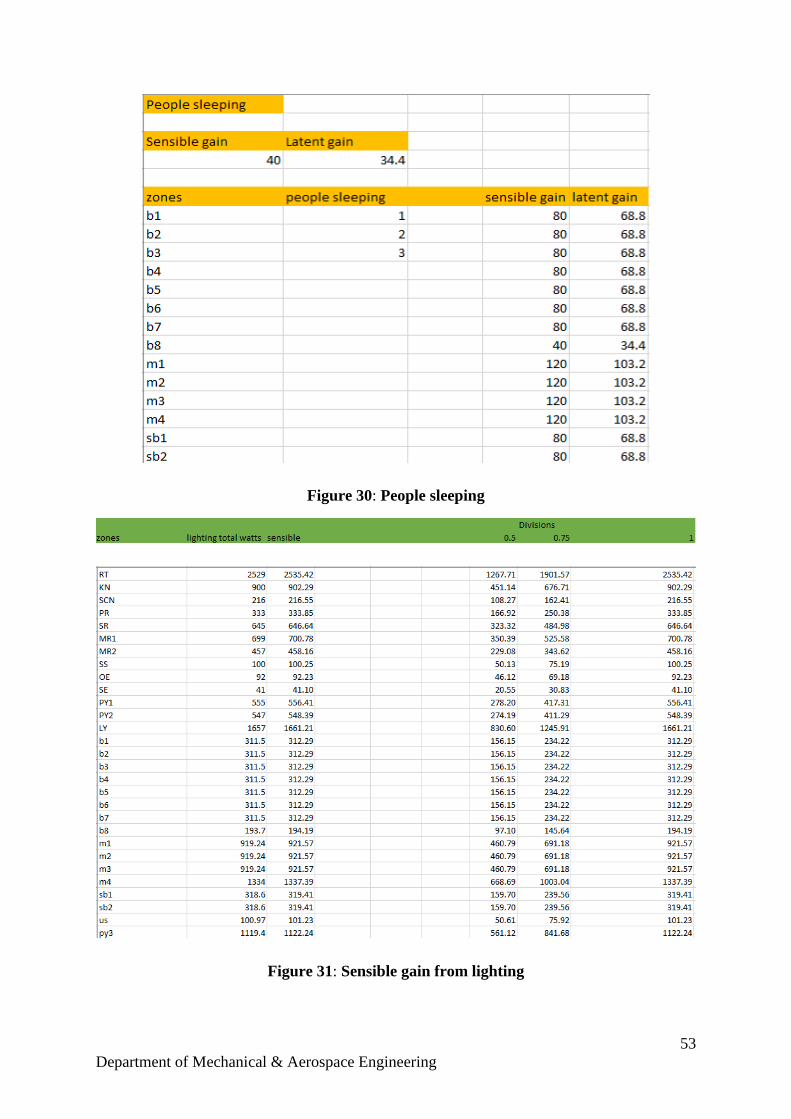
53
Department of Mechanical & Aerospace Engineering
Figure 30: People sleeping
Figure 31: Sensible gain from lighting
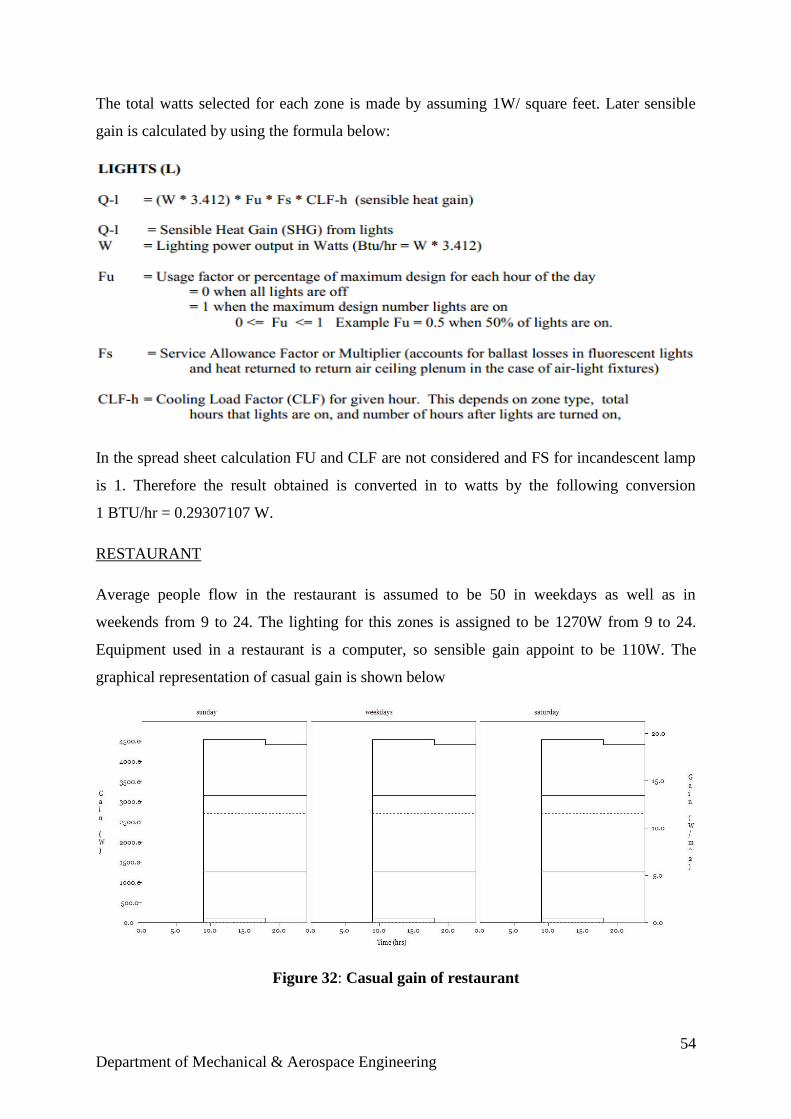
54
Department of Mechanical & Aerospace Engineering
The total watts selected for each zone is made by assuming 1W/ square feet. Later sensible
gain is calculated by using the formula below:
In the spread sheet calculation FU and CLF are not considered and FS for incandescent lamp
is 1. Therefore the result obtained is converted in to watts by the following conversion
1 BTU/hr = 0.29307107 W.
RESTAURANT
Average people flow in the restaurant is assumed to be 50 in weekdays as well as in
weekends from 9 to 24. The lighting for this zones is assigned to be 1270W from 9 to 24.
Equipment used in a restaurant is a computer, so sensible gain appoint to be 110W. The
graphical representation of casual gain is shown below
Figure 32: Casual gain of restaurant
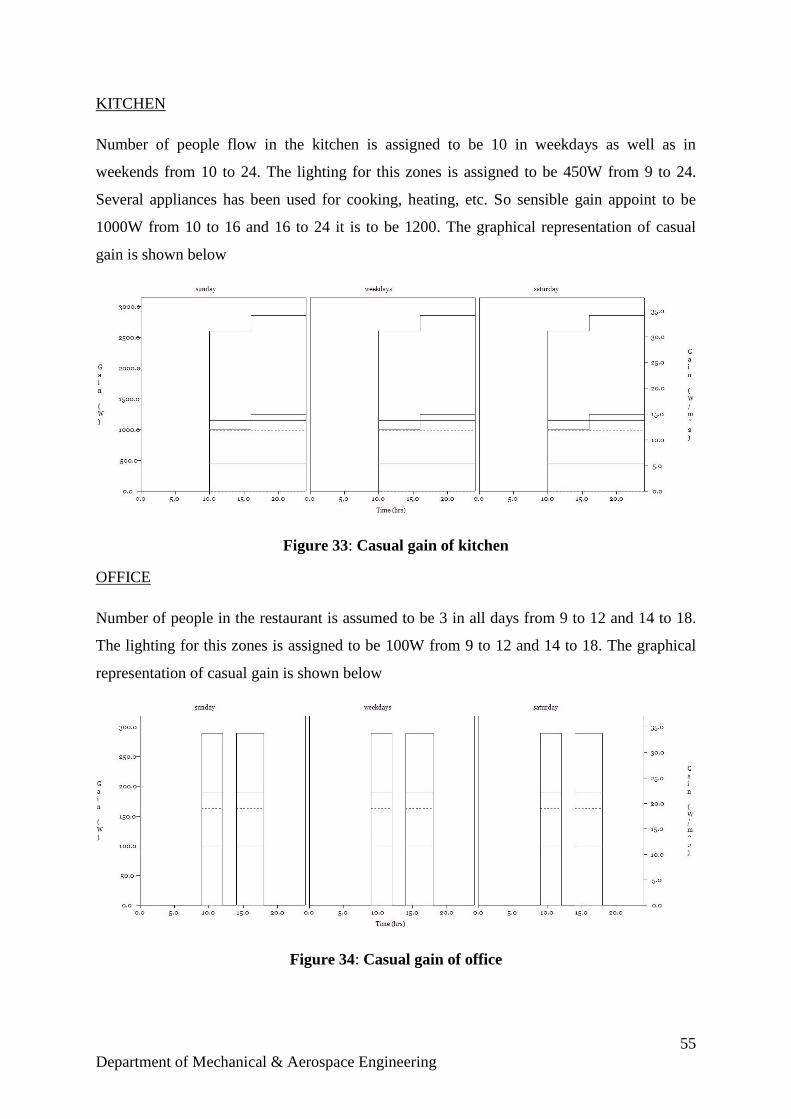
55
Department of Mechanical & Aerospace Engineering
KITCHEN
Number of people flow in the kitchen is assigned to be 10 in weekdays as well as in
weekends from 10 to 24. The lighting for this zones is assigned to be 450W from 9 to 24.
Several appliances has been used for cooking, heating, etc. So sensible gain appoint to be
1000W from 10 to 16 and 16 to 24 it is to be 1200. The graphical representation of casual
gain is shown below
Figure 33: Casual gain of kitchen
OFFICE
Number of people in the restaurant is assumed to be 3 in all days from 9 to 12 and 14 to 18.
The lighting for this zones is assigned to be 100W from 9 to 12 and 14 to 18. The graphical
representation of casual gain is shown below
Figure 34: Casual gain of office
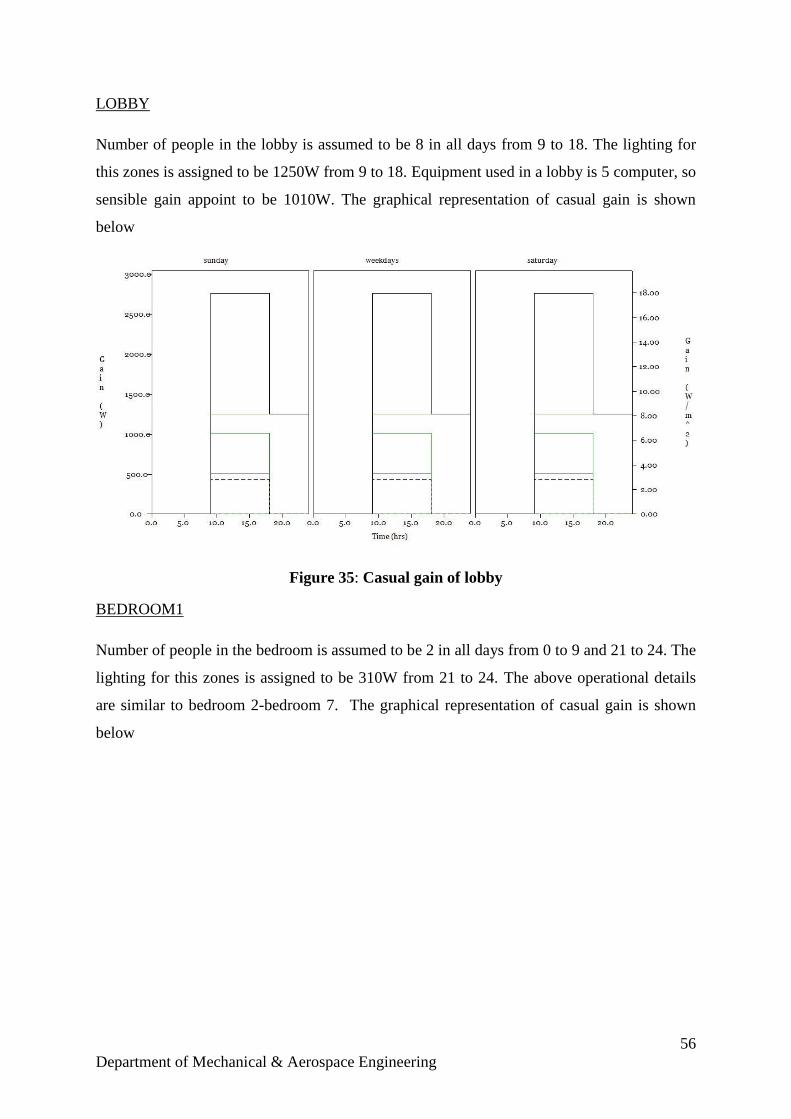
56
Department of Mechanical & Aerospace Engineering
LOBBY
Number of people in the lobby is assumed to be 8 in all days from 9 to 18. The lighting for
this zones is assigned to be 1250W from 9 to 18. Equipment used in a lobby is 5 computer, so
sensible gain appoint to be 1010W. The graphical representation of casual gain is shown
below
Figure 35: Casual gain of lobby
BEDROOM1
Number of people in the bedroom is assumed to be 2 in all days from 0 to 9 and 21 to 24. The
lighting for this zones is assigned to be 310W from 21 to 24. The above operational details
are similar to bedroom 2-bedroom 7. The graphical representation of casual gain is shown
below
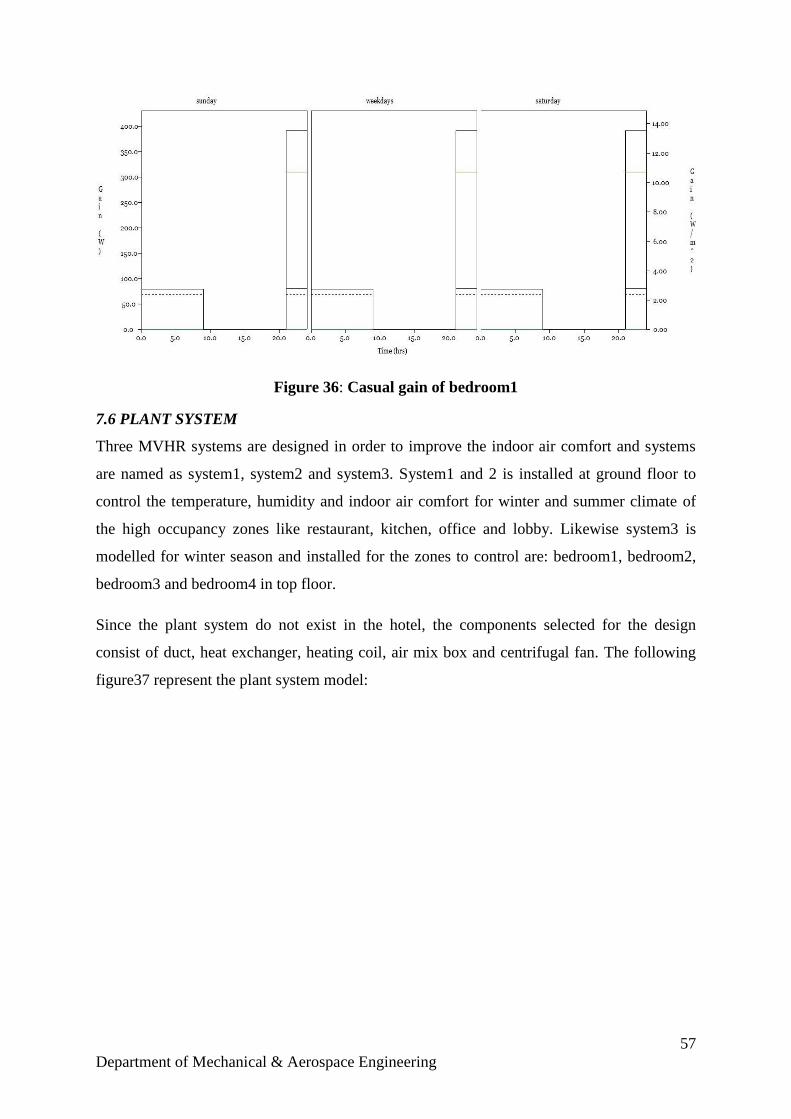
57
Department of Mechanical & Aerospace Engineering
Figure 36: Casual gain of bedroom1
7.6 PLANT SYSTEM
Three MVHR systems are designed in order to improve the indoor air comfort and systems
are named as system1, system2 and system3. System1 and 2 is installed at ground floor to
control the temperature, humidity and indoor air comfort for winter and summer climate of
the high occupancy zones like restaurant, kitchen, office and lobby. Likewise system3 is
modelled for winter season and installed for the zones to control are: bedroom1, bedroom2,
bedroom3 and bedroom4 in top floor.
Since the plant system do not exist in the hotel, the components selected for the design
consist of duct, heat exchanger, heating coil, air mix box and centrifugal fan. The following
figure37 represent the plant system model:
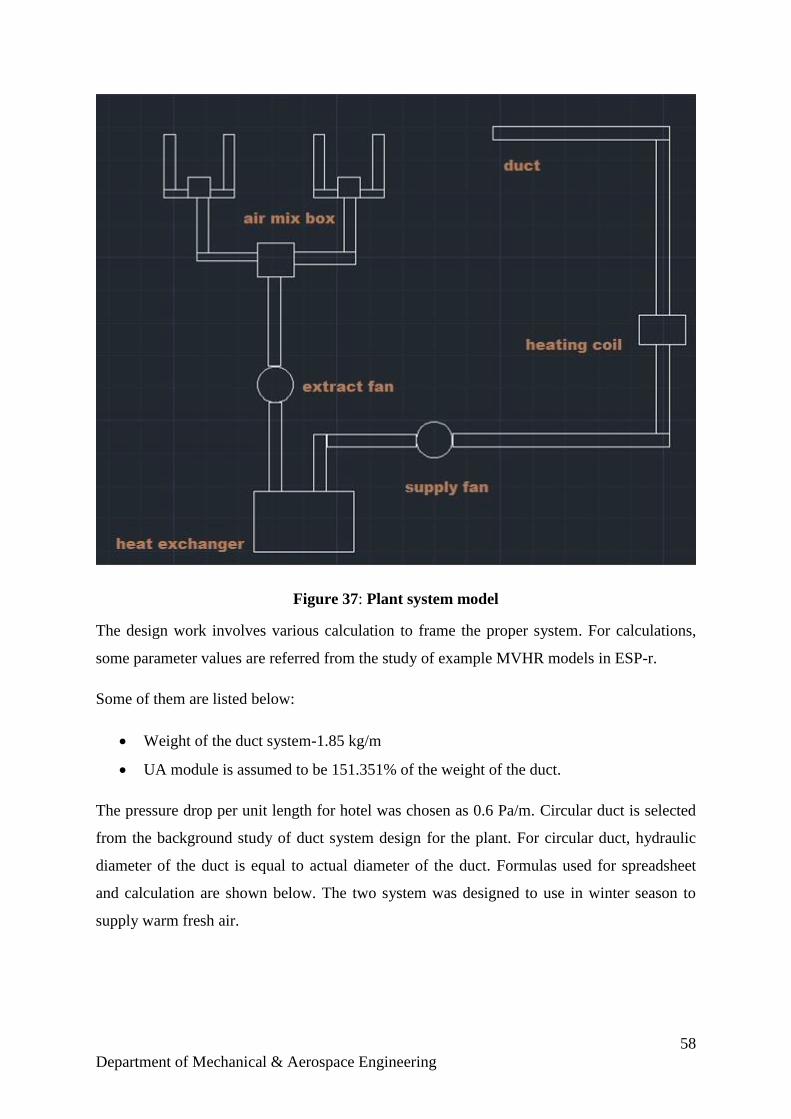
58
Department of Mechanical & Aerospace Engineering
Figure 37: Plant system model
The design work involves various calculation to frame the proper system. For calculations,
some parameter values are referred from the study of example MVHR models in ESP-r.
Some of them are listed below:
Weight of the duct system-1.85 kg/m
UA module is assumed to be 151.351% of the weight of the duct.
The pressure drop per unit length for hotel was chosen as 0.6 Pa/m. Circular duct is selected
from the background study of duct system design for the plant. For circular duct, hydraulic
diameter of the duct is equal to actual diameter of the duct. Formulas used for spreadsheet
and calculation are shown below. The two system was designed to use in winter season to
supply warm fresh air.
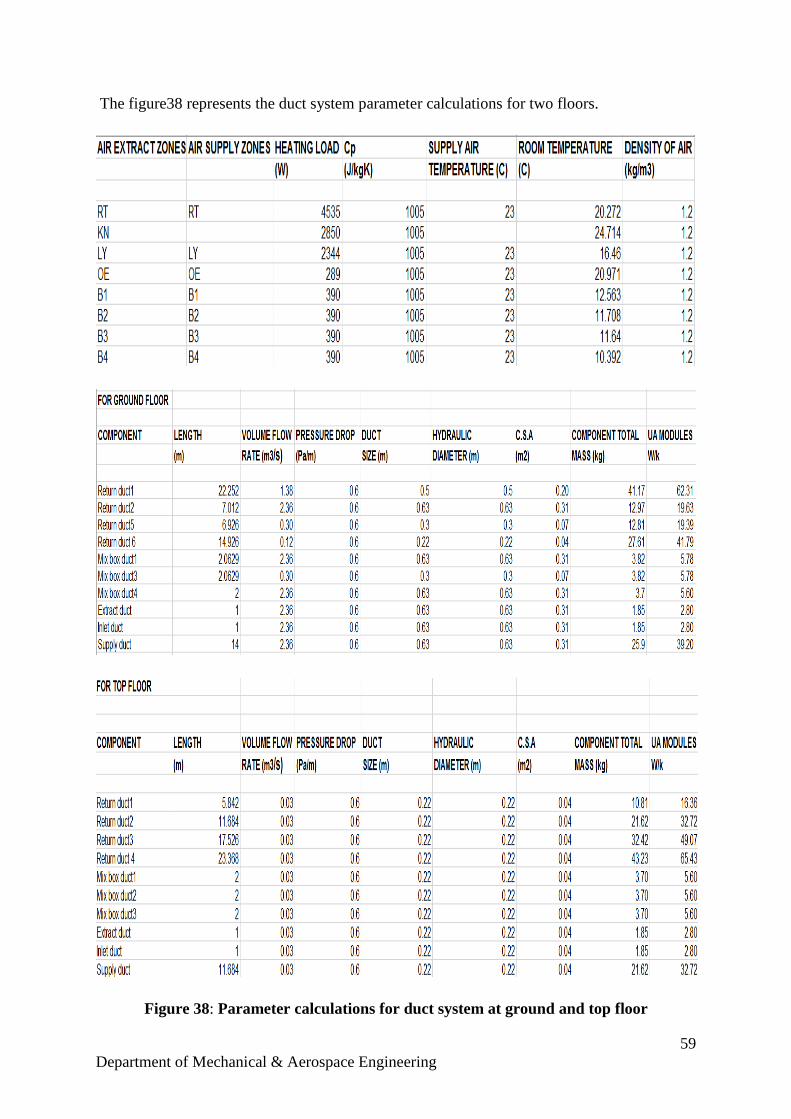
59
Department of Mechanical & Aerospace Engineering
The figure38 represents the duct system parameter calculations for two floors.
Figure 38: Parameter calculations for duct system at ground and top floor
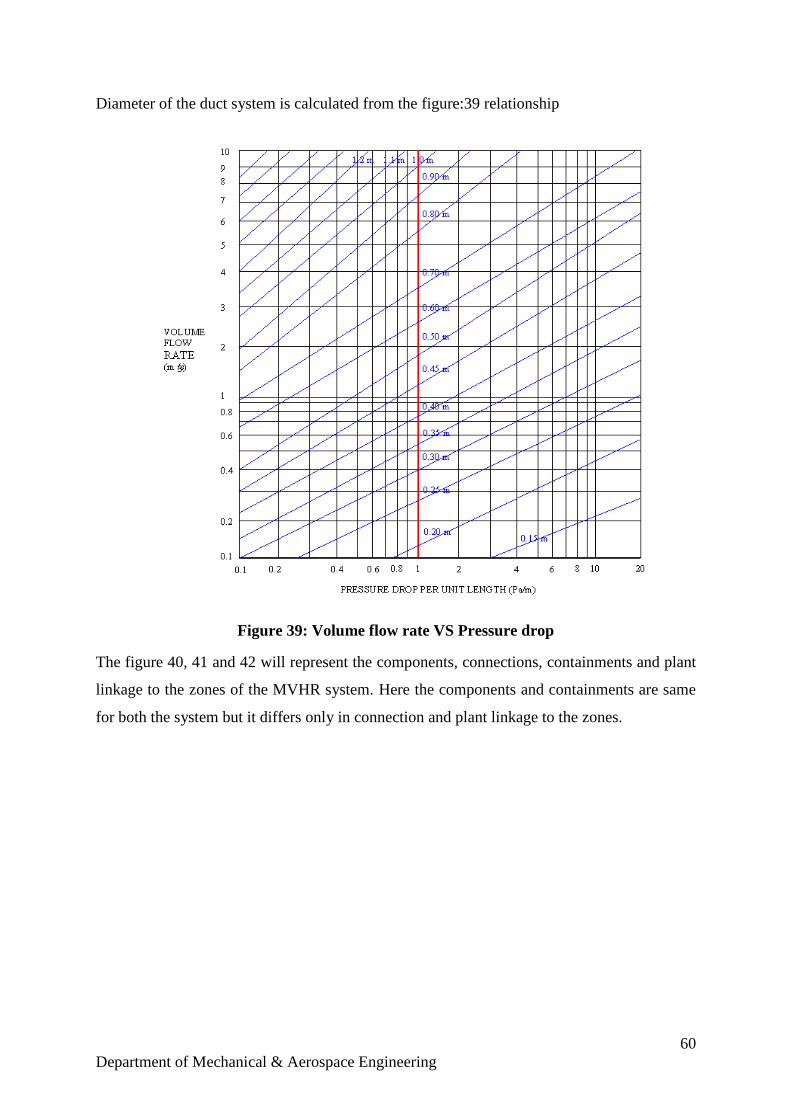
60
Department of Mechanical & Aerospace Engineering
Diameter of the duct system is calculated from the figure:39 relationship
Figure 39: Volume flow rate VS Pressure drop
The figure 40, 41 and 42 will represent the components, connections, containments and plant
linkage to the zones of the MVHR system. Here the components and containments are same
for both the system but it differs only in connection and plant linkage to the zones.
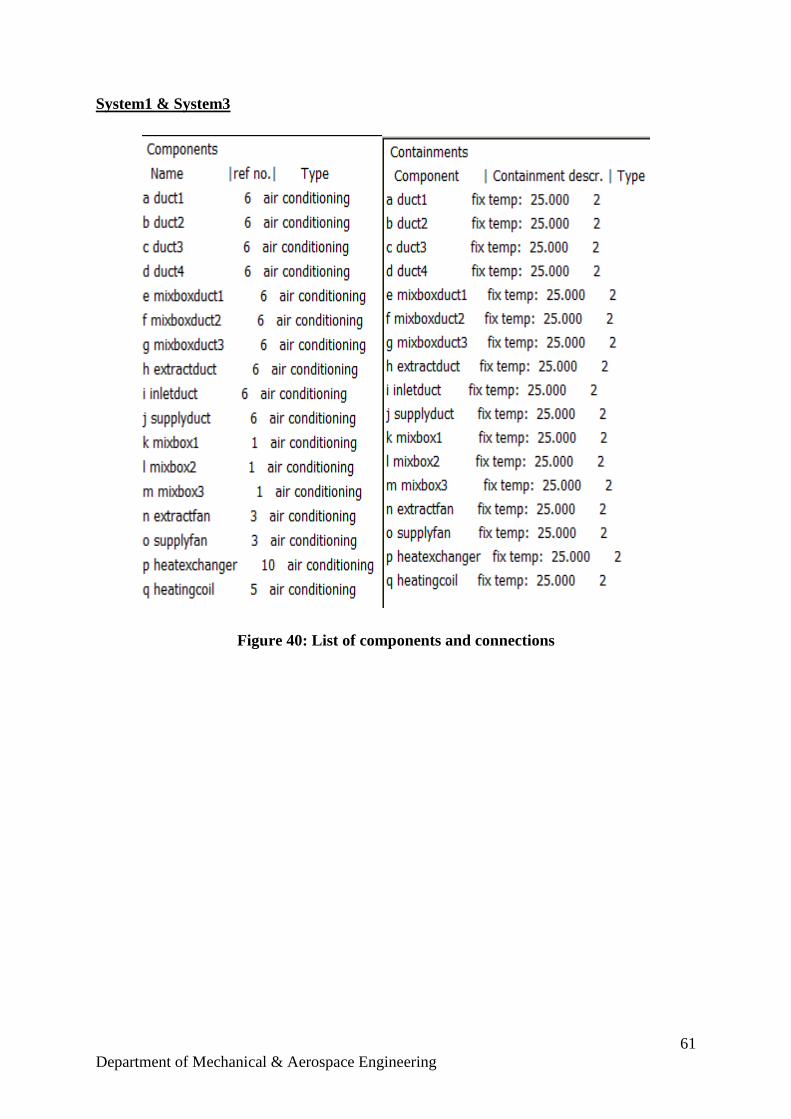
61
Department of Mechanical & Aerospace Engineering
System1 & System3
Figure 40: List of components and connections
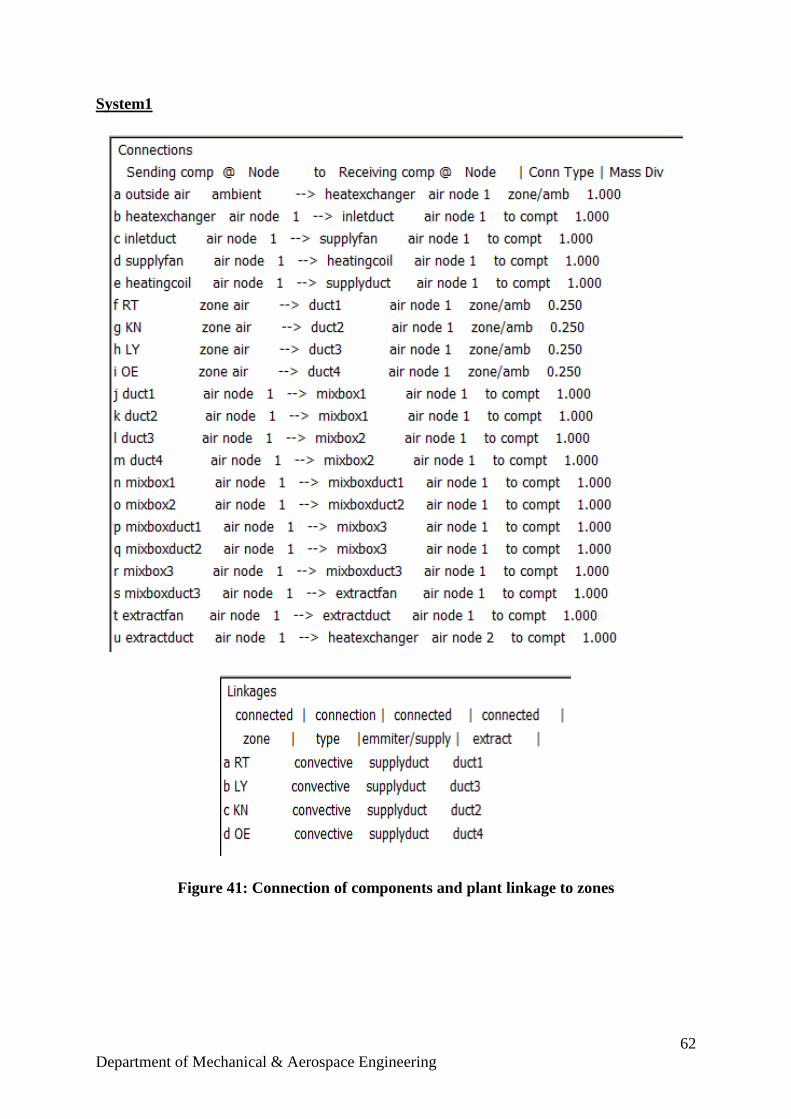
62
Department of Mechanical & Aerospace Engineering
System1
Figure 41: Connection of components and plant linkage to zones
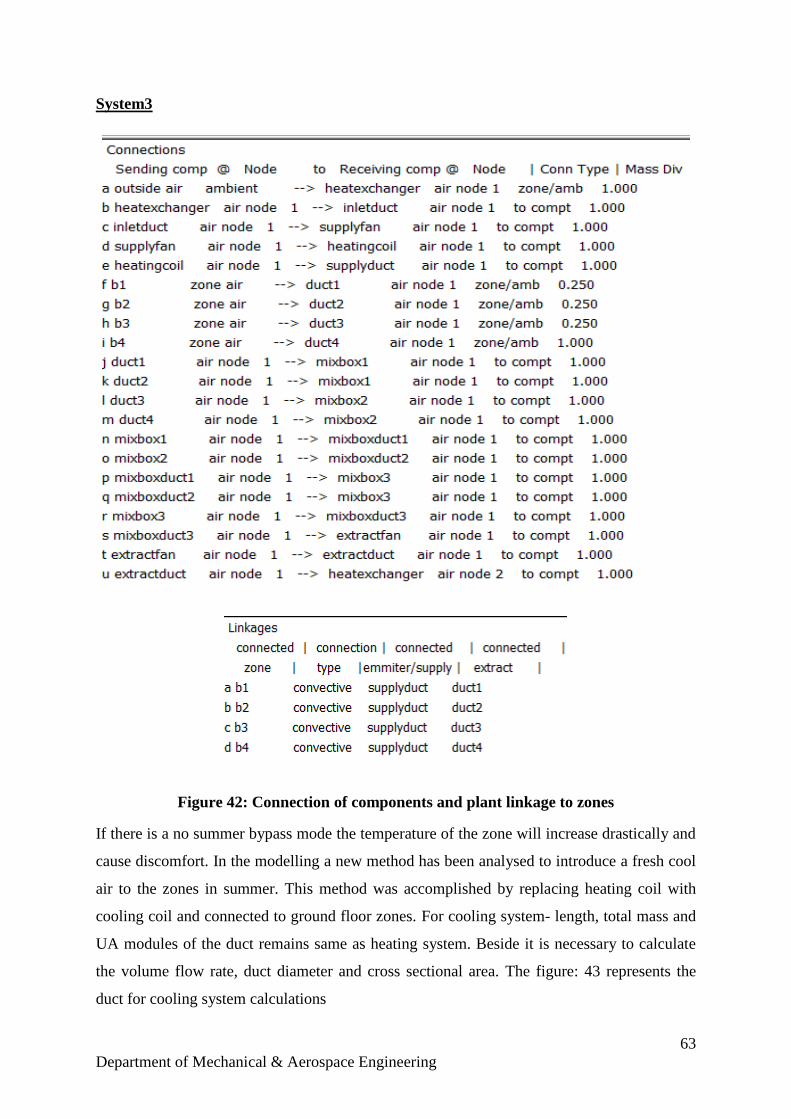
63
Department of Mechanical & Aerospace Engineering
System3
Figure 42: Connection of components and plant linkage to zones
If there is a no summer bypass mode the temperature of the zone will increase drastically and
cause discomfort. In the modelling a new method has been analysed to introduce a fresh cool
air to the zones in summer. This method was accomplished by replacing heating coil with
cooling coil and connected to ground floor zones. For cooling system- length, total mass and
UA modules of the duct remains same as heating system. Beside it is necessary to calculate
the volume flow rate, duct diameter and cross sectional area. The figure: 43 represents the
duct for cooling system calculations
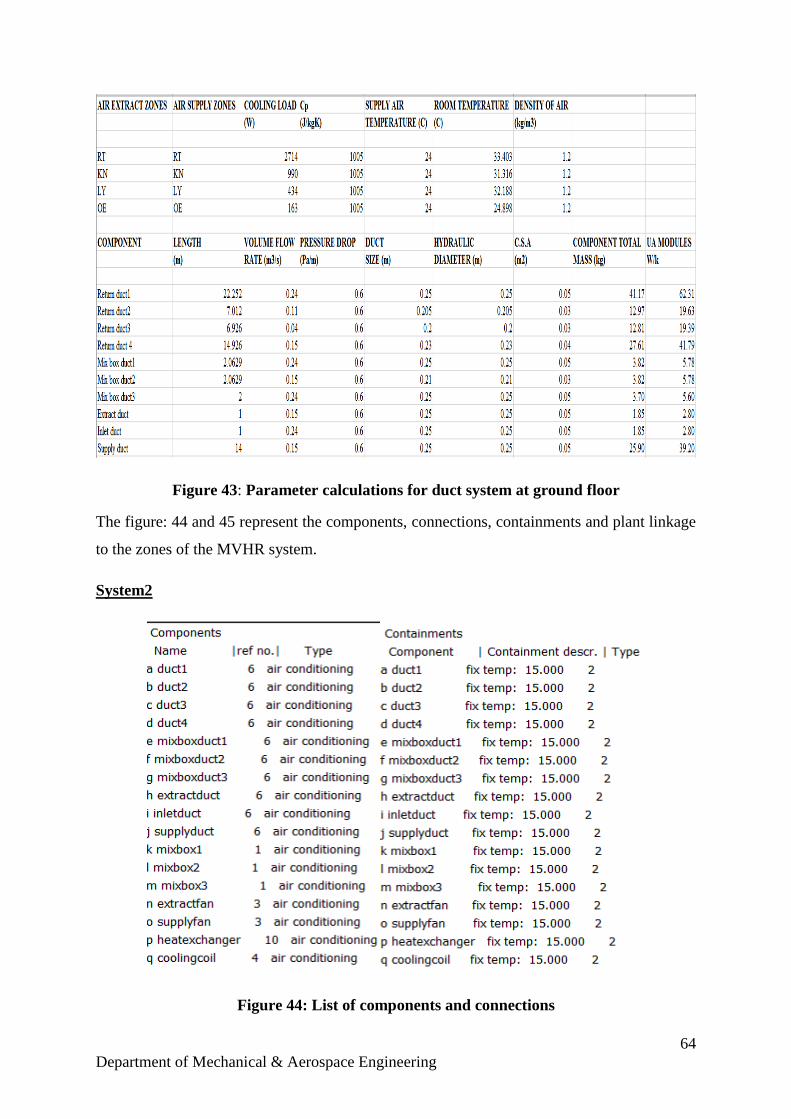
64
Department of Mechanical & Aerospace Engineering
Figure 43: Parameter calculations for duct system at ground floor
The figure: 44 and 45 represent the components, connections, containments and plant linkage
to the zones of the MVHR system.
System2
Figure 44: List of components and connections
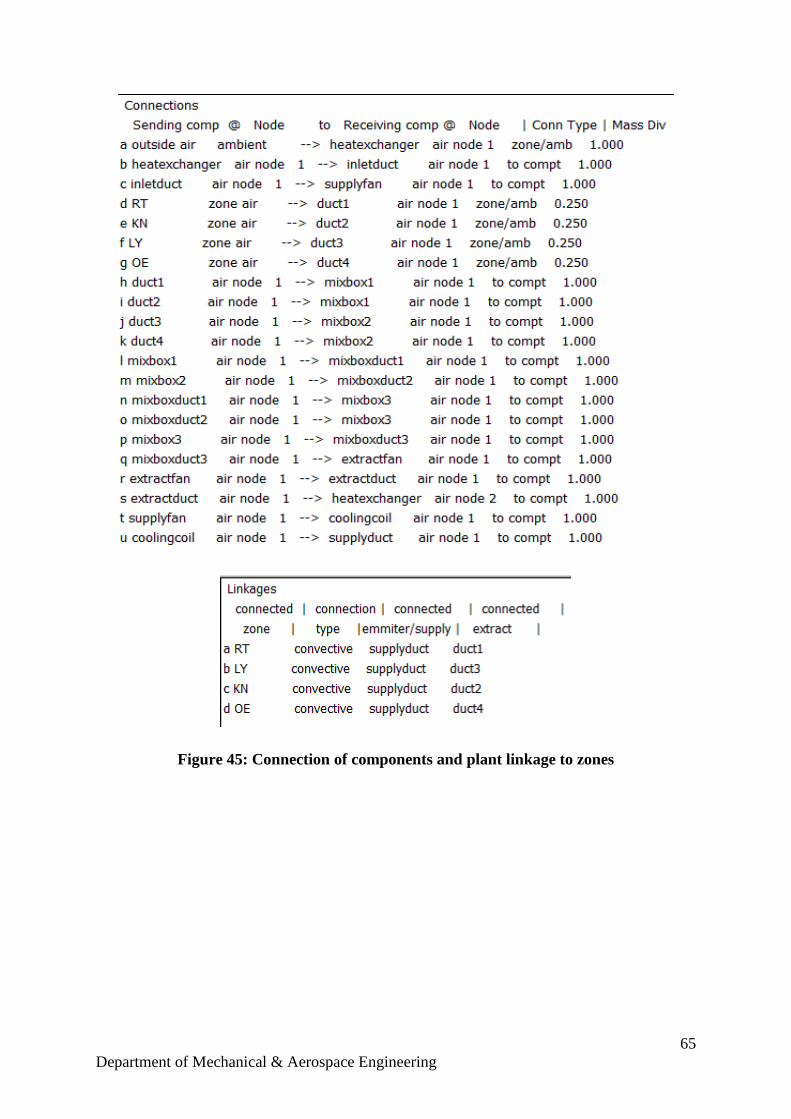
65
Department of Mechanical & Aerospace Engineering
Figure 45: Connection of components and plant linkage to zones
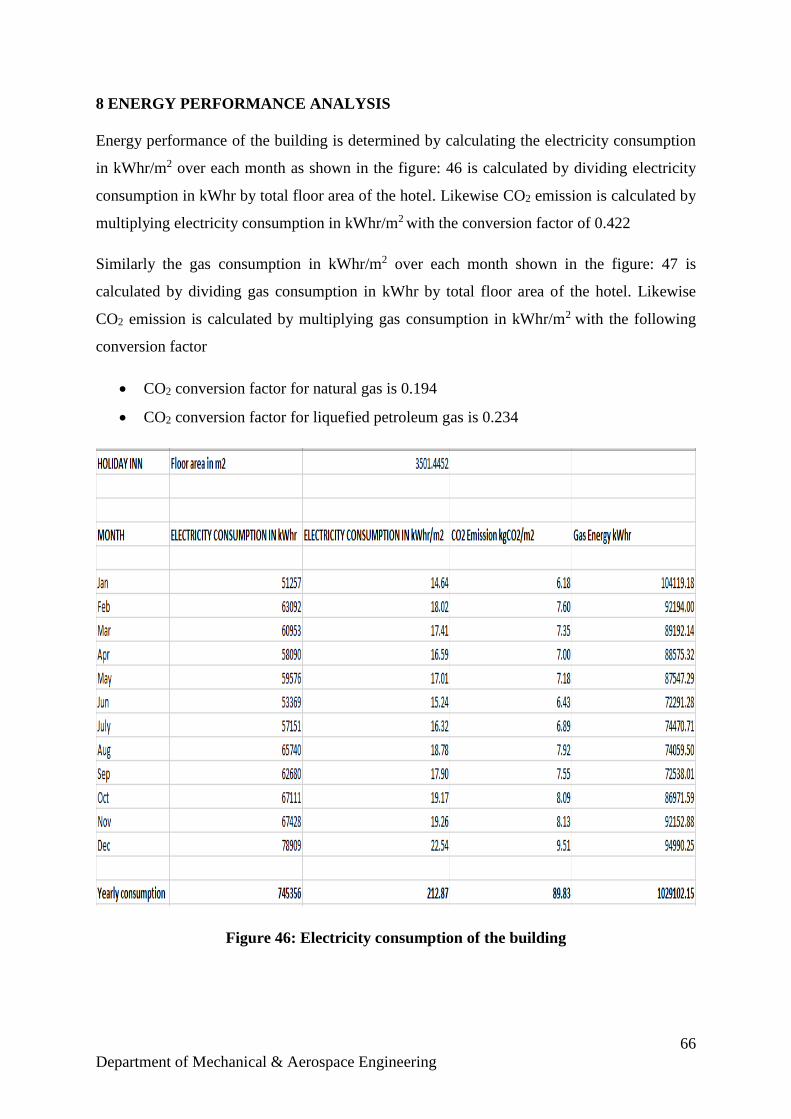
66
Department of Mechanical & Aerospace Engineering
8 ENERGY PERFORMANCE ANALYSIS
Energy performance of the building is determined by calculating the electricity consumption
in kWhr/m2 over each month as shown in the figure: 46 is calculated by dividing electricity
consumption in kWhr by total floor area of the hotel. Likewise CO2 emission is calculated by
multiplying electricity consumption in kWhr/m2 with the conversion factor of 0.422
Similarly the gas consumption in kWhr/m2 over each month shown in the figure: 47 is
calculated by dividing gas consumption in kWhr by total floor area of the hotel. Likewise
CO2 emission is calculated by multiplying gas consumption in kWhr/m2 with the following
conversion factor
CO2 conversion factor for natural gas is 0.194
CO2 conversion factor for liquefied petroleum gas is 0.234
Figure 46: Electricity consumption of the building
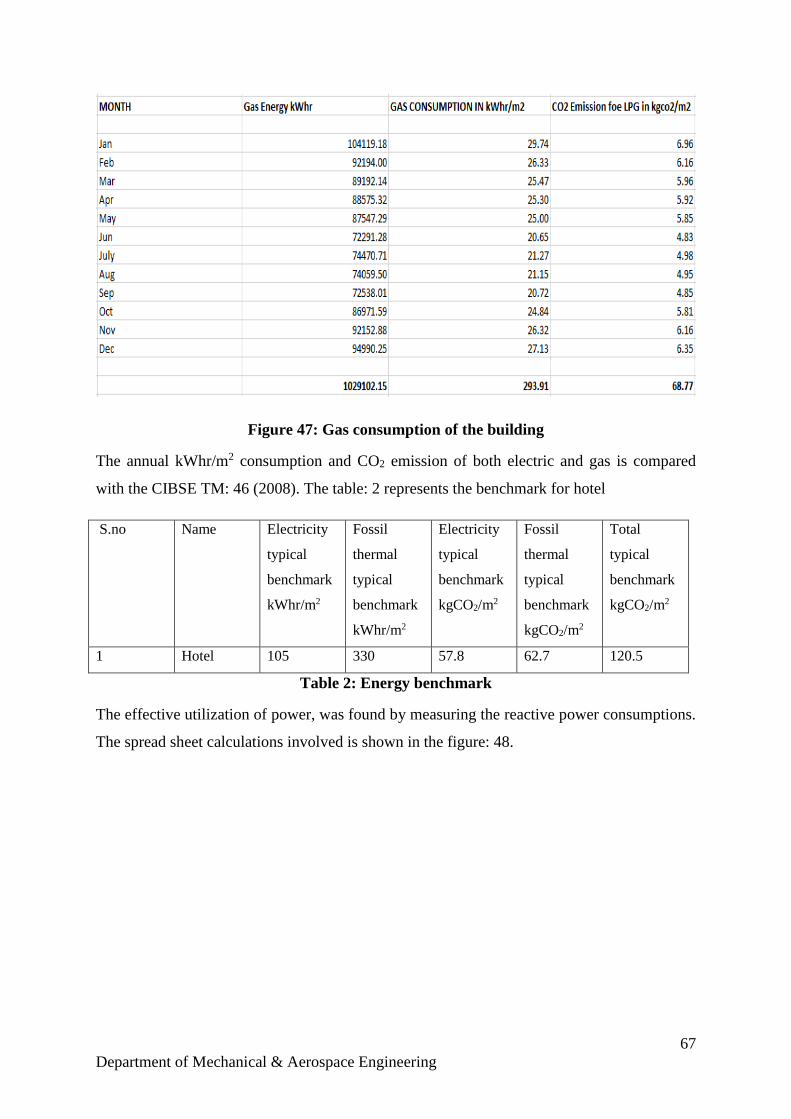
67
Department of Mechanical & Aerospace Engineering
Figure 47: Gas consumption of the building
The annual kWhr/m2 consumption and CO2 emission of both electric and gas is compared
with the CIBSE TM: 46 (2008). The table: 2 represents the benchmark for hotel
S.no Name Electricity
typical
benchmark
kWhr/m2
Fossil
thermal
typical
benchmark
kWhr/m2
Electricity
typical
benchmark
kgCO2/m2
Fossil
thermal
typical
benchmark
kgCO2/m2
Total
typical
benchmark
kgCO2/m2
1 Hotel 105 330 57.8 62.7 120.5
Table 2: Energy benchmark
The effective utilization of power, was found by measuring the reactive power consumptions.
The spread sheet calculations involved is shown in the figure: 48.
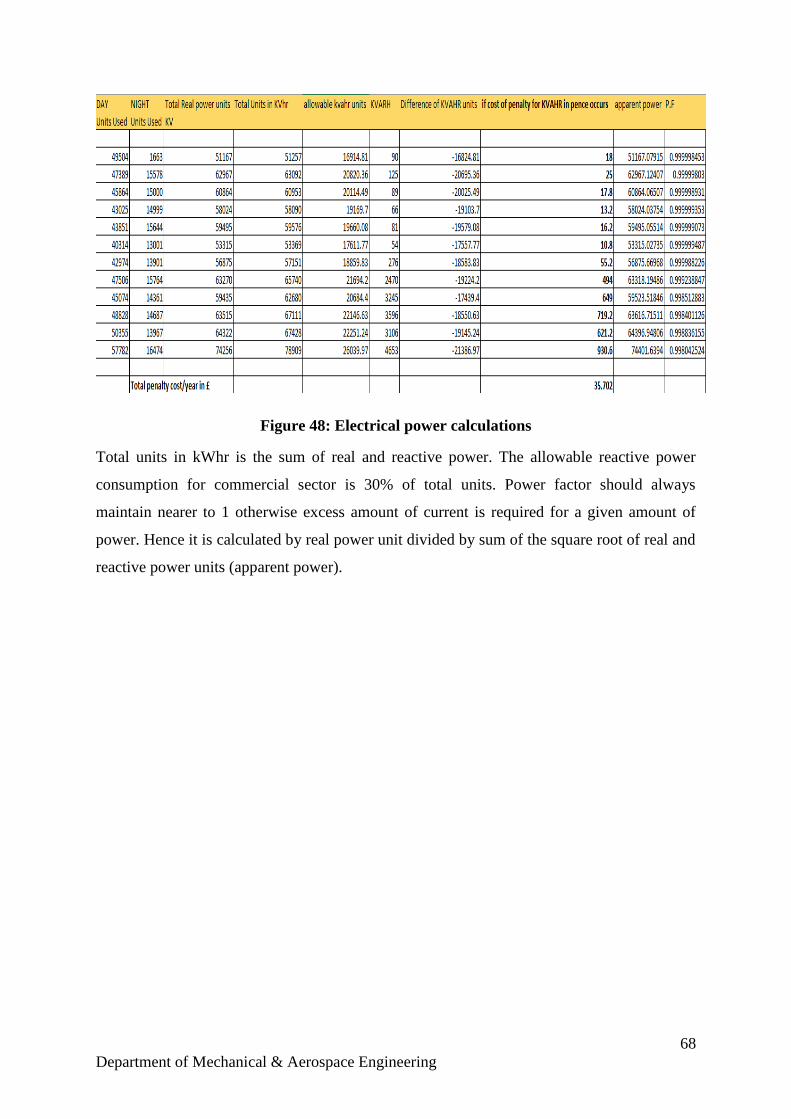
68
Department of Mechanical & Aerospace Engineering
Figure 48: Electrical power calculations
Total units in kWhr is the sum of real and reactive power. The allowable reactive power
consumption for commercial sector is 30% of total units. Power factor should always
maintain nearer to 1 otherwise excess amount of current is required for a given amount of
power. Hence it is calculated by real power unit divided by sum of the square root of real and
reactive power units (apparent power).
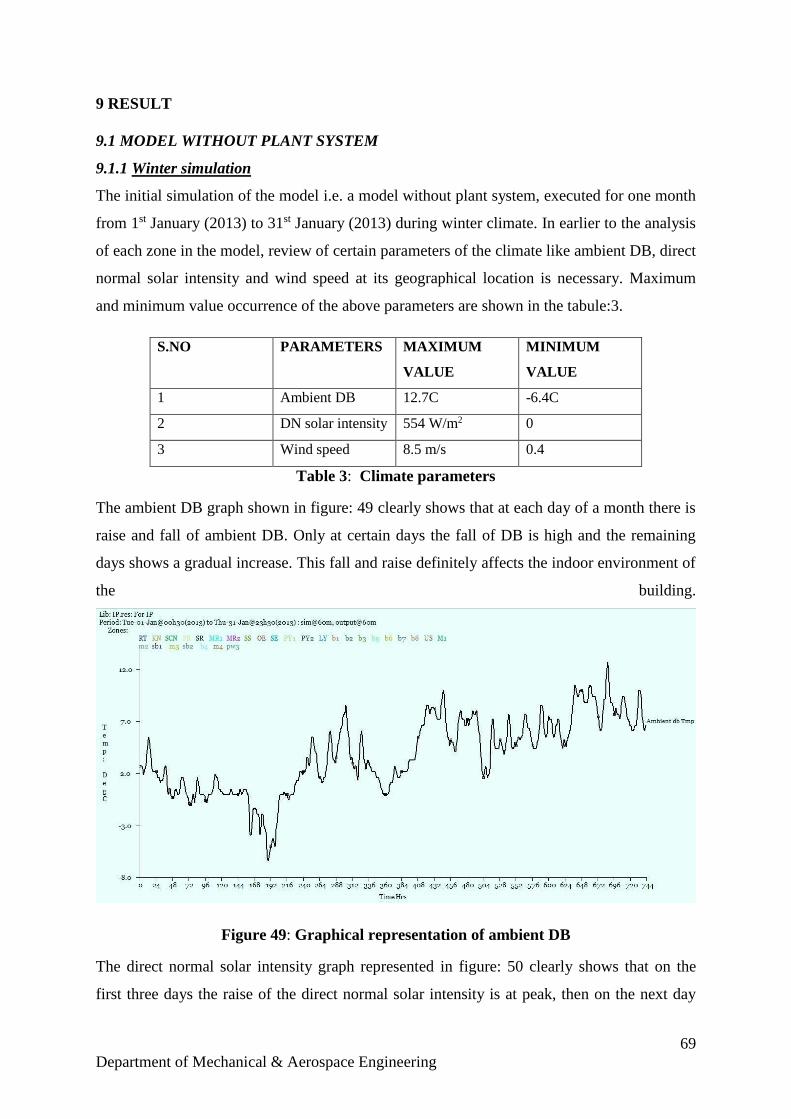
69
Department of Mechanical & Aerospace Engineering
9 RESULT
9.1 MODEL WITHOUT PLANT SYSTEM
9.1.1 Winter simulation
The initial simulation of the model i.e. a model without plant system, executed for one month
from 1st January (2013) to 31st January (2013) during winter climate. In earlier to the analysis
of each zone in the model, review of certain parameters of the climate like ambient DB, direct
normal solar intensity and wind speed at its geographical location is necessary. Maximum
and minimum value occurrence of the above parameters are shown in the tabule:3.
S.NO PARAMETERS MAXIMUM
VALUE
MINIMUM
VALUE
1 Ambient DB 12.7C -6.4C
2 DN solar intensity 554 W/m2 0
3 Wind speed 8.5 m/s 0.4
Table 3: Climate parameters
The ambient DB graph shown in figure: 49 clearly shows that at each day of a month there is
raise and fall of ambient DB. Only at certain days the fall of DB is high and the remaining
days shows a gradual increase. This fall and raise definitely affects the indoor environment of
the building.
Figure 49: Graphical representation of ambient DB
The direct normal solar intensity graph represented in figure: 50 clearly shows that on the
first three days the raise of the direct normal solar intensity is at peak, then on the next day
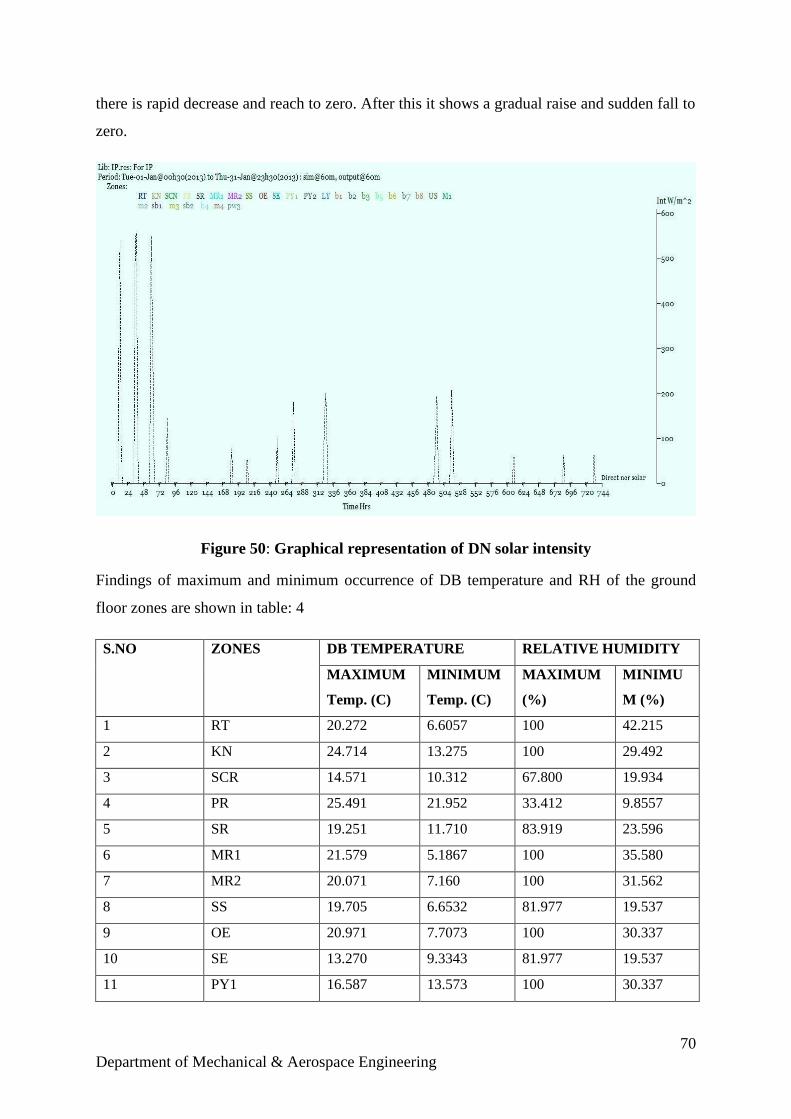
70
Department of Mechanical & Aerospace Engineering
there is rapid decrease and reach to zero. After this it shows a gradual raise and sudden fall to
zero.
Figure 50: Graphical representation of DN solar intensity
Findings of maximum and minimum occurrence of DB temperature and RH of the ground
floor zones are shown in table: 4
S.NO ZONES DB TEMPERATURE RELATIVE HUMIDITY
MAXIMUM
Temp. (C)
MINIMUM
Temp. (C)
MAXIMUM
(%)
MINIMU
M (%)
1 RT 20.272 6.6057 100 42.215
2 KN 24.714 13.275 100 29.492
3 SCR 14.571 10.312 67.800 19.934
4 PR 25.491 21.952 33.412 9.8557
5 SR 19.251 11.710 83.919 23.596
6 MR1 21.579 5.1867 100 35.580
7 MR2 20.071 7.160 100 31.562
8 SS 19.705 6.6532 81.977 19.537
9 OE 20.971 7.7073 100 30.337
10 SE 13.270 9.3343 81.977 19.537
11 PY1 16.587 13.573 100 30.337
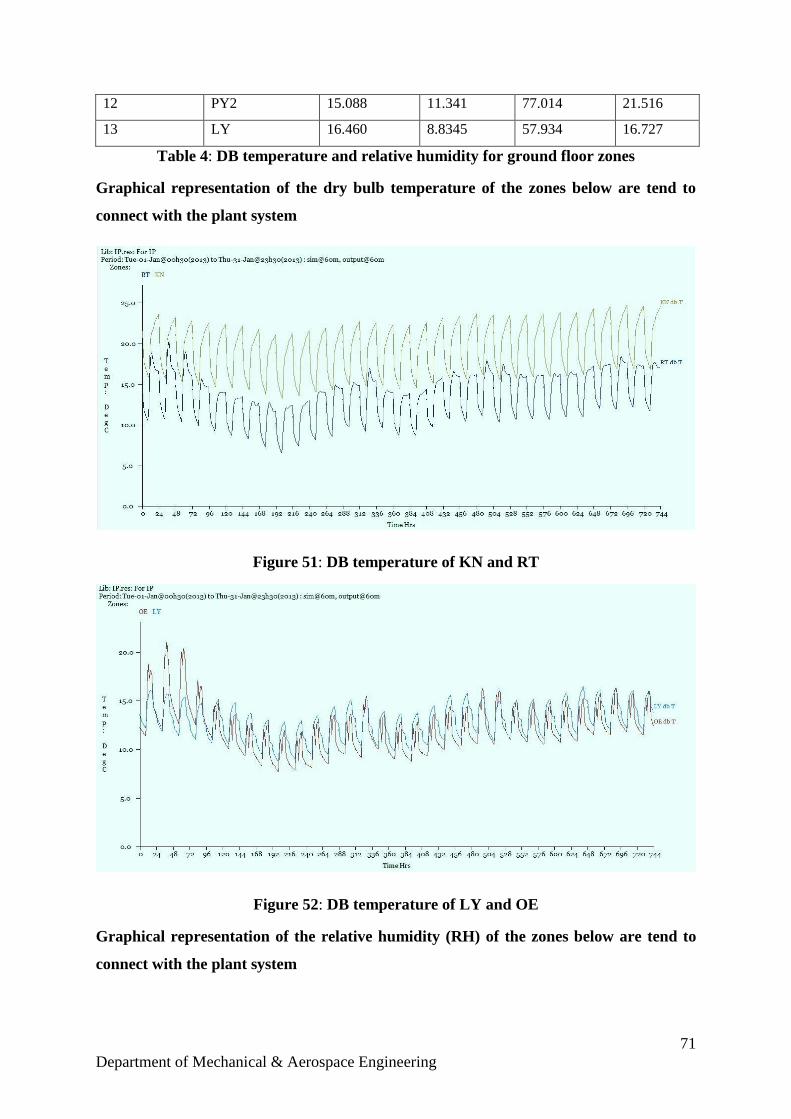
71
Department of Mechanical & Aerospace Engineering
12 PY2 15.088 11.341 77.014 21.516
13 LY 16.460 8.8345 57.934 16.727
Table 4: DB temperature and relative humidity for ground floor zones
Graphical representation of the dry bulb temperature of the zones below are tend to
connect with the plant system
Figure 51: DB temperature of KN and RT
Figure 52: DB temperature of LY and OE
Graphical representation of the relative humidity (RH) of the zones below are tend to
connect with the plant system
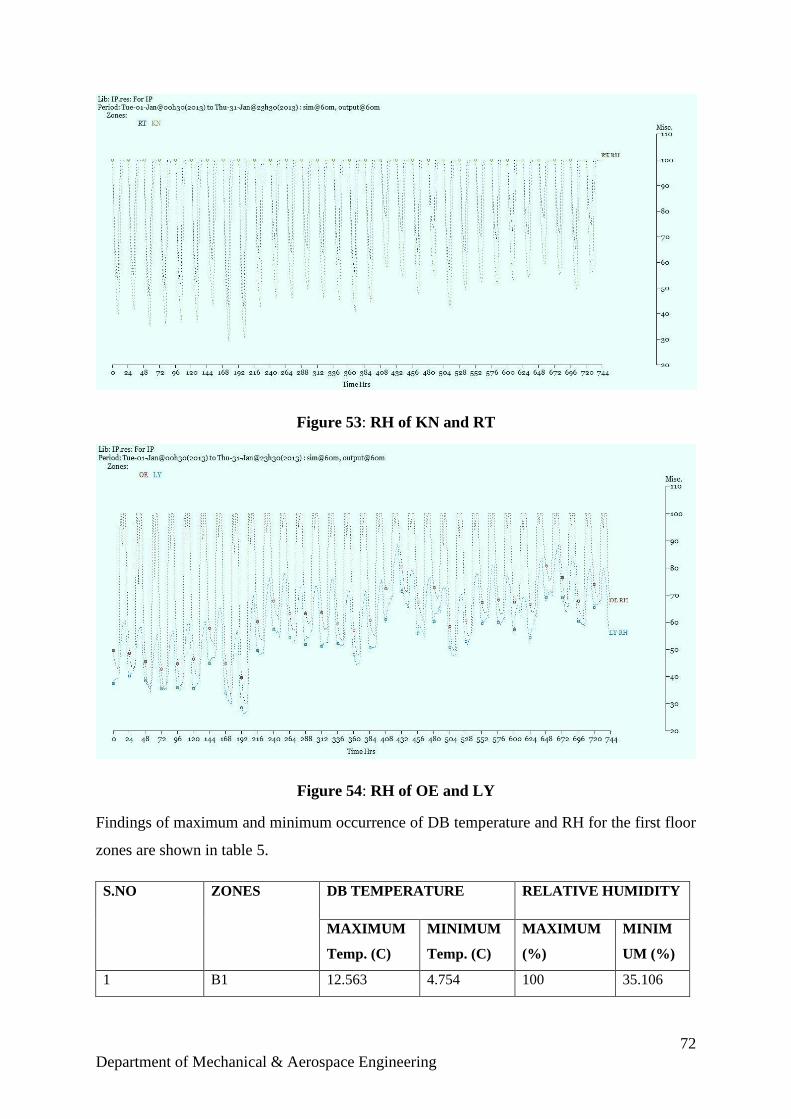
72
Department of Mechanical & Aerospace Engineering
Figure 53: RH of KN and RT
Figure 54: RH of OE and LY
Findings of maximum and minimum occurrence of DB temperature and RH for the first floor
zones are shown in table 5.
S.NO ZONES DB TEMPERATURE RELATIVE HUMIDITY
MAXIMUM
Temp. (C)
MINIMUM
Temp. (C)
MAXIMUM
(%)
MINIM
UM (%)
1 B1 12.563 4.754 100 35.106
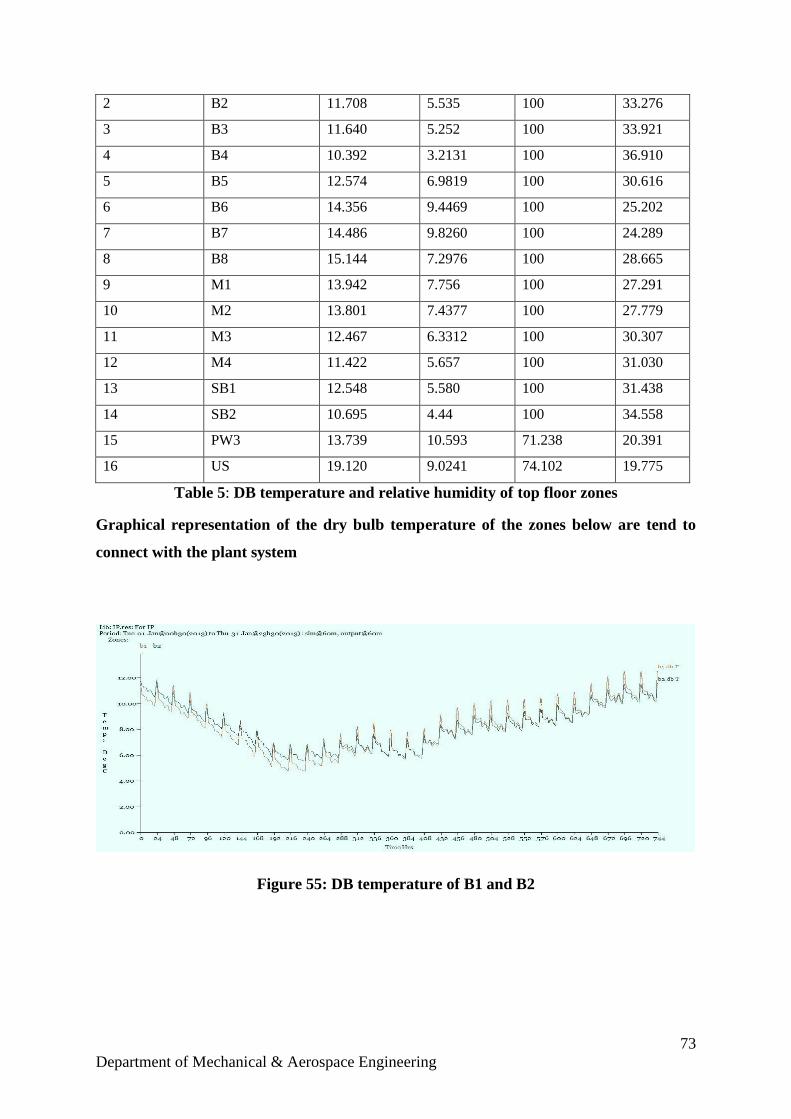
73
Department of Mechanical & Aerospace Engineering
2 B2 11.708 5.535 100 33.276
3 B3 11.640 5.252 100 33.921
4 B4 10.392 3.2131 100 36.910
5 B5 12.574 6.9819 100 30.616
6 B6 14.356 9.4469 100 25.202
7 B7 14.486 9.8260 100 24.289
8 B8 15.144 7.2976 100 28.665
9 M1 13.942 7.756 100 27.291
10 M2 13.801 7.4377 100 27.779
11 M3 12.467 6.3312 100 30.307
12 M4 11.422 5.657 100 31.030
13 SB1 12.548 5.580 100 31.438
14 SB2 10.695 4.44 100 34.558
15 PW3 13.739 10.593 71.238 20.391
16 US 19.120 9.0241 74.102 19.775
Table 5: DB temperature and relative humidity of top floor zones
Graphical representation of the dry bulb temperature of the zones below are tend to
connect with the plant system
Figure 55: DB temperature of B1 and B2
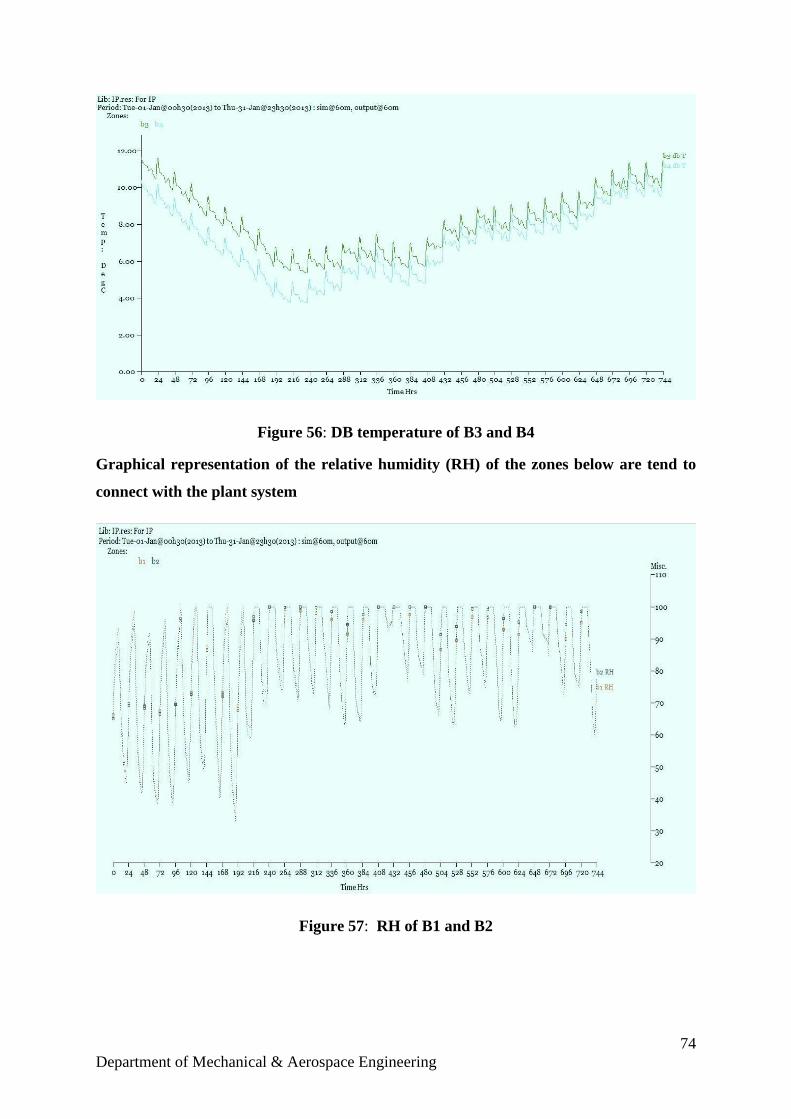
74
Department of Mechanical & Aerospace Engineering
Figure 56: DB temperature of B3 and B4
Graphical representation of the relative humidity (RH) of the zones below are tend to
connect with the plant system
Figure 57: RH of B1 and B2
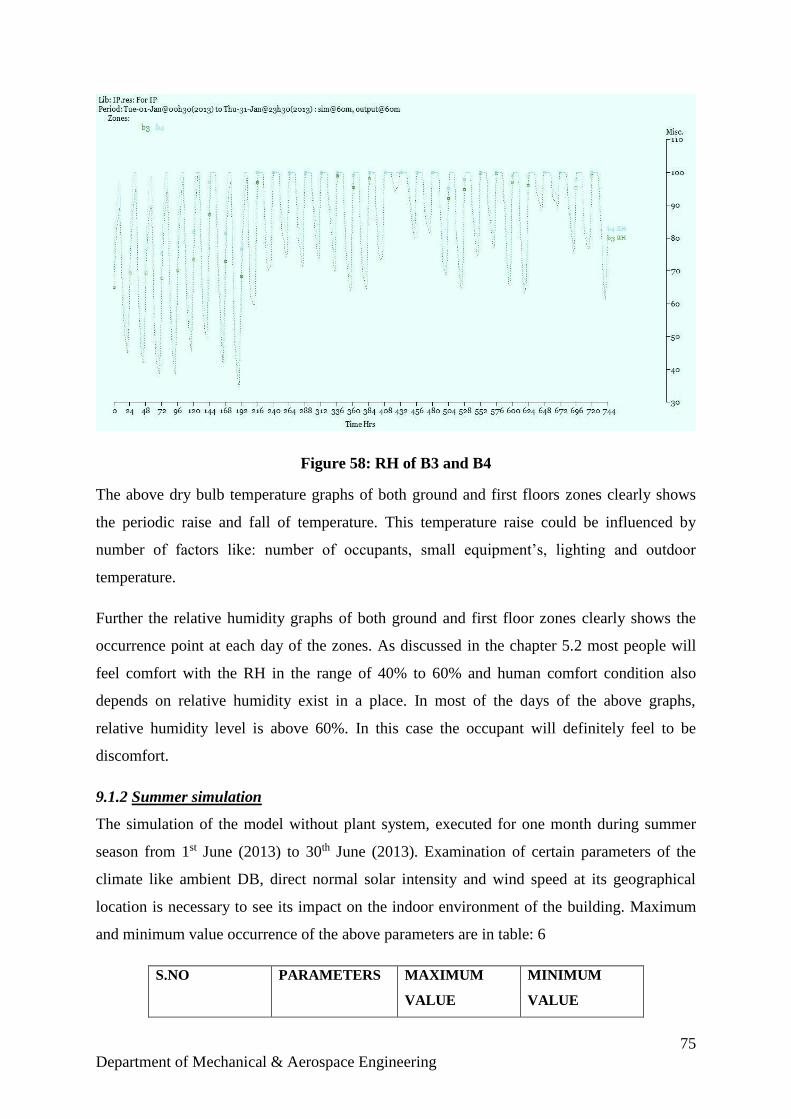
75
Department of Mechanical & Aerospace Engineering
Figure 58: RH of B3 and B4
The above dry bulb temperature graphs of both ground and first floors zones clearly shows
the periodic raise and fall of temperature. This temperature raise could be influenced by
number of factors like: number of occupants, small equipment’s, lighting and outdoor
temperature.
Further the relative humidity graphs of both ground and first floor zones clearly shows the
occurrence point at each day of the zones. As discussed in the chapter 5.2 most people will
feel comfort with the RH in the range of 40% to 60% and human comfort condition also
depends on relative humidity exist in a place. In most of the days of the above graphs,
relative humidity level is above 60%. In this case the occupant will definitely feel to be
discomfort.
9.1.2 Summer simulation
The simulation of the model without plant system, executed for one month during summer
season from 1st June (2013) to 30th June (2013). Examination of certain parameters of the
climate like ambient DB, direct normal solar intensity and wind speed at its geographical
location is necessary to see its impact on the indoor environment of the building. Maximum
and minimum value occurrence of the above parameters are in table: 6
S.NO PARAMETERS MAXIMUM
VALUE
MINIMUM
VALUE
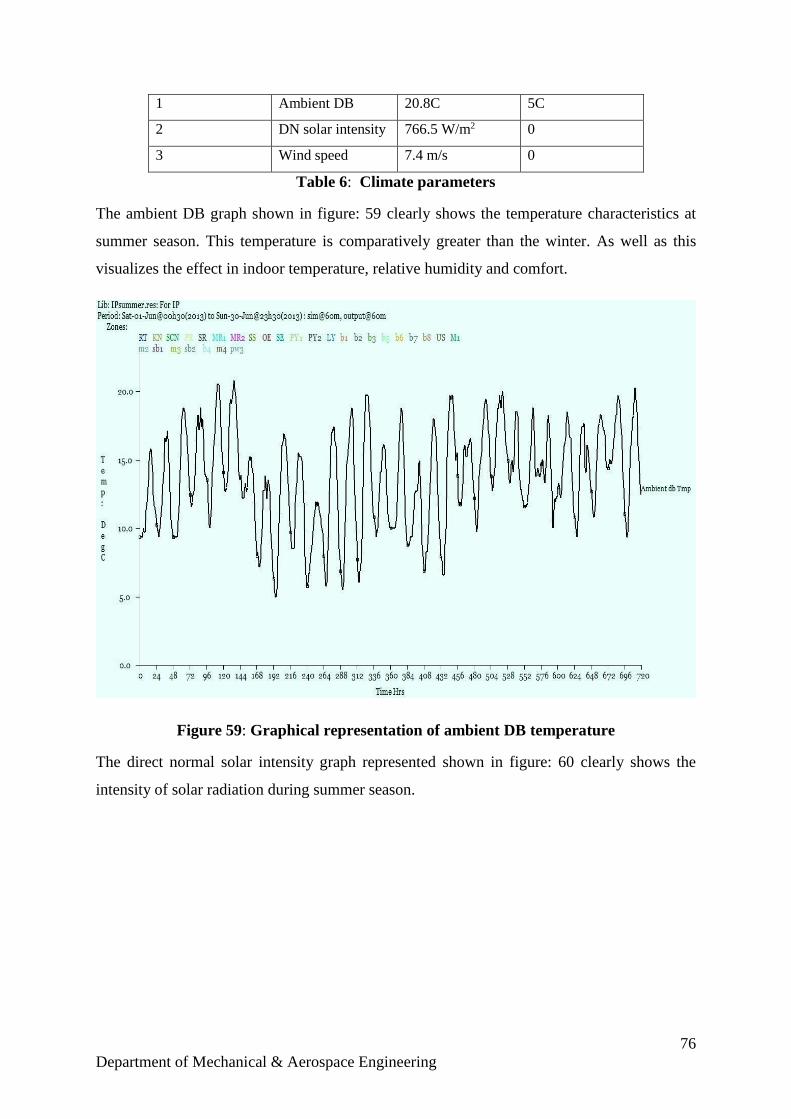
76
Department of Mechanical & Aerospace Engineering
1 Ambient DB 20.8C 5C
2 DN solar intensity 766.5 W/m2 0
3 Wind speed 7.4 m/s 0
Table 6: Climate parameters
The ambient DB graph shown in figure: 59 clearly shows the temperature characteristics at
summer season. This temperature is comparatively greater than the winter. As well as this
visualizes the effect in indoor temperature, relative humidity and comfort.
Figure 59: Graphical representation of ambient DB temperature
The direct normal solar intensity graph represented shown in figure: 60 clearly shows the
intensity of solar radiation during summer season.
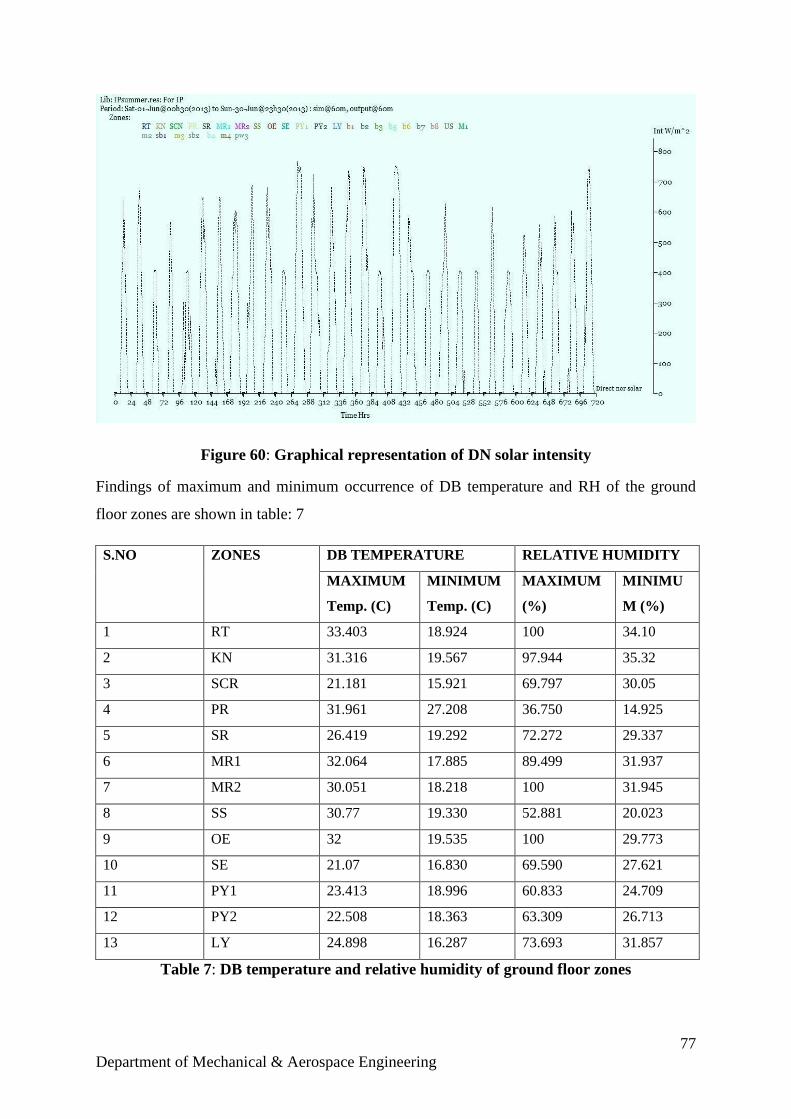
77
Department of Mechanical & Aerospace Engineering
Figure 60: Graphical representation of DN solar intensity
Findings of maximum and minimum occurrence of DB temperature and RH of the ground
floor zones are shown in table: 7
S.NO ZONES DB TEMPERATURE RELATIVE HUMIDITY
MAXIMUM
Temp. (C)
MINIMUM
Temp. (C)
MAXIMUM
(%)
MINIMU
M (%)
1 RT 33.403 18.924 100 34.10
2 KN 31.316 19.567 97.944 35.32
3 SCR 21.181 15.921 69.797 30.05
4 PR 31.961 27.208 36.750 14.925
5 SR 26.419 19.292 72.272 29.337
6 MR1 32.064 17.885 89.499 31.937
7 MR2 30.051 18.218 100 31.945
8 SS 30.77 19.330 52.881 20.023
9 OE 32 19.535 100 29.773
10 SE 21.07 16.830 69.590 27.621
11 PY1 23.413 18.996 60.833 24.709
12 PY2 22.508 18.363 63.309 26.713
13 LY 24.898 16.287 73.693 31.857
Table 7: DB temperature and relative humidity of ground floor zones
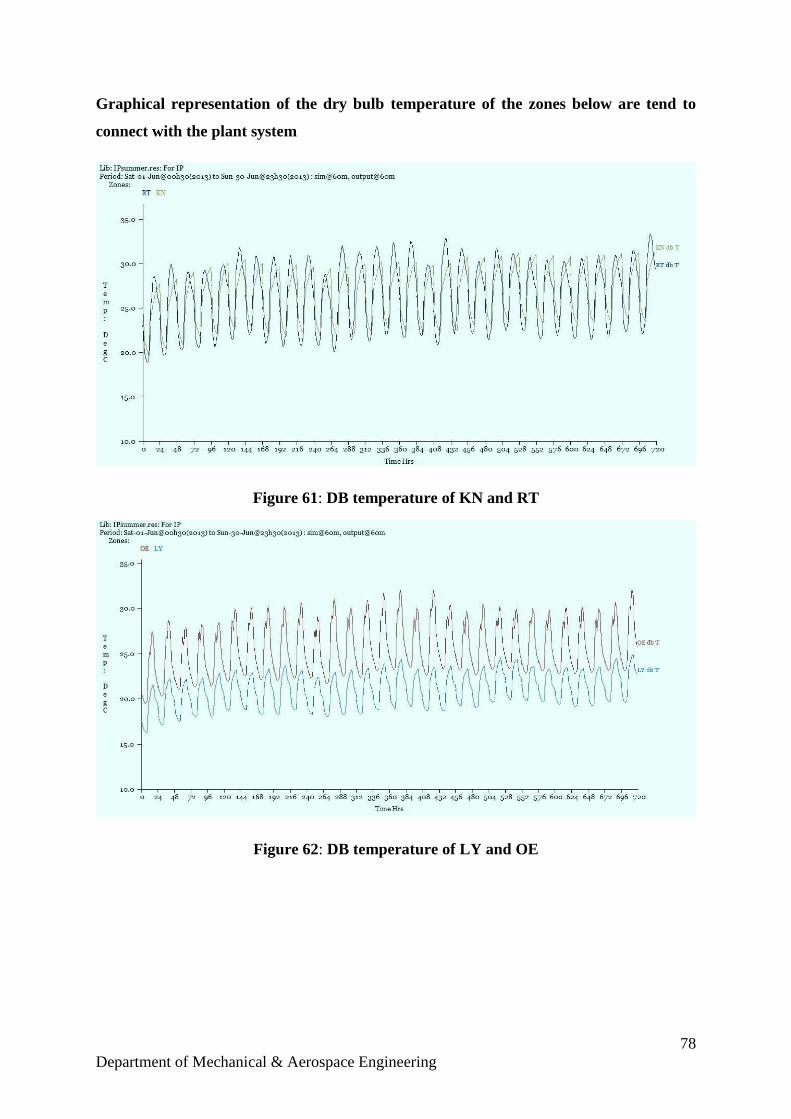
78
Department of Mechanical & Aerospace Engineering
Graphical representation of the dry bulb temperature of the zones below are tend to
connect with the plant system
Figure 61: DB temperature of KN and RT
Figure 62: DB temperature of LY and OE
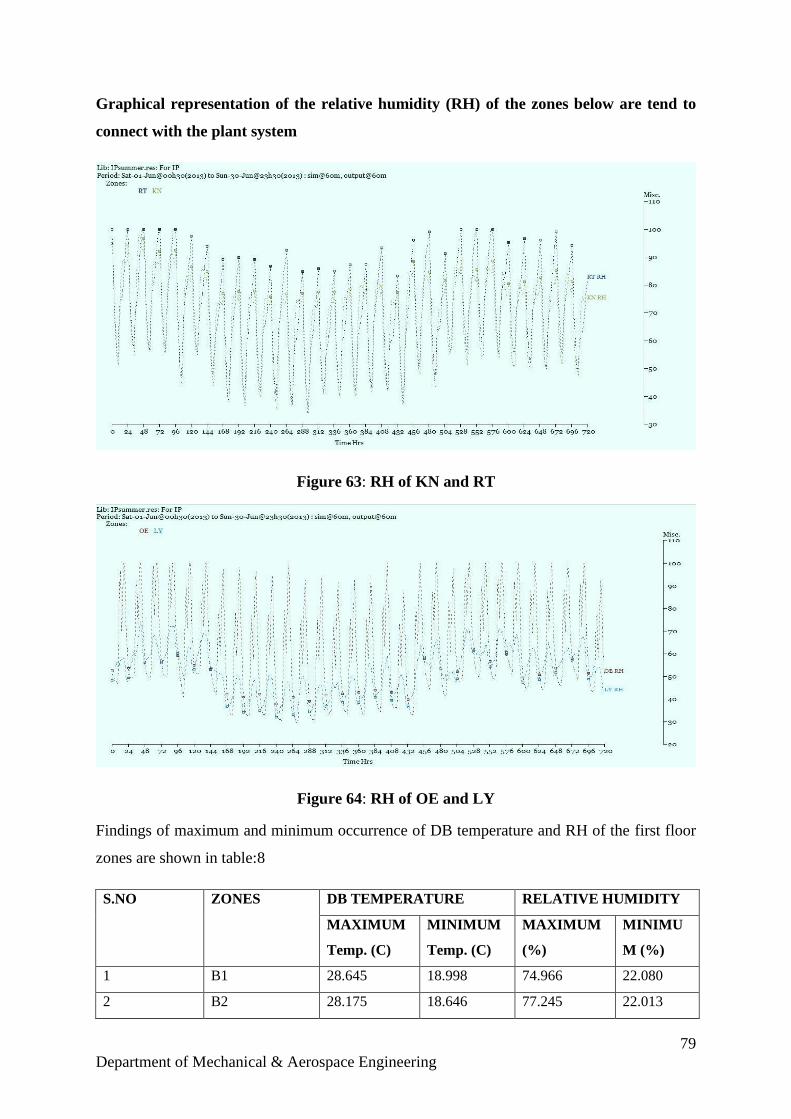
79
Department of Mechanical & Aerospace Engineering
Graphical representation of the relative humidity (RH) of the zones below are tend to
connect with the plant system
Figure 63: RH of KN and RT
Figure 64: RH of OE and LY
Findings of maximum and minimum occurrence of DB temperature and RH of the first floor
zones are shown in table:8
S.NO ZONES DB TEMPERATURE RELATIVE HUMIDITY
MAXIMUM
Temp. (C)
MINIMUM
Temp. (C)
MAXIMUM
(%)
MINIMU
M (%)
1 B1 28.645 18.998 74.966 22.080
2 B2 28.175 18.646 77.245 22.013
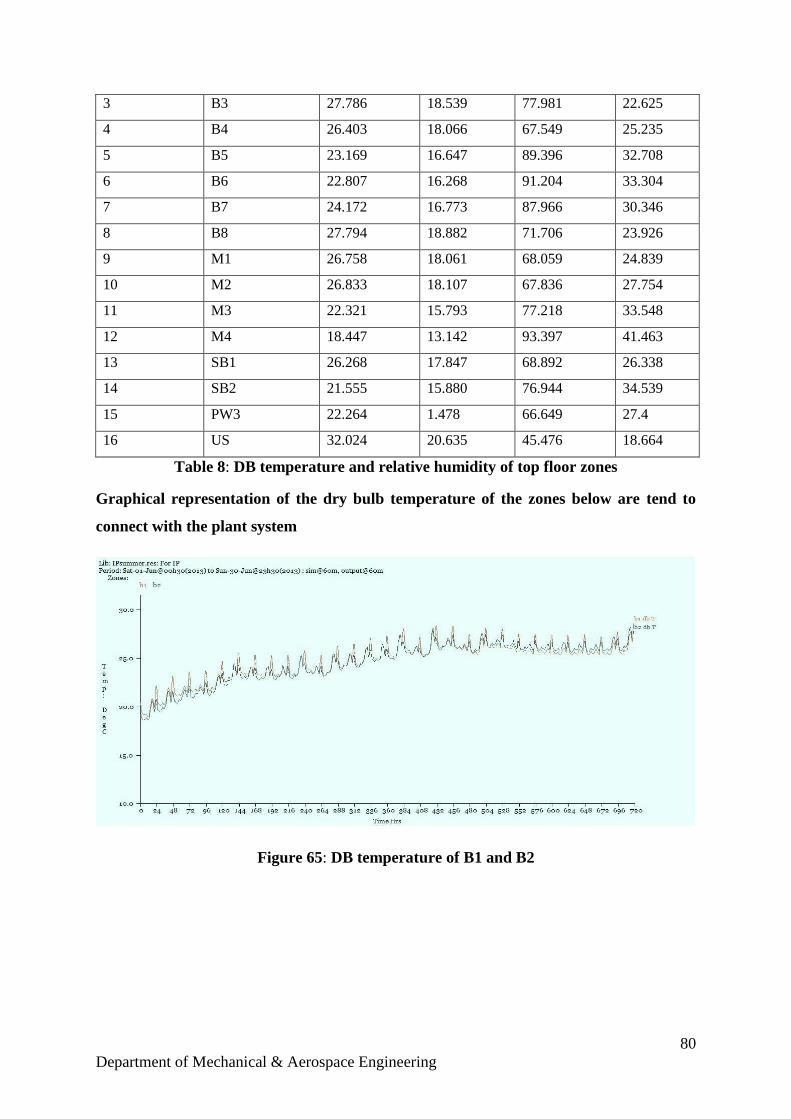
80
Department of Mechanical & Aerospace Engineering
3 B3 27.786 18.539 77.981 22.625
4 B4 26.403 18.066 67.549 25.235
5 B5 23.169 16.647 89.396 32.708
6 B6 22.807 16.268 91.204 33.304
7 B7 24.172 16.773 87.966 30.346
8 B8 27.794 18.882 71.706 23.926
9 M1 26.758 18.061 68.059 24.839
10 M2 26.833 18.107 67.836 27.754
11 M3 22.321 15.793 77.218 33.548
12 M4 18.447 13.142 93.397 41.463
13 SB1 26.268 17.847 68.892 26.338
14 SB2 21.555 15.880 76.944 34.539
15 PW3 22.264 1.478 66.649 27.4
16 US 32.024 20.635 45.476 18.664
Table 8: DB temperature and relative humidity of top floor zones
Graphical representation of the dry bulb temperature of the zones below are tend to
connect with the plant system
Figure 65: DB temperature of B1 and B2
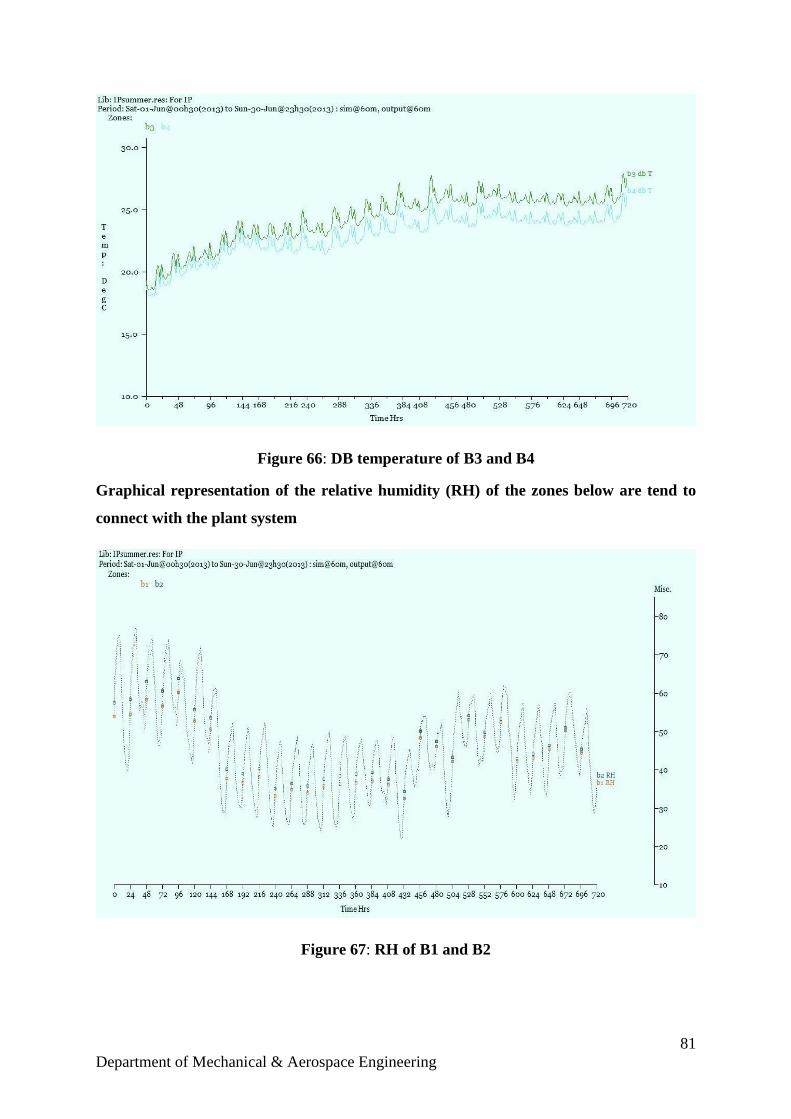
81
Department of Mechanical & Aerospace Engineering
Figure 66: DB temperature of B3 and B4
Graphical representation of the relative humidity (RH) of the zones below are tend to
connect with the plant system
Figure 67: RH of B1 and B2
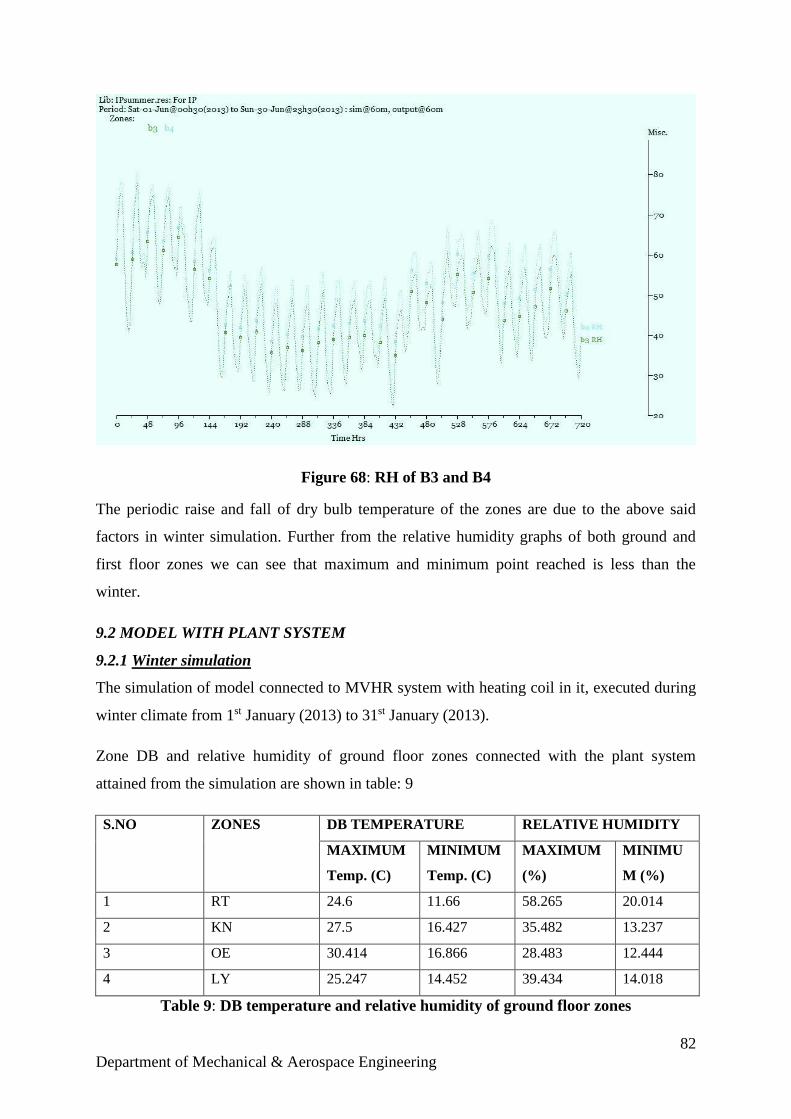
82
Department of Mechanical & Aerospace Engineering
Figure 68: RH of B3 and B4
The periodic raise and fall of dry bulb temperature of the zones are due to the above said
factors in winter simulation. Further from the relative humidity graphs of both ground and
first floor zones we can see that maximum and minimum point reached is less than the
winter.
9.2 MODEL WITH PLANT SYSTEM
9.2.1 Winter simulation
The simulation of model connected to MVHR system with heating coil in it, executed during
winter climate from 1st January (2013) to 31st January (2013).
Zone DB and relative humidity of ground floor zones connected with the plant system
attained from the simulation are shown in table: 9
S.NO ZONES DB TEMPERATURE RELATIVE HUMIDITY
MAXIMUM
Temp. (C)
MINIMUM
Temp. (C)
MAXIMUM
(%)
MINIMU
M (%)
1 RT 24.6 11.66 58.265 20.014
2 KN 27.5 16.427 35.482 13.237
3 OE 30.414 16.866 28.483 12.444
4 LY 25.247 14.452 39.434 14.018
Table 9: DB temperature and relative humidity of ground floor zones
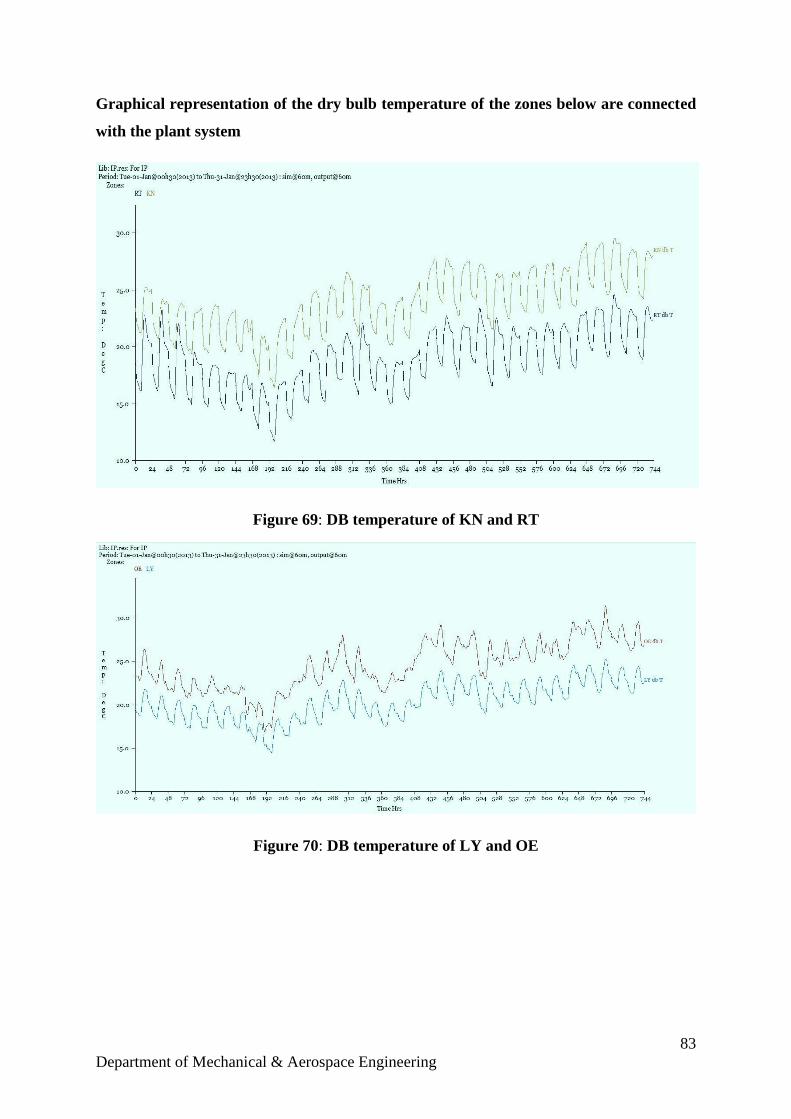
83
Department of Mechanical & Aerospace Engineering
Graphical representation of the dry bulb temperature of the zones below are connected
with the plant system
Figure 69: DB temperature of KN and RT
Figure 70: DB temperature of LY and OE
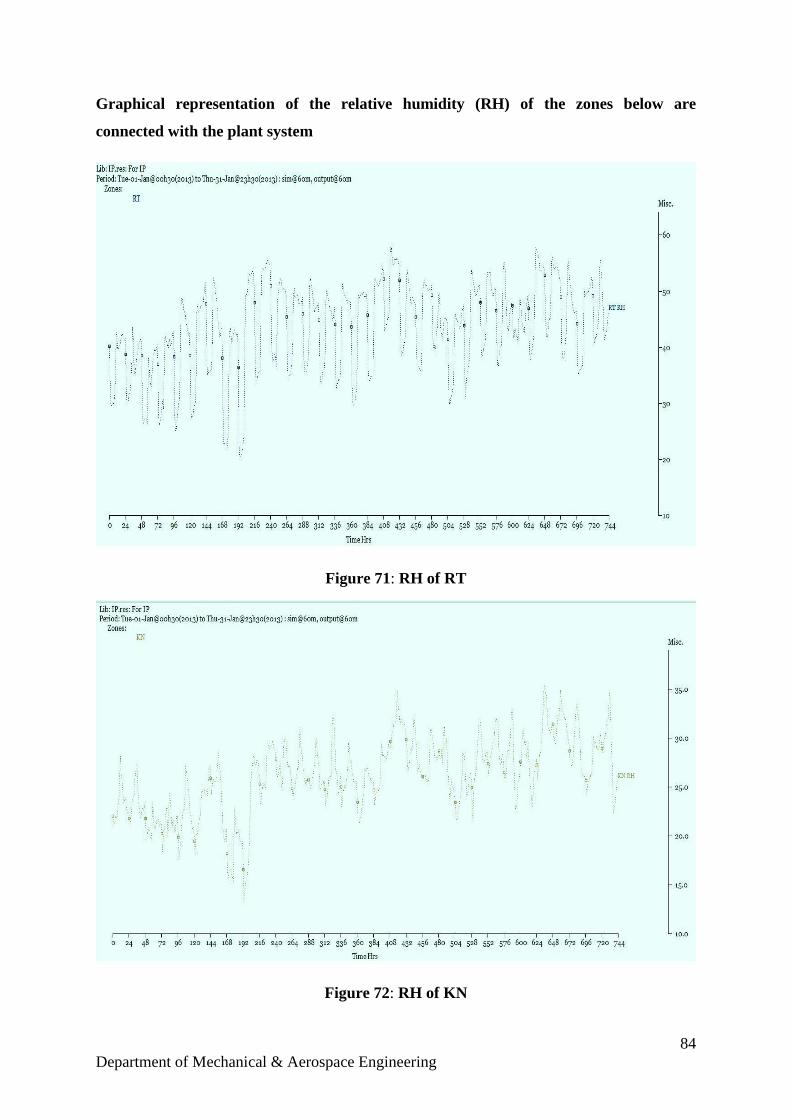
84
Department of Mechanical & Aerospace Engineering
Graphical representation of the relative humidity (RH) of the zones below are
connected with the plant system
Figure 71: RH of RT
Figure 72: RH of KN
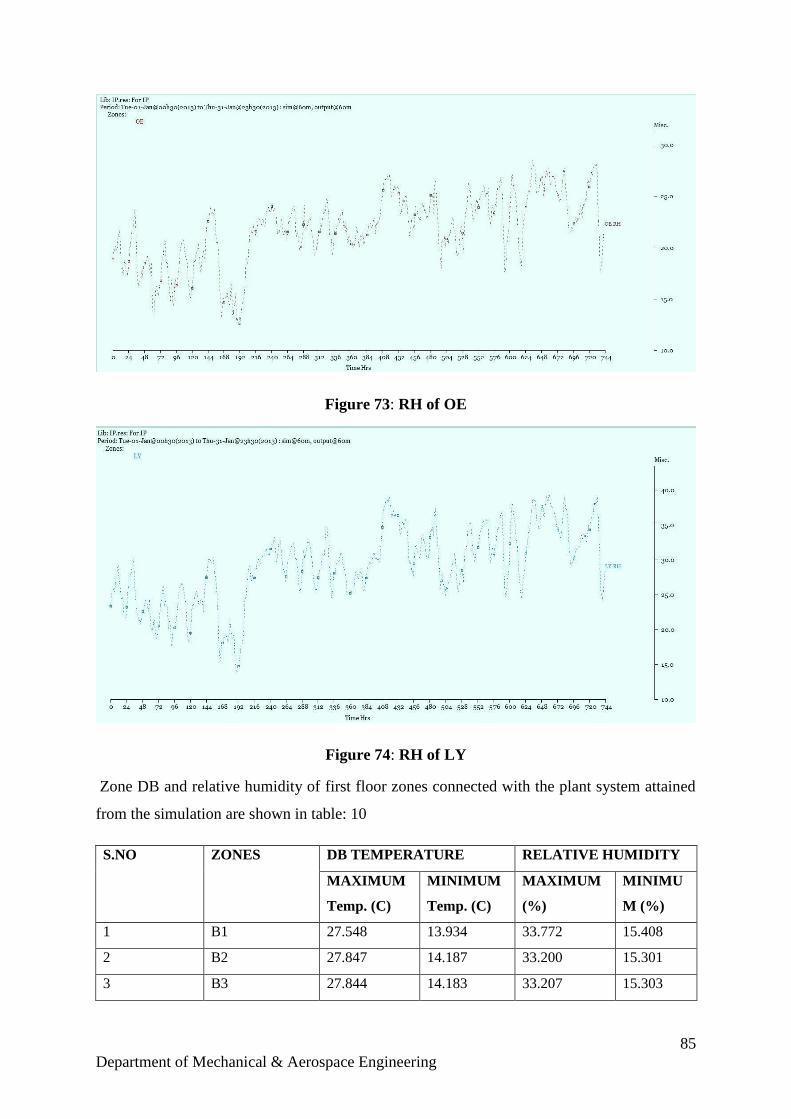
85
Department of Mechanical & Aerospace Engineering
Figure 73: RH of OE
Figure 74: RH of LY
Zone DB and relative humidity of first floor zones connected with the plant system attained
from the simulation are shown in table: 10
S.NO ZONES DB TEMPERATURE RELATIVE HUMIDITY
MAXIMUM
Temp. (C)
MINIMUM
Temp. (C)
MAXIMUM
(%)
MINIMU
M (%)
1 B1 27.548 13.934 33.772 15.408
2 B2 27.847 14.187 33.200 15.301
3 B3 27.844 14.183 33.207 15.303
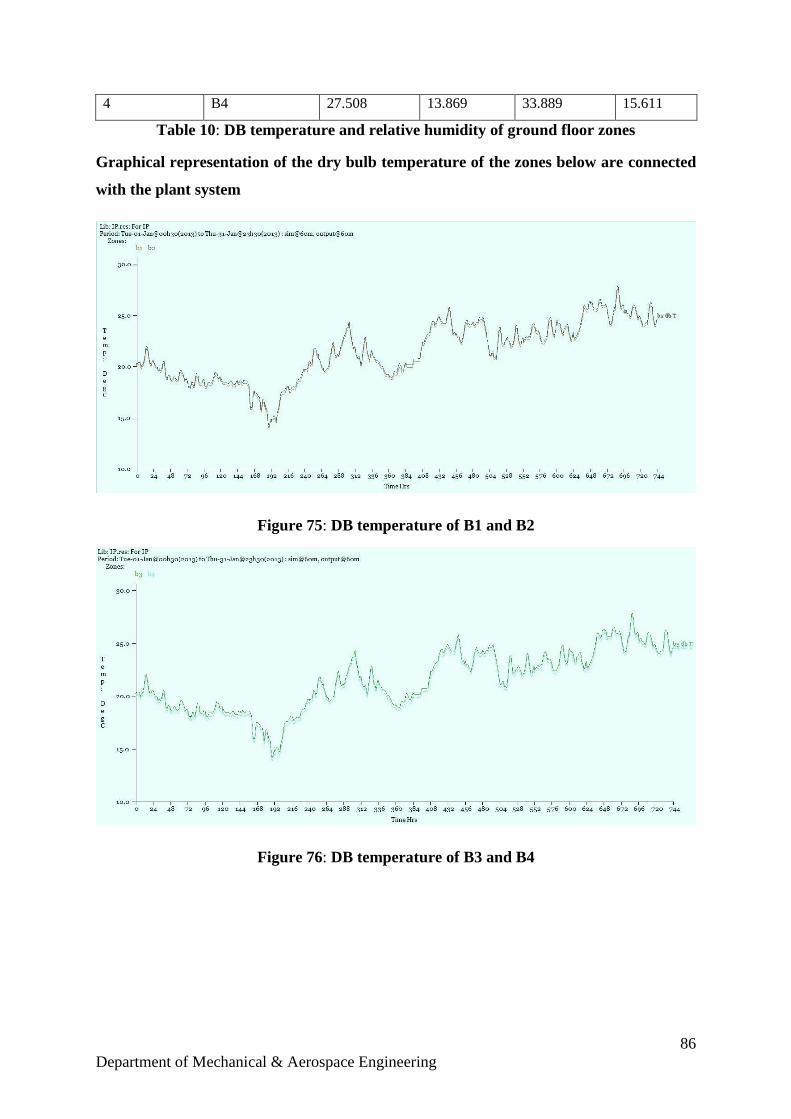
86
Department of Mechanical & Aerospace Engineering
4 B4 27.508 13.869 33.889 15.611
Table 10: DB temperature and relative humidity of ground floor zones
Graphical representation of the dry bulb temperature of the zones below are connected
with the plant system
Figure 75: DB temperature of B1 and B2
Figure 76: DB temperature of B3 and B4
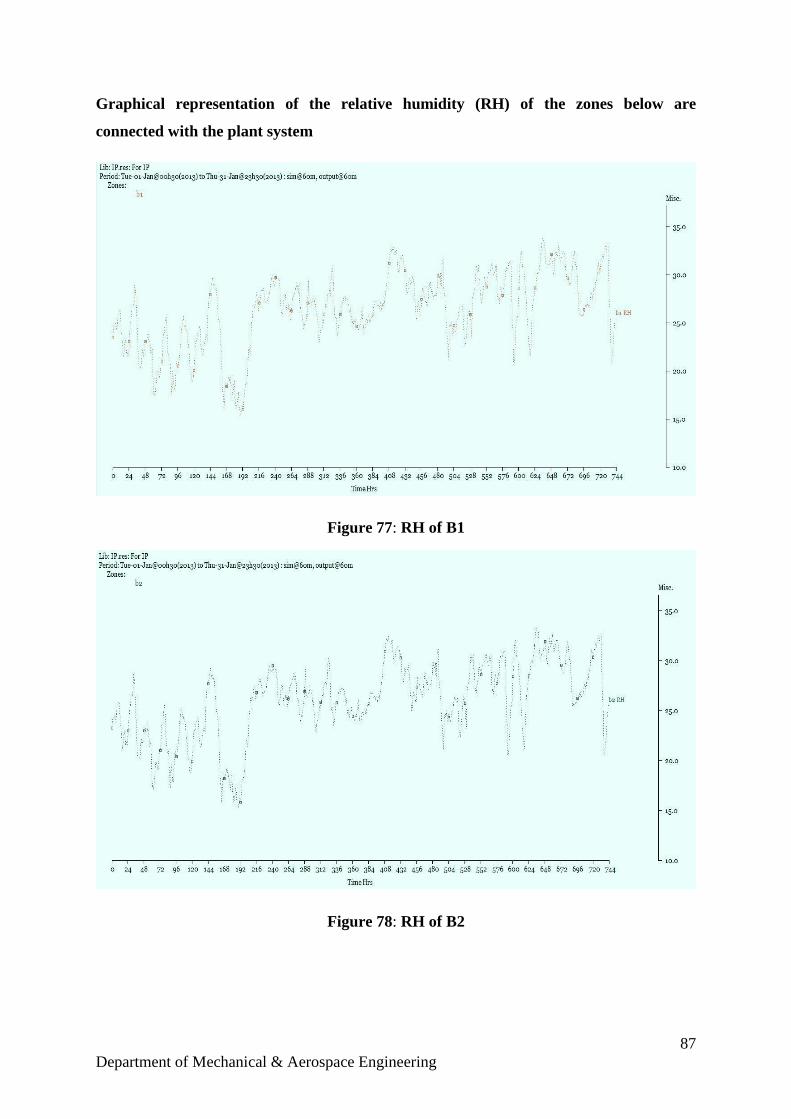
87
Department of Mechanical & Aerospace Engineering
Graphical representation of the relative humidity (RH) of the zones below are
connected with the plant system
Figure 77: RH of B1
Figure 78: RH of B2
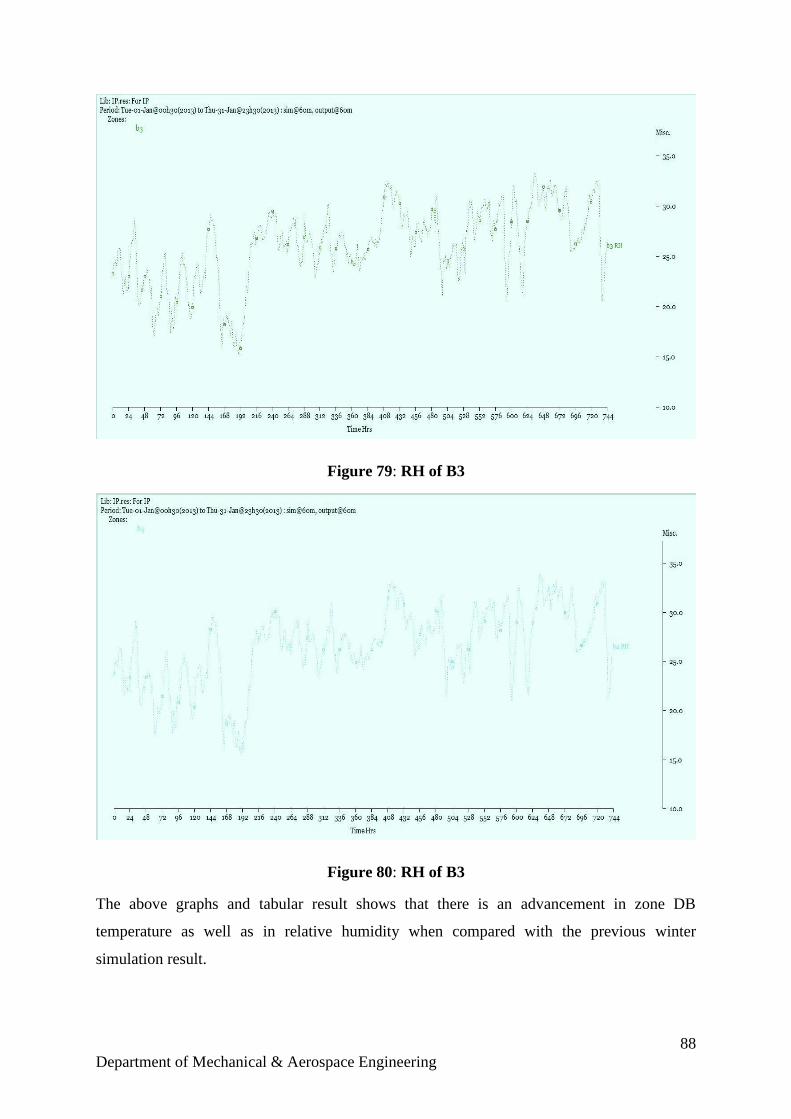
88
Department of Mechanical & Aerospace Engineering
Figure 79: RH of B3
Figure 80: RH of B3
The above graphs and tabular result shows that there is an advancement in zone DB
temperature as well as in relative humidity when compared with the previous winter
simulation result.
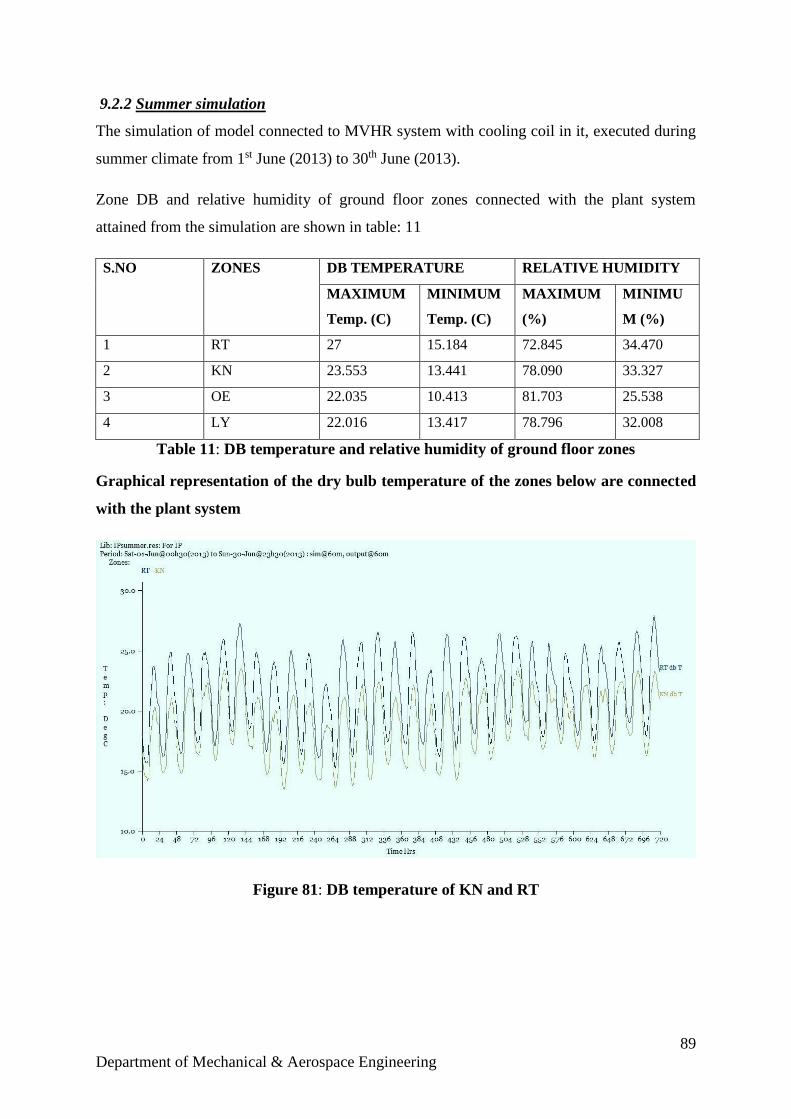
89
Department of Mechanical & Aerospace Engineering
9.2.2 Summer simulation
The simulation of model connected to MVHR system with cooling coil in it, executed during
summer climate from 1st June (2013) to 30th June (2013).
Zone DB and relative humidity of ground floor zones connected with the plant system
attained from the simulation are shown in table: 11
S.NO ZONES DB TEMPERATURE RELATIVE HUMIDITY
MAXIMUM
Temp. (C)
MINIMUM
Temp. (C)
MAXIMUM
(%)
MINIMU
M (%)
1 RT 27 15.184 72.845 34.470
2 KN 23.553 13.441 78.090 33.327
3 OE 22.035 10.413 81.703 25.538
4 LY 22.016 13.417 78.796 32.008
Table 11: DB temperature and relative humidity of ground floor zones
Graphical representation of the dry bulb temperature of the zones below are connected
with the plant system
Figure 81: DB temperature of KN and RT
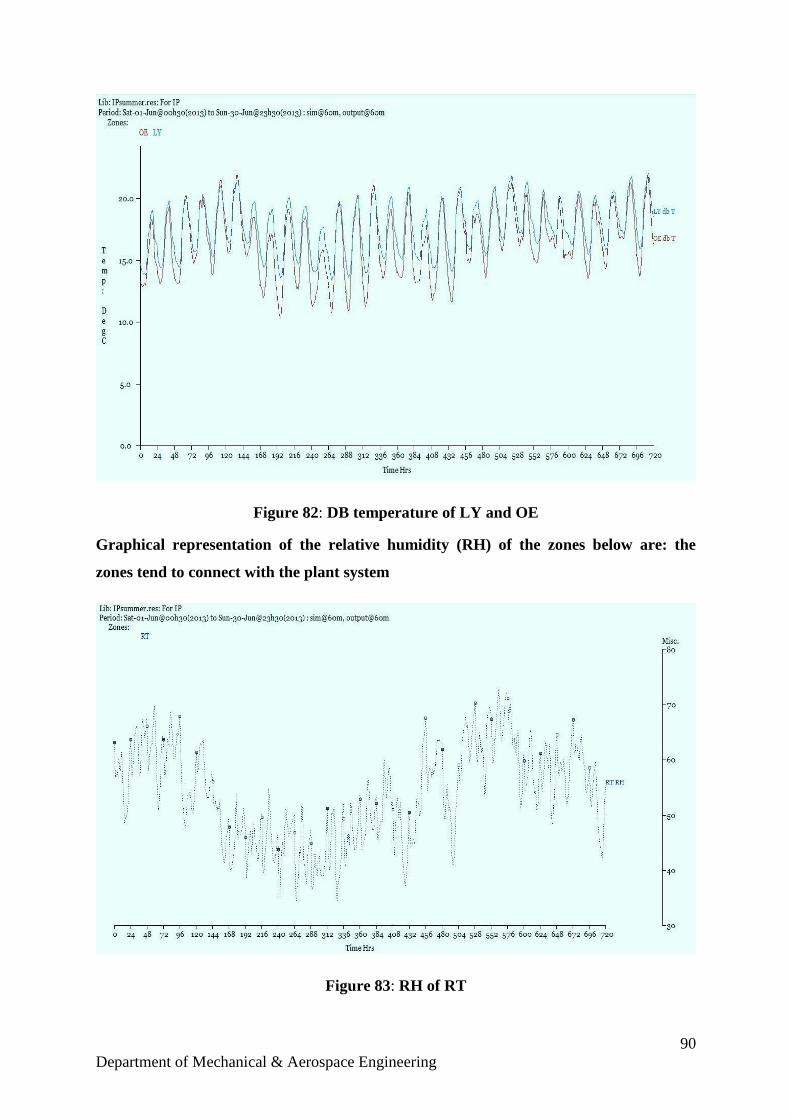
90
Department of Mechanical & Aerospace Engineering
Figure 82: DB temperature of LY and OE
Graphical representation of the relative humidity (RH) of the zones below are: the
zones tend to connect with the plant system
Figure 83: RH of RT
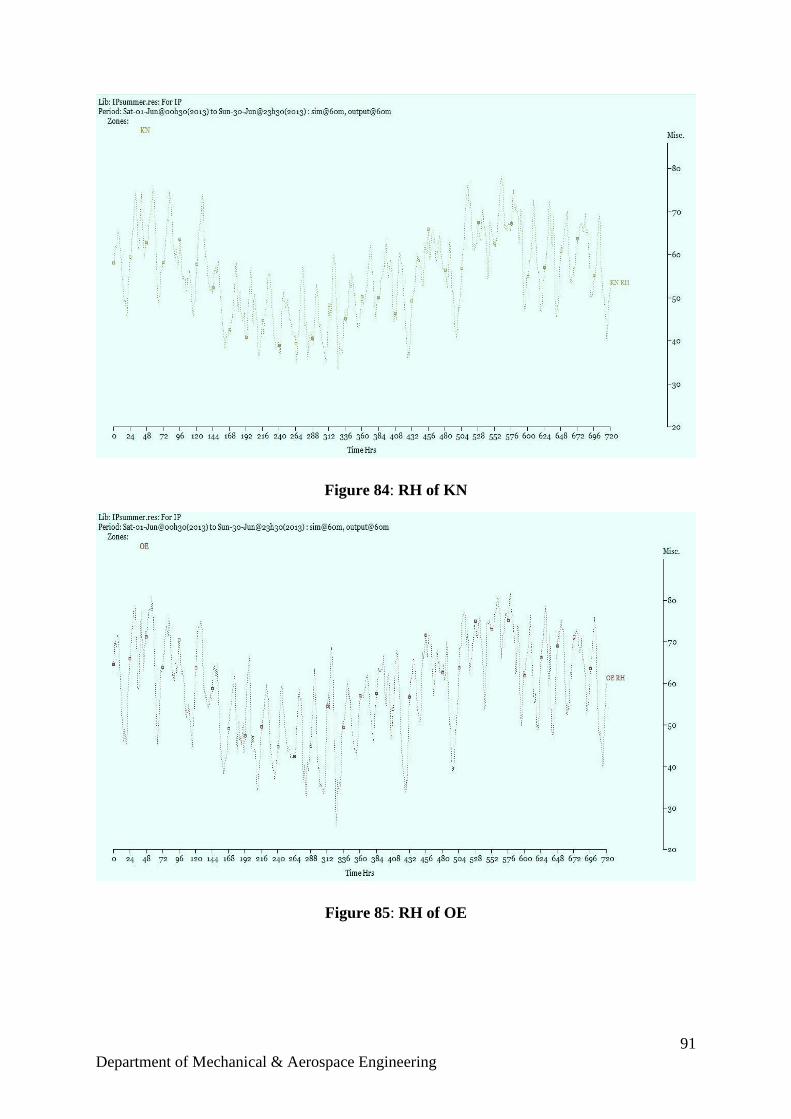
91
Department of Mechanical & Aerospace Engineering
Figure 84: RH of KN
Figure 85: RH of OE
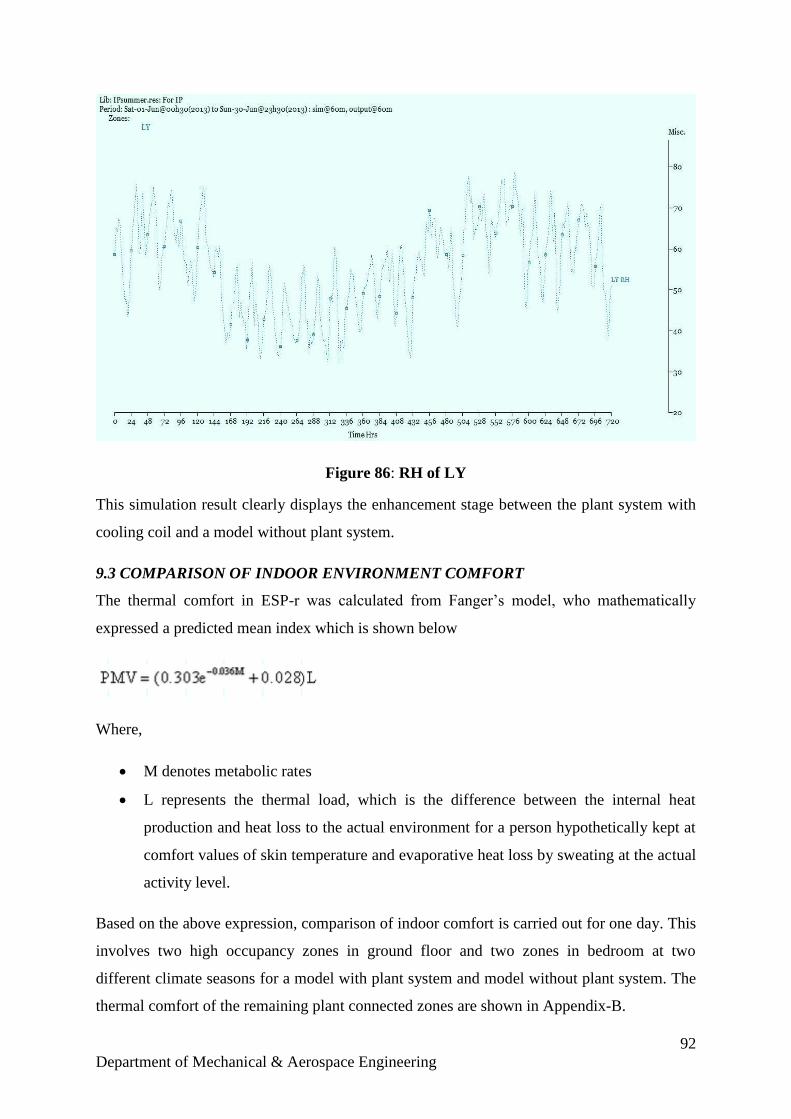
92
Department of Mechanical & Aerospace Engineering
Figure 86: RH of LY
This simulation result clearly displays the enhancement stage between the plant system with
cooling coil and a model without plant system.
9.3 COMPARISON OF INDOOR ENVIRONMENT COMFORT
The thermal comfort in ESP-r was calculated from Fanger’s model, who mathematically
expressed a predicted mean index which is shown below
Where,
M denotes metabolic rates
L represents the thermal load, which is the difference between the internal heat
production and heat loss to the actual environment for a person hypothetically kept at
comfort values of skin temperature and evaporative heat loss by sweating at the actual
activity level.
Based on the above expression, comparison of indoor comfort is carried out for one day. This
involves two high occupancy zones in ground floor and two zones in bedroom at two
different climate seasons for a model with plant system and model without plant system. The
thermal comfort of the remaining plant connected zones are shown in Appendix-B.
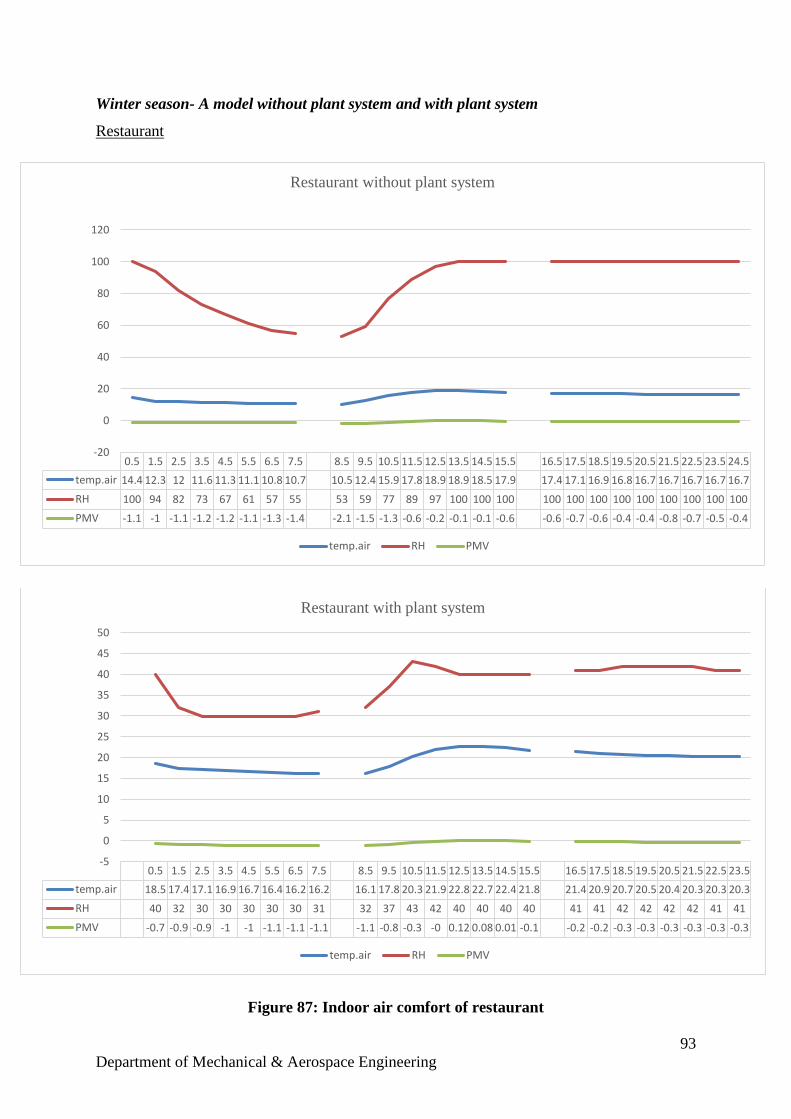
93
Department of Mechanical & Aerospace Engineering
Winter season- A model without plant system and with plant system
Restaurant
Figure 87: Indoor air comfort of restaurant
0.5 1.5 2.5 3.5 4.5 5.5 6.5 7.5 8.5 9.5 10.5 11.5 12.5 13.5 14.5 15.5 16.5 17.5 18.5 19.5 20.5 21.5 22.5 23.5 24.5
temp.air 14.4 12.3 12 11.6 11.3 11.1 10.8 10.7 10.5 12.4 15.9 17.8 18.9 18.9 18.5 17.9 17.4 17.1 16.9 16.8 16.7 16.7 16.7 16.7 16.7
RH 100 94 82 73 67 61 57 55 53 59 77 89 97 100 100 100 100 100 100 100 100 100 100 100 100
PMV -1.1 -1 -1.1 -1.2 -1.2 -1.1 -1.3 -1.4 -2.1 -1.5 -1.3 -0.6 -0.2 -0.1 -0.1 -0.6 -0.6 -0.7 -0.6 -0.4 -0.4 -0.8 -0.7 -0.5 -0.4
-20
0
20
40
60
80
100
120
Restaurant without plant system
temp.air RH PMV
0.5 1.5 2.5 3.5 4.5 5.5 6.5 7.5 8.5 9.5 10.5 11.5 12.5 13.5 14.5 15.5 16.5 17.5 18.5 19.5 20.5 21.5 22.5 23.5
temp.air 18.5 17.4 17.1 16.9 16.7 16.4 16.2 16.2 16.1 17.8 20.3 21.9 22.8 22.7 22.4 21.8 21.4 20.9 20.7 20.5 20.4 20.3 20.3 20.3
RH 40 32 30 30 30 30 30 31 32 37 43 42 40 40 40 40 41 41 42 42 42 42 41 41
PMV -0.7 -0.9 -0.9 -1 -1 -1.1 -1.1 -1.1 -1.1 -0.8 -0.3 -0 0.12 0.08 0.01 -0.1 -0.2 -0.2 -0.3 -0.3 -0.3 -0.3 -0.3 -0.3
-5
0
5
10
15
20
25
30
35
40
45
50
Restaurant with plant system
temp.air RH PMV
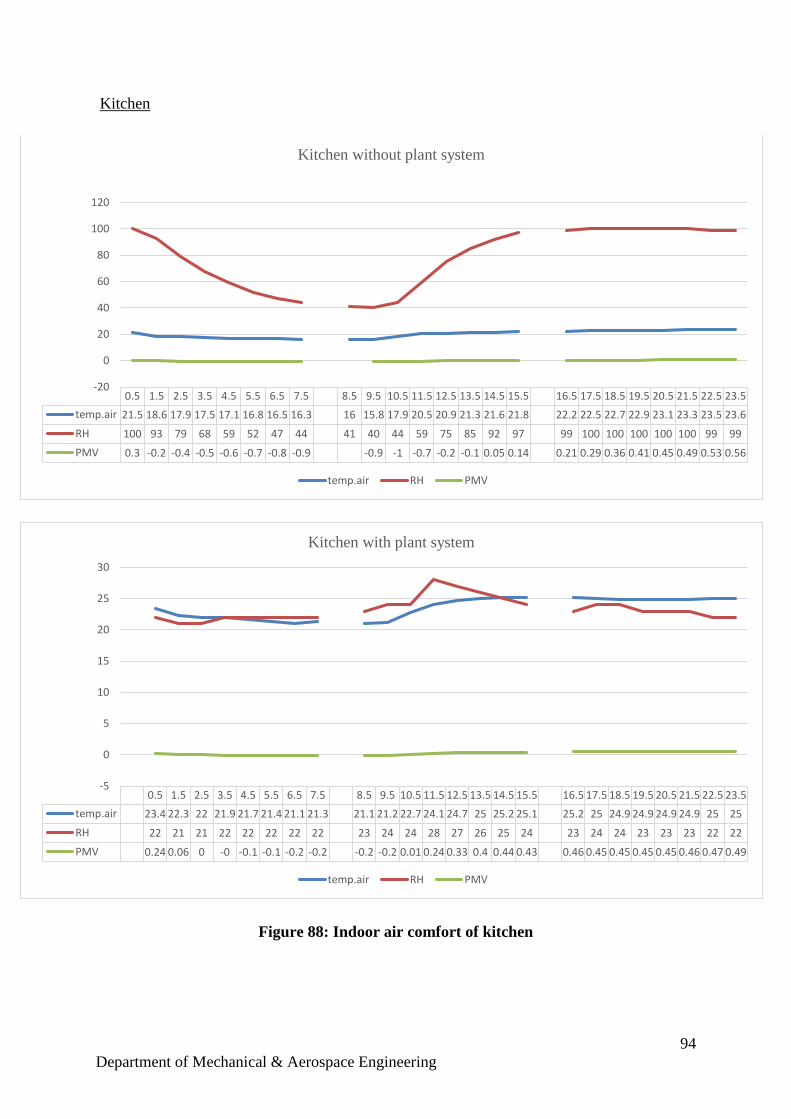
94
Department of Mechanical & Aerospace Engineering
Kitchen
Figure 88: Indoor air comfort of kitchen
0.5 1.5 2.5 3.5 4.5 5.5 6.5 7.5 8.5 9.5 10.5 11.5 12.5 13.5 14.5 15.5 16.5 17.5 18.5 19.5 20.5 21.5 22.5 23.5
temp.air 21.5 18.6 17.9 17.5 17.1 16.8 16.5 16.3 16 15.8 17.9 20.5 20.9 21.3 21.6 21.8 22.2 22.5 22.7 22.9 23.1 23.3 23.5 23.6
RH 100 93 79 68 59 52 47 44 41 40 44 59 75 85 92 97 99 100 100 100 100 100 99 99
PMV 0.3 -0.2 -0.4 -0.5 -0.6 -0.7 -0.8 -0.9 -0.9 -1 -0.7 -0.2 -0.1 0.05 0.14 0.21 0.29 0.36 0.41 0.45 0.49 0.53 0.56
-20
0
20
40
60
80
100
120
Kitchen without plant system
temp.air RH PMV
0.5 1.5 2.5 3.5 4.5 5.5 6.5 7.5 8.5 9.5 10.5 11.5 12.5 13.5 14.5 15.5 16.5 17.5 18.5 19.5 20.5 21.5 22.5 23.5
temp.air 23.4 22.3 22 21.9 21.7 21.4 21.1 21.3 21.1 21.2 22.7 24.1 24.7 25 25.2 25.1 25.2 25 24.9 24.9 24.9 24.9 25 25
RH 22 21 21 22 22 22 22 22 23 24 24 28 27 26 25 24 23 24 24 23 23 23 22 22
PMV 0.24 0.06 0 -0 -0.1 -0.1 -0.2 -0.2 -0.2 -0.2 0.01 0.24 0.33 0.4 0.44 0.43 0.46 0.45 0.45 0.45 0.45 0.46 0.47 0.49
-5
0
5
10
15
20
25
30
Kitchen with plant system
temp.air RH PMV
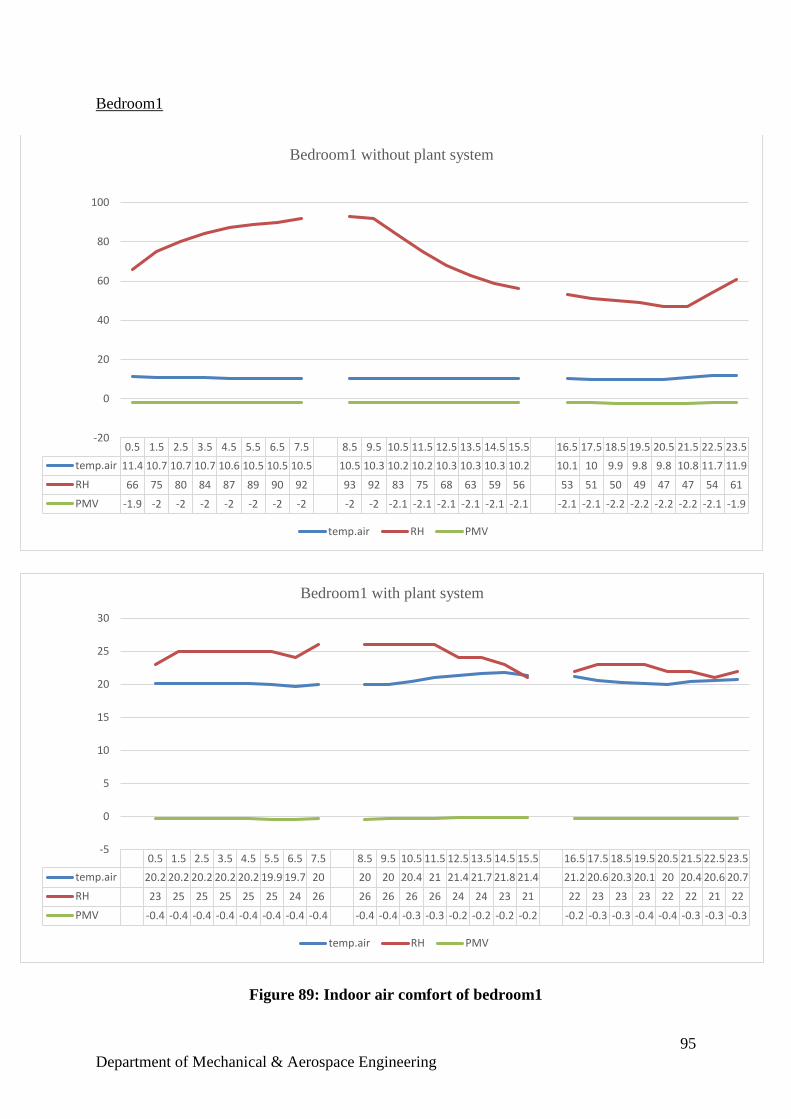
95
Department of Mechanical & Aerospace Engineering
Bedroom1
Figure 89: Indoor air comfort of bedroom1
0.5 1.5 2.5 3.5 4.5 5.5 6.5 7.5 8.5 9.5 10.5 11.5 12.5 13.5 14.5 15.5 16.5 17.5 18.5 19.5 20.5 21.5 22.5 23.5
temp.air 11.4 10.7 10.7 10.7 10.6 10.5 10.5 10.5 10.5 10.3 10.2 10.2 10.3 10.3 10.3 10.2 10.1 10 9.9 9.8 9.8 10.8 11.7 11.9
RH 66 75 80 84 87 89 90 92 93 92 83 75 68 63 59 56 53 51 50 49 47 47 54 61
PMV -1.9 -2 -2 -2 -2 -2 -2 -2 -2 -2 -2.1 -2.1 -2.1 -2.1 -2.1 -2.1 -2.1 -2.1 -2.2 -2.2 -2.2 -2.2 -2.1 -1.9
-20
0
20
40
60
80
100
Bedroom1 without plant system
temp.air RH PMV
0.5 1.5 2.5 3.5 4.5 5.5 6.5 7.5 8.5 9.5 10.5 11.5 12.5 13.5 14.5 15.5 16.5 17.5 18.5 19.5 20.5 21.5 22.5 23.5
temp.air 20.2 20.2 20.2 20.2 20.2 19.9 19.7 20 20 20 20.4 21 21.4 21.7 21.8 21.4 21.2 20.6 20.3 20.1 20 20.4 20.6 20.7
RH 23 25 25 25 25 25 24 26 26 26 26 26 24 24 23 21 22 23 23 23 22 22 21 22
PMV -0.4 -0.4 -0.4 -0.4 -0.4 -0.4 -0.4 -0.4 -0.4 -0.4 -0.3 -0.3 -0.2 -0.2 -0.2 -0.2 -0.2 -0.3 -0.3 -0.4 -0.4 -0.3 -0.3 -0.3
-5
0
5
10
15
20
25
30
Bedroom1 with plant system
temp.air RH PMV
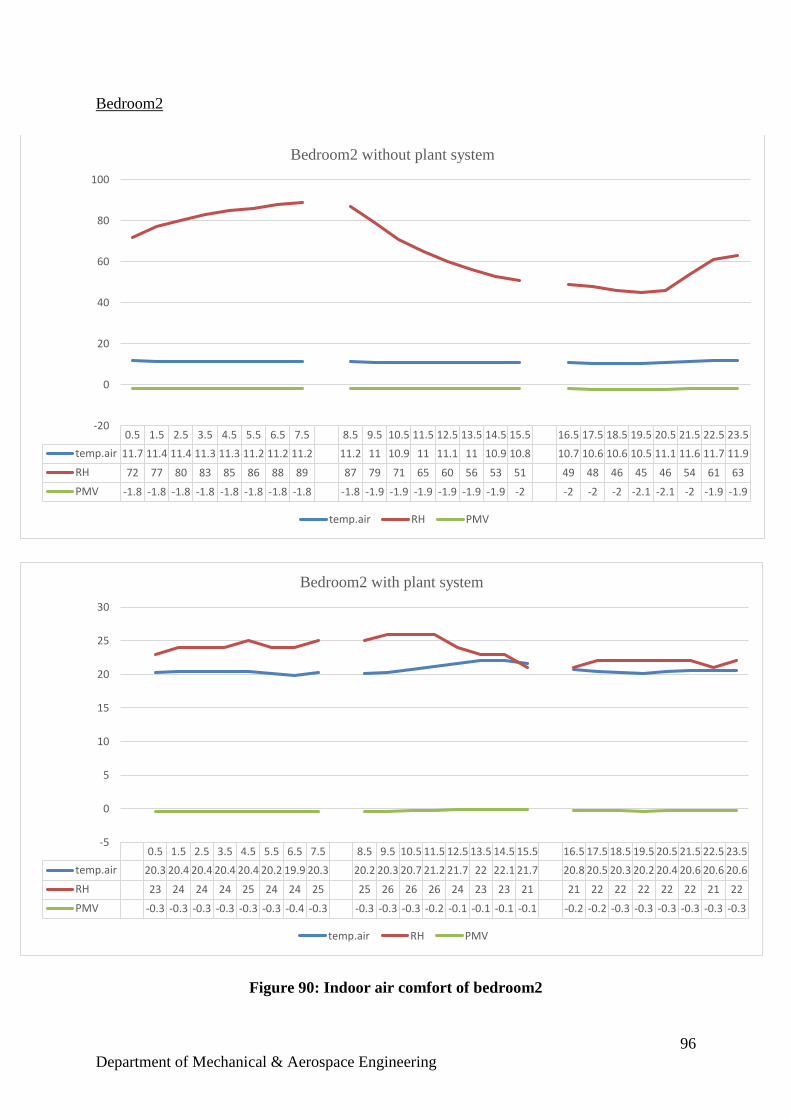
96
Department of Mechanical & Aerospace Engineering
Bedroom2
Figure 90: Indoor air comfort of bedroom2
0.5 1.5 2.5 3.5 4.5 5.5 6.5 7.5 8.5 9.5 10.5 11.5 12.5 13.5 14.5 15.5 16.5 17.5 18.5 19.5 20.5 21.5 22.5 23.5
temp.air 11.7 11.4 11.4 11.3 11.3 11.2 11.2 11.2 11.2 11 10.9 11 11.1 11 10.9 10.8 10.7 10.6 10.6 10.5 11.1 11.6 11.7 11.9
RH 72 77 80 83 85 86 88 89 87 79 71 65 60 56 53 51 49 48 46 45 46 54 61 63
PMV -1.8 -1.8 -1.8 -1.8 -1.8 -1.8 -1.8 -1.8 -1.8 -1.9 -1.9 -1.9 -1.9 -1.9 -1.9 -2 -2 -2 -2 -2.1 -2.1 -2 -1.9 -1.9
-20
0
20
40
60
80
100
Bedroom2 without plant system
temp.air RH PMV
0.5 1.5 2.5 3.5 4.5 5.5 6.5 7.5 8.5 9.5 10.5 11.5 12.5 13.5 14.5 15.5 16.5 17.5 18.5 19.5 20.5 21.5 22.5 23.5
temp.air 20.3 20.4 20.4 20.4 20.4 20.2 19.9 20.3 20.2 20.3 20.7 21.2 21.7 22 22.1 21.7 20.8 20.5 20.3 20.2 20.4 20.6 20.6 20.6
RH 23 24 24 24 25 24 24 25 25 26 26 26 24 23 23 21 21 22 22 22 22 22 21 22
PMV -0.3 -0.3 -0.3 -0.3 -0.3 -0.3 -0.4 -0.3 -0.3 -0.3 -0.3 -0.2 -0.1 -0.1 -0.1 -0.1 -0.2 -0.2 -0.3 -0.3 -0.3 -0.3 -0.3 -0.3
-5
0
5
10
15
20
25
30
Bedroom2 with plant system
temp.air RH PMV
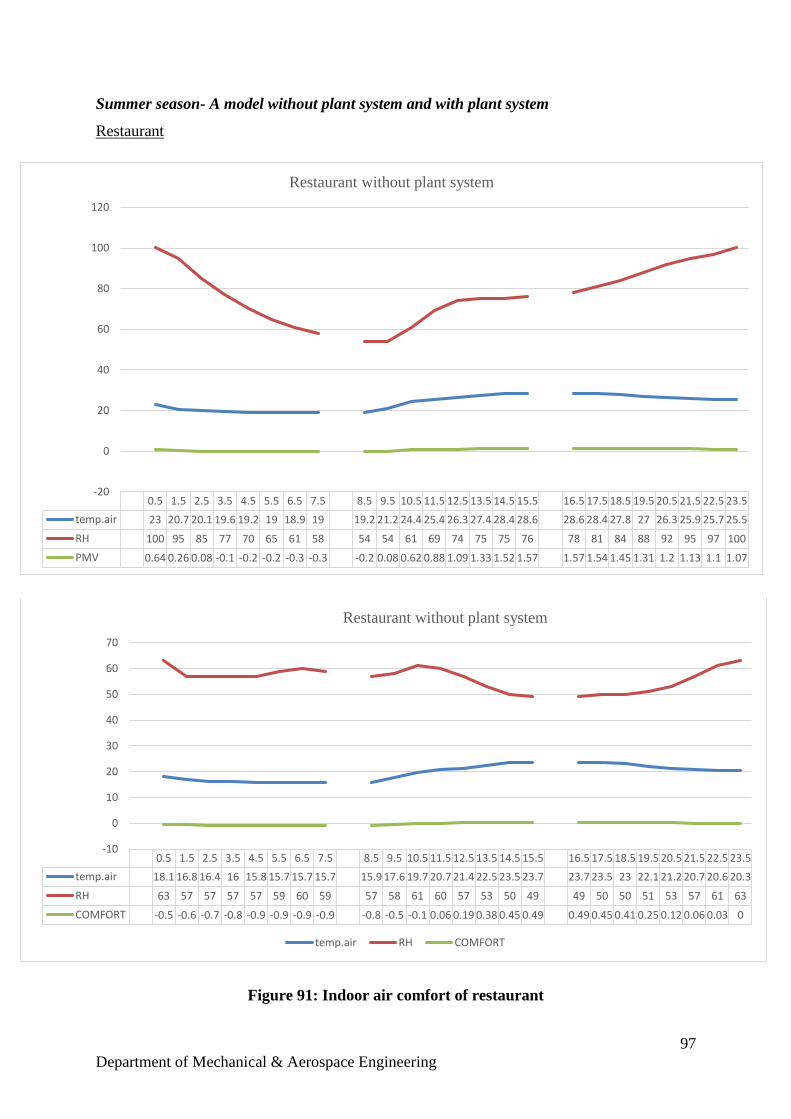
97
Department of Mechanical & Aerospace Engineering
Summer season- A model without plant system and with plant system
Restaurant
Figure 91: Indoor air comfort of restaurant
0.5 1.5 2.5 3.5 4.5 5.5 6.5 7.5 8.5 9.5 10.5 11.5 12.5 13.5 14.5 15.5 16.5 17.5 18.5 19.5 20.5 21.5 22.5 23.5
temp.air 23 20.7 20.1 19.6 19.2 19 18.9 19 19.2 21.2 24.4 25.4 26.3 27.4 28.4 28.6 28.6 28.4 27.8 27 26.3 25.9 25.7 25.5
RH 100 95 85 77 70 65 61 58 54 54 61 69 74 75 75 76 78 81 84 88 92 95 97 100
PMV 0.64 0.26 0.08 -0.1 -0.2 -0.2 -0.3 -0.3 -0.2 0.08 0.62 0.88 1.09 1.33 1.52 1.57 1.57 1.54 1.45 1.31 1.2 1.13 1.1 1.07
-20
0
20
40
60
80
100
120
Restaurant without plant system
0.5 1.5 2.5 3.5 4.5 5.5 6.5 7.5 8.5 9.5 10.5 11.5 12.5 13.5 14.5 15.5 16.5 17.5 18.5 19.5 20.5 21.5 22.5 23.5
temp.air 18.1 16.8 16.4 16 15.8 15.7 15.7 15.7 15.9 17.6 19.7 20.7 21.4 22.5 23.5 23.7 23.7 23.5 23 22.1 21.2 20.7 20.6 20.3
RH 63 57 57 57 57 59 60 59 57 58 61 60 57 53 50 49 49 50 50 51 53 57 61 63
COMFORT -0.5 -0.6 -0.7 -0.8 -0.9 -0.9 -0.9 -0.9 -0.8 -0.5 -0.1 0.06 0.19 0.38 0.45 0.49 0.49 0.45 0.41 0.25 0.12 0.06 0.03 0
-10
0
10
20
30
40
50
60
70
Restaurant without plant system
temp.air RH COMFORT
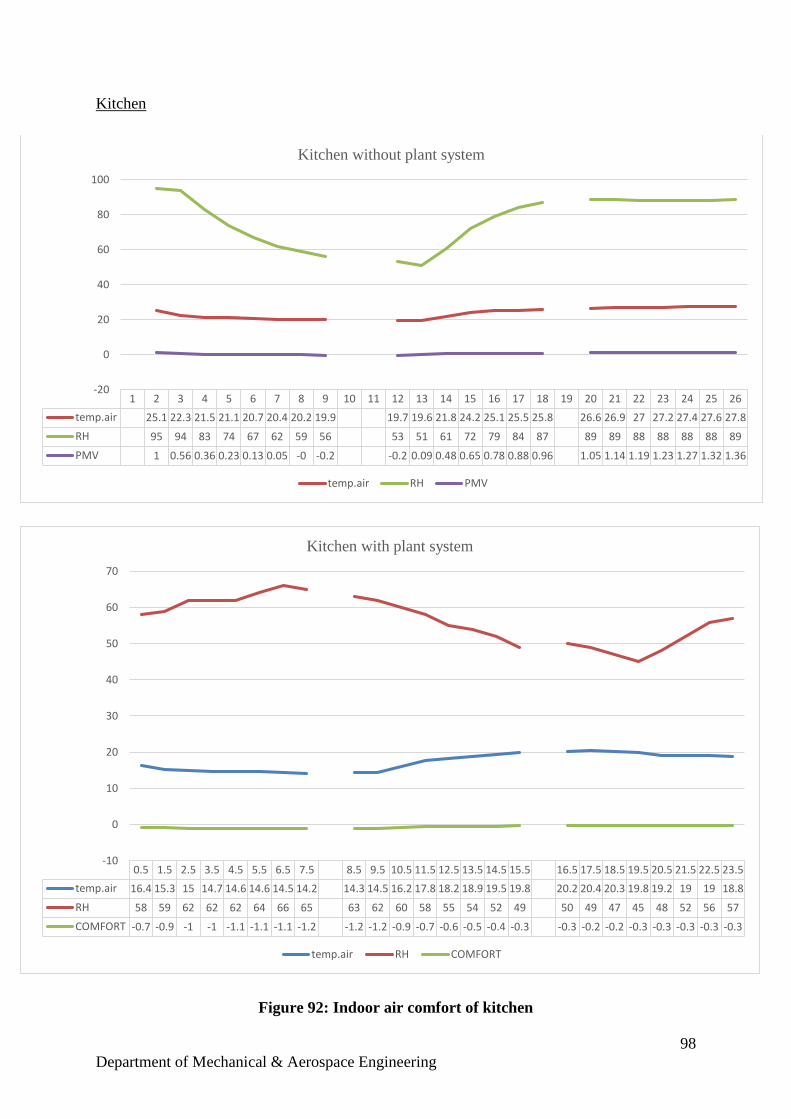
98
Department of Mechanical & Aerospace Engineering
Kitchen
Figure 92: Indoor air comfort of kitchen
1 2 3 4 5 6 7 8 9 10 11 12 13 14 15 16 17 18 19 20 21 22 23 24 25 26
temp.air 25.1 22.3 21.5 21.1 20.7 20.4 20.2 19.9 19.7 19.6 21.8 24.2 25.1 25.5 25.8 26.6 26.9 27 27.2 27.4 27.6 27.8
RH 95 94 83 74 67 62 59 56 53 51 61 72 79 84 87 89 89 88 88 88 88 89
PMV 1 0.56 0.36 0.23 0.13 0.05 -0 -0.2 -0.2 0.09 0.48 0.65 0.78 0.88 0.96 1.05 1.14 1.19 1.23 1.27 1.32 1.36
-20
0
20
40
60
80
100
Kitchen without plant system
temp.air RH PMV
0.5 1.5 2.5 3.5 4.5 5.5 6.5 7.5 8.5 9.5 10.5 11.5 12.5 13.5 14.5 15.5 16.5 17.5 18.5 19.5 20.5 21.5 22.5 23.5
temp.air 16.4 15.3 15 14.7 14.6 14.6 14.5 14.2 14.3 14.5 16.2 17.8 18.2 18.9 19.5 19.8 20.2 20.4 20.3 19.8 19.2 19 19 18.8
RH 58 59 62 62 62 64 66 65 63 62 60 58 55 54 52 49 50 49 47 45 48 52 56 57
COMFORT -0.7 -0.9 -1 -1 -1.1 -1.1 -1.1 -1.2 -1.2 -1.2 -0.9 -0.7 -0.6 -0.5 -0.4 -0.3 -0.3 -0.2 -0.2 -0.3 -0.3 -0.3 -0.3 -0.3
-10
0
10
20
30
40
50
60
70
Kitchen with plant system
temp.air RH COMFORT
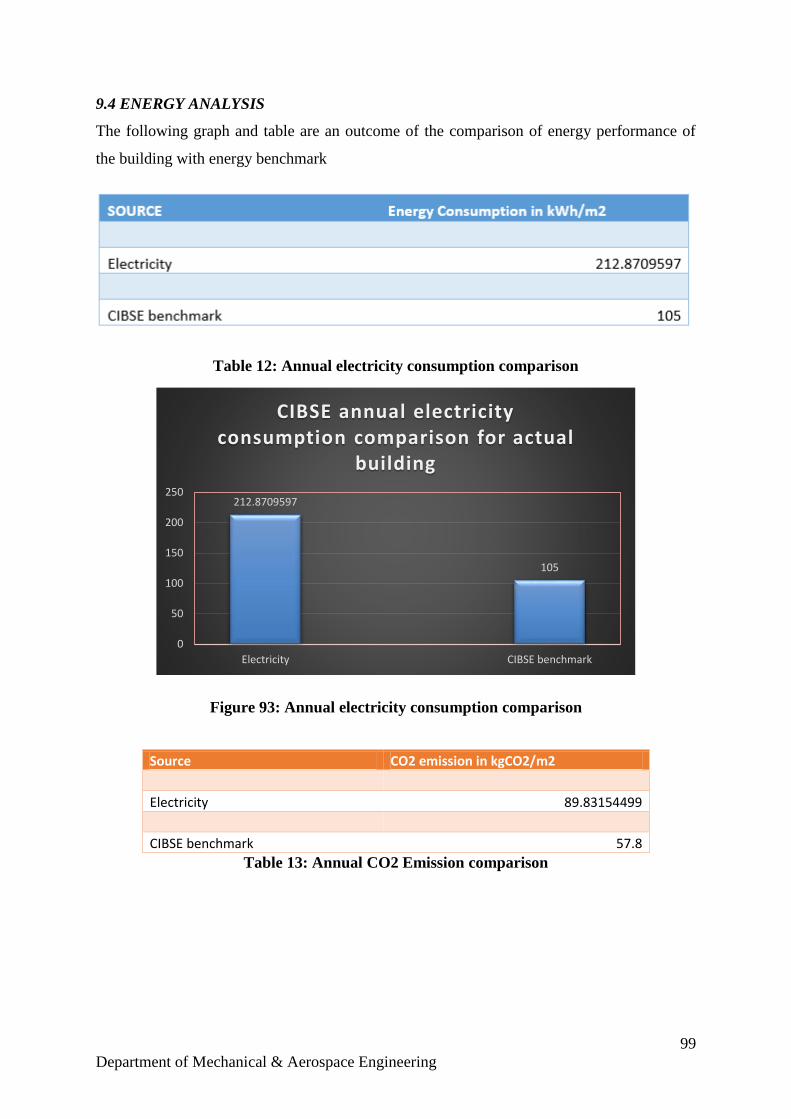
99
Department of Mechanical & Aerospace Engineering
9.4 ENERGY ANALYSIS
The following graph and table are an outcome of the comparison of energy performance of
the building with energy benchmark
Table 12: Annual electricity consumption comparison
Figure 93: Annual electricity consumption comparison
Source CO2 emission in kgCO2/m2
Electricity 89.83154499
CIBSE benchmark 57.8 Table 13: Annual CO2 Emission comparison
212.8709597
105
0
50
100
150
200
250
Electricity CIBSE benchmark
CIBSE annual electricity consumption comparison for actual
building
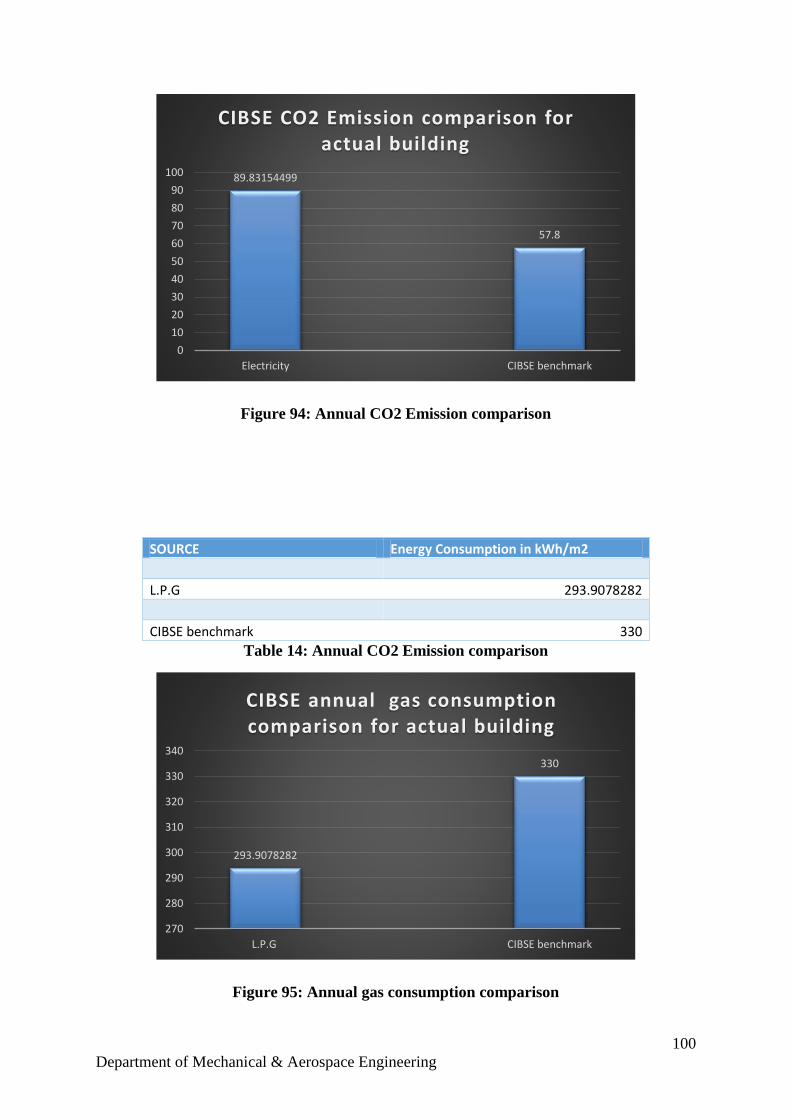
100
Department of Mechanical & Aerospace Engineering
Figure 94: Annual CO2 Emission comparison
SOURCE Energy Consumption in kWh/m2
L.P.G 293.9078282
CIBSE benchmark 330 Table 14: Annual CO2 Emission comparison
Figure 95: Annual gas consumption comparison
89.83154499
57.8
0
10
20
30
40
50
60
70
80
90
100
Electricity CIBSE benchmark
CIBSE CO2 Emission comparison for actual building
293.9078282
330
270
280
290
300
310
320
330
340
L.P.G CIBSE benchmark
CIBSE annual gas consumption comparison for actual building
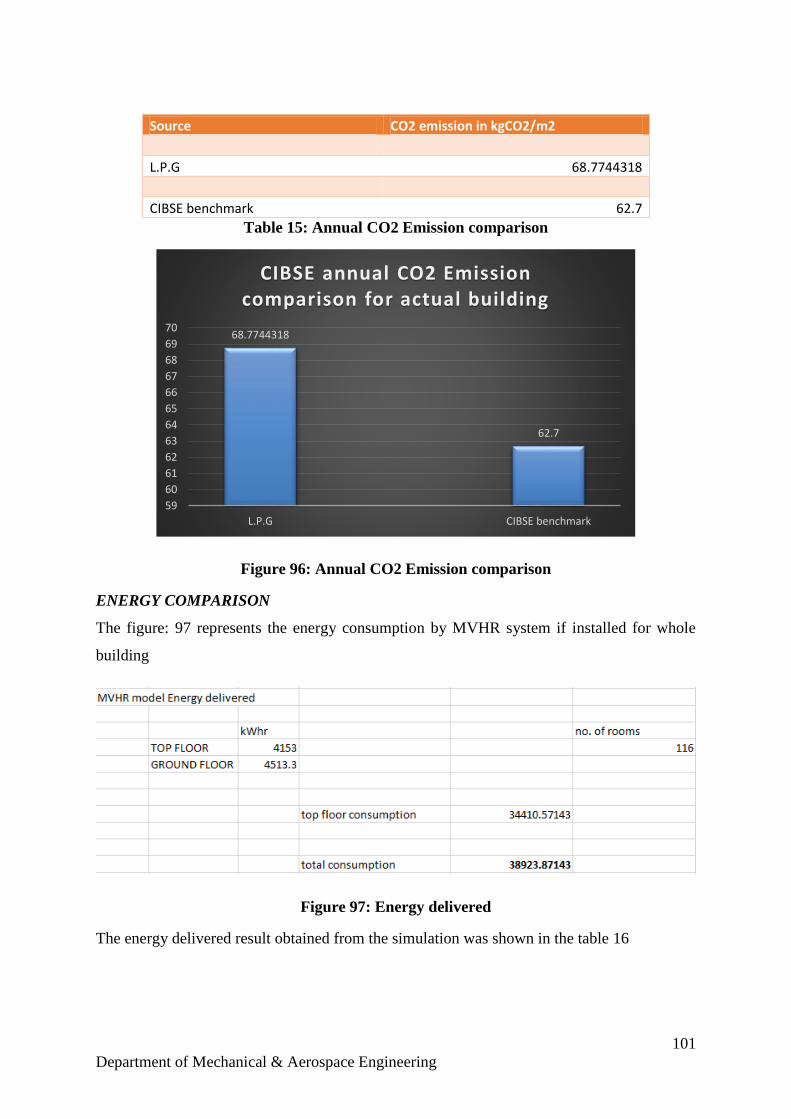
101
Department of Mechanical & Aerospace Engineering
Source CO2 emission in kgCO2/m2
L.P.G 68.7744318
CIBSE benchmark 62.7 Table 15: Annual CO2 Emission comparison
Figure 96: Annual CO2 Emission comparison
ENERGY COMPARISON
The figure: 97 represents the energy consumption by MVHR system if installed for whole
building
Figure 97: Energy delivered
The energy delivered result obtained from the simulation was shown in the table 16
68.7744318
62.7
59
60
61
62
63
64
65
66
67
68
69
70
L.P.G CIBSE benchmark
CIBSE annual CO2 Emission comparison for actual building
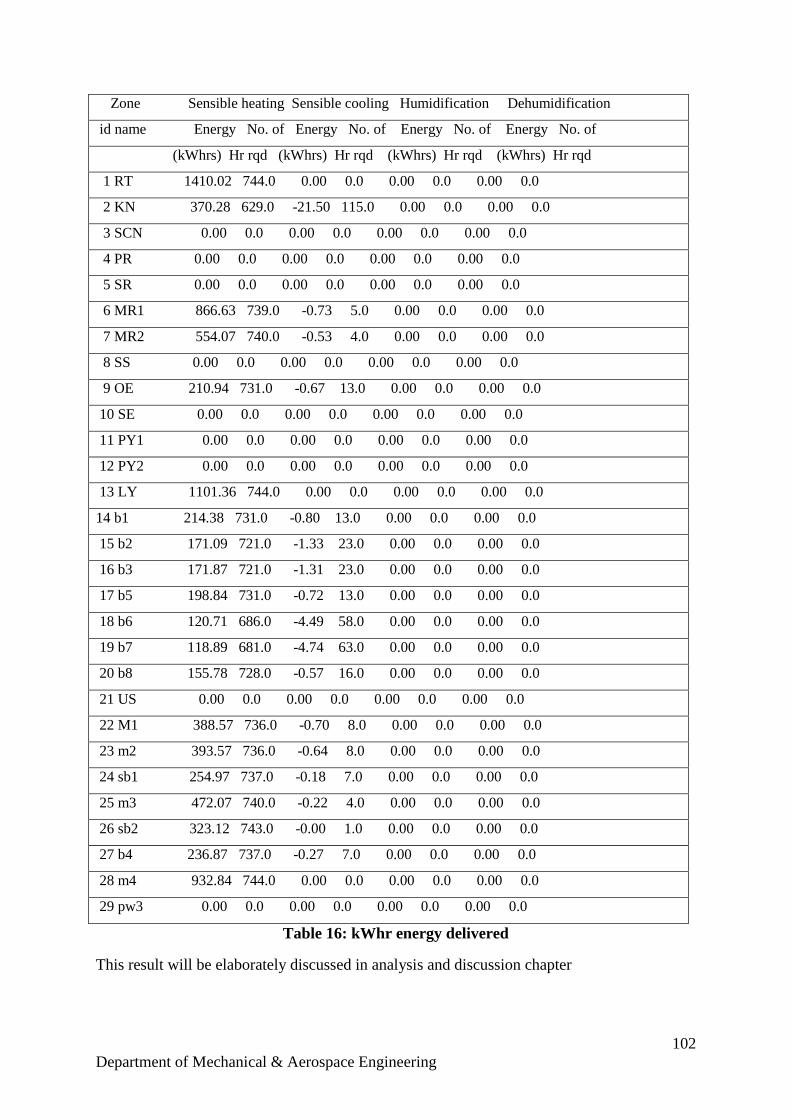
102
Department of Mechanical & Aerospace Engineering
Zone Sensible heating Sensible cooling Humidification Dehumidification
id name Energy No. of Energy No. of Energy No. of Energy No. of
(kWhrs) Hr rqd (kWhrs) Hr rqd (kWhrs) Hr rqd (kWhrs) Hr rqd
1 RT 1410.02 744.0 0.00 0.0 0.00 0.0 0.00 0.0
2 KN 370.28 629.0 -21.50 115.0 0.00 0.0 0.00 0.0
3 SCN 0.00 0.0 0.00 0.0 0.00 0.0 0.00 0.0
4 PR 0.00 0.0 0.00 0.0 0.00 0.0 0.00 0.0
5 SR 0.00 0.0 0.00 0.0 0.00 0.0 0.00 0.0
6 MR1 866.63 739.0 -0.73 5.0 0.00 0.0 0.00 0.0
7 MR2 554.07 740.0 -0.53 4.0 0.00 0.0 0.00 0.0
8 SS 0.00 0.0 0.00 0.0 0.00 0.0 0.00 0.0
9 OE 210.94 731.0 -0.67 13.0 0.00 0.0 0.00 0.0
10 SE 0.00 0.0 0.00 0.0 0.00 0.0 0.00 0.0
11 PY1 0.00 0.0 0.00 0.0 0.00 0.0 0.00 0.0
12 PY2 0.00 0.0 0.00 0.0 0.00 0.0 0.00 0.0
13 LY 1101.36 744.0 0.00 0.0 0.00 0.0 0.00 0.0
14 b1 214.38 731.0 -0.80 13.0 0.00 0.0 0.00 0.0
15 b2 171.09 721.0 -1.33 23.0 0.00 0.0 0.00 0.0
16 b3 171.87 721.0 -1.31 23.0 0.00 0.0 0.00 0.0
17 b5 198.84 731.0 -0.72 13.0 0.00 0.0 0.00 0.0
18 b6 120.71 686.0 -4.49 58.0 0.00 0.0 0.00 0.0
19 b7 118.89 681.0 -4.74 63.0 0.00 0.0 0.00 0.0
20 b8 155.78 728.0 -0.57 16.0 0.00 0.0 0.00 0.0
21 US 0.00 0.0 0.00 0.0 0.00 0.0 0.00 0.0
22 M1 388.57 736.0 -0.70 8.0 0.00 0.0 0.00 0.0
23 m2 393.57 736.0 -0.64 8.0 0.00 0.0 0.00 0.0
24 sb1 254.97 737.0 -0.18 7.0 0.00 0.0 0.00 0.0
25 m3 472.07 740.0 -0.22 4.0 0.00 0.0 0.00 0.0
26 sb2 323.12 743.0 -0.00 1.0 0.00 0.0 0.00 0.0
27 b4 236.87 737.0 -0.27 7.0 0.00 0.0 0.00 0.0
28 m4 932.84 744.0 0.00 0.0 0.00 0.0 0.00 0.0
29 pw3 0.00 0.0 0.00 0.0 0.00 0.0 0.00 0.0
Table 16: kWhr energy delivered
This result will be elaborately discussed in analysis and discussion chapter
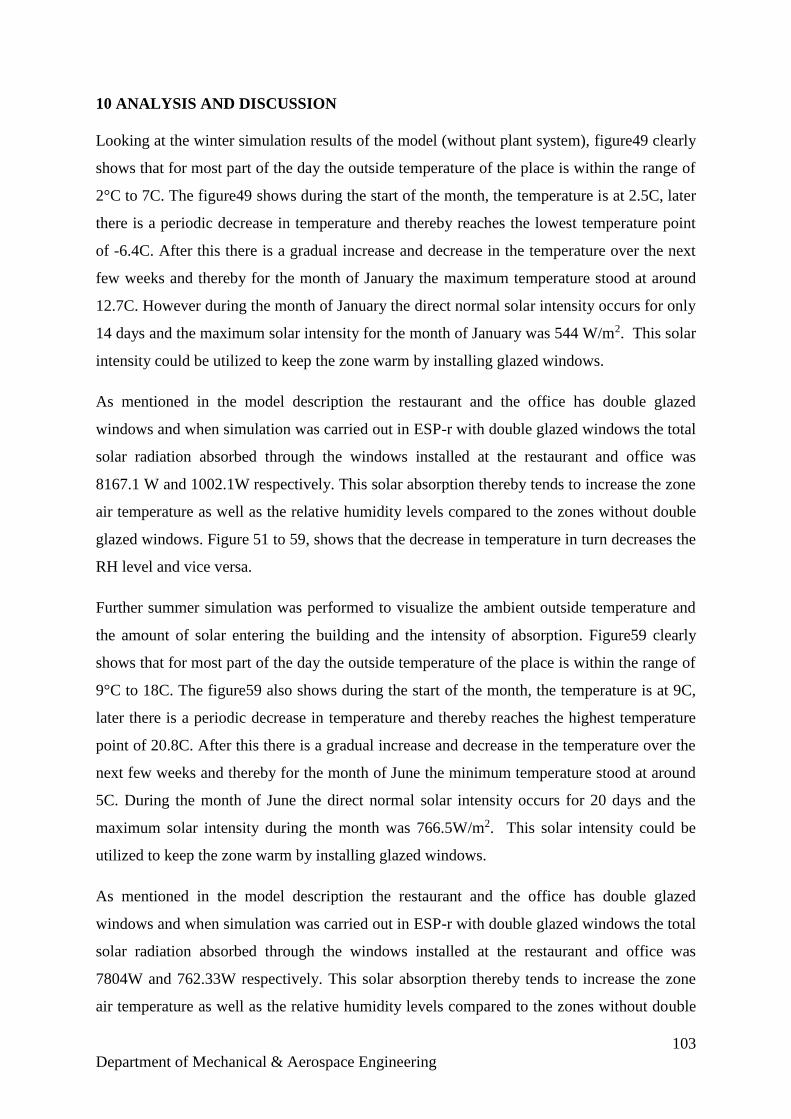
103
Department of Mechanical & Aerospace Engineering
10 ANALYSIS AND DISCUSSION
Looking at the winter simulation results of the model (without plant system), figure49 clearly
shows that for most part of the day the outside temperature of the place is within the range of
2°C to 7C. The figure49 shows during the start of the month, the temperature is at 2.5C, later
there is a periodic decrease in temperature and thereby reaches the lowest temperature point
of -6.4C. After this there is a gradual increase and decrease in the temperature over the next
few weeks and thereby for the month of January the maximum temperature stood at around
12.7C. However during the month of January the direct normal solar intensity occurs for only
14 days and the maximum solar intensity for the month of January was 544 W/m2. This solar
intensity could be utilized to keep the zone warm by installing glazed windows.
As mentioned in the model description the restaurant and the office has double glazed
windows and when simulation was carried out in ESP-r with double glazed windows the total
solar radiation absorbed through the windows installed at the restaurant and office was
8167.1 W and 1002.1W respectively. This solar absorption thereby tends to increase the zone
air temperature as well as the relative humidity levels compared to the zones without double
glazed windows. Figure 51 to 59, shows that the decrease in temperature in turn decreases the
RH level and vice versa.
Further summer simulation was performed to visualize the ambient outside temperature and
the amount of solar entering the building and the intensity of absorption. Figure59 clearly
shows that for most part of the day the outside temperature of the place is within the range of
9°C to 18C. The figure59 also shows during the start of the month, the temperature is at 9C,
later there is a periodic decrease in temperature and thereby reaches the highest temperature
point of 20.8C. After this there is a gradual increase and decrease in the temperature over the
next few weeks and thereby for the month of June the minimum temperature stood at around
5C. During the month of June the direct normal solar intensity occurs for 20 days and the
maximum solar intensity during the month was 766.5W/m2. This solar intensity could be
utilized to keep the zone warm by installing glazed windows.
As mentioned in the model description the restaurant and the office has double glazed
windows and when simulation was carried out in ESP-r with double glazed windows the total
solar radiation absorbed through the windows installed at the restaurant and office was
7804W and 762.33W respectively. This solar absorption thereby tends to increase the zone
air temperature as well as the relative humidity levels compared to the zones without double
104
Department of Mechanical & Aerospace Engineering
glazed windows. Figure 61 to 68 shows that the decrease in temperature in turn decreases the
RH level and vice versa.
In a similar way, the simulation for winter season was carried out for the model with the
definition of a plant system. The results obtained showed that the maximum and the
minimum temperature of the zones connected to the plant system have increased when
compared with those results obtained from the model without the plant system. Along with
that, the results also show that the relative humidity levels have improved and this can be
seen in table9. From the figure71 it can be seen that for the entire month the RH level of the
restaurant is maintained within the range of 35% to 55% when compared with RH level
which was obtained for the model without the plant system (figure: 53). This relative
humidity level is within the level as discussed in chapter: 5.2 which is set as a standard level
which thereby helps to avoid health issues, dust mites and the mould. Similarly figure:72
shows that the when the plant system was connected to the kitchen the RH level drops to
13.23% and during the later part of the month there is periodic rise and fall in the RH level.
Even though the RH level is not within the limit the thermal comfort within the zone has been
improved considerably when compared with the previous model which was developed
without the plant system.
Since the top floor zones like bedroom1, 2 3 and 4 are in comfort level, the plant system-2 is
not connected to it. Further summer simulation was performed to visualize the maximum and
the minimum temperature of the zones connected to the plant system has decreased when
compared with those results obtained from the model without the plant system. Along with
that the results also show that the relative humidity levels have improved and this can be seen
in table11. From the figure83 it can be seen RH level of the restaurant is within the limit
when compared with RH level which was obtained for the model without the plant system
(figure: 58). Similarly figure: 84, 85 and 86 shows that when the plant system was connected
with the kitchen, office and lobby most of the day the relative humidity level is within the
minimum limit but in very few days it exceeds the maximum limit. Even though this happens
the thermal comfort within the zone has been improved considerably when compared with
the previous model which was developed without the plant system.
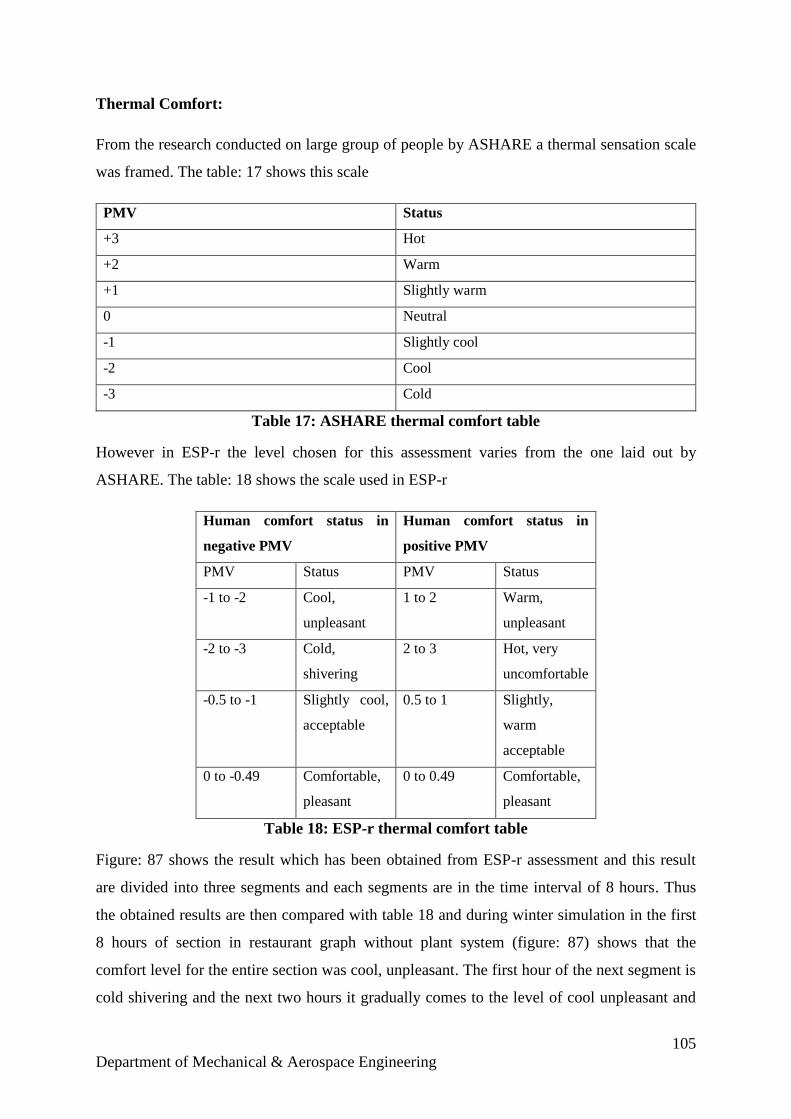
105
Department of Mechanical & Aerospace Engineering
Thermal Comfort:
From the research conducted on large group of people by ASHARE a thermal sensation scale
was framed. The table: 17 shows this scale
PMV Status
+3 Hot
+2 Warm
+1 Slightly warm
0 Neutral
-1 Slightly cool
-2 Cool
-3 Cold
Table 17: ASHARE thermal comfort table
However in ESP-r the level chosen for this assessment varies from the one laid out by
ASHARE. The table: 18 shows the scale used in ESP-r
Human comfort status in
negative PMV
Human comfort status in
positive PMV
PMV Status PMV Status
-1 to -2 Cool,
unpleasant
1 to 2 Warm,
unpleasant
-2 to -3 Cold,
shivering
2 to 3 Hot, very
uncomfortable
-0.5 to -1 Slightly cool,
acceptable
0.5 to 1 Slightly,
warm
acceptable
0 to -0.49 Comfortable,
pleasant
0 to 0.49 Comfortable,
pleasant
Table 18: ESP-r thermal comfort table
Figure: 87 shows the result which has been obtained from ESP-r assessment and this result
are divided into three segments and each segments are in the time interval of 8 hours. Thus
the obtained results are then compared with table 18 and during winter simulation in the first
8 hours of section in restaurant graph without plant system (figure: 87) shows that the
comfort level for the entire section was cool, unpleasant. The first hour of the next segment is
cold shivering and the next two hours it gradually comes to the level of cool unpleasant and
106
Department of Mechanical & Aerospace Engineering
the remaining hour of the section shows to be comfortable, pleasant. The entire final segment
of the table shows that the comfort level is slightly cool, acceptable. From the figure: 87 the
entire final segment of the restaurant with plant system can be termed as comfortable and
pleasant for the users, whereas during the first 5 hours of segment 1 the comfort levels are
considered to be slightly cool and unpleasant. The next 4 hours are considered as cold and
shivering. In the following next segment the first hour seems to be cool unpleasant, then the
following hour feel slightly cool and acceptable and the next 6 hours are in comfortable,
pleasant level. From the following analysis it is clearly seen that when the plant system is
deployed the comfort level, temperature inside the zones, humidity are much better than
results obtained without plant system. The remaining zones in the section are also followed in
the same manner.
Similarly during summer simulation the first hour of the section 1 in restaurant graph without
plant system (figure: 91) shows that the comfort level is slightly warm and acceptable, while
the remaining hours of the section was comfortable and pleasant. The first two hours of the
section 2 feels to be comfortable, pleasant. The next two hours feels to be slightly warm,
acceptable. Then the remaining hours of the section are warm, unpleasant. The entire final
segment seems to be in the comfort level of warm unpleasant. From the figure: 71 the entire
first segment of the restaurant with plant system seems to be in slightly warm, acceptable for
the users, likewise the entire final segment seems to be in the comfort levels. The first two
hour of the section 2 is slightly cool and acceptable. Then the next remaining hours are in
comfortable and pleasant. . From the following analysis it is clearly seen that when the plant
system is deployed the comfort level, temperature inside the zones, humidity are much better
than results obtained without plant system The remaining zones in the section are also
followed in the same manner.
107
Department of Mechanical & Aerospace Engineering
Energy Performance Comparison
As shown in figure93 the electricity consumption (2012) comparison with the CIBSE
benchmark shows that the value exceeds the benchmark by 100kWh/m2 and figure94 shows
that the corresponding CO2 emission exceeds the benchmark by 30kgCO2/m2. Similarly
figure95 shows that the gas consumption for the year 2012 is within the CIBSE benchmark
and figure96 shows that the corresponding CO2 emission level from gas consumption
exceeds the benchmark by 5kgCO2/m2. When looking at the hotel from a broader
perspective, certain improvements are necessary to reduce this energy consumption.
In the ground floor the plant system is connected to 6 zones from the previous 4 zone
connection strategy and the corresponding energy delivered was measured as 4513kWh.
Similarly, the plant system was connected to 14 zones in the first floor from the previous 4
zone connection and the corresponding energy delivered was measured as 4153kWh. From
figure: 48 it is seen that during the month of January the total consumption for the entire hotel
(4 floors) is 51257kWh. Similarly from figure: 97 it is seen that during the month of January
the total consumption is 38927kWh and this consumption is after the installation of the
MVHR system. Moreover when looking at the two values, there is a difference of
approximately 13000kWh and if lights, equipment’s and other systems are expected to
consume around 10000kWh an energy saving of around 3000kWh is foreseeable when the
MVHR system is installed and henceforth it is recommended to install the MVHR system in
the building.
108
Department of Mechanical & Aerospace Engineering
CONCLUSION
Aim of the project focuses on the improvement of internal temperature, relative humidity and
final guide to thermal comfort inside the hotel sector .The existing hotel, Holiday Inn has not
been installed with mechanical ventilation heat recovery system, therefore deployment of
mechanical heat recovery system in dynamic simulation model; ESP-r is necessary to make a
realistic approach. This suggests that the installation has improved the energy consumption
and thermal comfort. When the MVHR is installed in the dynamic simulation model, the
result obtained clearly shows an improvement in thermal comfort and drastic reduction in
energy consumption. However, there are some practical difficulties such as: relative humidity
decreases than the bench mark level during the simulation in ESP-r, but in reality it can be
avoided by using humidity control. Summer simulation was performed with replacing the
summer bypass mode in MVHR to cooling coil in order to provide thermal comfort inside the
zones of the developed model. When the MVHR is compared to the air-conditioning unit
installed in the holiday inn then according to the results the MVHR has provided with better
results with respect to thermal comfort. So as a result the installation of MVHR in holiday inn
is benefited with less energy consumption by the building as well as improved on the comfort
level of the occupants in the building. The installation cost is always an important factor to be
considered when using MVHR as compared to the air-conditioning unit.
Recommendations
The humidity control can be used in MVHR to improve the overall humidity within
the zones in the model.
MVHR should be installed in all zones in order to get more realistic results.
MVHR should be included within a closed place so that heat loss is controlled more
effectively.
Retrofitting the MVHR is relay high in terms of cost so proper planning during the
construction stage is always necessary.
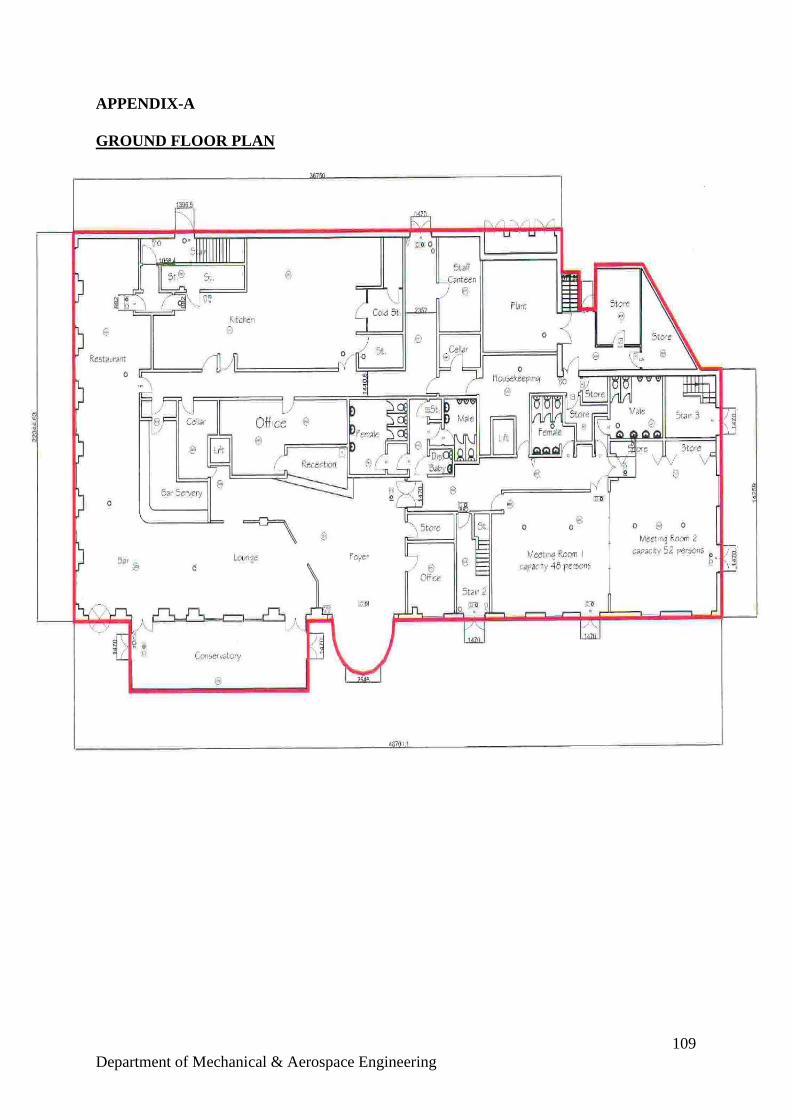
109
Department of Mechanical & Aerospace Engineering
APPENDIX-A
GROUND FLOOR PLAN
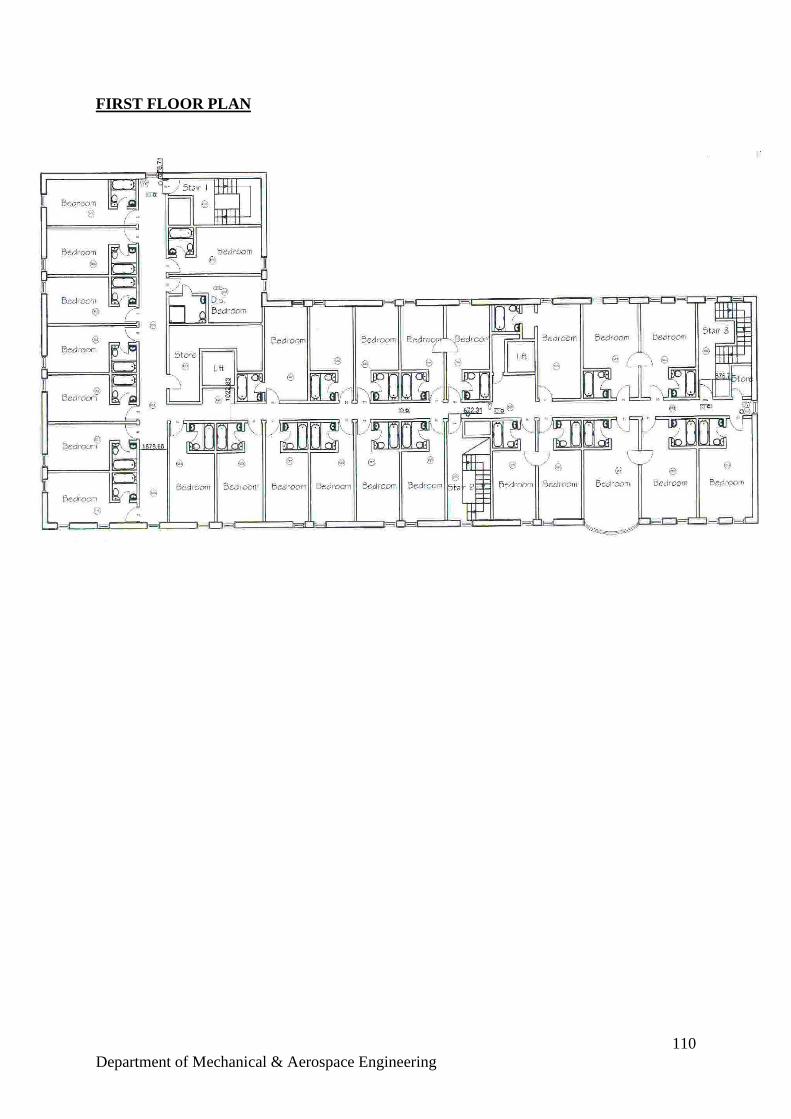
110
Department of Mechanical & Aerospace Engineering
FIRST FLOOR PLAN
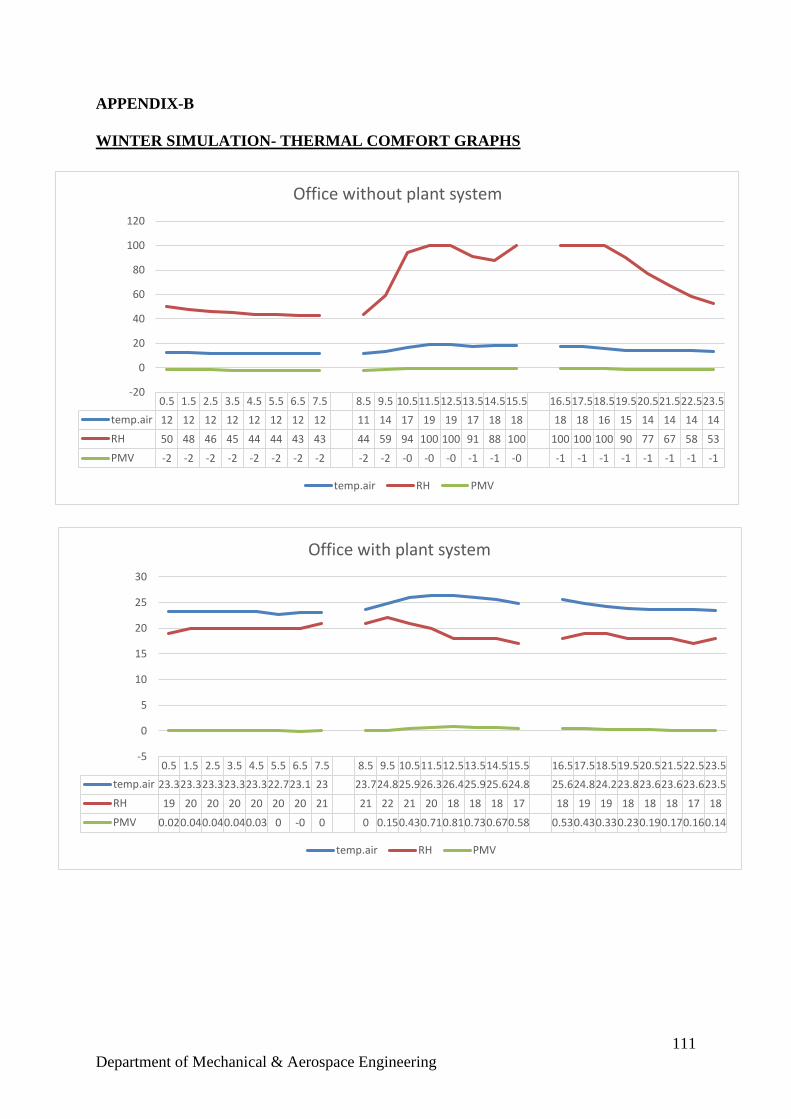
111
Department of Mechanical & Aerospace Engineering
APPENDIX-B
WINTER SIMULATION- THERMAL COMFORT GRAPHS
0.5 1.5 2.5 3.5 4.5 5.5 6.5 7.5 8.5 9.5 10.511.512.513.514.515.5 16.517.518.519.520.521.522.523.5
temp.air 12 12 12 12 12 12 12 12 11 14 17 19 19 17 18 18 18 18 16 15 14 14 14 14
RH 50 48 46 45 44 44 43 43 44 59 94 100 100 91 88 100 100 100 100 90 77 67 58 53
PMV -2 -2 -2 -2 -2 -2 -2 -2 -2 -2 -0 -0 -0 -1 -1 -0 -1 -1 -1 -1 -1 -1 -1 -1
-20
0
20
40
60
80
100
120
Office without plant system
temp.air RH PMV
0.5 1.5 2.5 3.5 4.5 5.5 6.5 7.5 8.5 9.5 10.511.512.513.514.515.5 16.517.518.519.520.521.522.523.5
temp.air 23.323.323.323.323.322.723.1 23 23.724.825.926.326.425.925.624.8 25.624.824.223.823.623.623.623.5
RH 19 20 20 20 20 20 20 21 21 22 21 20 18 18 18 17 18 19 19 18 18 18 17 18
PMV 0.020.040.040.040.03 0 -0 0 0 0.150.430.710.810.730.670.58 0.530.430.330.230.190.170.160.14
-5
0
5
10
15
20
25
30
Office with plant system
temp.air RH PMV
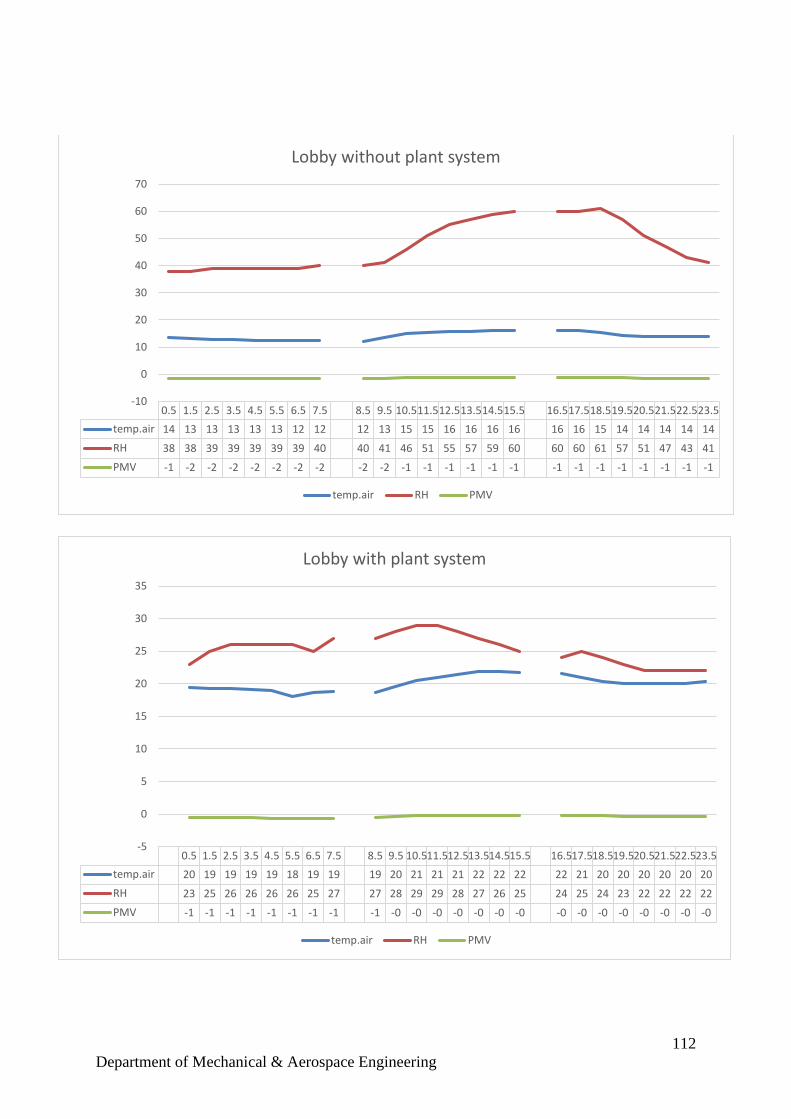
112
Department of Mechanical & Aerospace Engineering
0.5 1.5 2.5 3.5 4.5 5.5 6.5 7.5 8.5 9.5 10.511.512.513.514.515.5 16.517.518.519.520.521.522.523.5
temp.air 14 13 13 13 13 13 12 12 12 13 15 15 16 16 16 16 16 16 15 14 14 14 14 14
RH 38 38 39 39 39 39 39 40 40 41 46 51 55 57 59 60 60 60 61 57 51 47 43 41
PMV -1 -2 -2 -2 -2 -2 -2 -2 -2 -2 -1 -1 -1 -1 -1 -1 -1 -1 -1 -1 -1 -1 -1 -1
-10
0
10
20
30
40
50
60
70
Lobby without plant system
temp.air RH PMV
0.5 1.5 2.5 3.5 4.5 5.5 6.5 7.5 8.5 9.5 10.511.512.513.514.515.5 16.517.518.519.520.521.522.523.5
temp.air 20 19 19 19 19 18 19 19 19 20 21 21 21 22 22 22 22 21 20 20 20 20 20 20
RH 23 25 26 26 26 26 25 27 27 28 29 29 28 27 26 25 24 25 24 23 22 22 22 22
PMV -1 -1 -1 -1 -1 -1 -1 -1 -1 -0 -0 -0 -0 -0 -0 -0 -0 -0 -0 -0 -0 -0 -0 -0
-5
0
5
10
15
20
25
30
35
Lobby with plant system
temp.air RH PMV
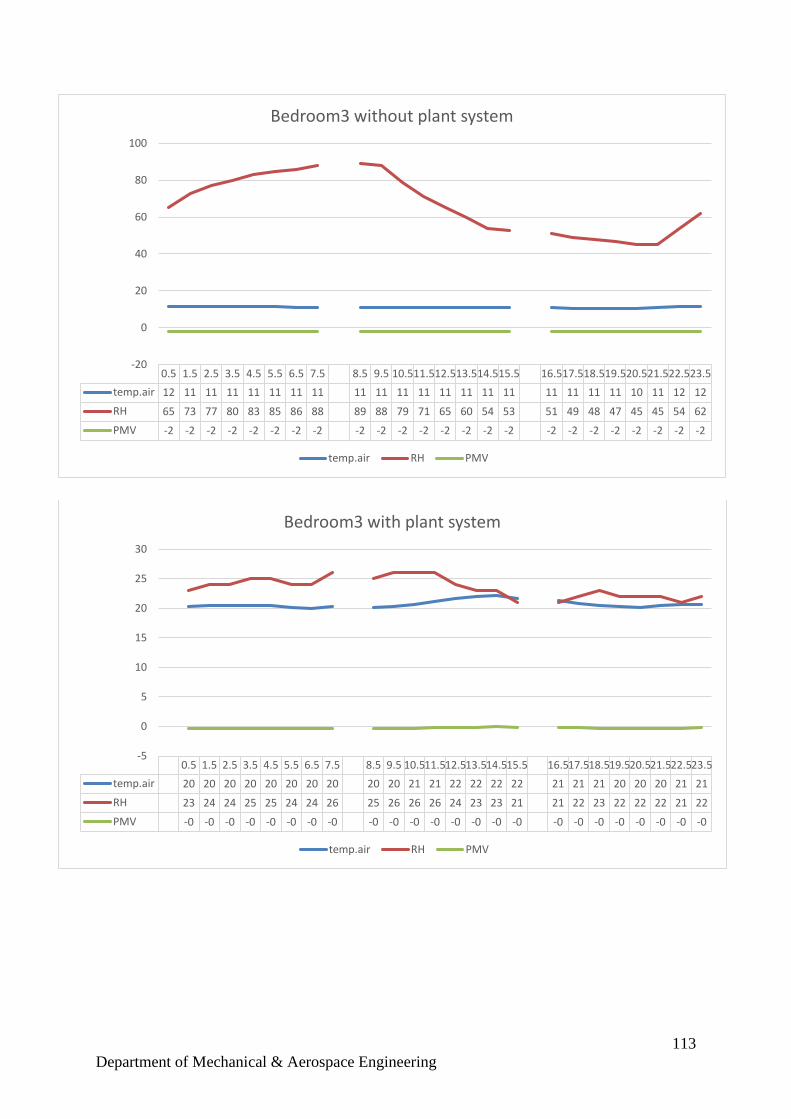
113
Department of Mechanical & Aerospace Engineering
0.5 1.5 2.5 3.5 4.5 5.5 6.5 7.5 8.5 9.5 10.511.512.513.514.515.5 16.517.518.519.520.521.522.523.5
temp.air 12 11 11 11 11 11 11 11 11 11 11 11 11 11 11 11 11 11 11 11 10 11 12 12
RH 65 73 77 80 83 85 86 88 89 88 79 71 65 60 54 53 51 49 48 47 45 45 54 62
PMV -2 -2 -2 -2 -2 -2 -2 -2 -2 -2 -2 -2 -2 -2 -2 -2 -2 -2 -2 -2 -2 -2 -2 -2
-20
0
20
40
60
80
100
Bedroom3 without plant system
temp.air RH PMV
0.5 1.5 2.5 3.5 4.5 5.5 6.5 7.5 8.5 9.5 10.511.512.513.514.515.5 16.517.518.519.520.521.522.523.5
temp.air 20 20 20 20 20 20 20 20 20 20 21 21 22 22 22 22 21 21 21 20 20 20 21 21
RH 23 24 24 25 25 24 24 26 25 26 26 26 24 23 23 21 21 22 23 22 22 22 21 22
PMV -0 -0 -0 -0 -0 -0 -0 -0 -0 -0 -0 -0 -0 -0 -0 -0 -0 -0 -0 -0 -0 -0 -0 -0
-5
0
5
10
15
20
25
30
Bedroom3 with plant system
temp.air RH PMV
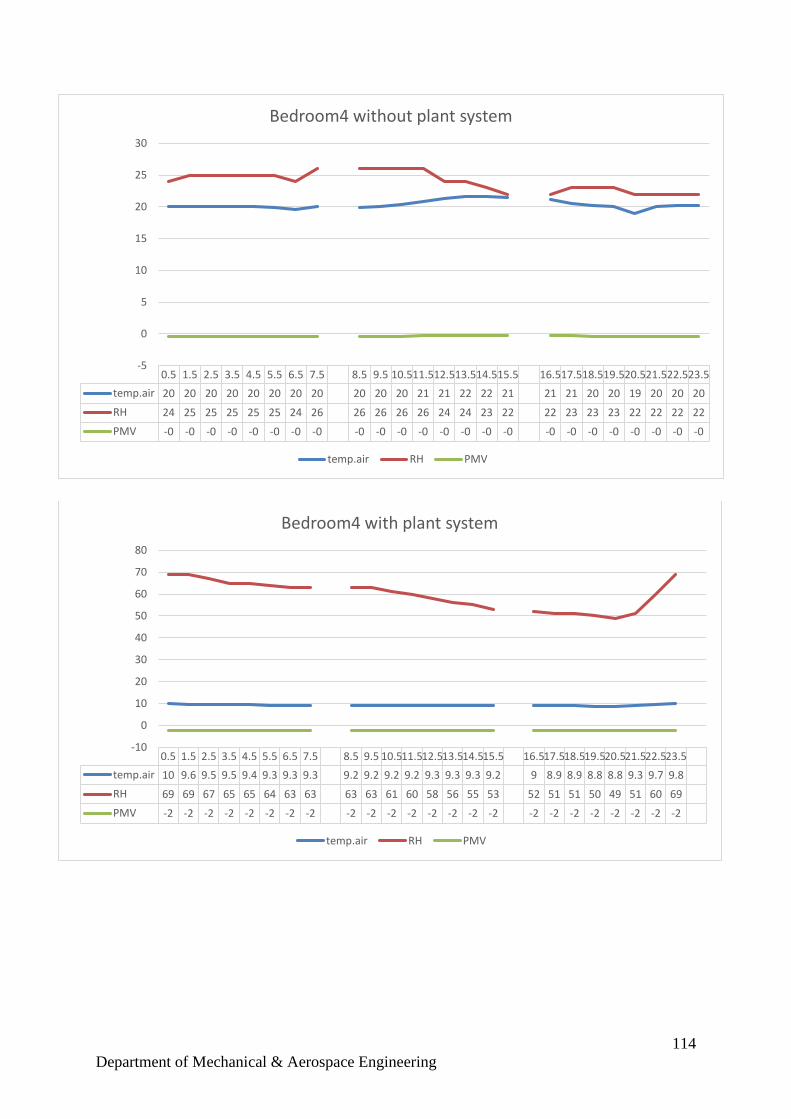
114
Department of Mechanical & Aerospace Engineering
0.5 1.5 2.5 3.5 4.5 5.5 6.5 7.5 8.5 9.5 10.511.512.513.514.515.5 16.517.518.519.520.521.522.523.5
temp.air 20 20 20 20 20 20 20 20 20 20 20 21 21 22 22 21 21 21 20 20 19 20 20 20
RH 24 25 25 25 25 25 24 26 26 26 26 26 24 24 23 22 22 23 23 23 22 22 22 22
PMV -0 -0 -0 -0 -0 -0 -0 -0 -0 -0 -0 -0 -0 -0 -0 -0 -0 -0 -0 -0 -0 -0 -0 -0
-5
0
5
10
15
20
25
30
Bedroom4 without plant system
temp.air RH PMV
0.5 1.5 2.5 3.5 4.5 5.5 6.5 7.5 8.5 9.5 10.511.512.513.514.515.5 16.517.518.519.520.521.522.523.5
temp.air 10 9.6 9.5 9.5 9.4 9.3 9.3 9.3 9.2 9.2 9.2 9.2 9.3 9.3 9.3 9.2 9 8.9 8.9 8.8 8.8 9.3 9.7 9.8
RH 69 69 67 65 65 64 63 63 63 63 61 60 58 56 55 53 52 51 51 50 49 51 60 69
PMV -2 -2 -2 -2 -2 -2 -2 -2 -2 -2 -2 -2 -2 -2 -2 -2 -2 -2 -2 -2 -2 -2 -2 -2
-10
0
10
20
30
40
50
60
70
80
Bedroom4 with plant system
temp.air RH PMV
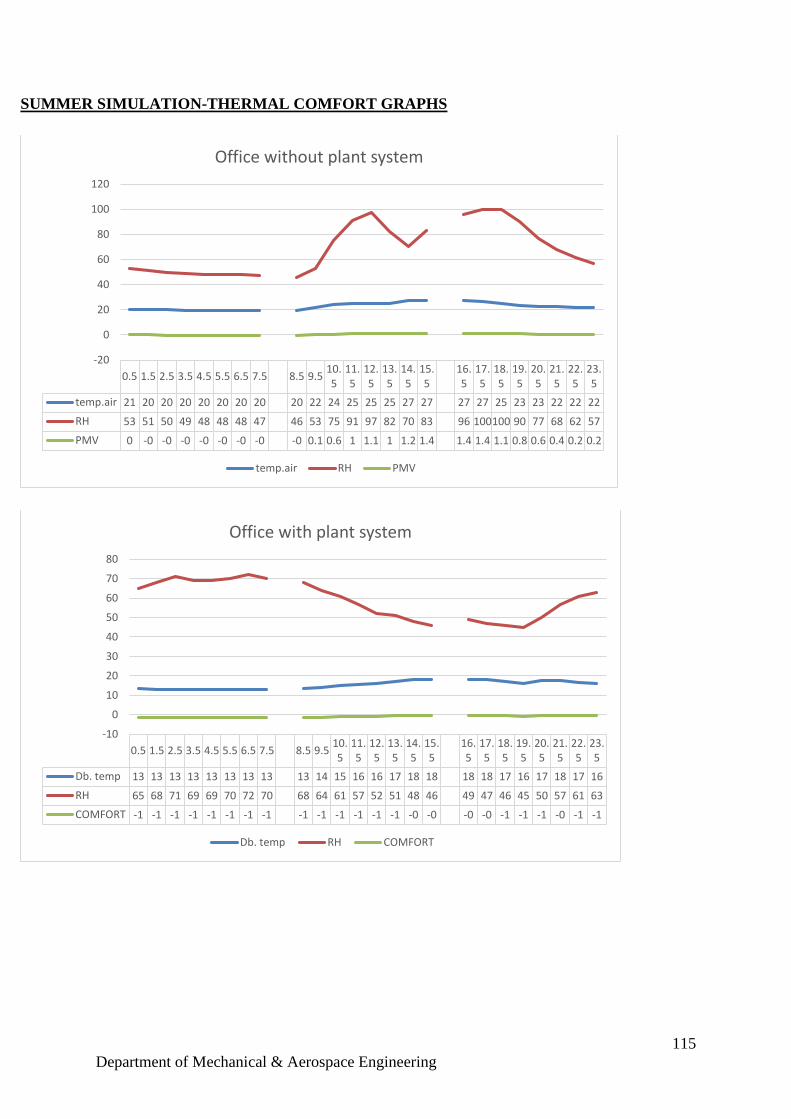
115
Department of Mechanical & Aerospace Engineering
SUMMER SIMULATION-THERMAL COMFORT GRAPHS
0.5 1.5 2.5 3.5 4.5 5.5 6.5 7.5 8.5 9.510.5
11.5
12.5
13.5
14.5
15.5
16.5
17.5
18.5
19.5
20.5
21.5
22.5
23.5
temp.air 21 20 20 20 20 20 20 20 20 22 24 25 25 25 27 27 27 27 25 23 23 22 22 22
RH 53 51 50 49 48 48 48 47 46 53 75 91 97 82 70 83 96 100100 90 77 68 62 57
PMV 0 -0 -0 -0 -0 -0 -0 -0 -0 0.1 0.6 1 1.1 1 1.2 1.4 1.4 1.4 1.1 0.8 0.6 0.4 0.2 0.2
-20
0
20
40
60
80
100
120
Office without plant system
temp.air RH PMV
0.5 1.5 2.5 3.5 4.5 5.5 6.5 7.5 8.5 9.510.5
11.5
12.5
13.5
14.5
15.5
16.5
17.5
18.5
19.5
20.5
21.5
22.5
23.5
Db. temp 13 13 13 13 13 13 13 13 13 14 15 16 16 17 18 18 18 18 17 16 17 18 17 16
RH 65 68 71 69 69 70 72 70 68 64 61 57 52 51 48 46 49 47 46 45 50 57 61 63
COMFORT -1 -1 -1 -1 -1 -1 -1 -1 -1 -1 -1 -1 -1 -1 -0 -0 -0 -0 -1 -1 -1 -0 -1 -1
-10
0
10
20
30
40
50
60
70
80
Office with plant system
Db. temp RH COMFORT
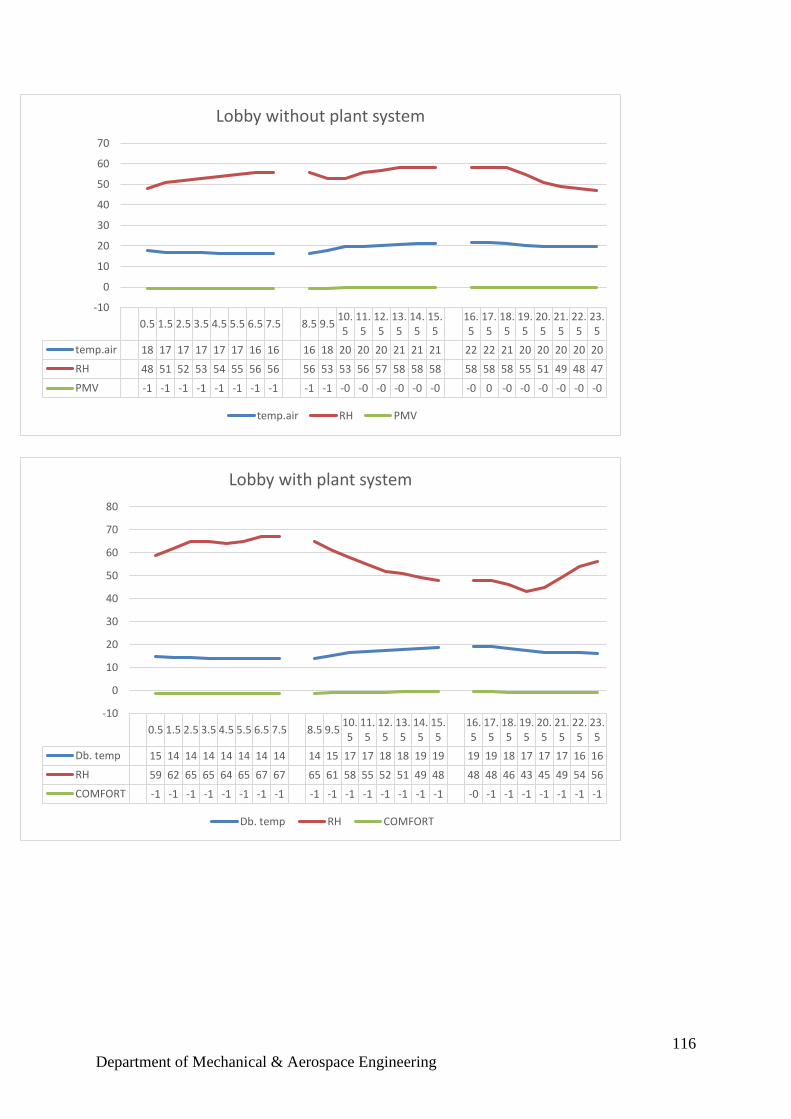
116
Department of Mechanical & Aerospace Engineering
0.5 1.5 2.5 3.5 4.5 5.5 6.5 7.5 8.5 9.510.5
11.5
12.5
13.5
14.5
15.5
16.5
17.5
18.5
19.5
20.5
21.5
22.5
23.5
temp.air 18 17 17 17 17 17 16 16 16 18 20 20 20 21 21 21 22 22 21 20 20 20 20 20
RH 48 51 52 53 54 55 56 56 56 53 53 56 57 58 58 58 58 58 58 55 51 49 48 47
PMV -1 -1 -1 -1 -1 -1 -1 -1 -1 -1 -0 -0 -0 -0 -0 -0 -0 0 -0 -0 -0 -0 -0 -0
-10
0
10
20
30
40
50
60
70
Lobby without plant system
temp.air RH PMV
0.5 1.5 2.5 3.5 4.5 5.5 6.5 7.5 8.5 9.510.5
11.5
12.5
13.5
14.5
15.5
16.5
17.5
18.5
19.5
20.5
21.5
22.5
23.5
Db. temp 15 14 14 14 14 14 14 14 14 15 17 17 18 18 19 19 19 19 18 17 17 17 16 16
RH 59 62 65 65 64 65 67 67 65 61 58 55 52 51 49 48 48 48 46 43 45 49 54 56
COMFORT -1 -1 -1 -1 -1 -1 -1 -1 -1 -1 -1 -1 -1 -1 -1 -1 -0 -1 -1 -1 -1 -1 -1 -1
-10
0
10
20
30
40
50
60
70
80
Lobby with plant system
Db. temp RH COMFORT
117
Department of Mechanical & Aerospace Engineering
REFERENCES
[1] Global hotel () HOTEL DATA, Available at: http://www.globalhoteldata.com (Accessed:
10th July 2013).
[2] Susan Aryee (2011) HOTEL MAINTENANCE MANAGEMENT, : .
[3] U.S. EPA. 2008. Inventory of U.S. Greenhouse Gases Emissions and Sinks: 1990-2006,
p. ES8
[4] H.E Burroughs, CIAQP, Shirley J.Hansen, PHD (2011) Managing Indoor Air Quality, 5th
edn
[5] Yuanhui zhang (2004) Indoor air quality, : .[5]
[6] Imperial Machine Corporation () IMC helps UK hotel to achieve carbon neutral goal,
Available at: http://www.imco.co.uk/ (Accessed: 10th July 2013).
[7] Thistle () Guoman Hotel Management (UK) Limited Achieves Carbon Trust Standard,
Available at: http://www.thistle.com/ (Accessed: 10th July 2013).
[8] Paulina Bohdaniwicz, Angela Churie-Kallhauge, Ivo Martinac (2001) 'Energy-Efficiency
and in Hotels Towards Sustainable Tourism', 4th International Symposium on Asia Pasific
architecture, Hawai'l, (), pp.
[9] Demand Media, Inc. (2013) Energy Saving Method in UK Hotels, Available at:
http://www.ehow.com/ (Accessed: 10th July 2013).
[10] Apex () APEX HOTELS CORPORATE & SOCIAL RESPONSIBILITY, Available at:
http://www.apexhotels.co.uk/ (Accessed: 10th July 2013).
[11] Maritim Hotels () Environment, Available at: http://www.maritim.com/ (Accessed: 10th
July 2013).
[12] GE lighting () Historic German Hotel Adlon Kempinski Checks In Deep Energy Savings
with GE LED Lamps, Available at: http://pressroom.gelighting.com/ (Accessed: 10th July
2013).
[13] The Orchid () Construction, Available at: http://www.orchidhotel.com/ (Accessed: 10th
July 2013).
118
Department of Mechanical & Aerospace Engineering
[14] India Hospitality Review (). The air around HVAC systems in Indian Hotels, Available
at: http://www.indiahospitalityreview.com (Accessed: 10th July 2013).
[15] WWF, Horwath HTL and HICAP (2010) TOWARDS THE BUSINESS CASE FOR
SUSTAINABLE HOTELS IN ASIA.
[16] ECO HOTEL () ENERGY MANAGEMENT, Available athttp://www.ecotelhotels.com/
(Accessed: 10th July 2013).
[17] Go Green () Environment and Sustainability, Available at: http://www.go-green.ae/
(Accessed: 10th July 2013).
[18] Fairmont () Luxury Hotel Brand Makes Progress Toward Reducing its Greenhouse Gas
Emissions by 20% as Part of WWF’s Climate Savers program -, Available at:
http://www.fairmont.com/ (Accessed: 10th July 2013).
[19] PR Newswire () Luxury Five-Star Hotel in Dubai Selects Telkonet's EcoSmart Energy
Management Technology, Available at: http://www.prnewswire.com/ (Accessed: 10th July
2013).
[20] Alto Hotel () 1200 Buildings, Availableat: http://www.melbourne.vic.gov.au/ (Accessed:
10th July 2013).
[21] WWF, Horwath HTL and HICAP (2010) TOWARDS THE BUSINESS CASE FOR
SUSTAINABLE HOTELS IN ASIA, : .
[22] Green Hotlier () Green Hotel Shower Solutions, Available at:
http://www.greenhotelier.org/ (Accessed: 10th July 2013).
[23] LEED and Hotels (2009) PRACTICAL STRATEGIES in Green Building, : .
[24] EPA () Indoor Air Pollution: An Introduction for Health Professionals, Available at:
http://www.epa.gov/ (Accessed: 14th July 2013).
[25] Environmental Protection Agency (1991) 'Indoor Air Facts No. 4 Sick Building
Syndrome', , (), pp. .
[26] NHS () Sick building syndrome, Available at: http://www.nhs.uk/ (Accessed: 18th July
2013).
119
Department of Mechanical & Aerospace Engineering
[27] Mark C. Gillott B (2000) A NOVEL MECHANICAL VENTILATION HEAT
RECOVERYIHEAT PUMP SYSTEM, : The University of Nottingam.
[28] London Electricity (), Breathing life into today's homes - the benefits of whole house
ventilation. London Electricity, London, UK.
[29] Centers For Disease Control And Prevention () NDOOR ENVIRONMENTAL
QUALITY, Available at: http://www.cdc.gov (Accessed: 18th July 2013).
[30] Canadian Center For Occupational Health And Safety () Indoor Air Quality - Moulds
and Fungi, Available at: http://www.ccohs.ca/ (Accessed: 19th July 2013).[31]
[31] Royal Borough of Kensington and Chelsea () Indoor air pollutants and health effects,
Available at: http://www.rbkc.gov.uk/ (Accessed: 21th July 2013 ). [31]
[32] COMMUNITY ACTION TO FIGHT ASTHMA () Asthma and Indoor Air Quality in
the Home: Dust Mites, Available at: http://hydra.usc.edu (Accessed: 28th July 2013).
[33] Rabbit Air () Dust Mite Allergy, Available at: http://www.rabbitair.com (Accessed: 29th
July 2013).
[34] American Lung Association: Fighting for air () Dust Mites and Dust, Available at:
http://www.lung.org (Accessed: 30th July 2013).[36]
[35] Canadian Center for Occupational Health And Safety () Environmental Tobacco Smoke
(ETS):
[36] General Information and Health Effects Available at: http://www.ccohs.ca/ (Accessed:
1st August 2013). 37
[37] EPA () Indoor Air Pollution: An Introduction for Health Professionals, Available at:
http://www.epa.gov/ (Accessed: 1st August 2013). 39
[31] Royal Borough of Kensington and Chelsea () Indoor air pollutants and health effects,
Available at: http://www.rbkc.gov.uk/ (Accessed: 1st August 2013).
[38] Connecticut Department of Public Health () Healthy Homes: Indoor Air Quality,
Available at: http://www.ct.gov/ (Accessed: 2nd August 2013 ).
120
Department of Mechanical & Aerospace Engineering
[39] The Lung Association () Pollution & air quality, Available
at: http://www.lung.ca/(Accessed: 2nd August 2013 ).
[40] EPA () An Introduction to Indoor Air Quality (IAQ) Nitrogen Dioxide (NO2), Available
at: http://www.epa.gov/ (Accessed: 2nd August 2013)
[41] Department of Health () VOCs (Volatile Organic Compounds), Available at:
http://healthvermont.gov/ (Accessed: )
[42] (Minnesota Department of Health) Volatile Organic Compounds in Your Home,
Available at: http://www.health.state.mn.us/ (Accessed: ).
[43] Wuncheng ang, Jerald L. Schnoor, Jon Doi (1996) Volatile Organic Compounds in the
Environment, 1st edn., Canada: Library of congress cataloging.
[44] Greenspec () Refurbishment / retrofit: Whole house ventilation, Available
at:http://www.greenspec.co.uk (Accessed: ).
[45] Steven, R. K., Parkins, L. M., Woolliscrofi, M., (1994). Passive stack ventilation
systems: design and installation. Information paper IP13/94. Garston, UK, BRE.
[46] DoE, (March 1996). Domestic ventilation. General Information. Leaflet 9,
[47] Best Practice Programme. UK, HMSO.
[48] Envirovent () A guide to ventilation for self-builders, Available at:
http://www.homeventilation.co.uk (Accessed: ).
[49] Greenspec () Refurbishment / retrofit: Whole house ventilation, Available at:
http://www.greenspec.co.uk (Accessed: ).
[50] PAUL heat recovery scotland () MVHR, Available
at:http://www.paulheatrecovery.co.uk/ (Accessed: ).
[51] Meathvec () Mechanical Ventilation and Heat Recovery System, Available at:
portal.meathvec.ie/ (Accessed: ).59
[52] Robert Lowe & David Johnston (1997) 'A FIELD TRIAL OF MECHANICAL
VENTILATION WITH HEAT RECOVERY IN LOCAL AUTHORITY, LOW-RISE
121
Department of Mechanical & Aerospace Engineering
HOUSING', Centre for the Built Environment Faculty of Health and Environment Leeds
Metropolitan University Brunswick Building, (), pp.
[53] WW 2010 University of Illoinois () Relative Humidity, Available at:
http://ww2010.atmos.uiuc.edu/ (Accessed: ).
[54] David E. Watkins (2011) Heating Services in Buildings, 1st edn., UK: Wiley-Blackwell.
[55] DESIGNING BUILDINGS WIKI () THERMAL COMFORT IN
BUILDINGS, Available at:http://www.designingbuildings.co.uk/ (Accessed: ).
[56] Kostas Pavlou (2009) Thermal comfort in buildings, : .
[57] Health and Safety Executive () Thermal Comfort, Available
at: http://www.hse.gov.uk(Accessed: ).
[58] Arizona State University () Visualizing Thermal Comfort, Available at:
http://support.caed.asu.edu/ (Accessed: ).
[59] Xetex (2009) Air-to-Air Cross Flow Flat Plate Heat Exchangers, : .
[60] Ian Ball (2003) Evaluation of air to air cross flow plate heat exchanger exchanging using
a new heat recovery facility, :
[61] ECONOVENT () Rotary heat exchangers, Available at: http://www.flaktwoods.co.uk/
(Accessed: )
[62] SMART HEAT () Enervent Heat Recovery Systems, Available
at:http://homeenergysaving.ie/ (Accessed: )
[63] Food Tech Info () Air to Air Heat Exchanger, Available
at: http://www.foodtechinfo.com/(Accessed: ).
[64] Clean my Furnace () Outdoor air sources, Available
at: http://cleanmyfurnace.com/(Accessed: ).
[65] Heritage House () Managing and Understanding condensation in buildings, Available
at: http://www.heritage-house.org/ (Accessed: ).
[66] Raven housing trust () Damp and condensation, Available
at:http://www.ravenht.org.uk/ (Accessed: ).

122
Department of Mechanical & Aerospace Engineering
[67] Ear, Nose and Throat Aliance () Dust Mite Allergens, Available
at:http://www.allianceent.net/ (Accessed: ).
[68] Buzzle () Facts about passive smoking, Available at: http://www.buzzle.com/ (Accessed:
).
[69] Center for Environment, Commerce & Energy () EPA Proposes To Retain Carbon
Monoxide Standard, Available at: http://cenvironment.blogspot.co.uk/ (Accessed: ).
[70] Attack Asthma () nitrogen dioxide, Available at: http://www.noattacks.org/ (Accessed: ).