Embed Size (px)
Citation preview
1
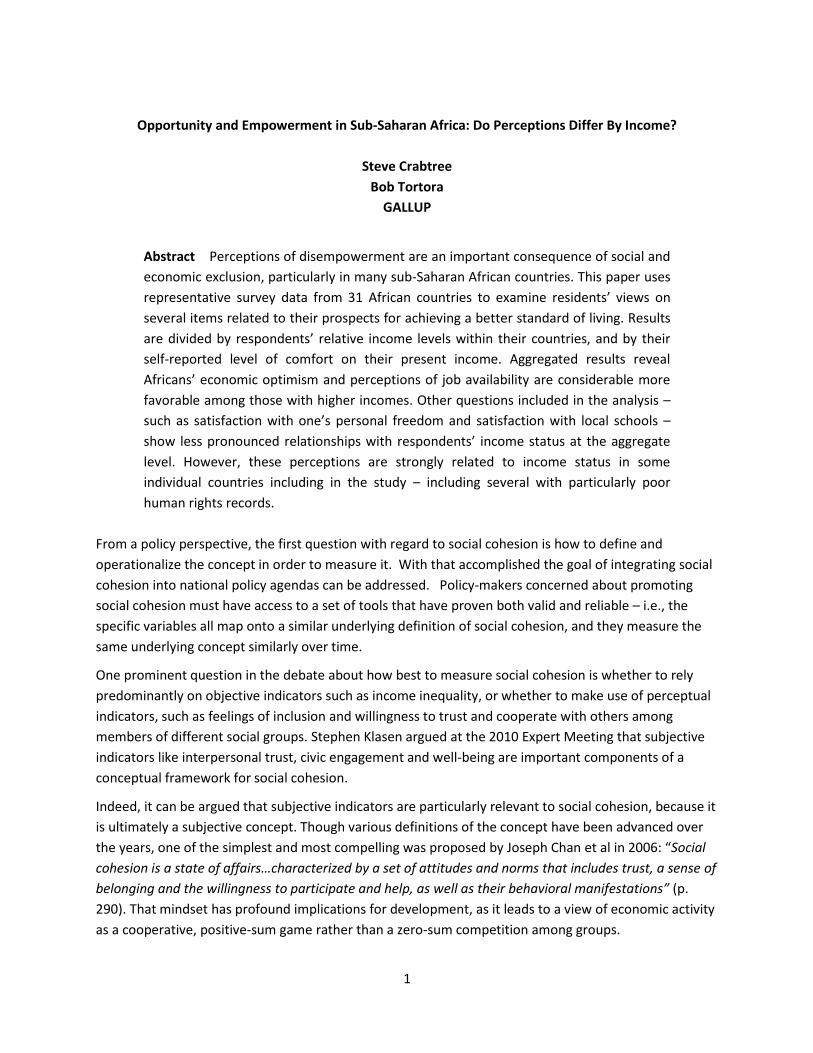
Opportunity and Empowerment in Sub-Saharan Africa: Do Perceptions Differ By Income?
Steve Crabtree
Bob Tortora
GALLUP
Abstract Perceptions of disempowerment are an important consequence of social and
economic exclusion, particularly in many sub-Saharan African countries. This paper uses
representative survey data from 31 African countries to examine residents’ views on
several items related to their prospects for achieving a better standard of living. Results
are divided by respondents’ relative income levels within their countries, and by their
self-reported level of comfort on their present income. Aggregated results reveal
Africans’ economic optimism and perceptions of job availability are considerable more
favorable among those with higher incomes. Other questions included in the analysis –
such as satisfaction with one’s personal freedom and satisfaction with local schools –
show less pronounced relationships with respondents’ income status at the aggregate
level. However, these perceptions are strongly related to income status in some
individual countries including in the study – including several with particularly poor
human rights records.
From a policy perspective, the first question with regard to social cohesion is how to define and
operationalize the concept in order to measure it. With that accomplished the goal of integrating social
cohesion into national policy agendas can be addressed. Policy-makers concerned about promoting
social cohesion must have access to a set of tools that have proven both valid and reliable – i.e., the
specific variables all map onto a similar underlying definition of social cohesion, and they measure the
same underlying concept similarly over time.
One prominent question in the debate about how best to measure social cohesion is whether to rely
predominantly on objective indicators such as income inequality, or whether to make use of perceptual
indicators, such as feelings of inclusion and willingness to trust and cooperate with others among
members of different social groups. Stephen Klasen argued at the 2010 Expert Meeting that subjective
indicators like interpersonal trust, civic engagement and well-being are important components of a
conceptual framework for social cohesion.
Indeed, it can be argued that subjective indicators are particularly relevant to social cohesion, because it
is ultimately a subjective concept. Though various definitions of the concept have been advanced over
the years, one of the simplest and most compelling was proposed by Joseph Chan et al in 2006: “Social
cohesion is a state of affairs…characterized by a set of attitudes and norms that includes trust, a sense of
belonging and the willingness to participate and help, as well as their behavioral manifestations” (p.
290). That mindset has profound implications for development, as it leads to a view of economic activity
as a cooperative, positive-sum game rather than a zero-sum competition among groups.
2
It is beyond the scope of this paper to advocate any definitive approach to measuring social cohesion.
However, it is our hope to offer insights using Gallup’s cross-country survey data in one area that
represents a critical subjective outcome of social cohesion: feelings of empowerment and self-efficacy
among those at different income levels within a society. We focus specifically on data gathered between
2008 and 2010 in 31 countries in sub-Saharan Africa.
Sense of Empowerment
Among the most commonly stated concerns regarding the global shift in wealth from West to East is
that the rising income inequality that often accompanies economic growth will weaken social cohesion
and generate instability. One critical factor under such circumstances is residents’ perceptions of
economic inclusion and of their own ability to make a better life for themselves within the existing social
and institutional framework. As Bernd Eisenblätter stated at the 2010 Expert Meeting, “Inclusion
requires not only an improvement in conditions of access to economic, social and political options, but
also an effort to increase the self-determination of the actors involved.”
In particular, there is a need to work against a sense of fatalism among those trapped in poverty, and
toward a sense that individual initiative will be rewarded. Recent years have a seen a wave of criticism
against the current international development regime, partly on the grounds that aid resources often do
little to promote self-sufficiency, and in some cases have fostered a sense of dependency among the
very poor. The critics have included some Africans themselves, such as Zambian-born economist
Dambisa Moyo (2009) and Kenyan Nobel Laureate Wangari Maathai. Maathai recently wrote that:
Disempowerment – whether defined in terms of a lack of self-confidence, apathy, fear,
or an inability to take charge of one’s own life – is perhaps the most unrecognized
problem in Africa today. I have found [this syndrome] to be as substantial a bottleneck
to development in Africa as inadequate infrastructure or bad governance, and it has
added an extra weight to the work of those who want to enable individuals and
communities to better their circumstances (2009).
This paper focuses on sub-Saharan Africans’ responses to several questions from the Gallup World Poll
that may be indicative of their sense of exclusion from economic opportunities. These include the
following:
Economic optimism and perceptions of job availability;
Satisfaction with their freedom to do what they wish with their lives – a variable that renowned
economist Amaryta Sen has placed at the center of economic development;
Perception that it is possible to “get ahead” in their country through their own hard work;
Satisfaction with local education systems, which broaden the capability set of those in
disadvantaged social groups and allow them to seize opportunities for economic advancement.
For this paper, we chose to focus on income inequality as one form of social fault line. For practical
purposes, relative income levels were used as a metric that is consistently collected in all countries and
provides a reasonable basis for cross-country comparisons. However, this focus is in no way intended to

3
minimize other sources of division that have contributed to economic stagnation and often tragic
conflict in Africa. These include ethnic/tribal differences, gender differences, and religious differences
(particularly in northern Africa where countries often have sizable Christian and Muslim communities).
In many cases, these divisions are intertwined with one another and with differences among economic
classes.
For each question of interest in this report, results are divided by respondents’ relative income quintiles
within their own countries. However, given the fact that some residents in African countries have
difficulty estimating their household income in numerical terms, results for each indicator are also
divided by respondents’ self-reported comfort level on their own income. The question used for this
purpose is as follows:
Which one of these phrases comes closest to your own feelings about your household’s
income these days: Are you living comfortably on your present income, getting by on
your present income, finding it difficult on your present income, or finding it very
difficult on your present income?
In most cases, the results produced by using this item as a proxy for income are similar to those seen
using actual income measures.
Results from 30 of the 31 sub-Saharan countries studied are based on nationally representative samples
of 1000 residents. The lone exception is Cameroon, where the sample size was 1,200. All surveys were
conducted between June 2008 and September 2010. For the purposes of this paper, each country is
given equal weight in the aggregated regional results regardless of population size, so that each political
and institutional environment is given equal representation.
Economic Optimism and Perceptions of Job Availability
In countries experiencing widening income inequality, policies encouraging social mobility – such as
those that promote the equitable distribution of public goods and access to economic opportunities –
are intended to prevent the hardening of boundaries between those at different ends of the income
spectrum. However, in sub-Saharan Africa patterns of income inequality are often entrenched,
preserved in many countries by an institutional logic that seeks to redistribute resources to political
elites rather than promote broad-based economic development (North et al, 2006). As noted in Milly
Odongo’s 2010 presentation on social cohesion efforts in Kenya, “To reduce exclusion requires
willingness to give up the benefits of excluding and marginalizing groups in society” (Expert Meeting
report, p. 12).
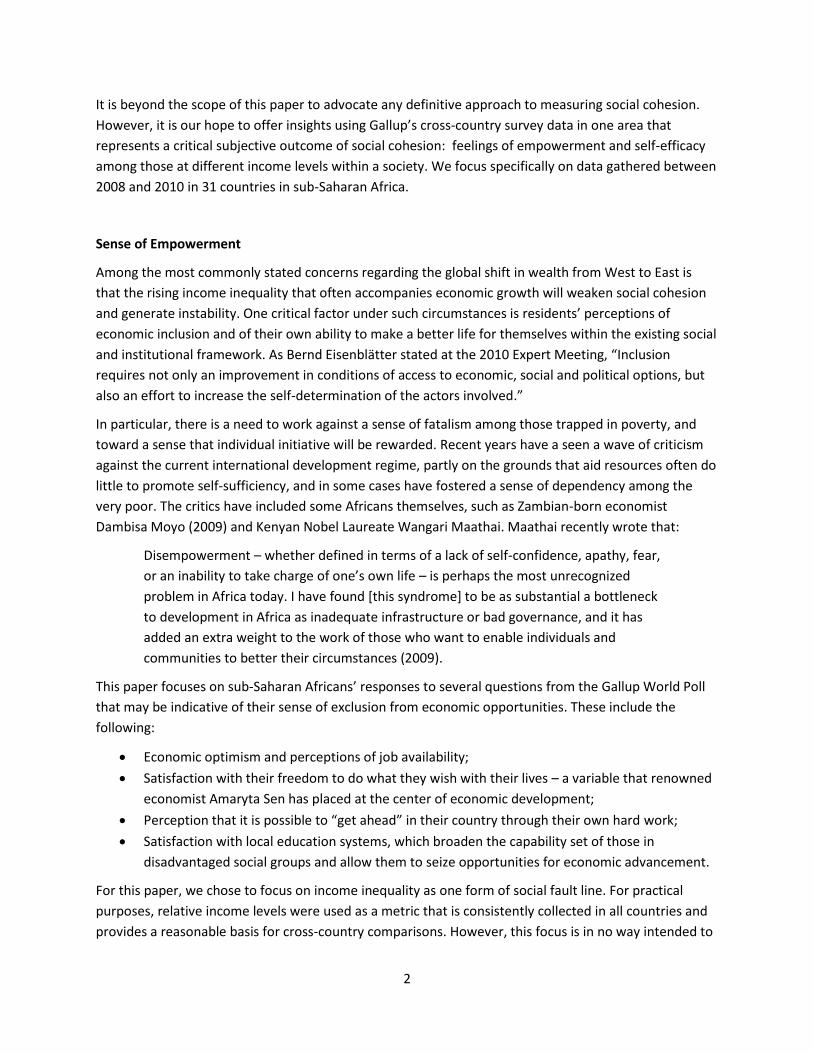
Gallup’s recent data from sub-Saharan Africa support the notion that in most countries economic classes
are diverging rather than converging. Across 31 African countries surveyed between 2008 and 2010,
one-third of respondents in the poorest 20% within their countries felt their standard of living was
improving, vs. a majority of those in the top 20%.
4
A similar pattern is seen when the results are divided according to respondents’ self-reported level of
comfort on their present income.
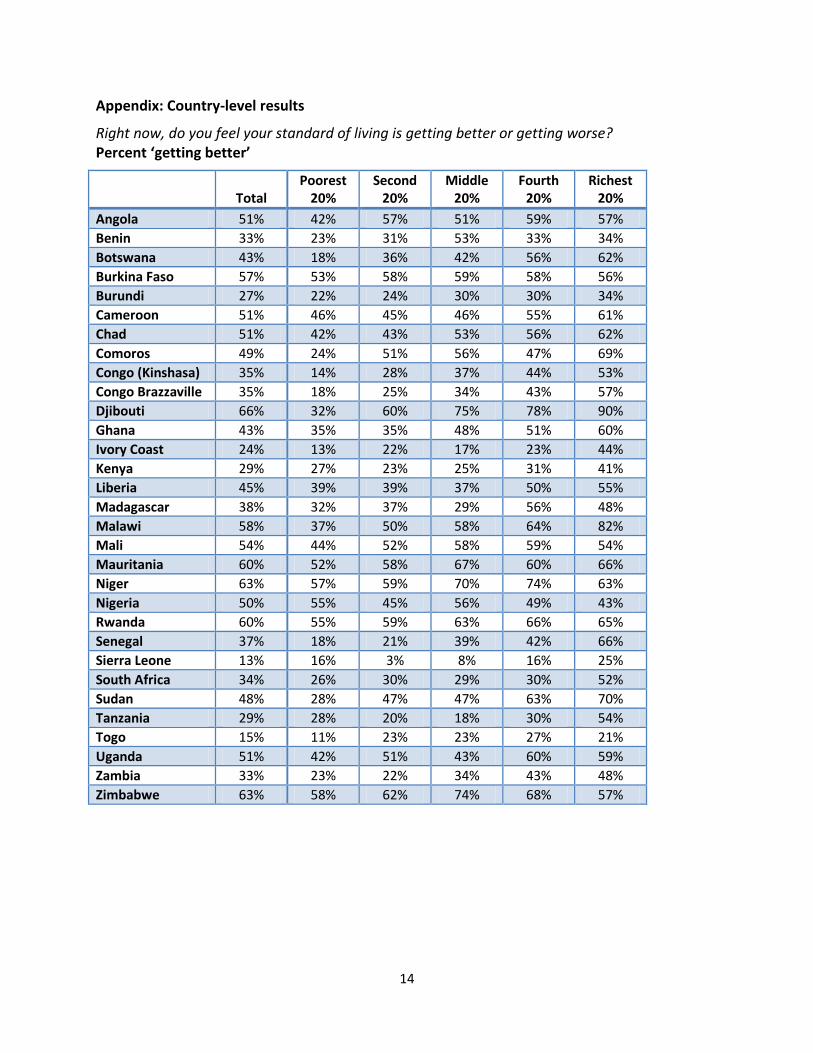
These differences are more pronounced in some countries than in others. In the Democratic Republic of
the Congo, where economic development has been hampered by continual violence and rampant
government corruption, just 14% of the poorest residents say their standard of living is improving, vs.
53% of the richest residents. However, divergent economic perceptions are also found in more stable,
democratic African countries. In Botswana, often held up as a model of good governance and prudent
economic policies, 18% of residents in the country’s bottom income quintile say their standard of living
is improving, vs. 62% of those in the top quintile. Inclusive growth and the emergence of a large, stable
5
middle class can be elusive even with relatively strong, accountable institutions. (See page 13 for
country-level results.)
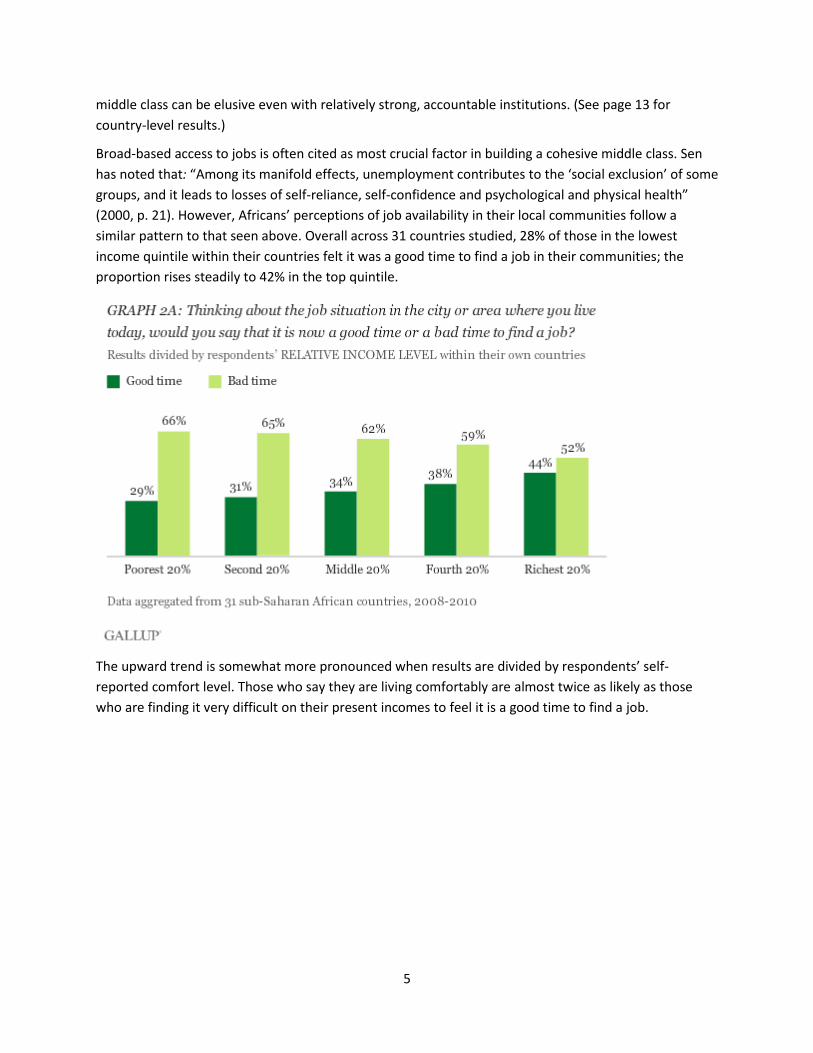
Broad-based access to jobs is often cited as most crucial factor in building a cohesive middle class. Sen
has noted that: “Among its manifold effects, unemployment contributes to the ‘social exclusion’ of some
groups, and it leads to losses of self-reliance, self-confidence and psychological and physical health”
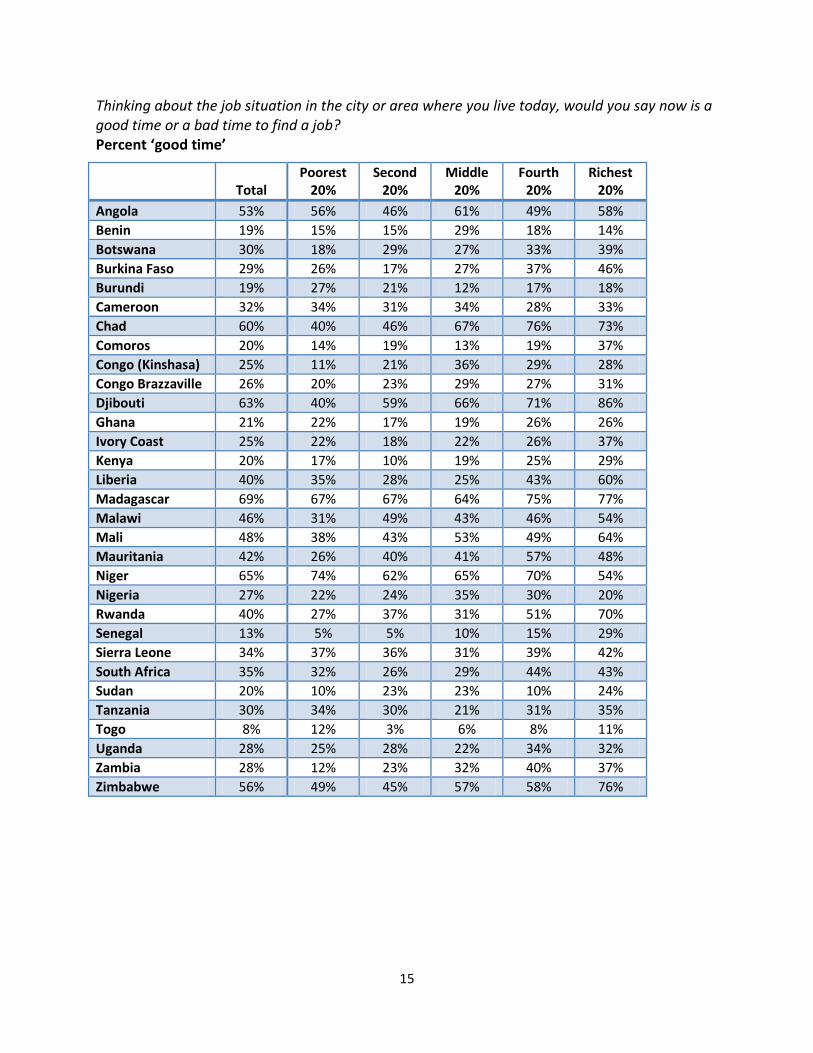
(2000, p. 21). However, Africans’ perceptions of job availability in their local communities follow a
similar pattern to that seen above. Overall across 31 countries studied, 28% of those in the lowest
income quintile within their countries felt it was a good time to find a job in their communities; the
proportion rises steadily to 42% in the top quintile.
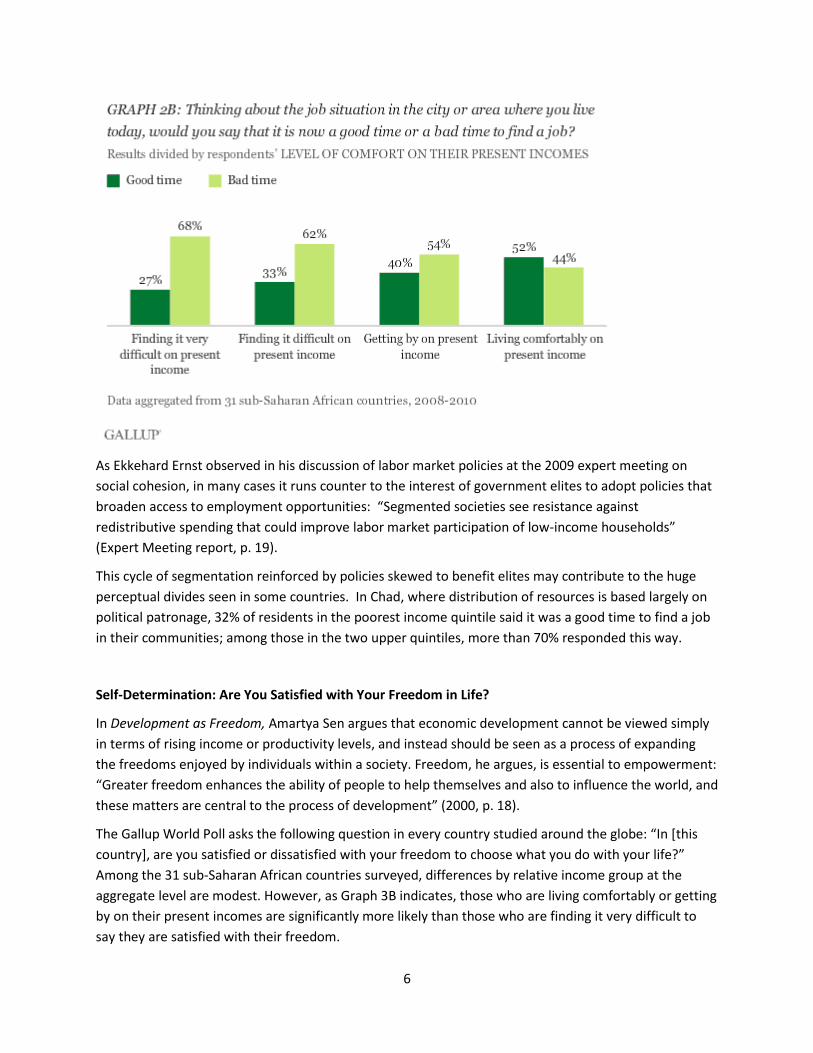
The upward trend is somewhat more pronounced when results are divided by respondents’ self-
reported comfort level. Those who say they are living comfortably are almost twice as likely as those
who are finding it very difficult on their present incomes to feel it is a good time to find a job.
6
As Ekkehard Ernst observed in his discussion of labor market policies at the 2009 expert meeting on
social cohesion, in many cases it runs counter to the interest of government elites to adopt policies that
broaden access to employment opportunities: “Segmented societies see resistance against
redistributive spending that could improve labor market participation of low-income households”
(Expert Meeting report, p. 19).
This cycle of segmentation reinforced by policies skewed to benefit elites may contribute to the huge
perceptual divides seen in some countries. In Chad, where distribution of resources is based largely on
political patronage, 32% of residents in the poorest income quintile said it was a good time to find a job
in their communities; among those in the two upper quintiles, more than 70% responded this way.
Self-Determination: Are You Satisfied with Your Freedom in Life?
In Development as Freedom, Amartya Sen argues that economic development cannot be viewed simply
in terms of rising income or productivity levels, and instead should be seen as a process of expanding
the freedoms enjoyed by individuals within a society. Freedom, he argues, is essential to empowerment:
“Greater freedom enhances the ability of people to help themselves and also to influence the world, and
these matters are central to the process of development” (2000, p. 18).
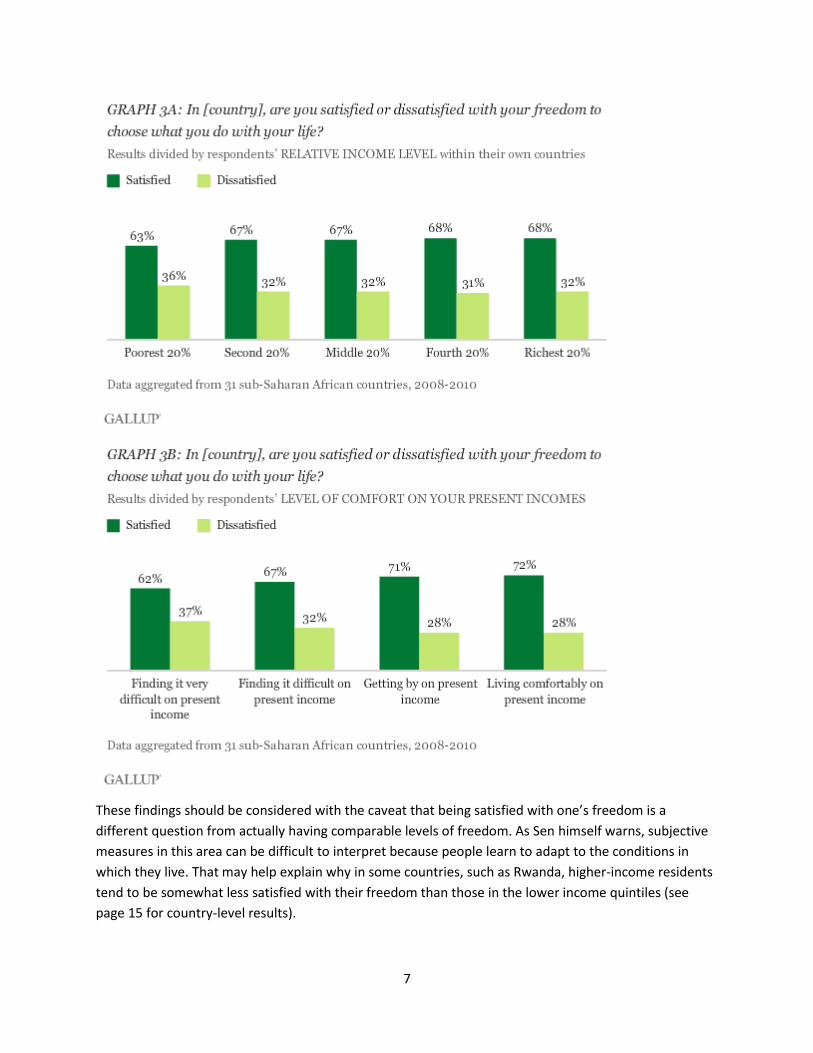
The Gallup World Poll asks the following question in every country studied around the globe: “In *this
country], are you satisfied or dissatisfied with your freedom to choose what you do with your life?”
Among the 31 sub-Saharan African countries surveyed, differences by relative income group at the
aggregate level are modest. However, as Graph 3B indicates, those who are living comfortably or getting
by on their present incomes are significantly more likely than those who are finding it very difficult to
say they are satisfied with their freedom.
7
These findings should be considered with the caveat that being satisfied with one’s freedom is a
different question from actually having comparable levels of freedom. As Sen himself warns, subjective
measures in this area can be difficult to interpret because people learn to adapt to the conditions in
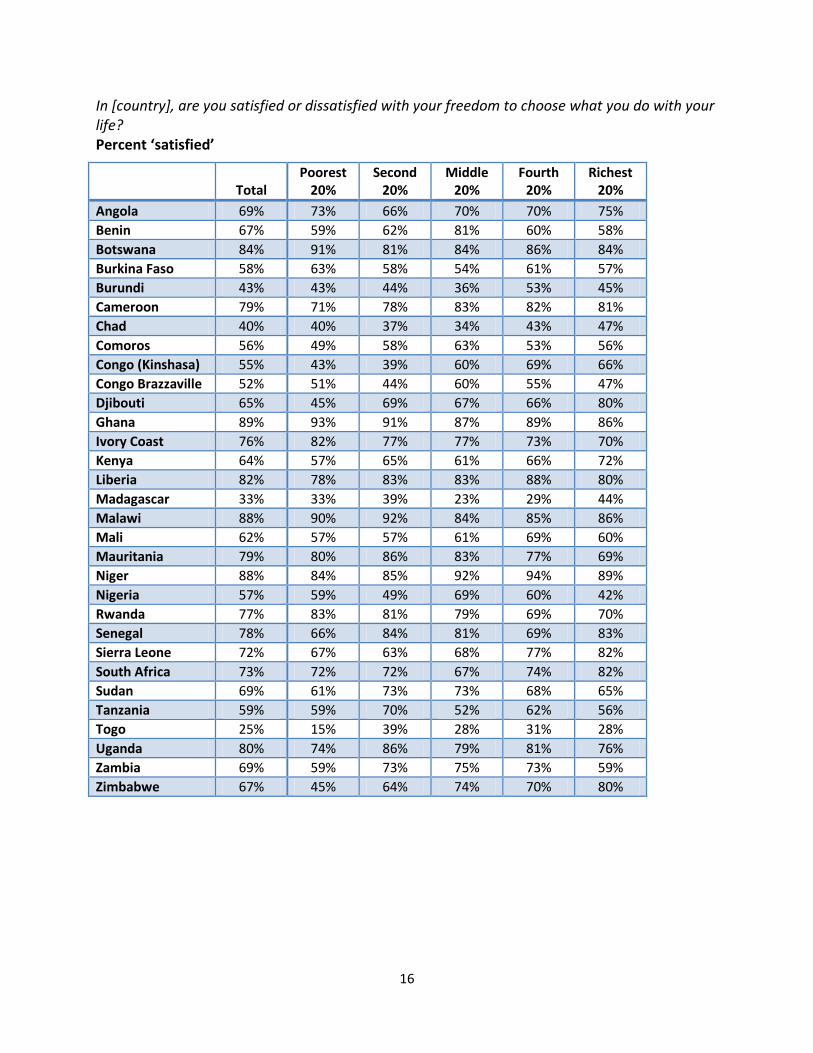
which they live. That may help explain why in some countries, such as Rwanda, higher-income residents
tend to be somewhat less satisfied with their freedom than those in the lower income quintiles (see
page 15 for country-level results).
8
Nonetheless, higher-income residents are clearly more likely to be satisfied with their freedom in some
countries where human rights violations are most flagrant. In Zimbabwe and the Democratic Republic of
the Congo – the two countries at the very bottom of the UNDP’s Human Development rankings for 2010
– satisfaction trends up sharply by income level. Fewer than half of Zimbabweans in the lowest income
quintile (45%) are satisfied with their freedom to do what they want with their lives; among the top
quintile 80% are satisfied. Many of those in the latter group may be members of the Mugabe’s ZANU-PF
party.
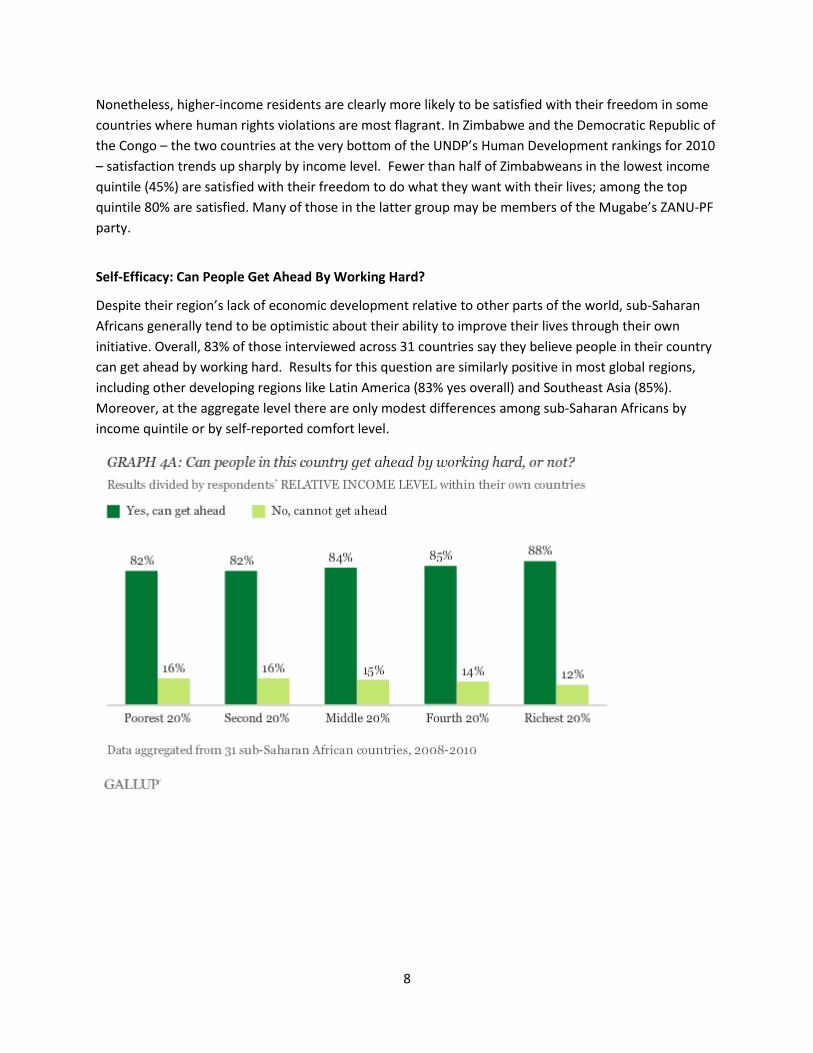
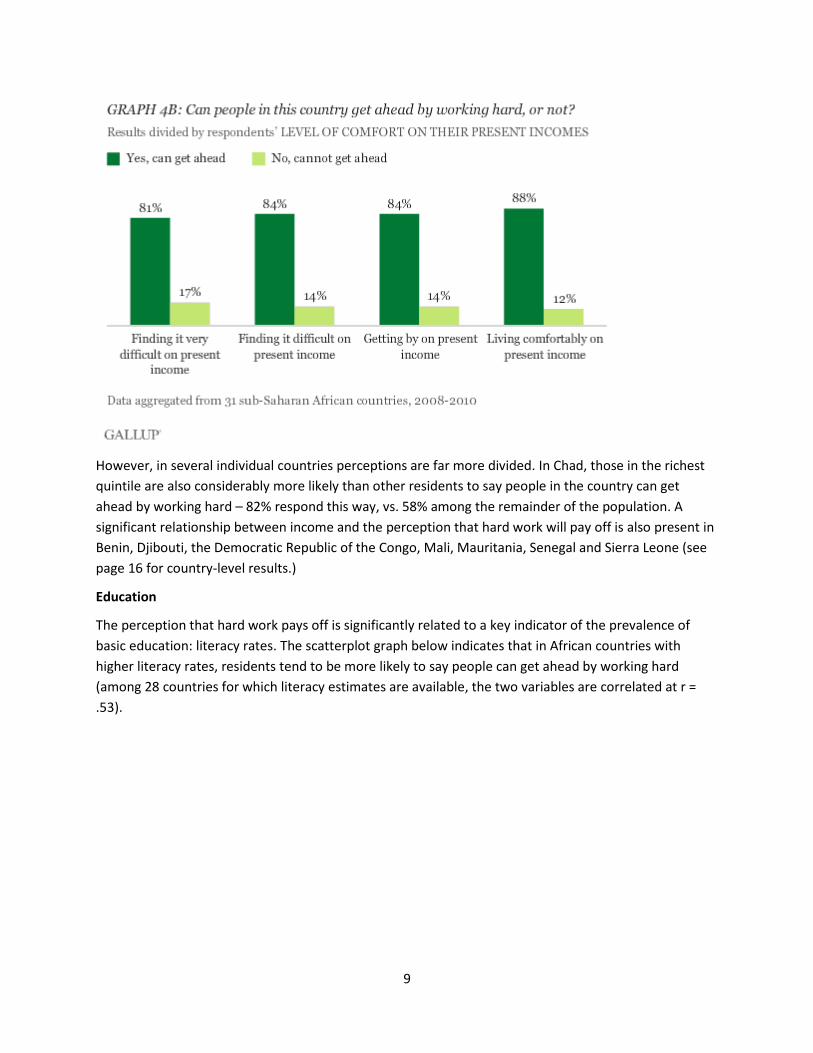
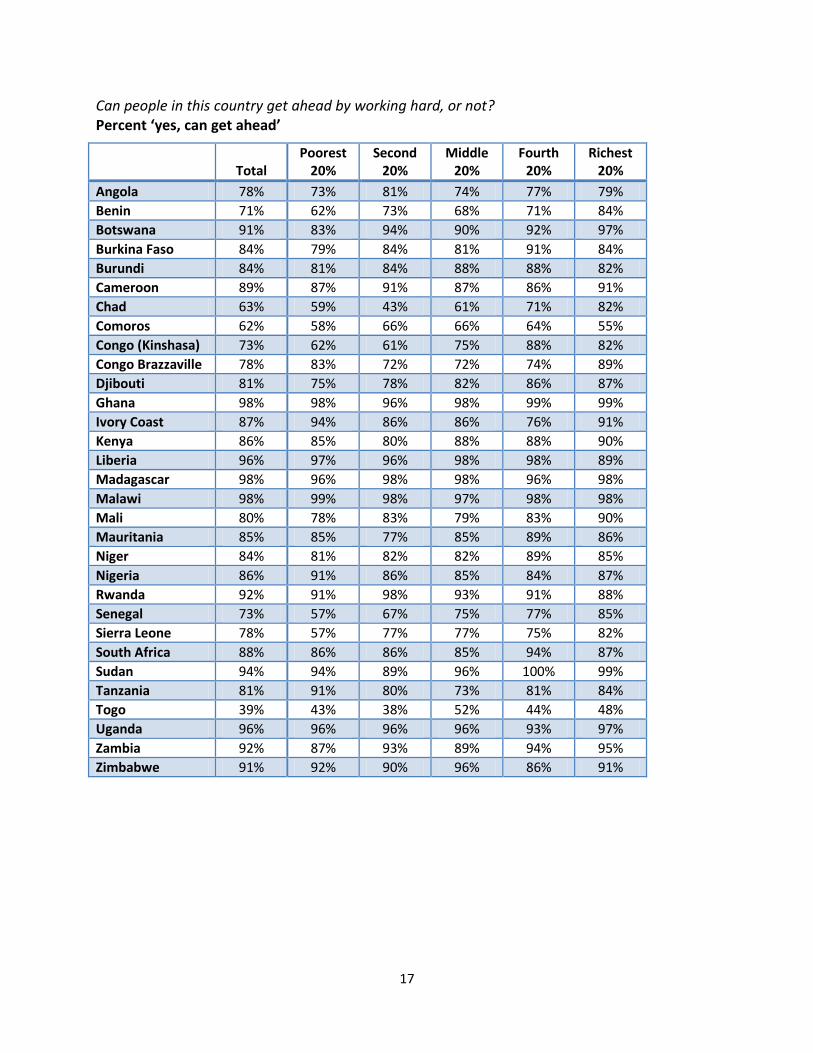
Self-Efficacy: Can People Get Ahead By Working Hard?
Despite their region’s lack of economic development relative to other parts of the world, sub-Saharan
Africans generally tend to be optimistic about their ability to improve their lives through their own
initiative. Overall, 83% of those interviewed across 31 countries say they believe people in their country
can get ahead by working hard. Results for this question are similarly positive in most global regions,
including other developing regions like Latin America (83% yes overall) and Southeast Asia (85%).
Moreover, at the aggregate level there are only modest differences among sub-Saharan Africans by
income quintile or by self-reported comfort level.
9
However, in several individual countries perceptions are far more divided. In Chad, those in the richest
quintile are also considerably more likely than other residents to say people in the country can get
ahead by working hard – 82% respond this way, vs. 58% among the remainder of the population. A
significant relationship between income and the perception that hard work will pay off is also present in
Benin, Djibouti, the Democratic Republic of the Congo, Mali, Mauritania, Senegal and Sierra Leone (see
page 16 for country-level results.)
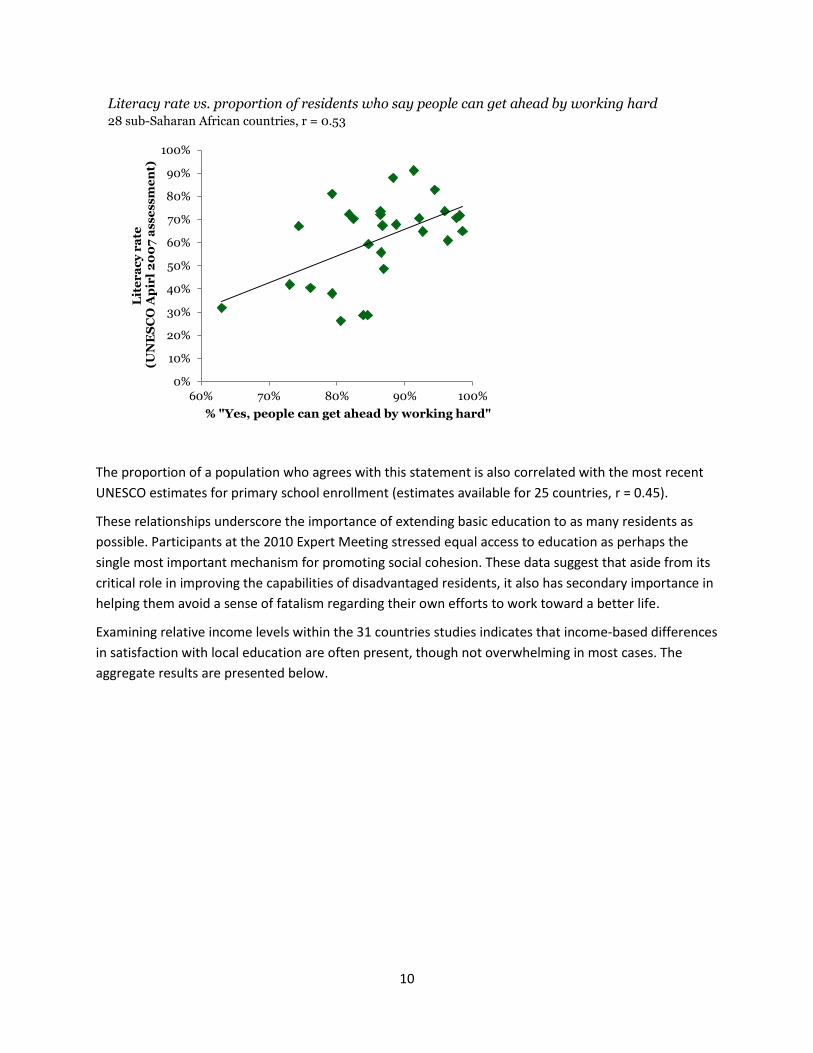
Education
The perception that hard work pays off is significantly related to a key indicator of the prevalence of
basic education: literacy rates. The scatterplot graph below indicates that in African countries with
higher literacy rates, residents tend to be more likely to say people can get ahead by working hard
(among 28 countries for which literacy estimates are available, the two variables are correlated at r =
.53).
10
Literacy rate vs. proportion of residents who say people can get ahead by working hard 28 sub-Saharan African countries, r = 0.53
The proportion of a population who agrees with this statement is also correlated with the most recent
UNESCO estimates for primary school enrollment (estimates available for 25 countries, r = 0.45).
These relationships underscore the importance of extending basic education to as many residents as
possible. Participants at the 2010 Expert Meeting stressed equal access to education as perhaps the
single most important mechanism for promoting social cohesion. These data suggest that aside from its
critical role in improving the capabilities of disadvantaged residents, it also has secondary importance in
helping them avoid a sense of fatalism regarding their own efforts to work toward a better life.
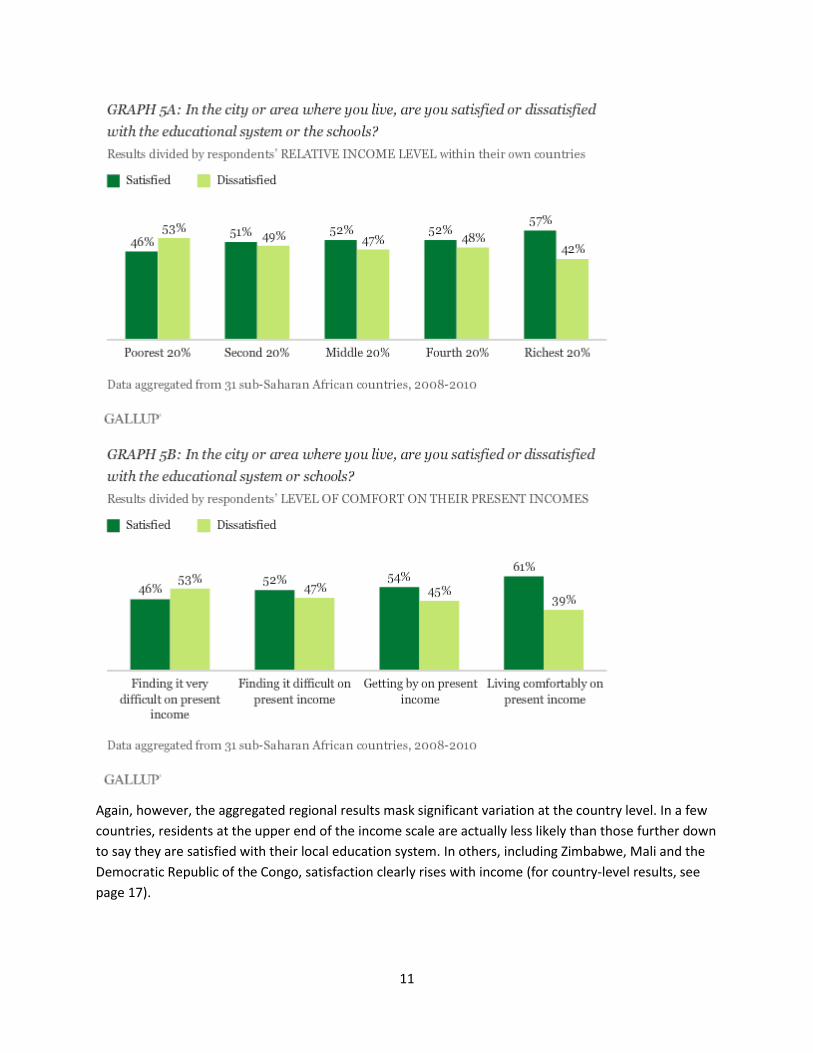
Examining relative income levels within the 31 countries studies indicates that income-based differences
in satisfaction with local education are often present, though not overwhelming in most cases. The
aggregate results are presented below.
0%
10%
20%
30%
40%
50%
60%
70%
80%
90%
100%
60% 70% 80% 90% 100%
Lit
er
ac
y r
ate
(
UN
ES
CO
Ap
irl
20
07
asse
ssm
en
t)
% "Yes, people can get ahead by working hard"
11
Again, however, the aggregated regional results mask significant variation at the country level. In a few
countries, residents at the upper end of the income scale are actually less likely than those further down
to say they are satisfied with their local education system. In others, including Zimbabwe, Mali and the
Democratic Republic of the Congo, satisfaction clearly rises with income (for country-level results, see
page 17).
12
Conclusion
The focus of this paper has been on perceptual divides among those at different income levels within
counties. Such divisions are clearly present at the aggregate level on some measures, but on others
there tends to be relatively little variation within countries, but greater variation between countries.
Countries where empowerment-related views tend to be consistently more favorable among those with
higher income include some where human rights violations and political patronage have been most
flagrant. The results suggest that the development of tools to systematically measure social cohesion
can add to the evidence that oppressive or unresponsive regimes generate instability and block inclusive
growth.
However, it should also be acknowledged that these results address just one concept – economic
inclusion and empowerment – associated with social cohesion. Many practitioners attempting to
operationalize the concept from a policy standpoint have adopted a pluralistic approach incorporating
several facets. For example, the Council of Europe’s Methodological Guide for the Concerted
Development of Social Cohesion Indicators includes the following areas for the analysis of public action:
1. Ability of society to ensure equity in the enjoyment of rights and in access to fundamental rights 2. Ability of society to ensure dignity and recognition of diversity 3. Ability of society to ensure autonomy and personal development 4. Ability of society to ensure participation and involvement
Within this framework, the findings presented in this paper would fall predominantly under the third
area.
Whichever approach is used, however, there seems to a general consensus that reliable perceptual
measures are needed to truly gauge the outcomes of any policy intervention aimed at promoting social
cohesion. That is because, such interventions are ultimately intended to change the views of
experiences of disparate members of society. As Ana Sojo has noted, “A sense of belonging to society is
an essential component of the various definitions of social cohesion. It is ultimately a subjective factor,
consisting of the perceptions, value judgments and attitudes of the members of society” (2010, p. 2).
References
Chan, J., To, H. & Chan, E. (2006). Reconsidering Social Cohesion: Developing a Definition and Analytical Framework for Empirical Research. Social Indicators Research, 75: 273-302.
Ernst, E. (2010). Policies for social cohesion: Labor markets. Presentation at the Expert Meeting on Perspectives on Global Development 2010, Social Cohesion.
Kunene, Z. (2009). Social Cohesion: A South African Perspective. Matthew Goniwe School of Leadership and Governance, Johannesburg.
Maathai, W. (2009). “An African Future: Beyond the Culture of Dependency”, Retrieved December 27, 2010 at www.opendemocracy.net/article/an-african-future-beyond-the-culture-of-dependency.
Moyo, D. (2009). Dead Aid: Why Aid Is Not Working and How There Is a Better Way for Africa. New York: Farrar, Strauss & Giroux.
North, D. (2005). Understanding the Process of Economic Change. Princeton: Princeton University Press.
13
North, D., Wallis, J. & Weingast, B. (2006). Violence and Social Orders: A Conceptual Framework for Interpreting Recorded Human History. New York: Cambridge University Press.
Sen, A. (2000). Development as Freedom. New York: Anchor Books.
Sojo, A. (2010). Social cohesion: The Latin American perspective developed by ECLAC. Presentation at the Expert Meeting on Perspectives on Global Development 2010, Social Cohesion.
United Nations Development Programme, (2010). International Human Development Indicators, retrieved Jan. 2, 2011 at http://hdr.undp.org/en/data/trends/1980-2010/
14
Appendix: Country-level results
Right now, do you feel your standard of living is getting better or getting worse? Percent ‘getting better’
Total
Poorest 20%
Second 20%
Middle 20%
Fourth 20%
Richest 20%
Angola 51% 42% 57% 51% 59% 57%
Benin 33% 23% 31% 53% 33% 34%
Botswana 43% 18% 36% 42% 56% 62%
Burkina Faso 57% 53% 58% 59% 58% 56%
Burundi 27% 22% 24% 30% 30% 34%
Cameroon 51% 46% 45% 46% 55% 61%
Chad 51% 42% 43% 53% 56% 62%
Comoros 49% 24% 51% 56% 47% 69%
Congo (Kinshasa) 35% 14% 28% 37% 44% 53%
Congo Brazzaville 35% 18% 25% 34% 43% 57%
Djibouti 66% 32% 60% 75% 78% 90%
Ghana 43% 35% 35% 48% 51% 60%
Ivory Coast 24% 13% 22% 17% 23% 44%
Kenya 29% 27% 23% 25% 31% 41%
Liberia 45% 39% 39% 37% 50% 55%
Madagascar 38% 32% 37% 29% 56% 48%
Malawi 58% 37% 50% 58% 64% 82%
Mali 54% 44% 52% 58% 59% 54%
Mauritania 60% 52% 58% 67% 60% 66%
Niger 63% 57% 59% 70% 74% 63%
Nigeria 50% 55% 45% 56% 49% 43%
Rwanda 60% 55% 59% 63% 66% 65%
Senegal 37% 18% 21% 39% 42% 66%
Sierra Leone 13% 16% 3% 8% 16% 25%
South Africa 34% 26% 30% 29% 30% 52%
Sudan 48% 28% 47% 47% 63% 70%
Tanzania 29% 28% 20% 18% 30% 54%
Togo 15% 11% 23% 23% 27% 21%
Uganda 51% 42% 51% 43% 60% 59%
Zambia 33% 23% 22% 34% 43% 48%
Zimbabwe 63% 58% 62% 74% 68% 57%
15
Thinking about the job situation in the city or area where you live today, would you say now is a good time or a bad time to find a job? Percent ‘good time’
Total
Poorest 20%
Second 20%
Middle 20%
Fourth 20%
Richest 20%
Angola 53% 56% 46% 61% 49% 58%
Benin 19% 15% 15% 29% 18% 14%
Botswana 30% 18% 29% 27% 33% 39%
Burkina Faso 29% 26% 17% 27% 37% 46%
Burundi 19% 27% 21% 12% 17% 18%
Cameroon 32% 34% 31% 34% 28% 33%
Chad 60% 40% 46% 67% 76% 73%
Comoros 20% 14% 19% 13% 19% 37%
Congo (Kinshasa) 25% 11% 21% 36% 29% 28%
Congo Brazzaville 26% 20% 23% 29% 27% 31%
Djibouti 63% 40% 59% 66% 71% 86%
Ghana 21% 22% 17% 19% 26% 26%
Ivory Coast 25% 22% 18% 22% 26% 37%
Kenya 20% 17% 10% 19% 25% 29%
Liberia 40% 35% 28% 25% 43% 60%
Madagascar 69% 67% 67% 64% 75% 77%
Malawi 46% 31% 49% 43% 46% 54%
Mali 48% 38% 43% 53% 49% 64%
Mauritania 42% 26% 40% 41% 57% 48%
Niger 65% 74% 62% 65% 70% 54%
Nigeria 27% 22% 24% 35% 30% 20%
Rwanda 40% 27% 37% 31% 51% 70%
Senegal 13% 5% 5% 10% 15% 29%
Sierra Leone 34% 37% 36% 31% 39% 42%
South Africa 35% 32% 26% 29% 44% 43%
Sudan 20% 10% 23% 23% 10% 24%
Tanzania 30% 34% 30% 21% 31% 35%
Togo 8% 12% 3% 6% 8% 11%
Uganda 28% 25% 28% 22% 34% 32%
Zambia 28% 12% 23% 32% 40% 37%
Zimbabwe 56% 49% 45% 57% 58% 76%
16
In [country], are you satisfied or dissatisfied with your freedom to choose what you do with your life? Percent ‘satisfied’
Total
Poorest 20%
Second 20%
Middle 20%
Fourth 20%
Richest 20%
Angola 69% 73% 66% 70% 70% 75%
Benin 67% 59% 62% 81% 60% 58%
Botswana 84% 91% 81% 84% 86% 84%
Burkina Faso 58% 63% 58% 54% 61% 57%
Burundi 43% 43% 44% 36% 53% 45%
Cameroon 79% 71% 78% 83% 82% 81%
Chad 40% 40% 37% 34% 43% 47%
Comoros 56% 49% 58% 63% 53% 56%
Congo (Kinshasa) 55% 43% 39% 60% 69% 66%
Congo Brazzaville 52% 51% 44% 60% 55% 47%
Djibouti 65% 45% 69% 67% 66% 80%
Ghana 89% 93% 91% 87% 89% 86%
Ivory Coast 76% 82% 77% 77% 73% 70%
Kenya 64% 57% 65% 61% 66% 72%
Liberia 82% 78% 83% 83% 88% 80%
Madagascar 33% 33% 39% 23% 29% 44%
Malawi 88% 90% 92% 84% 85% 86%
Mali 62% 57% 57% 61% 69% 60%
Mauritania 79% 80% 86% 83% 77% 69%
Niger 88% 84% 85% 92% 94% 89%
Nigeria 57% 59% 49% 69% 60% 42%
Rwanda 77% 83% 81% 79% 69% 70%
Senegal 78% 66% 84% 81% 69% 83%
Sierra Leone 72% 67% 63% 68% 77% 82%
South Africa 73% 72% 72% 67% 74% 82%
Sudan 69% 61% 73% 73% 68% 65%
Tanzania 59% 59% 70% 52% 62% 56%
Togo 25% 15% 39% 28% 31% 28%
Uganda 80% 74% 86% 79% 81% 76%
Zambia 69% 59% 73% 75% 73% 59%
Zimbabwe 67% 45% 64% 74% 70% 80%
17
Can people in this country get ahead by working hard, or not? Percent ‘yes, can get ahead’
Total
Poorest 20%
Second 20%
Middle 20%
Fourth 20%
Richest 20%
Angola 78% 73% 81% 74% 77% 79%
Benin 71% 62% 73% 68% 71% 84%
Botswana 91% 83% 94% 90% 92% 97%
Burkina Faso 84% 79% 84% 81% 91% 84%
Burundi 84% 81% 84% 88% 88% 82%
Cameroon 89% 87% 91% 87% 86% 91%
Chad 63% 59% 43% 61% 71% 82%
Comoros 62% 58% 66% 66% 64% 55%
Congo (Kinshasa) 73% 62% 61% 75% 88% 82%
Congo Brazzaville 78% 83% 72% 72% 74% 89%
Djibouti 81% 75% 78% 82% 86% 87%
Ghana 98% 98% 96% 98% 99% 99%
Ivory Coast 87% 94% 86% 86% 76% 91%
Kenya 86% 85% 80% 88% 88% 90%
Liberia 96% 97% 96% 98% 98% 89%
Madagascar 98% 96% 98% 98% 96% 98%
Malawi 98% 99% 98% 97% 98% 98%
Mali 80% 78% 83% 79% 83% 90%
Mauritania 85% 85% 77% 85% 89% 86%
Niger 84% 81% 82% 82% 89% 85%
Nigeria 86% 91% 86% 85% 84% 87%
Rwanda 92% 91% 98% 93% 91% 88%
Senegal 73% 57% 67% 75% 77% 85%
Sierra Leone 78% 57% 77% 77% 75% 82%
South Africa 88% 86% 86% 85% 94% 87%
Sudan 94% 94% 89% 96% 100% 99%
Tanzania 81% 91% 80% 73% 81% 84%
Togo 39% 43% 38% 52% 44% 48%
Uganda 96% 96% 96% 96% 93% 97%
Zambia 92% 87% 93% 89% 94% 95%
Zimbabwe 91% 92% 90% 96% 86% 91%

18
In the city or area where you live, are you satisfied or dissatisfied with the educational system or schools? Percent ‘satisfied’
Total
Poorest 20%
Second 20%
Middle 20%
Fourth 20%
Richest 20%
Angola 62% 54% 55% 58% 70% 58%
Benin 46% 33% 43% 45% 47% 55%
Botswana 68% 55% 69% 72% 73% 73%
Burkina Faso 40% 44% 33% 39% 49% 42%
Burundi 79% 81% 78% 78% 76% 81%
Cameroon 74% 69% 78% 80% 74% 67%
Chad 48% 50% 39% 53% 52% 47%
Comoros 37% 32% 38% 37% 39% 41%
Congo (Kinshasa) 28% 15% 34% 28% 25% 37%
Congo Brazzaville 41% 22% 34% 49% 44% 34%
Djibouti 77% 52% 72% 83% 89% 93%
Ghana 59% 55% 53% 55% 64% 74%
Ivory Coast 26% 24% 26% 30% 25% 25%
Kenya 56% 58% 49% 54% 64% 59%
Liberia 41% 42% 28% 40% 42% 53%
Madagascar 64% 57% 67% 67% 61% 67%
Malawi 67% 63% 71% 67% 62% 68%
Mali 30% 20% 23% 27% 38% 46%
Mauritania 41% 30% 37% 52% 38% 48%
Niger 55% 58% 52% 58% 55% 53%
Nigeria 41% 44% 40% 42% 41% 40%
Rwanda 75% 70% 81% 80% 64% 80%
Senegal 48% 31% 46% 52% 45% 59%
Sierra Leone 34% 49% 36% 28% 29% 44%
South Africa 66% 56% 67% 61% 70% 75%
Sudan 52% 56% 59% 50% 61% 43%
Tanzania 47% 48% 46% 37% 49% 57%
Togo 30% 32% 34% 46% 39% 21%
Uganda 54% 48% 51% 56% 53% 62%
Zambia 55% 40% 58% 46% 53% 66%
Zimbabwe 41% 30% 32% 32% 44% 68%