Embed Size (px)
DESCRIPTION
Opportunities of Export for Manufactured/Handmade Products in Indian Context. Ashita Allamraju Associate Professor Centre for Economics & Finance. ADMINISTRATIVE STAFF COLLEGE OF INDIA BELLA VISTA :: HYDERABAD - 500 082. Structure of the Presentation. - PowerPoint PPT Presentation
Citation preview

Opportunities of Export for Manufactured/Handmade
Products in Indian ContextAshita Allamraju
Associate ProfessorCentre for Economics & Finance
ADMINISTRATIVE STAFF COLLEGE OF INDIABELLA VISTA :: HYDERABAD - 500 082

Global Economy: On a road to recovery? Indian Economy: Status Export Opportunities
Structure of the Presentation
The global economy has been deteriorating since Sep 2011
Indicators of activity and unemployment show increasing and broad-based economic sluggishness in the first half of 2012 and no significant improvement in the third quarter
Global manufacturing has slowed sharply. Euro area crisis has deepened Slowdown in US and UK as well
Global Economy

4 J.P.Morgan Chase 1/30/2012
Global GDP Growth (%)
-1
0
1
2
3
4
5
6
1995 1997 1999 2001 2003 2005 2007 2009 2011 2013
(Percent change)
ForecastsWorld Growth
2011: 3.8%2012: 3.3%
2010: 5.2%2009: -0.7%
5 J.P.Morgan Chase 1/30/2012
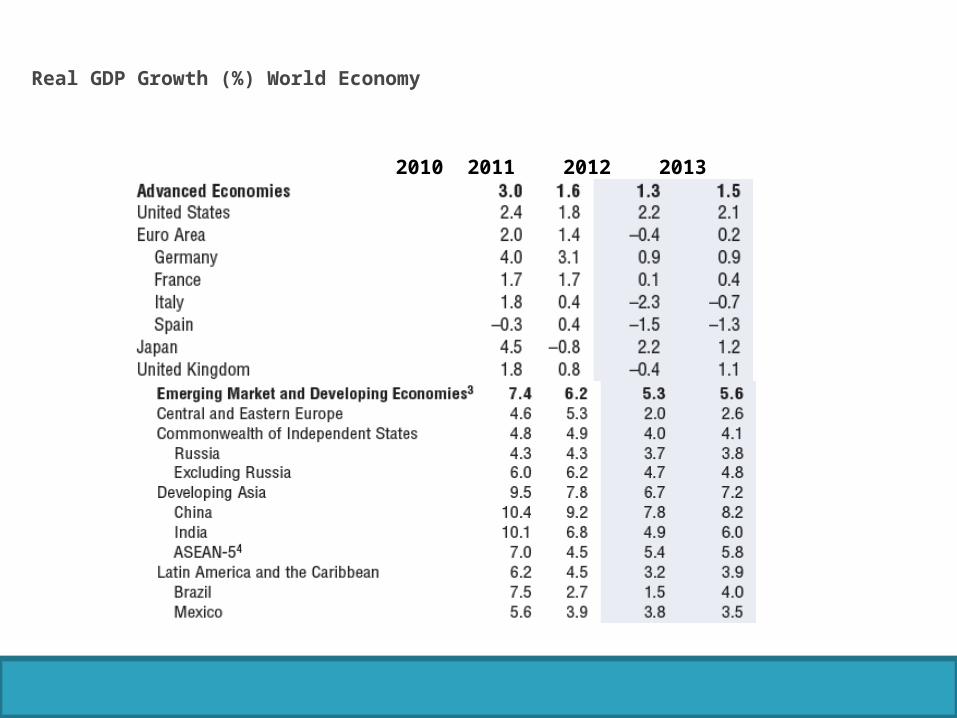
Real GDP Growth (%) World Economy
2010 2011 2012 2013
Growth is estimated to have weakened appreciably in developing Asia, to less than 7 percent
Activity in China slowed sharply, owing to a tightening in credit conditions in response to threats of a real estate bubble
India’s activity suffered from waning business confidence amid slow approvals for new projects, sluggish structural reforms, policy rate hikes designed to rein in inflation, and flagging external demand.
EMEs

Real GDP growth also decelerated in Latin America to about 3 percent in the first half of 2012, largely due to Brazil.

In U.S labor market and consumption have failed to garner much strength.

The principal risk remains the euro area crisis.
Global Risks

No significant improvement appears in the offing.
The WEO forecast includes only a modest reacceleration of activity
Looking ahead

India: Macroeconomic Situation
92-93 to 97-98
98-99 to 02-03
03-04 to 07-08
08-09 to 11-12
0123456789
10
6.25.6
8.7
7.5
Long Term Trend in Growth
Percent
Trend growth rate has clearly declined in the post-crisis period. India clocked 8.7% growth in the five year period 2003-08. Average growth during the three year period 2005/06 to 2007/08 was 9.5%

Growth moderated in the crisis year of 2008-09 but revived sharply in 2009/10 and 2010/11.
Growth in 2011/12 of 6.5% not only poor - compared to pre-crisis growth - but also compared to immediate
post crisis yrs - lowest annual growth in the last 9
years
Macroeconomic Situation

Growth has moderated sequentially over the last four quarters from 7.8-7.7-6.9-6.1
Recent Trend

SECTORAL TRENDS
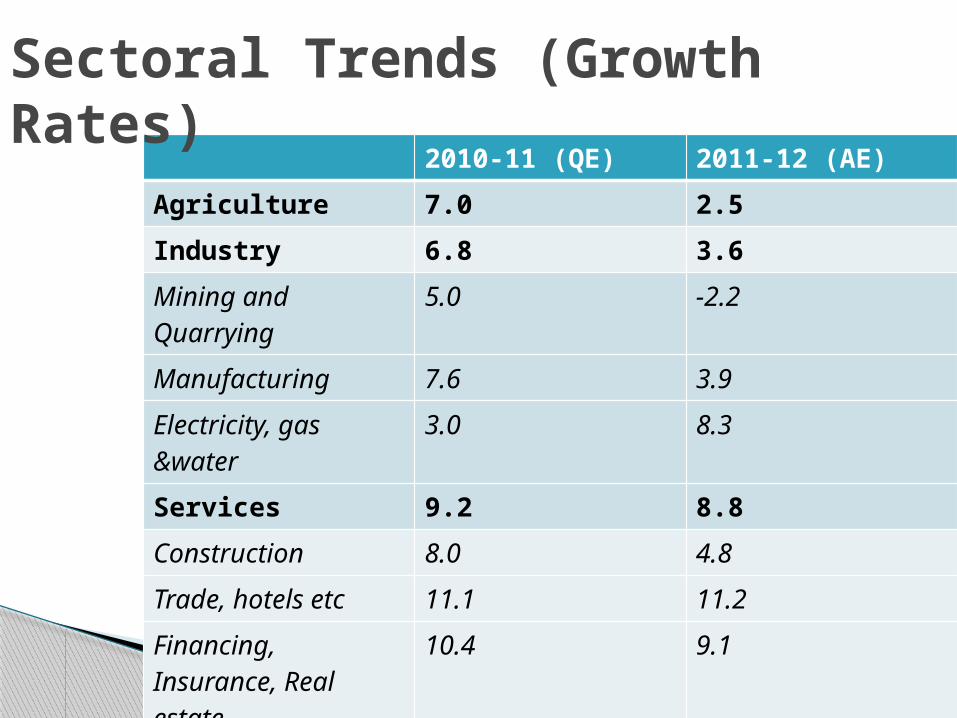
2010-11 (QE) 2011-12 (AE)Agriculture 7.0 2.5Industry 6.8 3.6Mining and Quarrying 5.0 -2.2Manufacturing 7.6 3.9Electricity, gas &water 3.0 8.3Services 9.2 8.8Construction 8.0 4.8Trade, hotels etc 11.1 11.2Financing, Insurance, Real estate
10.4 9.1
Community & Personal
4.5 5.9
GDP at fc 8.4 6.9
Sectoral Trends (Growth Rates)
16
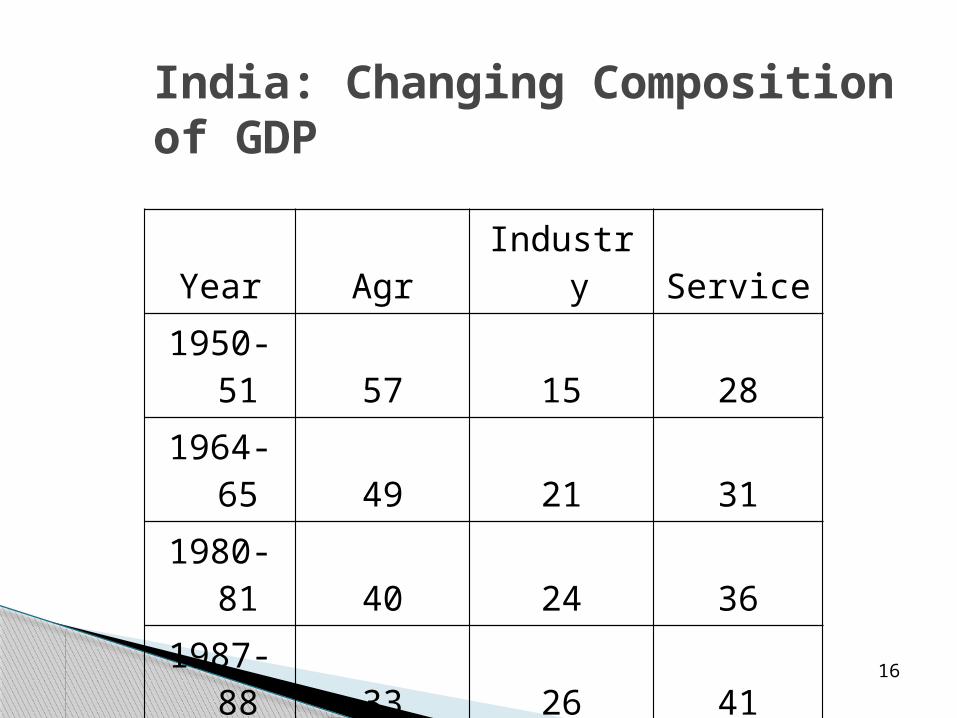
India: Changing Composition of GDP
Year Agr Industry Service1950-51 57 15 281964-65 49 21 311980-81 40 24 361987-88 33 26 412004-05 21 27 522010-11 14.5 27.8 57.72011-12 14 27 59

In 1993-94, agriculture, with 30 % of GDP, was providing employment and livelihood to 65 % of the workforce.
By 2007-08, the same sector accounted for less than 17 % of GDP, but continued to support 55 % of the workforce.
Increasing Inequalities
Productivity in Agriculture
Industrial growth slowed down sharply during 2011-12, ◦ weak demand for consumer durables, ◦ deceleration in external demand and ◦ subdued investment
Contraction in mining and poor performance of the manufacturing sub-sector
Industry

The growth in July 2012 index of industrial production (IIP) was 0.1% higher as compared to the level in the month of July 2011.The manufacturing sector, which constitutes over 75% of the index, witnessed a contraction in output by 0.2% in July, as against growth of 3.1% in the same month last year.The capital goods production also down by 5% in July Consumer durables production showed a decline in growth rate
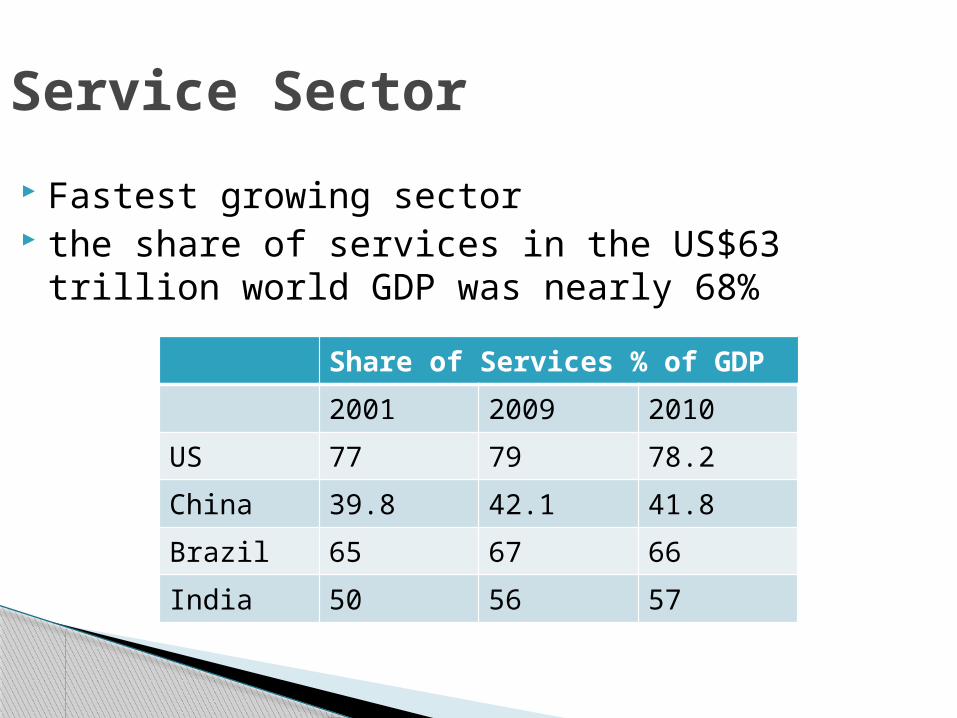
Fastest growing sector the share of services in the US$63 trillion
world GDP was nearly 68%
Service Sector
Share of Services % of GDP2001 2009 2010
US 77 79 78.2China 39.8 42.1 41.8Brazil 65 67 66India 50 56 57
With a 17 % trade, hotels, and restaurants as a group is the largest contributor to GDP among the various services’ subsectors
Financing, insurance, real estate, and business services - 16.4 % share.
Community, social, and personal services with a share of 14 % is in third place.
Services sector is the dominant sector in most states of India
Services GDP
this sector employs an estimated 59.7 million persons spread over 26.1 million enterprises.
MSME sector accounts for about 45% of the manufacturing output and around 40% of the total export of the country.
MSME Sector
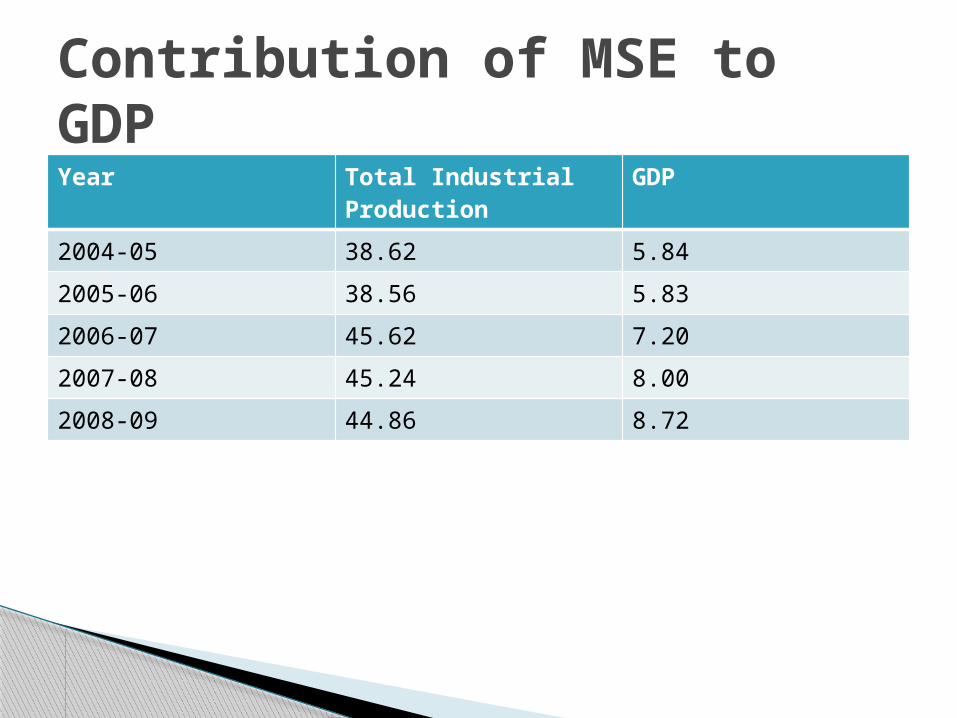
Year Total Industrial Production
GDP
2004-05 38.62 5.842005-06 38.56 5.832006-07 45.62 7.202007-08 45.24 8.002008-09 44.86 8.72
Contribution of MSE to GDP

Export
CAGR of India’s exports and imports (in US dollar terms) were 8.2 % and 8.4 % respectively in the 1990s,
they increased to 19.5 % and 25.1 % during 2000-01 to 2008- 09.
Exports grew at 25 % during 2005-08 decelerated to 13.6 % in the crisis year (2008-09) and registered a negative growth of 3.5 % in 2009-10.
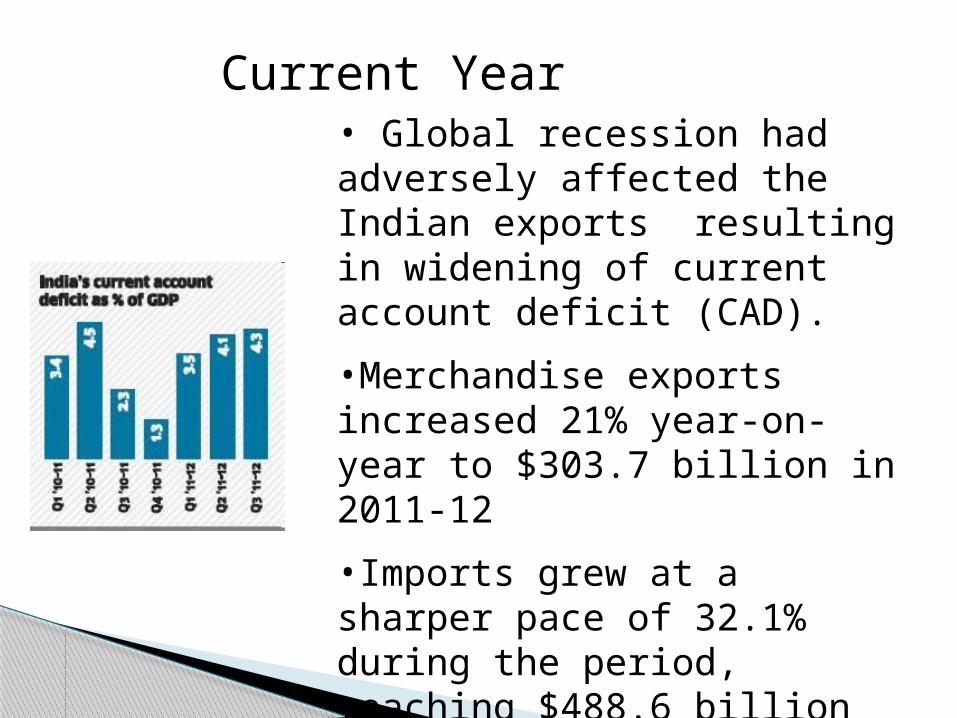
• Global recession had adversely affected the Indian exports resulting in widening of current account deficit (CAD). •Merchandise exports increased 21% year-on-year to $303.7 billion in 2011-12•Imports grew at a sharper pace of 32.1% during the period, reaching $488.6 billion
Current Year
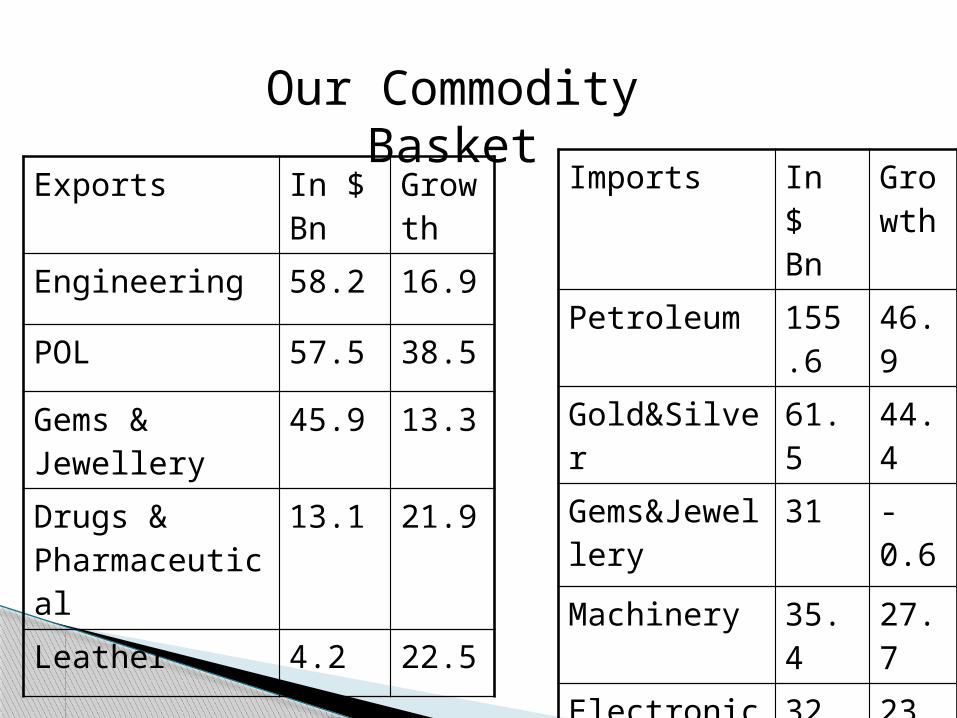
Exports In $ Bn
Growth
Engineering 58.2 16.9
POL 57.5 38.5Gems & Jewellery
45.9 13.3
Drugs & Pharmaceutical
13.1 21.9
Leather 4.2 22.5
Imports In $ Bn
Growth
Petroleum 155.6
46.9
Gold&Silver 61.5 44.4
Gems&Jewellery
31 -0.6
Machinery 35.4 27.7
Electronics 32.7 23.2
Our Commodity Basket
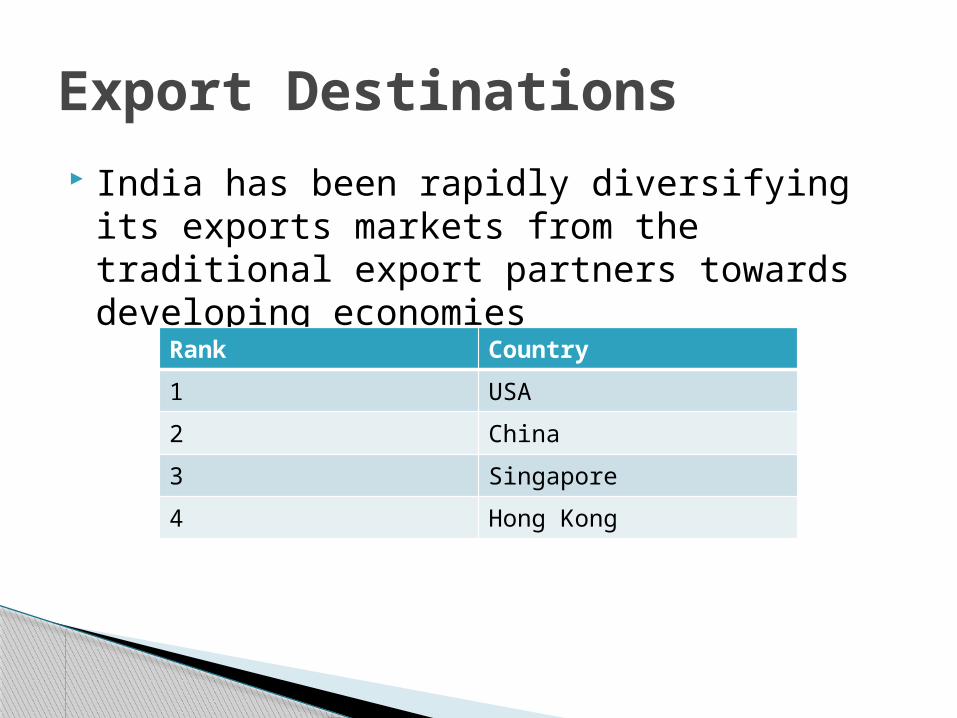
India has been rapidly diversifying its exports markets from the traditional export partners towards developing economies
Export Destinations
Rank Country1 USA2 China3 Singapore4 Hong Kong
Composition of SSI export basket from India The composition of export basket of SME’s
in India has both traditional and non-traditional commodities in nature.
There are few commodity groups which are exclusively exported by SME’s such as sports goods, cashew etc.
In the commodity group of engineering goods, SME’s constitute around 32% of the total exports of this commodity group.

S.No. Product Group
Total Exports2002- ’03 (Rs. Crores)
Share of SSI Sector for 2002-’03 (Rs. Crores)
% share of SSI
(A) NON TRADITIONAL 1 Engineering
Goods 38,093.00 12,500.00 32.81%
2 Basic Chem. Pharmaceutical & Cosmetic products
21,701.00 9,659.12 44.51%
3 Chemical & Allied products
10,026.75 3,354.67 33.46%
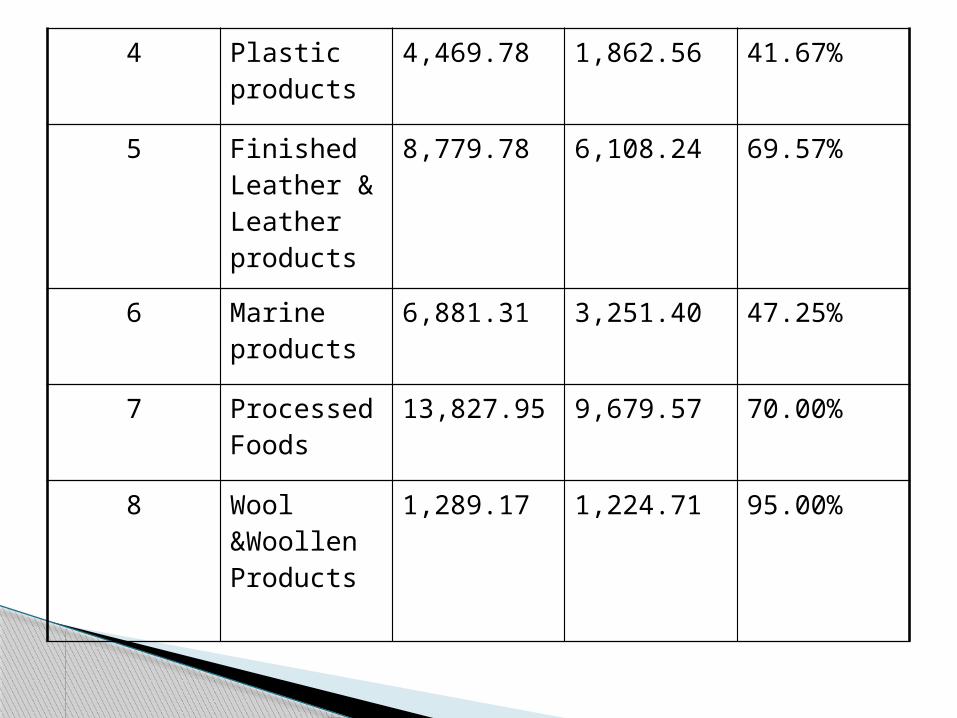
4 Plastic products
4,469.78 1,862.56 41.67%
5 Finished Leather & Leather products
8,779.78 6,108.24 69.57%
6 Marine products
6,881.31 3,251.40 47.25%
7 Processed Foods
13,827.95 9,679.57 70.00%
8 Wool &Woollen Products
1,289.17 1,224.71 95.00%
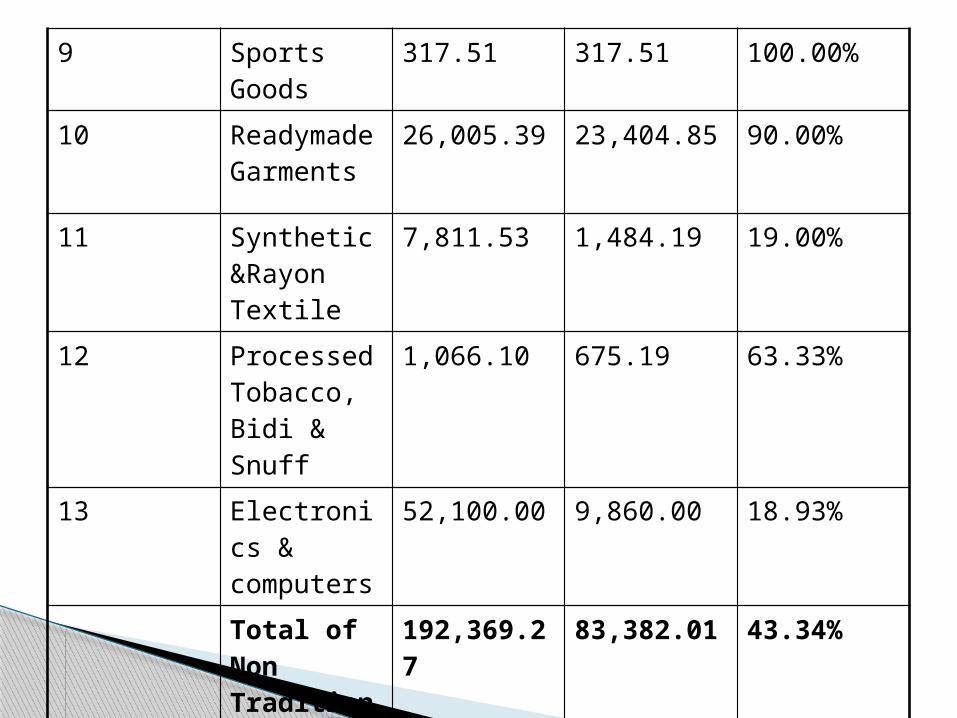
9 Sports Goods
317.51 317.51 100.00%
10 Readymade Garments
26,005.39 23,404.85 90.00%
11 Synthetic &Rayon Textile
7,811.53 1,484.19 19.00%
12 Processed Tobacco, Bidi & Snuff
1,066.10 675.19 63.33%
13 Electronics & computers
52,100.00 9,860.00 18.93%
Total of Non Traditional Products (A)
192,369.27 83,382.01 43.34%
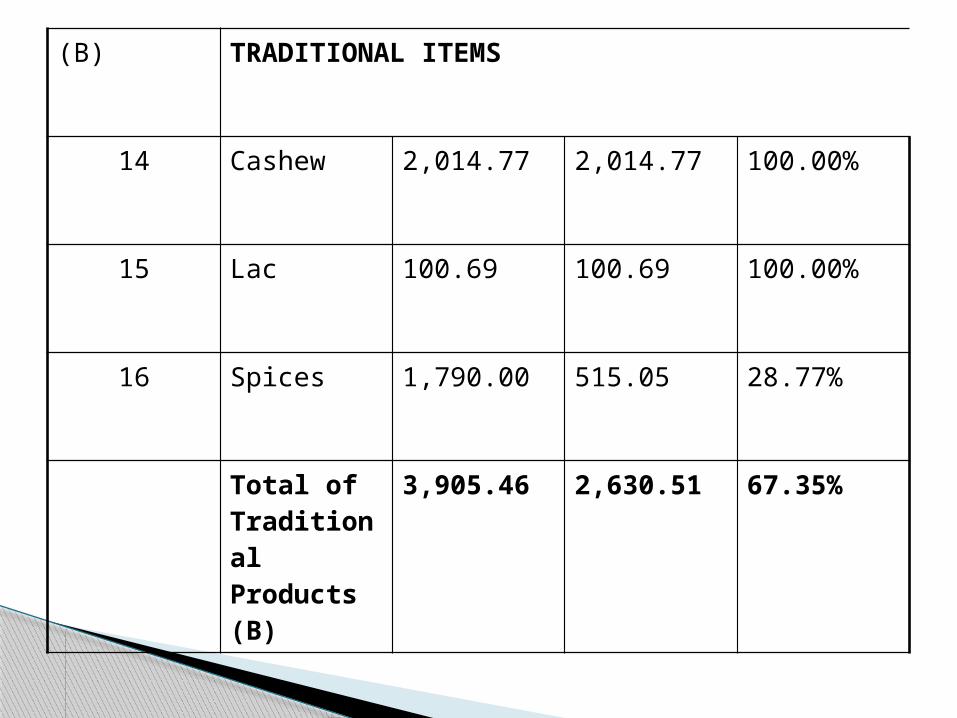
(B) TRADITIONAL ITEMS
14 Cashew 2,014.77 2,014.77 100.00%
15 Lac 100.69 100.69 100.00%
16 Spices 1,790.00 515.05 28.77%
Total of Traditional Products (B)
3,905.46 2,630.51 67.35%

A + B Total of {A} & {B}
196,274.73 86,012.52 43.82%
(C) Other export items
56,515.24 -
A + B + C Total exports from the country
252,789.97 86,012.52 34.03%

95 percent of the products exported by the SSI are non traditional products.
Potential export destinations for products of SMEs are the USA, EU and Japan.
There exists a huge potential in the non-traditional sectors. They may not be able to tap the advantages of economies of scale, but then they are ideal for catering to small markets and orders.
These activities are often ecofriendly, which can be an added advantage.
It has been identified that the US could provide a market for textiles, leather items and engineering/electrical and electronic items
Japan is a potential market for exporting chemicals, and agricultural, marine and allied products.
The European Union can be tapped for enhancing SSI exports of engineering/electrical, textiles, and electronic items.
Also, the a number of markets could be accessed for various goods in which given states have the bulk of market share or are suitable for those products.
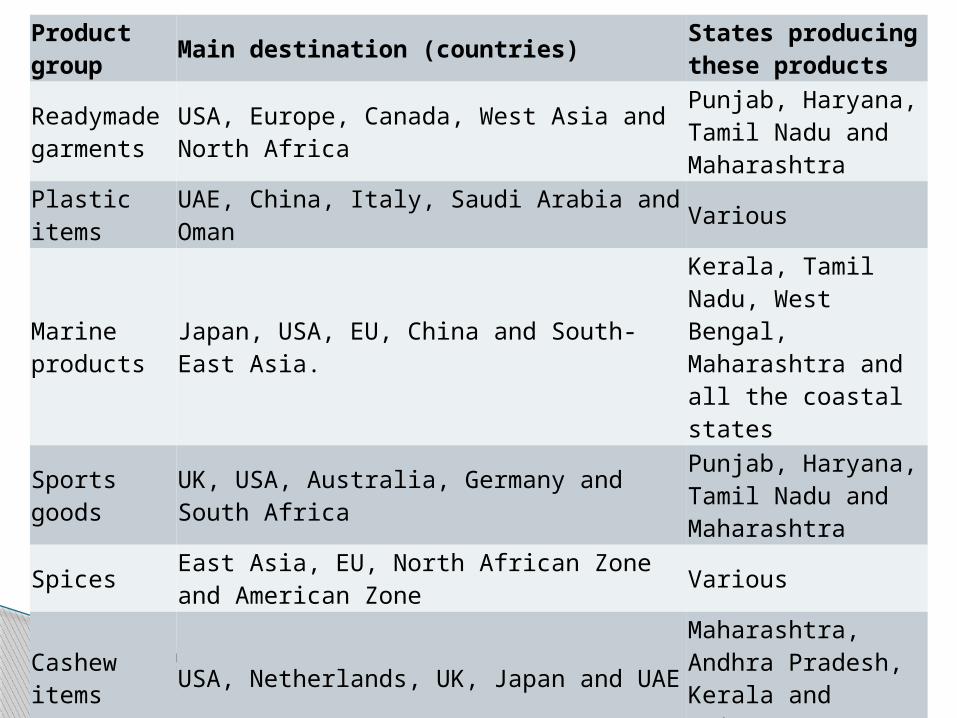
Product group Main destination (countries) States producing
these productsReadymade garments
USA, Europe, Canada, West Asia and North Africa
Punjab, Haryana, Tamil Nadu and Maharashtra
Plastic items UAE, China, Italy, Saudi Arabia and Oman Various
Marine products
Japan, USA, EU, China and South-East Asia.
Kerala, Tamil Nadu, West Bengal, Maharashtra and all the coastal states
Sports goods
UK, USA, Australia, Germany and South Africa
Punjab, Haryana, Tamil Nadu and Maharashtra
Spices East Asia, EU, North African Zone and American Zone Various
Cashew items USA, Netherlands, UK, Japan and UAE
Maharashtra, Andhra Pradesh, Kerala and Orissa
Shellac items Indonesia, Germany, UAE, USA and Italy VariousSynthetic items (Madeups)
UAE, UK, Turkey, USA and Italy Various

Leather and leather items
Germany, UK, Italy, USA and France Uttar Pradesh
Basic chemical and cosmetic products
USA, Japan, Saudi Arabia, China, Singapore and Netherlands Various
Chemical and allied products
Japan, Belgium, Italy, France,Bangladesh, USA and UK Various
Wool and woolen garments
Europe, Japan, and Bangladesh Punjab
Processed food items USA, Europe and Japan VariousElectronic items and computer software
USA, Hong Kong, UAE, UK,Germany, and Japan
Maharashtra, Karnataka, Andhra Pradesh, and Haryana
Tobacco items East Europe Andhra Pradesh
and KarnatakaSource: 11th Plan, Planning Commission

Thank You