Embed Size (px)
Citation preview

Opportunities from China's Environmental RenaissanceOverview of the KraneSharesMSCI China Environment ETF (Ticker: KGRN)
KGRN12/31/2017
1

2 2
Introduction to KraneShares
About KraneShares
Krane Funds Advisors, LLC is the investment manager for KraneShares ETFs. Our suite of China focused ETFs provides investors with solutions to capture China’s importance as an essential element of a well-designed investment portfolio. We strive to provide innovative, first to market strategies that have been developed based on our strong partnerships and our deep knowledge of investing. We help investors stay up to date on global market trends and aim to provide meaningful diversification. Krane Funds Advisors, LLC is majority owned by China International Capital Corporation (CICC).

Investment Strategy:
The KraneShares MSCI China Environment ETF (KGRN) seeks to track the performance of the MSCI China IMI Environment 10/40 Index. The Index is comprised of securities that derive at least 50% of their revenues from environmentally beneficial products and services. The Index is based on five key Clean Technology environmental themes: Alternative Energy, Sustainable Water, Green Building, Pollution Prevention and Energy Efficiency. The Index aims to serve as a benchmark for investors seeking exposure to Chinese companies that focus on contributing to a more environmentally sustainable economy by making efficient use of scarce natural resources or by mitigating the impact of environmental degradation. Constituent selection is based on data from MSCI Environment, Social, and Governance (ESG).
China’s Environmental Protection Highlights:
• China is the world leader in total renewable energy capacity, at 28% of total global capacity1.
• China’s goal is to spend $360 billion on renewable energy2 and achieve 50% commercial green building certification by 20203.
• Meeting these standards would create as much new renewable energy capacity as the entire US electricity system4, and China would represent half of the world’s green building floor space3.
• China has a proven track record of achieving ambitious long term renewable energy goals set forth within The Five Year Plan.
KGRN Features:
• Access to China’s fast-growing environmental protection industry that has rapidly become the largest renewable energy market in the world1.
• Exposure to companies that stand to benefit from China’s increased focus and spending on clean energy technologies.
• Benchmarked to an MSCI ESG Index: MSCI is the #1 index provider for Socially Responsible Investment (SRI), Corporate governance,and ESG indexes according to a 2015 survey of 1,200 participants conducted by SRI Connect and Extel.
KGRNKraneShares MSCI China Environment ETF
3
1. REN21’s Renewables 2017 Global Status Report (GSR) pg 1662. Michael Forsythe, “China Aims to Spend at Least $360 Billion on Renewable Energy by 2020”, The New
York Times, 1/5/2017. Retrieved 7/21/2017.3. UTC, Accelerating the World’s Largest Green Building Market: China. Oct. 4, 2016.4. Barbara Finamore, National Resource Defense Council, Paris Climate Agreement Explained, Dec. 12, 2015
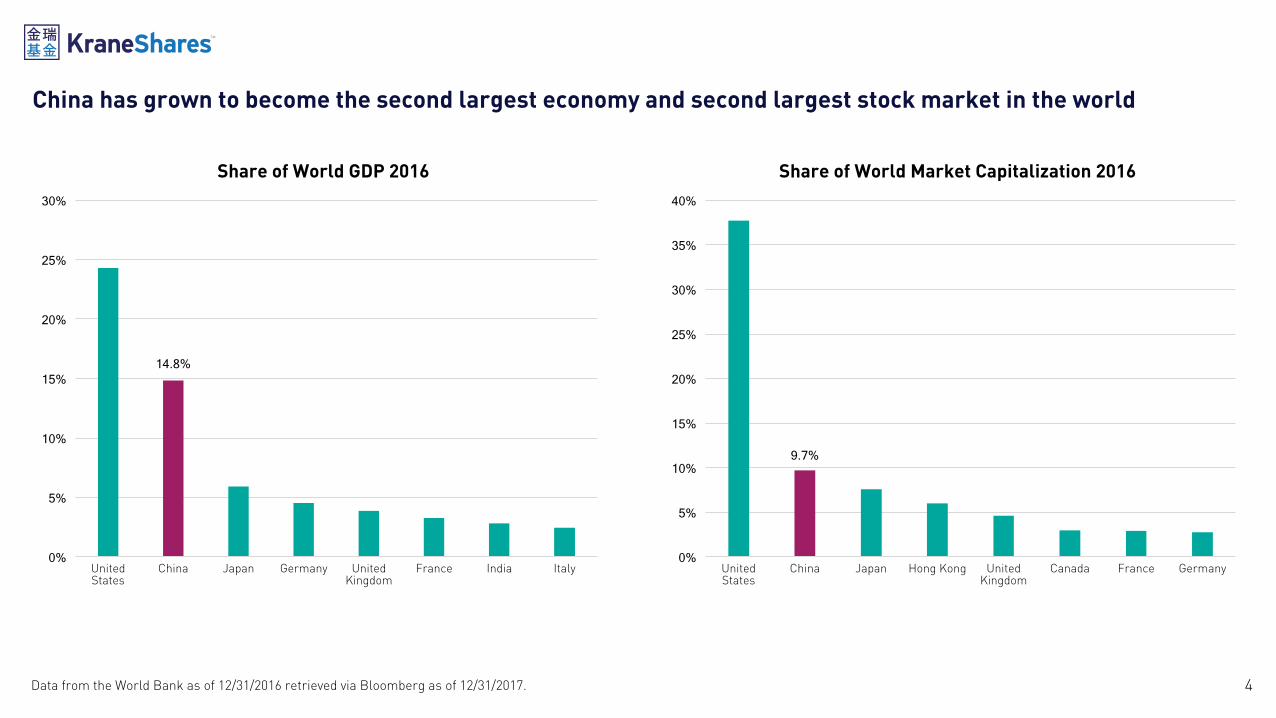
14.8%
0%
5%
10%
15%
20%
25%
30%
United States
China Japan Germany United Kingdom
France India Italy
Share of World GDP 2016
9.7%
0%
5%
10%
15%
20%
25%
30%
35%
40%
United States
China Japan Hong Kong United Kingdom
Canada France Germany
Share of World Market Capitalization 2016
China has grown to become the second largest economy and second largest stock market in the world
4Data from the World Bank as of 12/31/2016 retrieved via Bloomberg as of 12/31/2017.

5
China’s economic growth has come with a corresponding increase in automobile ownership, construction projects and energy consumption, particularly coal consumption; all currently at their decade highs.
1. Data from China’s National Bureau of Statistics 2002-2016, Possession of Civil Vehicles, retrieved on 12/31/2017. 2. Data from China’s National Bureau of Statistics 2002-2016, Number of Construction Projects, retrieved on 12/31/2017.3. Data from China’s National Bureau of Statistics 2002-2015, Coal Balance Sheet and Electricity Balance Sheet, retrieved on 12/31/2017.
0%
50%
100%
150%
200%
250%
300%
Annual Increase in Energy Consumption3
Electricity Consumption Series4
0
2000
4000
6000
8000
10000
12000
14000
16000
18000
20000
Annual Increase in Automobile Ownership1
Automobile Ownership
0%
100%
200%
300%
400%
500%
600%
700%
800%
900%
Annual Increase in Construction Projects2
Construction

6
China’s rapid economic development has impacted the environment. Levels of air and water pollution in China are much higher than those recommended by the World Health Organization
0
10
20
30
40
50
60
70
2010 2011 2012 2013 2014 2015
Part
icul
ate
Mat
ter
2.5
(µg/
m3)
Average Annual Exposure to PM2.5 Air Pollution1
China USA European Union Recommended Level
Excellent10.1%
Good25.4%
Satisfactory4.4%
Bad 45.4%
Very Bad14.7%
2016 Overall Groundwater Quality2
1Data from the World Bank and from the World Health Organization’s “Air Quality Guidelines”, as of 12/31/2017.2Data from China Water Risk, 2016 State of Environment Report, 6/14/2017, retrieved on 12/31/2017.

7
China has a model for how to successfully address environmental concernsMany cities have encountered pollution during their development and have subsequently taken action to reduce it
1Bell, M.; Davis, D & Fletcher, T. (2004). A Retrospective Assessment of Mortality from the London Smog Episode of 1952: The Role of Influenza and Pollution. Environ Health Perspect. 112: 6–8.2China Law and Policy, Beijing Air Pollution- A Silver Lining on the Smog Cloud?. Jan. 13, 2013
1952 Great Smog of London
1966 New York City’s “Killer Smog”
• Due to the burning of coal, smog was common in London during this time. However, in December 1952, an anticyclone created an inversion –trapping the pollution and blanketing the capital for the next five days.
• May have killed as many as 12,000 people in London due to sickness1.
• Four years later, the Clean Air Act banned the burning of polluting fuels and was considered an environmental turning point across the UK.
• A large mass of stagnant air trapped pollutants in NYC for three days.
• This was the third harmful smog incident in NYC within 15 years.
• The smog served as a catalyst for greater national awareness of air pollution, and the 1967 Air Quality Act and 1970 Clean Air Act were issued as a result.
Experts Believe China Is Not So Different:
Elizabeth M. Lynch, a legal scholar and founder of China Law and Policy, said that images of visible air pollution in Beijing from 2012, “aren’t that much different from pictures of New York City in the 1950s and 1960s, or London during the same time.” 2

8
As China’s economy has shifted away from its dependency on manufacturing, it is now better equipped to deal with environmental concerns
• China’s economy has become more balanced in recent years as services surpassed industrials as the largest contributor to GDP
• The US underwent a similar shift from the 1950’s to the 1970’s, and today the percent of US GDP generated from services far exceeds that of industrials
• With a more balanced economy, China is now better equipped to tackle pollution issues generated from its industrial sector
Data from U.S. Bureau of Economic Analysis (excludes government sector) as of 12/31/2017.
0%
10%
20%
30%
40%
50%
60%
2016201520142013201220112010
China GDP Breakdown(2010 - 2016)
Data from Bloomberg as of 12/31/2016. Retrieved 12/31/2017.
■ Services ■ Agricultural■ Industrial ■ Services ■ Agricultural■ Industrial
0
10
20
30
40
50
60
70
80
%
USA GSP Breakdown(1950-2016)

Environmental Protection team upgraded to the Environmental Protection Agency2.
China’s focus on environmental protection has strengthened following the formation of the Ministry of Environmental Protection in July 2008
1974 Today
Oct
. 197
4
China’s first Environmental Protection team was officially established1.
July
198
8
The first Energy Conservation Law was adopted by the People’s Republic of China3.
Nov
. 199
7
The Ministry of Environmental Protection was founded, setting environmental protection at
the highest level of Chinese government4.
July 2008
NPC ratifies China’s 13th Five Year Plan with Environment as a critical focus11.
Mar
ch 2
016Renewable electric
energy investment exceeds fossil fuel and nuclear for the first time9.
Jan.
201
5Ministry of Finance begins to provide subsidies for buildings integrated with solar panels5.
Mar
ch 2
009 Central Government
aims to spend $360 billion on renewable energy by 202013.
Jan.
201
7
China sets a goal to have 80 million car charging stations by 203014.
May
201
7
Ministry of Science targets 5 million electric cars by 202010.
Feb.
201
5
“New Type Urbanization Plan” requires 50% of new construction to be green by 20208.
Mar
ch 2
014Creation of the US-
China Clean Energy Research Center6.
Nov
. 200
9
The 12th Five Year Plan emphasizes renewable energy and begins the construction of six onshore and two offshore wind power bases in China7.
Mar
ch 2
011
China signs the 2016 Paris Agreement on climate change12.
Apri
l 201
6
9See Slide 18 for complete list of citations
In signing the 2016 Paris Agreement, China promised to install 800 to 1,000 gigawatts of new renewable energy capacity by 2030, about the same energy capacity as the entire U.S. electricity system1.
The goal of the Chinese government is to achieve 50% commercial green building certification by 2020. If met, China will represent half of the world’s green building floor space3.
The Chinese government is spending billions of dollars in subsidizing electric car manufacturers to stimulate growth and ensure that electric cars are affordable to average Chinese citizens2.

10
China is outpacing other world leaders in growth of electric power capacity from renewable technologies
Data from REN21 Renewables Global Status Report 2013-2017, Renewable Electric Power Global Capacity, Top Regions and Countries. Retrieved 12/31/2017.
0%
10%
20%
30%
40%
50%
60%
70%
80%
90%
2012 2013 2014 2015 2016
Annual Growth of Electric Power Capacity From Renewable Technologies
China USA Germany India

China´s 2016 Global Rank in Power Capacity
Wind Power 1st
Hydropower 1st
Solar Power 1st
Bio Power 2nd
11
Renewable Electric Power Global Capacity. Top Regions / Countries1
Global BRICS EU-28 China USA Germany Japan India Italy
Technology Gigawatts
Bio-Power 112 35 37 12 16.8 7.6 4.1 8.3 4.1
Geothermal Power 13.5 0.1 0.9 ~0 3.6 ~0 0.5 0 0.8
Hydropower 1,096 499 127 305 80 5.6 23 47 18.5
Ocean Power 0.5 ~0 0.3 ~0 ~0 0 0 0 ~0
Solar PV 303 88 106 77 41 41 43 9.1 19.3
Concentrating Solar Thermal Power 4.8 0.4 2.3 ~0 1.7 ~0 0 0.2 ~0
Wind Power 487 210 154 169 82 50 3.2 29 9.3
Total renewable power capacity(including hydropower)
2,017 832 428 564 225 104 73 94 52
Total renewable power capacity(not including hydropower) 921 333 300 258 145 98 51 46 33
Per capita capacity (kilowatts per inhabitant, not including hydropower) 0.1 0.1 0.6 0.2 0.5 1.2 0.4 0.04 0.6
While China is the world leader in total renewable energy, at 28% of global capacity, there is still significant room for growth. In terms of per capita renewable power output, China produces less than half the capacity of the United States and one third the capacity of the European Union.
Source: REN21’s Renewables 2017 Global Status Report (GSR) pg 166

12
12th 5 year plan energy targets(2011 - 2015)
2015 Actual Numbers 2016 Actual Numbers 13th 5 year plan energy targets (2016 - 2020)
Gigawatts
Bio-Power 13 10.3 12 15
Geothermal Power 0.1 ~0 ~0 0.53
Hydropower 290 296 305 380
Solar PV 34 44 77 110
Concentrating Solar Thermal Power 1 ~0 ~0 5
Wind Power 105 145 169 210
Total 443.1 495.3 563 720.53
China has proven highly capable of achieving its ambitious targets for increasing renewable energy capacity.• By the end of 2015 China exceeded the goal it set for total renewable energy capacity in the 12th Five Year Plan by 11.8%
• Total renewable energy capacity increased 13.7% year over year from 2015 to 2016
• China’s 13th Five Year Plan aims to increase overall renewable energy capacity 45.5% by 2020
Data compiled from “China 13th Electricity Development Five Year Plan (2016-2020)” iea.org and REN21’s Renewables 2017 Global Status Report (GSR) pg 166

KGRN is benchmarked to an MSCI index – MSCI is the world’s largest provider of ESG indexes and research1
MSCI is committed to determining which companies best match their ESG criteria
1 Data from MSCI as of 12/31/2016. Calculated by number of indexes and by assets tracking the indexes compared with publicly available information produced by FTSE and S&P Dow Jones.2 As of Dec 2016, based on Bloomberg, Morningstar and MSCI data. Active AUM includes data as of September 30, 2016 reported on December 31, 2016 by eVestment. .3 ‘SRI’ - Socially Responsible Investment. .4 Based on P&I report published in May 2016 and MSCI clients as of December 2016. 13
4
14
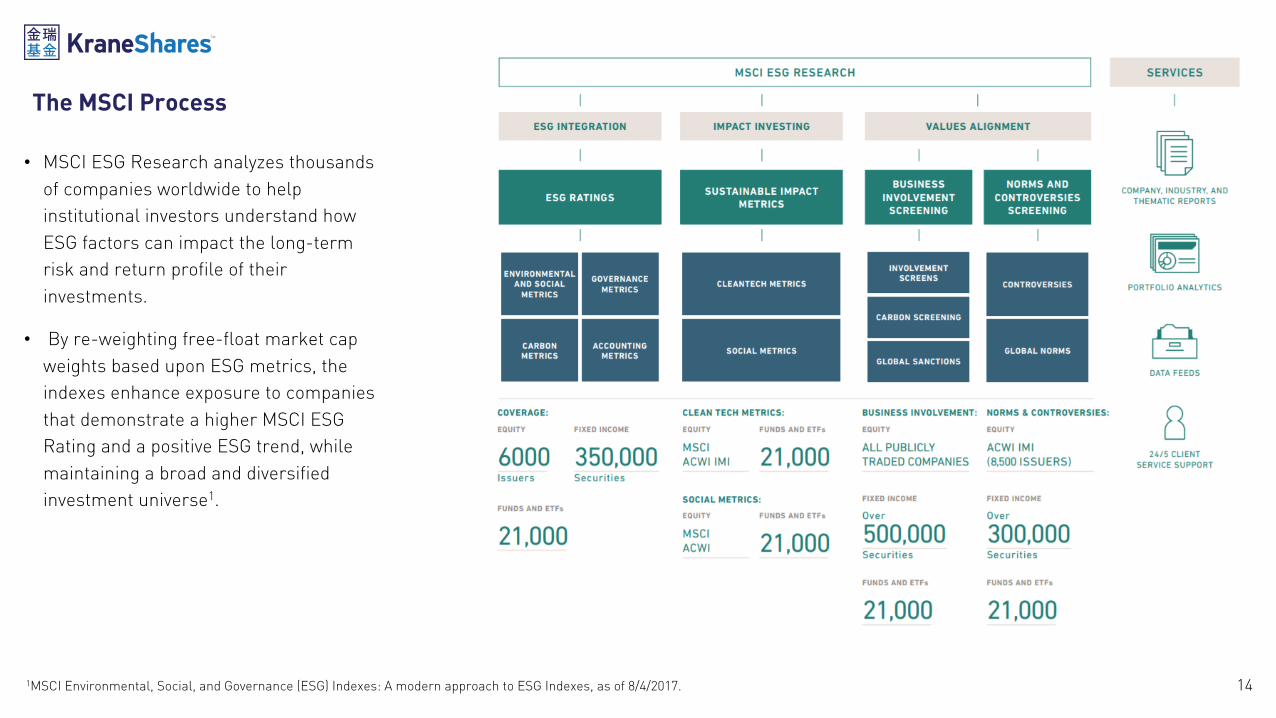
The MSCI Process
• MSCI ESG Research analyzes thousands of companies worldwide to help institutional investors understand how ESG factors can impact the long-term risk and return profile of their investments.
• By re-weighting free-float market cap weights based upon ESG metrics, the indexes enhance exposure to companies that demonstrate a higher MSCI ESG Rating and a positive ESG trend, while maintaining a broad and diversified investment universe1.
1MSCI Environmental, Social, and Governance (ESG) Indexes: A modern approach to ESG Indexes, as of 8/4/2017.
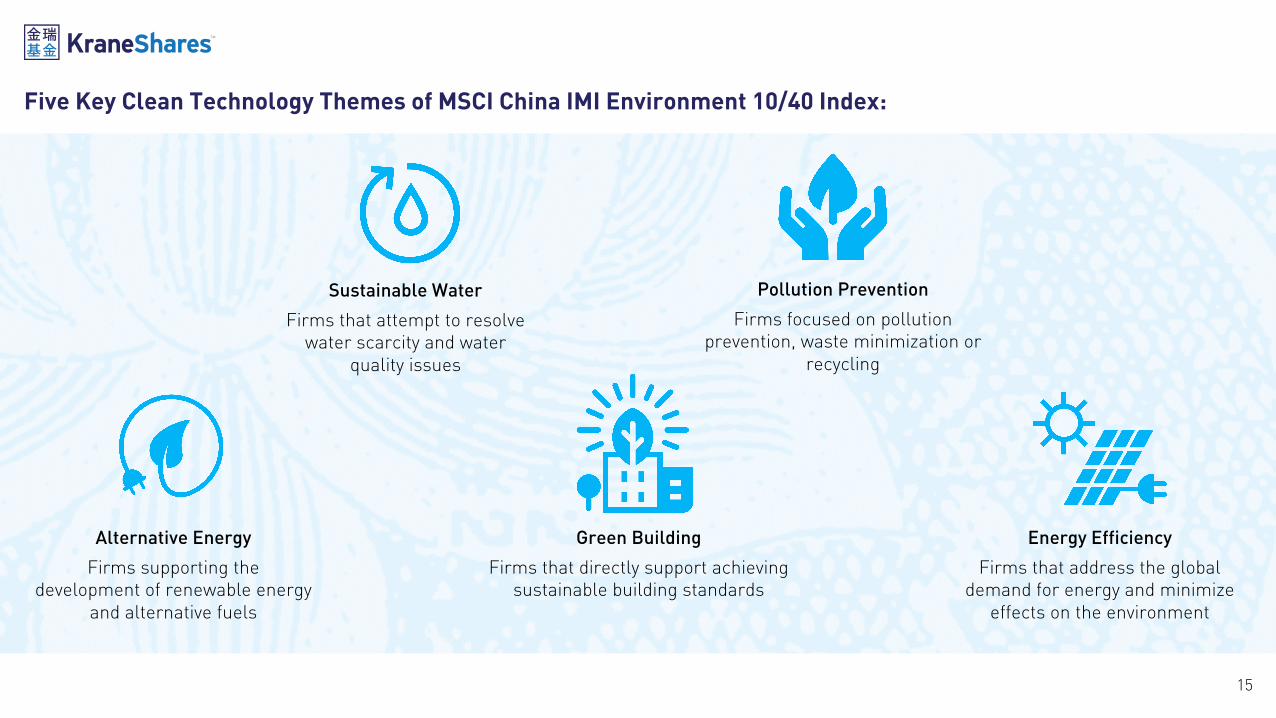
Alternative Energy
Firms supporting thedevelopment of renewable energy
and alternative fuels
Green Building
Firms that directly support achieving sustainable building standards
Energy Efficiency
Firms that address the global demand for energy and minimize
effects on the environment
Sustainable Water
Firms that attempt to resolve water scarcity and water
quality issues
Pollution Prevention
Firms focused on pollution prevention, waste minimization or
recycling
Five Key Clean Technology Themes of MSCI China IMI Environment 10/40 Index:
15

Example Index Constituents from the Five Key Clean Technology Themes of the MSCI China IMI Environment 10/40 Index:
*Data from Bloomberg as of 12/31/2017. Data is for informational purposes only and does not represent the ETF. See page 17 for the Fund’s top 10 holdings 15
Theme Exampleconstituent
Constituentweight in index(as of 12/29/2017)
Company logo Company Description
Alternative Energy
China LongyuanPower Group 4.5%
China Longyuan Power Group Corp Ltd designs, develops, manages, and operates wind farms. The Company also sells the electricity generated by the wind.
Sustainable Water
Beijing Enterprise Water
8.4%
Beijing Enterprises Water Group Limited develops water treatment systems. The Group specializes in water services and environmental protection businesses, with waste water treatment as its core business segment.
Green Building
China Vanke 9.2%China Vanke Co., Ltd. is a property development company. The Company develops residential properties in Shenzhen, Shanghai, Beijing, Tianjin, Shenyang, Nanjing, and other big cities in China.
Pollution Prevention
China EverbrightInternational
8.5%
China Everbright International Limited provides environmental protection project management and consultancy services. The Company's operations are broken up into environmental energy, environmental water, environmental construction and environmental technology.
Energy Efficiency
Tianneng Power Intl 3.7%
Tianneng Power International Limited manufactures motive battery products. The Company's batteries are used predominantly in electric bikes.

KGRN Performance History as of 12/31/2017
KraneShares MSCI China Environment ETF (Ticker: KGRN)The KraneShares MSCI China Environment ETF (KGRN) seeks to track the performance of the MSCI China IMI Environment 10/40 Index. The Index is comprised of securities that derive at least 50% of their revenues from environmentally beneficial products and services. The Index is based on five key Clean Technology environmental themes: Alternative Energy, Sustainable Water, Green Building, Pollution Prevention and Energy Efficiency. The Index aims to serve as a benchmark for investors seeking exposure to Chinese companies that focus on contributing to a more environmentally sustainable economy by making efficient use of scarce natural resources or by mitigating the impact of environmental degradation. Constituent selection is based on data from MSCI Environment, Social, and Governance (ESG).
Top Ten Holdings as of 12/31/2017 excluding cash.The Fund’s Holdings are Subject to Change.
Ticker %
CHINA VANKE CO LTD-H 2202 HK 9.69
GCL-POLY ENERGY HOLDINGS 3800 HK 9.44
BEIJING ENTERPRISES WATER 371 HK 8.99
CHINA EVERBRIGHT INTL LTD 257 HK 8.87
HUANENG RENEWABLES CORP-H 958 HK 4.91
SHUI ON LAND LTD 272 HK 4.87
XINYI SOLAR HOLDINGS LTD 968 HK 4.79
CHINA LONGYUAN POWER GROU 916 HK 4.75
TIANNENG POWER INTL LTD 819 HK 3.97
FDG ELECTRIC VEHICLES LTD 729 HK 3.49
17
Cumulative % Average Annualized %
3 Mo 6 Mo Since Inception 1 Yr 3 Yr Since Inception
Fund NAV – – 2.28% – – –
Closing Price – – 2.28% – – –
Index 4.51% – 4.51% – – –
*Fee waivers are contractual and in effect until 7/31/18
The performance data quoted represents past performance. Past performance does not guarantee future results. The investment return and principal value of an investment will fluctuate so that an investor's shares, when sold or redeemed, may be worth more or less than their original cost and current performance may be lower or higher than the performance quoted. For performance data current to the most recent month end, please visit www.kraneshares.com
Index returns are for illustrative purposes only. Index performance returns do not reflect any management fees, transaction costs or expenses. Indexes are unmanaged and one cannot invest directly in an index.
Fund Details As of 12/31/2017
Primary Exchange NYSE Arca
Cusip 500767850
Total Annual Fund Operating Expense
Gross: 0.80% Net: 0.79%*
Inception Date 10/13/2017
Distribution Frequency Semiannually
Index Name MSCI China IMI Environment 10/40 Index
Index Ticker Bloomberg: M1CXCIE
Number of Holdings (ex Cash) 35

18
1.China’s Ministry of Environmental Protection website, About MEP, History. Retrieved 8/11/2017.2.China’s Ministry of Environmental Protection website, About MEP, History. Retrieved 8/11/2017.3.The National People’s Congress of the PRC, Database of Laws and Regulations, “Law of the People’s Republic of China on Energy Conservation.” Retrieved 8/8/2017.4.China’s Ministry of Environmental Protection website, About MEP, History. Retrieved 8/11/2017.5. The Ministry of Finance and the Ministry of Housing and Urban-Rural Development, “The Implementation Advice on Accelerating the Applications of Building-Integrated Photovoltaics. March 23, 2009. Retrieved 8/11/2017.6. US China Clean Energy Research Center Website, About CERC. Retrieved 8/11/2017.7. International Energy Agency, Policies and Measures of China, Wind Power Technology Development 12th Five Year Special Planning. Oct. 31, 2013. Retrieved 8/11/2017.8. Ernst & Young, “China: Planning for an urban future”. Retrieved 8/11/2017.9. REN21 Renewables Global Status Report 2016. Retrieved 8/8/2017.10. Tech in Asia, “China’s government wants 5 million electric cars on the roads by 2020.” Feb. 19, 2015. Retrieved 8/11/2017.11. Central Committee of the Communist Party of China, “The 13th Five Year Plan for Economic and Social Development of the People’s Republic of China, 2016-2020”. Retrieved 8/11/2017.12. United Nations Framework Convention on Climate Change, Paris Agreement – Status of Ratification. Nov. 4, 2016. Retrieved 8/11/2017.13. New York Times, “China Aims to Spend at Least $360 Billion on Renewable Energy by 2020”. Jan. 5, 2017. Retrieved 8/11/2017.14. Supchina, “Electric vehicles now 1.2 percent of car market in China.” May 26, 2017. Retrieved 8/11/2017.
Slide 9 List of Citations:

19
Important Notes
Carefully consider the Funds’ investment objectives, risk factors, charges and expenses before investing. This and additional information can be found in the Funds‘ full and summary prospectus, which may be obtained by visiting www.kraneshares.com. Read the prospectus carefully before investing.ETF shares are not redeemable with the issuing fund other than in large Creation Unit aggregations. Instead, investors must buy or sell ETF Shares in the secondary market with the assistance of a stockbroker. In doing so, the investor may incur brokerage commissions and may pay more than net asset value (NAV) when buying and receive less than net asset value when selling. The NAV of the Fund’s shares is calculated each day the national securities exchanges are open for trading as of the close of regular trading on the New York Stock Exchange (“NYSE”), normally 4:00 P.M. Eastern time (the “NAV Calculation Time”). Shares are bought and sold at market price not NAV. Closing price returns are based on the midpoint of the bid/ask spread at 4:00 P.M. Eastern Time (when NAV is normally determined).
Investing involves risk, including possible loss of principal. There can be no assurance that a Fund will achieve its stated objectives. The Funds are subject to political, social or economic instability within China which may cause decline in value. Fluctuations in currency of foreign countries may have an adverse effect to domestic currency values. Emerging markets involve heightened risk related to the same factors as well as increase volatility and lower trading volume. Narrowly focused investments may be subject to higher volatility. The Fund may invest in derivatives, which are often more volatile than other investments and may magnify the Fund's gains or losses. The Fund is non-diversified.
Although the information provided in this document has been obtained from sources which Krane Funds Advisors, LLC believes to be reliable, it does not guarantee accuracy of such information and such information may be incomplete or condensed.
The KraneShares ETFs are distributed by SEI Investments Distribution Company (SIDCO), which is not affiliated with Krane Funds Advisors, LLC, the Investment Adviser for the Fund.

20
Although Krane Funds Advisors LLC and its affiliates (“Krane”) shall obtain data from sources that Krane considers reliable, all data contained herein is provided “as is” and Krane makes no representation or warranty of any kind, either express or implied, with respect to such data, the timeliness thereof, the results to be obtained by the use thereof or any other matter. Krane expressly disclaims any and all implied warranties, including without limitation, warranties of originality, accuracy, completeness, timeliness, non-infringement, merchantability and fitness for a particular purpose.
Forward-looking statements (including Krane’s opinions, expectations, beliefs, plans, objectives, assumptions, or projections regarding future events or future results) contained in this presentation are based on a variety of estimates and assumptions by Krane. These statements generally are identified by words such as “believes,” “expects,” “predicts,” “intends,” “projects,” “plans,” “estimates,” “aims,” “foresees,” “anticipates,” “targets,” “should,” “likely,” and similar expressions. These also include statements about the future, including what “will” happen, which reflect Krane’scurrent beliefs. These estimates and assumptions are inherently uncertain and are subject to numerous business, industry, market, regulatory, geo-political, competitive, and financial risks that are outside of Krane’s control. The inclusion of forward-looking statements herein should not be regarded as an indication that Krane considers forward-looking statements to be a reliable prediction of future events and forward-looking statements should not be relied upon as such. Neither Krane nor any of its representatives has made or makes any representation to any person regarding forward-looking statements and neither of them intends to update or otherwise revise such forward-looking statements to reflect circumstances existing after the date when made or to reflect the occurrence of future events, even in the event that any or all of the assumptions underlying such forward-looking statements are later shown to be in error. Any investment strategies discussed herein are as of the date of the writing of this presentation and may be changed, modified, or exited at any time without notice.
This material represents an assessment of the market environment at a specific point in time and is not intended to be a forecast of future events, or a guarantee of future results. This information should not be relied upon by the reader as research or investment advice regarding the funds or any stock in particular.