Embed Size (px)
Citation preview

Opportunities for the fermentation-based chemical industry
Dr. Willem Vaessen,
Chemicals Segment Leader, Deloitte NL
Hannover, 8th September 2016
An analysis of the market potential and competitiveness of North-West Europe
The full study is available on the website of Deloitte. The study was carried out by Deloitte and sponsored by Rabobank and other partners. Some selected data is used with the kind permission from LMC International
© 2015 Deloitte The Netherlands
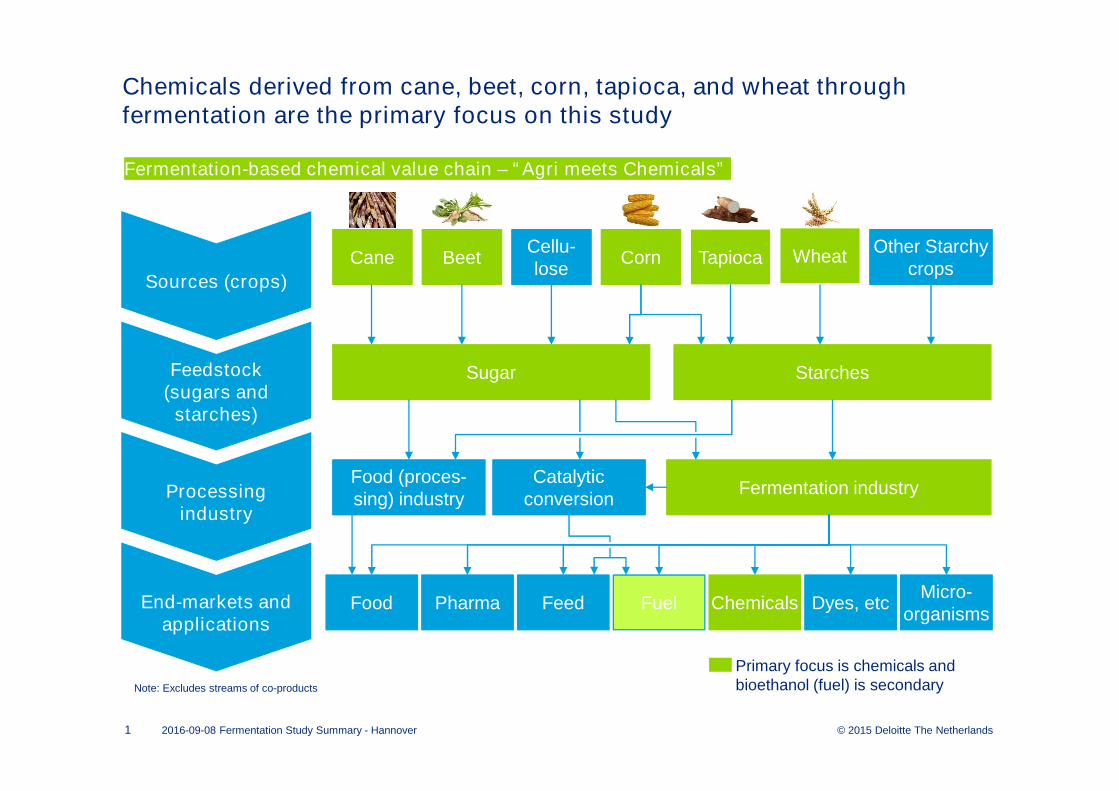
Chemicals derived from cane, beet, corn, tapioca, and wheat through fermentation are the primary focus on this study
1 2016-09-08 Fermentation Study Summary - Hannover
Note: Excludes streams of co-products
Primary focus is chemicals andbioethanol (fuel) is secondary
Sources (crops)
Feedstock(sugars and
starches)
Processingindustry
End-markets and applications
Cane Beet Corn TapiocaOther Starchy
cropsCellu-lose
Food (proces-sing) industry
Fermentation industry
Pharma Fuel ChemicalsFood Feed Dyes, etcMicro-
organisms
Catalytic conversion
Sugar Starches
Wheat
Fermentation-based chemical value chain – “Agri meets Chemicals”

© 2015 Deloitte The Netherlands
Crops and arable land use for fermentation-based chemicals will remain insignificant compared to food, feed and fuel while the added value is high
2 2016-09-08 Fermentation Study Summary - Hannover
Global fossil and biomass inputs and outputs (2013, in biomass equivalents)
• The fermentation-based chemical industry, while growing, is still small compared to petrochemicals• Oil and gas are mainly used for energy and only a small part for chemicals – ca. 3% and another 3% for the
energy required to make the chemicals• All figures are indicative; See separate table with detailed figures covering added value, arable land use
Agricultural produce:
~11 bn ton dry matter biomass
equivalents
Fossil materials (coal, oil &
gas):~35 bn ton dry mass biomass
equivalents
10
33 1.5
0.1
0.3
Sources
Usage
Note: All figures are indicative; Biofuel excludes wood; See separate table with detailed figures covering added value, arable land use Sources: FAO, IEA, EIA, Sanders & Bos (2013), Deloitte Analysis
Food and Feed Fuel (Energy) Chemicals
Fermentation-based
Products
0.4
0.1
© 2015 Deloitte The Netherlands
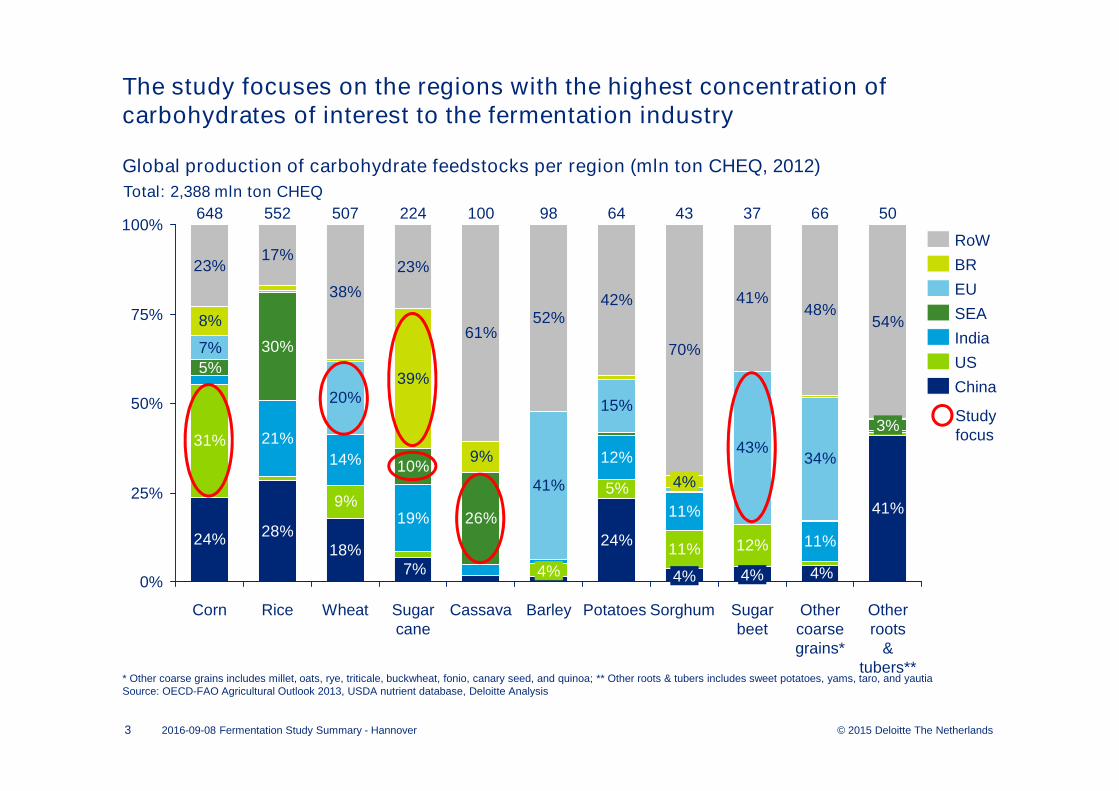
The study focuses on the regions with the highest concentration of carbohydrates of interest to the fermentation industry
Global production of carbohydrate feedstocks per region (mln ton CHEQ, 2012)
* Other coarse grains includes millet, oats, rye, triticale, buckwheat, fonio, canary seed, and quinoa; ** Other roots & tubers includes sweet potatoes, yams, taro, and yautiaSource: OECD-FAO Agricultural Outlook 2013, USDA nutrient database, Deloitte Analysis
3
Study focus
Total: 2,388 mln ton CHEQ
2016-09-08 Fermentation Study Summary - Hannover
24% 28%18%
24%
41%
31%
9%5%
11% 12%
21%
14%
19%
12%
11%
11%
7%
20%
41%
15%
43%34%
23%17%
38%
23%
61%52%
42%
70%
41%48%
54%
4%7%
26%
10%
30%
5%
9%
39%
8%
0%
25%
50%
75%
100%
Potatoes
98
4%
64100224
BarleyCassavaWheat
507
Sugar cane
4%
4%
43
Sugar beet
37
Sorghum Other roots
& tubers**
50
Other coarse grains*
66
4%
648 552
RiceCorn
3%
EU
SEA
BR
RoW
India
China
US
© 2015 Deloitte The Netherlands
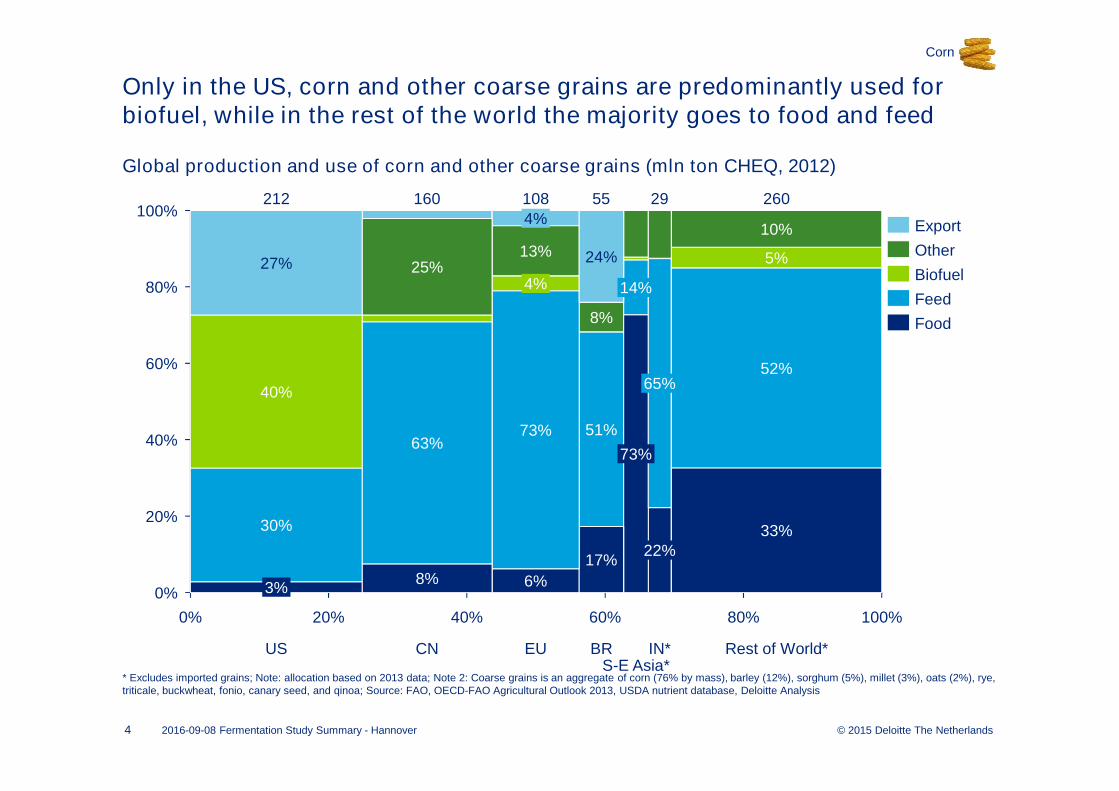
Only in the US, corn and other coarse grains are predominantly used for biofuel, while in the rest of the world the majority goes to food and feed
60% 80%0%
60%
40%
20%
20%
0%
100%
40% 100%
80%
40%
25%
212
US
27%
3%
63%
30%
5%
IN*
260
Rest of World*
10%
33%
52%65%
S-E Asia*
73%
14%
29
51%
55108
6%
73%
22%
8%
BR
8%
EU
4%160
24%
4%
13%
CN
17%
Global production and use of corn and other coarse grains (mln ton CHEQ, 2012)
* Excludes imported grains; Note: allocation based on 2013 data; Note 2: Coarse grains is an aggregate of corn (76% by mass), barley (12%), sorghum (5%), millet (3%), oats (2%), rye, triticale, buckwheat, fonio, canary seed, and qinoa; Source: FAO, OECD-FAO Agricultural Outlook 2013, USDA nutrient database, Deloitte Analysis
4
Food
Biofuel
Feed
Other
Export
2016-09-08 Fermentation Study Summary - Hannover
Corn
© 2015 Deloitte The Netherlands
80%
60%
40%
100%
20%0% 80%60%
0%
40% 100%
20%
4% 8%
44%
97%
56%
96%100%
92%
3%
PK Rest of world
7 42
MX
100%
BR
615
CNS-E AsiaIN
88 42 23
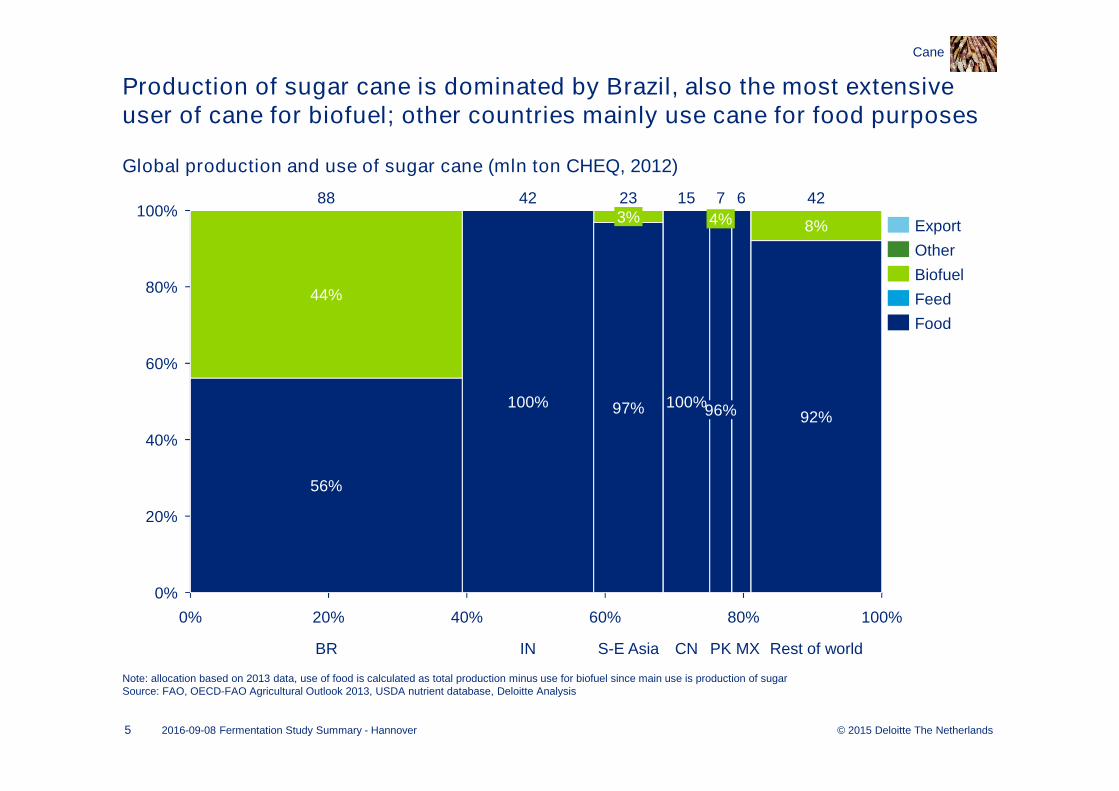
Note: allocation based on 2013 data, use of food is calculated as total production minus use for biofuel since main use is production of sugarSource: FAO, OECD-FAO Agricultural Outlook 2013, USDA nutrient database, Deloitte Analysis
5
Export
Other
Biofuel
Feed
Food
Production of sugar cane is dominated by Brazil, also the most extensive user of cane for biofuel; other countries mainly use cane for food purposes
Global production and use of sugar cane (mln ton CHEQ, 2012)
2016-09-08 Fermentation Study Summary - Hannover
Cane

© 2015 Deloitte The Netherlands
60%
40%
80%
20%
0%
100%80%60%40%20%0%
100% 4%
100%
RU
16 6
100%
24
100%
US
83%
UA
3
100%
13%
Rest of worldTREU
100%
6
Note: allocation based on 2013 data, use of food is calculated as total production minus use for biofuel and “other” since main use is production of sugarSource: FAO, OECD-FAO Agricultural Outlook 2013, USDA nutrient database, Suiker Unie, Deloitte Analysis
6
Export
Feed
Biofuel
Other
Food
The EU is the main producer of sugar beets and the only region where beets are directly used to produce biofuel
Global production and use of sugar beet (mln ton CHEQ, 2012)
2016-09-08 Fermentation Study Summary - Hannover
Beet

© 2015 Deloitte The Netherlands
Starch
Cleaning
Dry grinding
Wetting
Starch separation
Drying
Starch refining
Wheat
Corn, wheat, cane, cassava, and beet require different processes to produce sugar or starch
* Wet milling process ** Required for manually harvested cane only since a harvester machine cuts the cane during harvestingSource: Unica, Suiker Unie, Corn Refiners Association, Thai Tapioca Association, Overleggroep Producenten Natte Veevoeders
7
Carbohydrate production processes
HFCS, Starch
Cleaning
Steeping
Germ separation
Grinding
Syrup conversion
Starch separation
Syrup refining
Corn*
Washing
Cutting**
Crushing
Juice purification
Crystallisation
Evaporation
Centrifuging
Raw sugar
Sugar cane
Starch
Cleaning
Peeling & cutting roots
Rasping
Filtering
Settling & Drying
Centrifuging
Grinding
Cassava
Washing
Slicing
Juice extraction
Juice purification
Crystallisation
Evaporation
Centrifuging
White sugar
Sugar beet
2016-09-08 Fermentation Study Summary - Hannover
© 2015 Deloitte The Netherlands
1608050
1.000
60
500
13090
2.000
7040 14020 12010
1.500
30
2.500
0
0
110 150100Volume (mln ton w.s.e.)
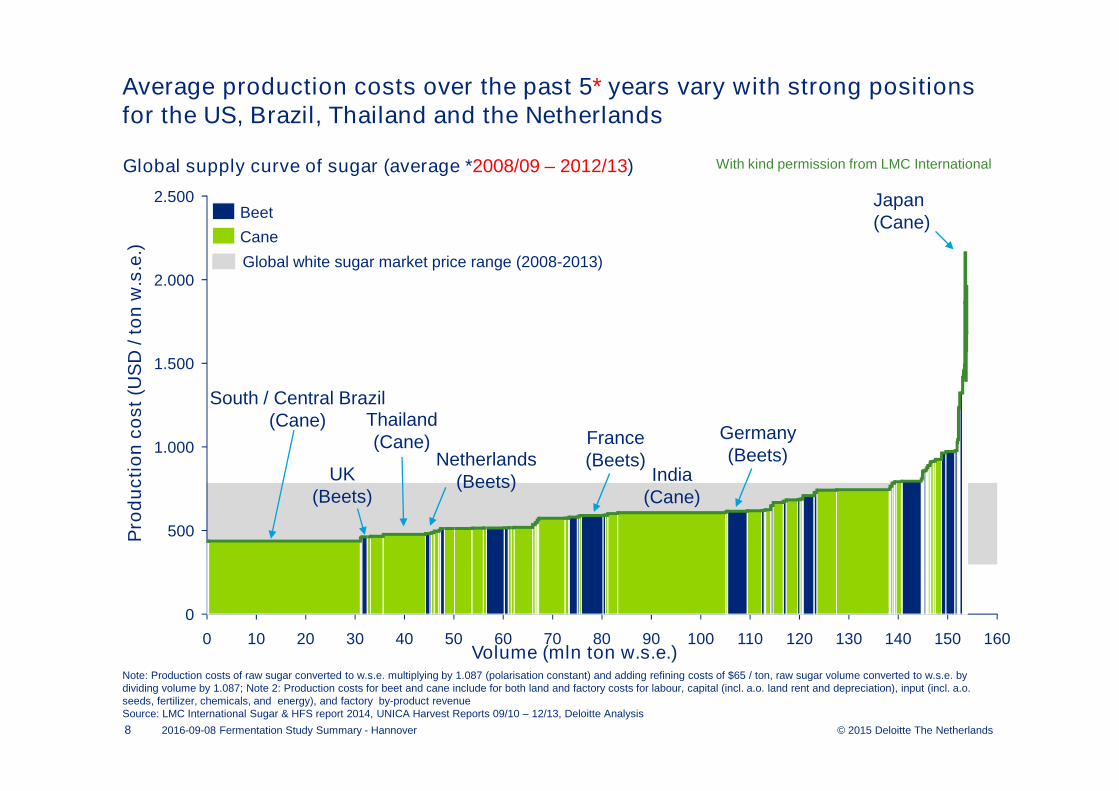
Note: Production costs of raw sugar converted to w.s.e. multiplying by 1.087 (polarisation constant) and adding refining costs of $65 / ton, raw sugar volume converted to w.s.e. by dividing volume by 1.087; Note 2: Production costs for beet and cane include for both land and factory costs for labour, capital (incl. a.o. land rent and depreciation), input (incl. a.o.seeds, fertilizer, chemicals, and energy), and factory by-product revenueSource: LMC International Sugar & HFS report 2014, UNICA Harvest Reports 09/10 – 12/13, Deloitte Analysis
Average production costs over the past 5* years vary with strong positions for the US, Brazil, Thailand and the Netherlands
Pro
du
cti
on
co
st
(US
D / t
on
w.s
.e.)
Global supply curve of sugar (average *2008/09 – 2012/13)
Thailand (Cane)
Netherlands (Beets)
Japan(Cane)
Cane
Beet
South / Central Brazil(Cane)
8
Global white sugar market price range (2008-2013)
India (Cane)
2016-09-08 Fermentation Study Summary - Hannover
UK(Beets)
France(Beets)
Germany(Beets)
With kind permission from LMC International
© 2015 Deloitte The Netherlands
20 17070 90
2.500
60
3.000
2.000
500
150130 140
0
100 12040
1.500
1.000
50 16011030 80100
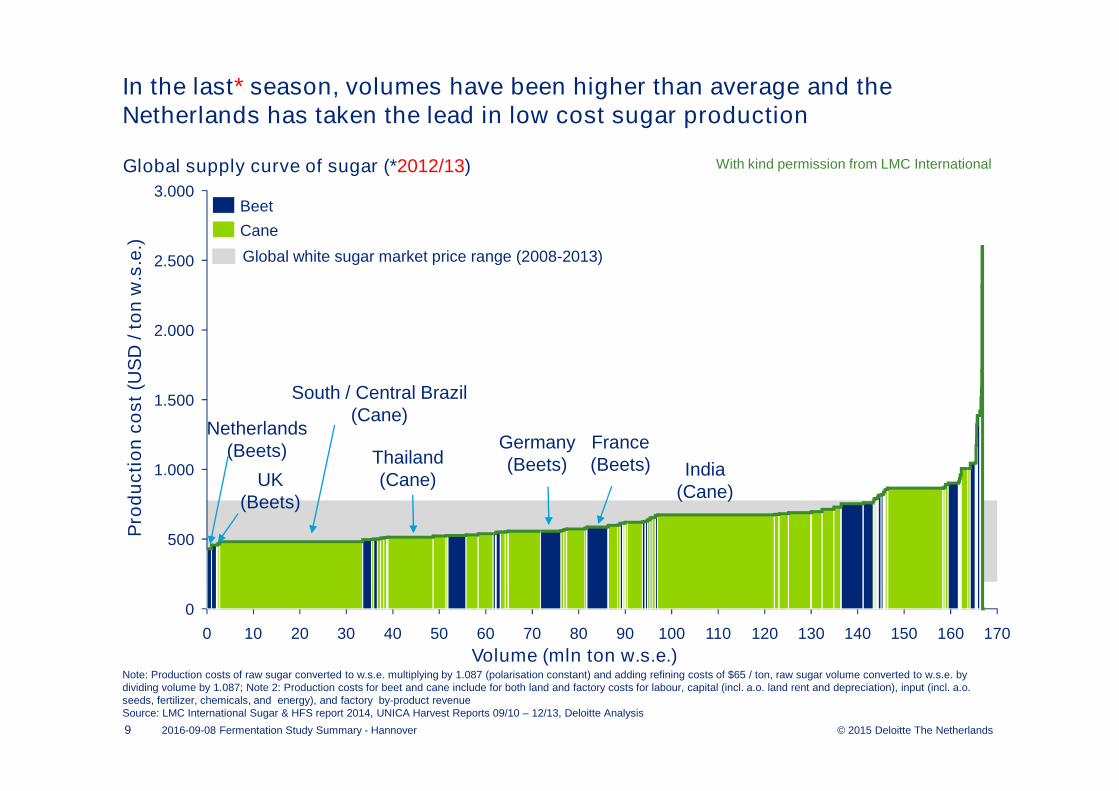
Volume (mln ton w.s.e.)Note: Production costs of raw sugar converted to w.s.e. multiplying by 1.087 (polarisation constant) and adding refining costs of $65 / ton, raw sugar volume converted to w.s.e. by dividing volume by 1.087; Note 2: Production costs for beet and cane include for both land and factory costs for labour, capital (incl. a.o. land rent and depreciation), input (incl. a.o.seeds, fertilizer, chemicals, and energy), and factory by-product revenueSource: LMC International Sugar & HFS report 2014, UNICA Harvest Reports 09/10 – 12/13, Deloitte Analysis
In the last* season, volumes have been higher than average and the Netherlands has taken the lead in low cost sugar production
Pro
du
cti
on
co
st
(US
D / t
on
w.s
.e.)
Global supply curve of sugar (*2012/13)
Thailand (Cane)
Netherlands (Beets)
South / Central Brazil(Cane)
9
India (Cane)
Cane
Beet
Global white sugar market price range (2008-2013)
2016-09-08 Fermentation Study Summary - Hannover
UK(Beets)
France(Beets)
Germany(Beets)
With kind permission from LMC International
© 2015 Deloitte The Netherlands
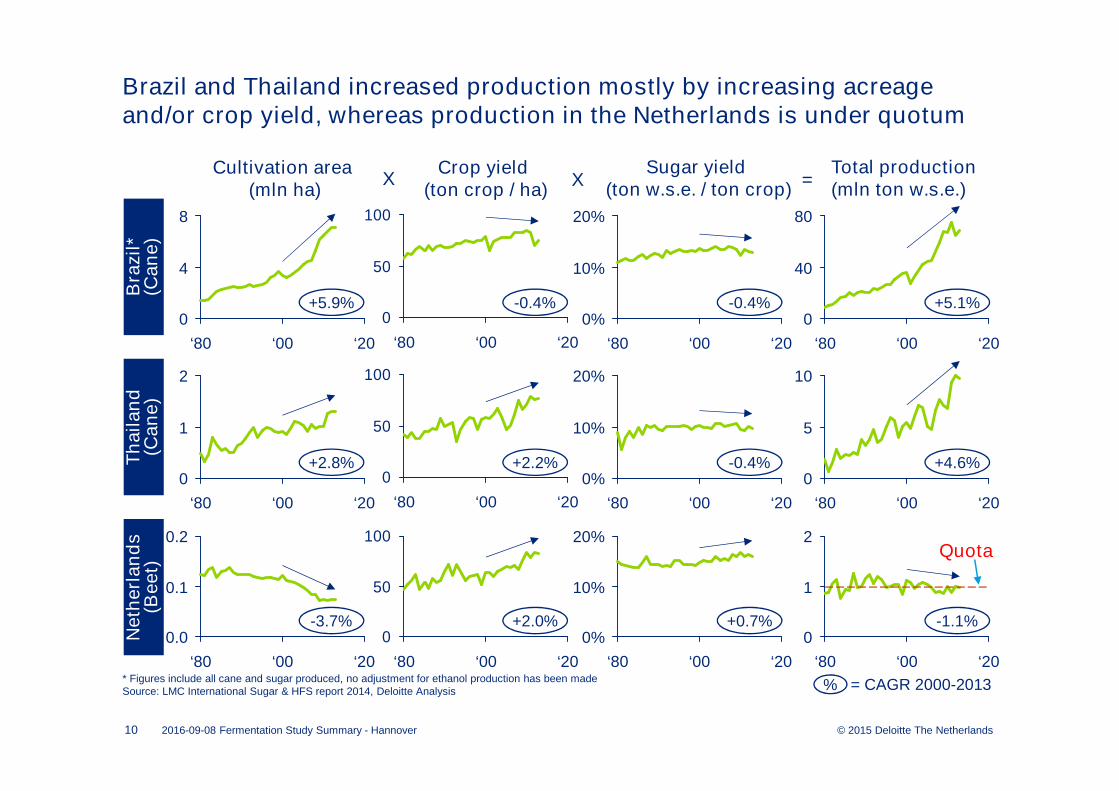
Brazil and Thailand increased production mostly by increasing acreage and/or crop yield, whereas production in the Netherlands is under quotum
10
* Figures include all cane and sugar produced, no adjustment for ethanol production has been madeSource: LMC International Sugar & HFS report 2014, Deloitte Analysis
‘00‘80
0
‘20
8
4
Cultivation area(mln ha)
Crop yield (ton crop / ha)
Total production (mln ton w.s.e.)
Sugar yield (ton w.s.e. / ton crop)
Bra
zil
* (C
an
e)
Th
ail
an
d
(Ca
ne)
Neth
erl
an
ds
(Beet)
0
50
100
‘80 ‘00 ‘20
0%
‘20‘00
20%
10%
‘80 ‘80
80
40
0
‘20‘00
X X =
2
1
0
‘20‘00‘80
0
50
100
‘20‘80 ‘00
10%
0%
20%
‘80 ‘20‘00 ‘80 ‘00
10
5
0
‘20
0.2
0.1
0.0
‘20‘80 ‘00
0
50
100
‘20‘00‘80
20%
‘20
10%
0%
‘00‘80 ‘00‘80
1
‘20
0
2
+5.9%
+2.8%
-3.7%
-0.4%
+2.2%
+2.0%
% = CAGR 2000-2013
-0.4%
-0.4%
+0.7%
+5.1%
+4.6%
-1.1%
2016-09-08 Fermentation Study Summary - Hannover
Quota

© 2015 Deloitte The Netherlands
481
0
250
500
750
1980 1985 1990 1995 2000 2005 2010 2015
+6.0%
281
0
250
500
750
1980 1985 1990 1995 2000 2005 2010 2015
+1.5%
429
513
0
250
500
750
1980 1985 1990 1995 2000 2005 2010 2015
+3.7%
Since 2000 the production costs in Brazil have increased significantly more than in the Netherlands, resulting in a higher price level
11
Production costs (USD / ton w.s.e., 1980-2013)
Note: cost levels same as previously definedSource: LMC International Sugar & HFS report 2014, Deloitte Analysis
Brazil – Cane Netherlands – Beets
Thailand – Cane
% = CAGR 2000-2013
TotalCost
Crop Cost
TotalCost
Crop Cost
TotalCost
Crop Cost
575
308
0
250
500
750
1980 1985 1990 1995 2000 2005 2010 2015
+1.5%EU – Beets
TotalCost
Crop Cost
2016-09-08 Fermentation Study Summary - Hannover
149
267
© 2015 Deloitte The Netherlands
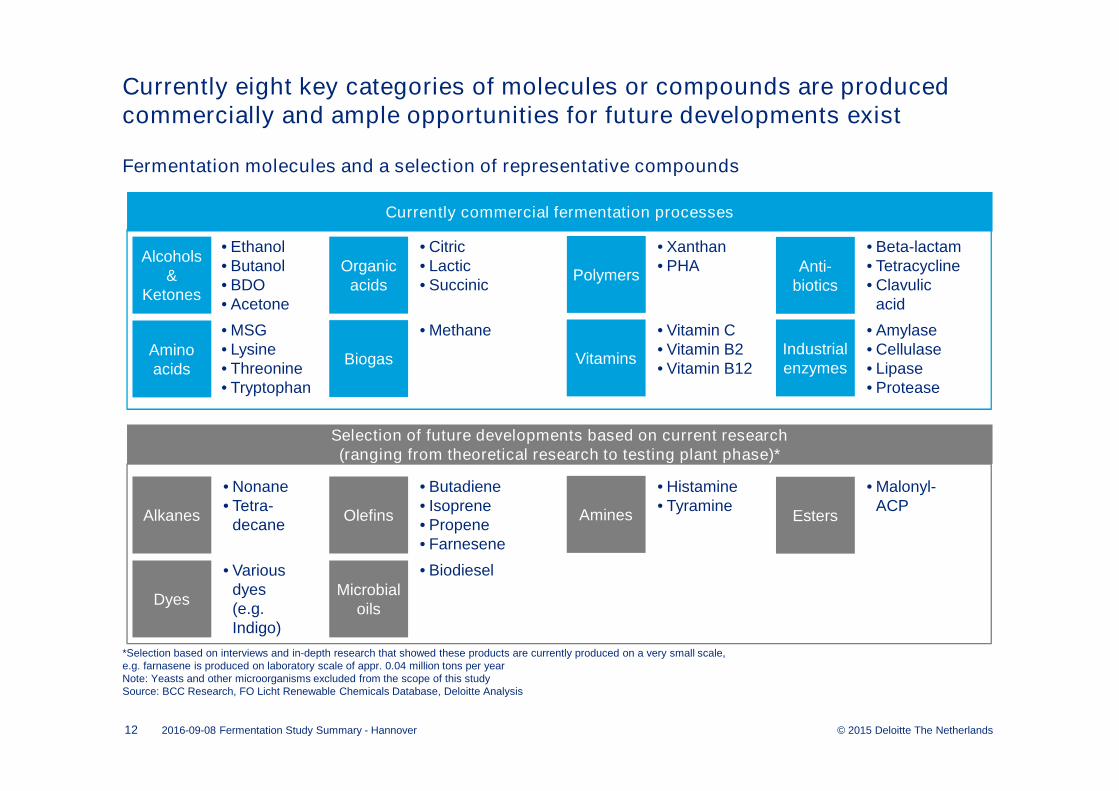
Currently eight key categories of molecules or compounds are produced commercially and ample opportunities for future developments exist
*Selection based on interviews and in-depth research that showed these products are currently produced on a very small scale, e.g. farnasene is produced on laboratory scale of appr. 0.04 million tons per yearNote: Yeasts and other microorganisms excluded from the scope of this studySource: BCC Research, FO Licht Renewable Chemicals Database, Deloitte Analysis
• Ethanol• Butanol• BDO• Acetone
Amino acids
Organic acids
BiogasIndustrial enzymes
Polymers
Vitamins
Anti-biotics
Alcohols &
Ketones
12
Currently commercial fermentation processes
Fermentation molecules and a selection of representative compounds
• MSG• Lysine• Threonine• Tryptophan
• Citric• Lactic• Succinic
• Methane
• Xanthan• PHA
• Vitamin C• Vitamin B2• Vitamin B12
• Beta-lactam• Tetracycline• Clavulic
acid
• Amylase• Cellulase• Lipase• Protease
Selection of future developments based on current research (ranging from theoretical research to testing plant phase)*
• Nonane• Tetra-
decaneOlefins Amines EstersAlkanes
• Butadiene• Isoprene• Propene• Farnesene
• Histamine• Tyramine
• Malonyl-ACP
Dyes
• Various dyes (e.g. Indigo)
Microbial oils
• Biodiesel
2016-09-08 Fermentation Study Summary - Hannover
© 2015 Deloitte The Netherlands
4.000
0
5.000
200160120
2.500
140110
4.500
1809080 130 1701007030
22.500
5040
3.500
2.000
500
1.500
60 2100 10 20 190
3.000
150
1.000
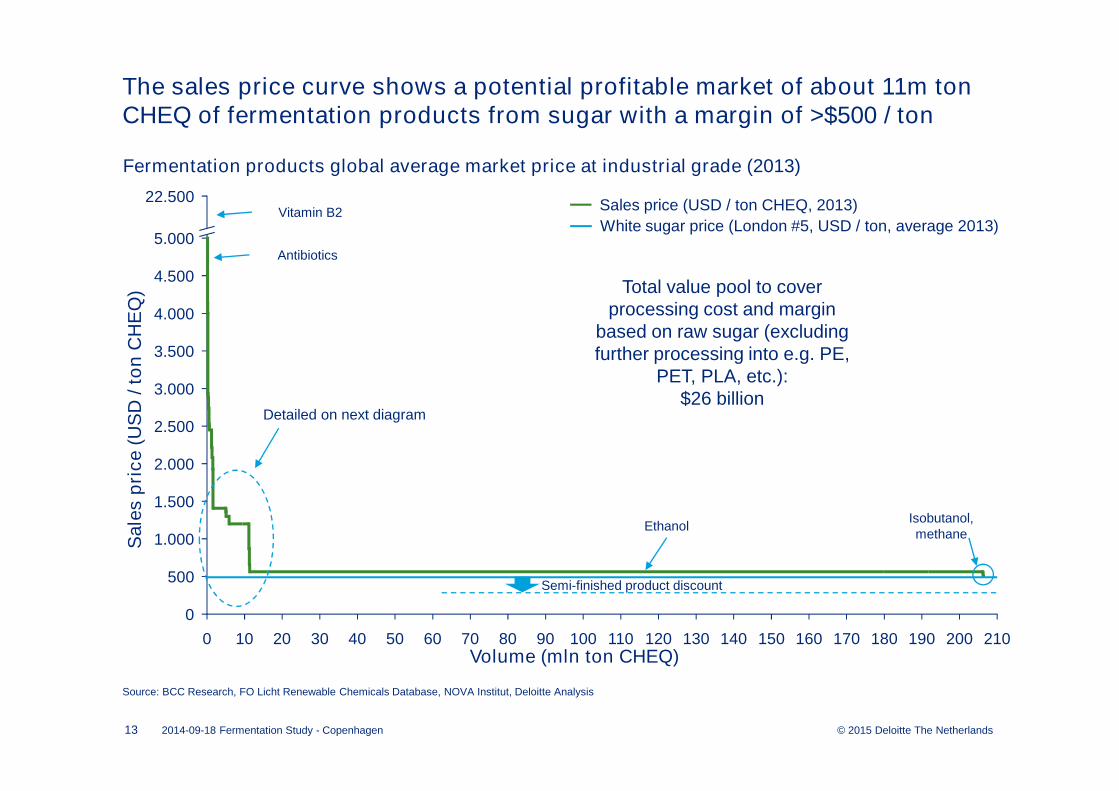
The sales price curve shows a potential profitable market of about 11m ton CHEQ of fermentation products from sugar with a margin of >$500 / ton
Sale
s p
ric
e (
US
D /
to
n C
HE
Q)
Fermentation products global average market price at industrial grade (2013)
2014-09-18 Fermentation Study - Copenhagen13
Ethanol
Vitamin B2
Antibiotics
Sales price (USD / ton CHEQ, 2013)
White sugar price (London #5, USD / ton, average 2013)
Detailed on next diagram
Total value pool to cover processing cost and margin
based on raw sugar (excluding further processing into e.g. PE,
PET, PLA, etc.):$26 billion
Isobutanol, methane
Semi-finished product discount
Volume (mln ton CHEQ)
Source: BCC Research, FO Licht Renewable Chemicals Database, NOVA Institut, Deloitte Analysis

© 2015 Deloitte The Netherlands
12
0
111098732 4
500
1.000
1
4.500
1.500
2.000
5
2.500
0
3.000
5.000
6
3.500
4.000
22.500
Volume (mln ton CHEQ)
The majority of the volume of this potential market (89%) is currently in five products, namely, lysine, MSG, citric acid, lactic acid, and glutamic acid
14 2014-09-18 Fermentation Study - Copenhagen
Sale
s p
ric
e (
US
D /
to
n C
HE
Q)
Vitamin B2
Antibiotics
Sales price (USD / ton CHEQ, 2013)
White sugar price (London #5, USD / ton, average 2013)
Glutamic acid
MSGCitric acid
Fermentation products global average market price at industrial grade (2013)
Total value pool to cover processing cost and margin
based on raw sugar (excluding further processing into e.g. PE,
PET, PLA, etc.):$12 billion
PDO, Threonine, Itaconic acid
Vitamin B12, Iso-ascorbic acid, Xanthan, Vitamin C, Succinic acid, PHA
Tryptophan, enzymes
Gluconic acid, Acetone, N-butanol
LysineFatty alcohols
BDO
Source: BCC Research, FO Licht Renewable Chemicals Database, NOVA Institut, Deloitte Analysis
Lactic acid
© 2015 Deloitte The Netherlands
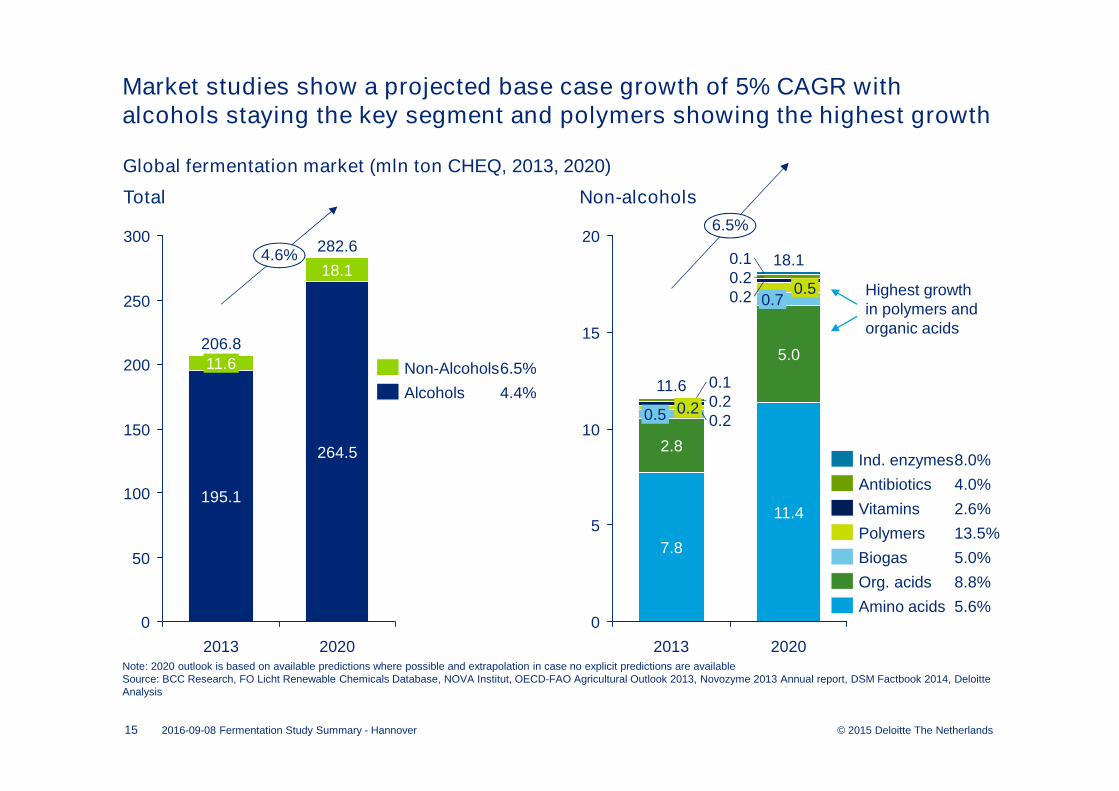
Market studies show a projected base case growth of 5% CAGR with alcohols staying the key segment and polymers showing the highest growth
15
300
250
50
100
200
150
0
4.6%282.6
206.8
2013 2020
195.1
11.6
18.1
264.5
Global fermentation market (mln ton CHEQ, 2013, 2020)
20
15
10
5
0
0.2
0.1
7.8
0.1
0.5 0.2 0.2
2013
11.6
2.8
6.5%
2020
18.1
11.4
5.0
0.70.5
0.20.2
Amino acids 5.6%
Org. acids 8.8%
Biogas 5.0%
Polymers 13.5%
Vitamins 2.6%
Antibiotics 4.0%
Ind. enzymes8.0%
Alcohols 4.4%
Non-Alcohols6.5%
Note: 2020 outlook is based on available predictions where possible and extrapolation in case no explicit predictions are availableSource: BCC Research, FO Licht Renewable Chemicals Database, NOVA Institut, OECD-FAO Agricultural Outlook 2013, Novozyme 2013 Annual report, DSM Factbook 2014, Deloitte Analysis
Total Non-alcohols
2016-09-08 Fermentation Study Summary - Hannover
Highest growth in polymers and organic acids
© 2015 Deloitte The Netherlands
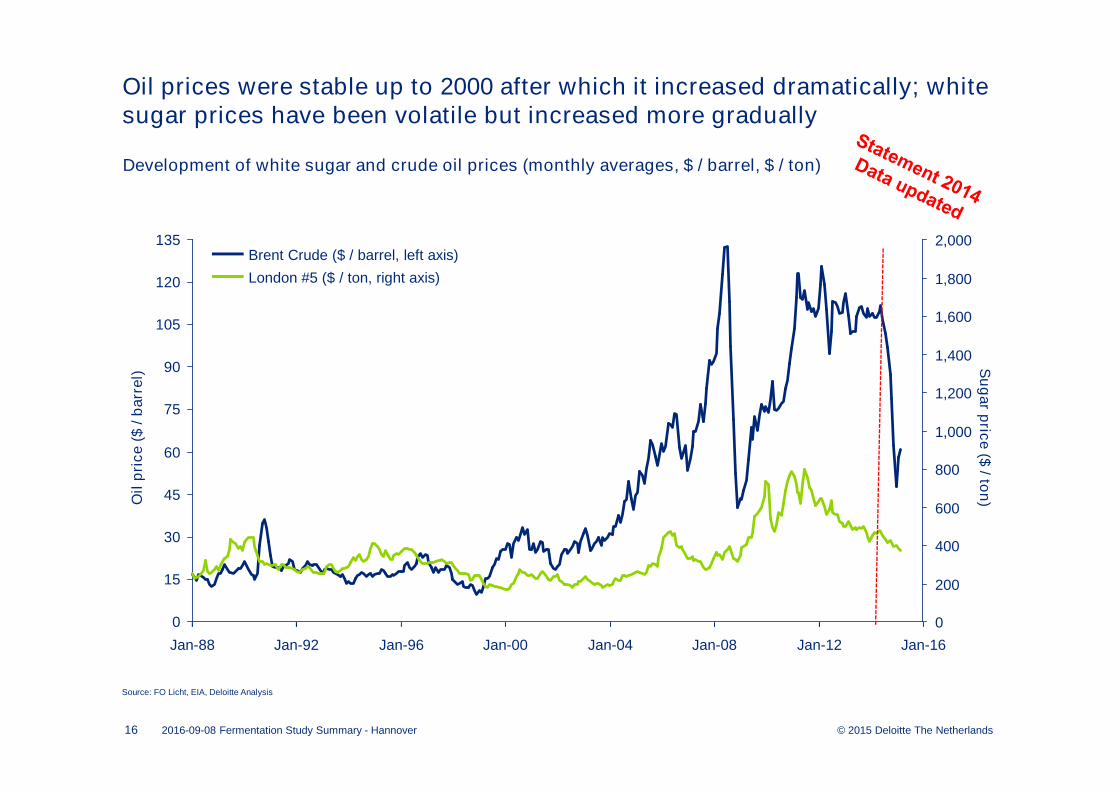
Oil prices were stable up to 2000 after which it increased dramatically; whitesugar prices have been volatile but increased more gradually
16
Oil
pri
ce (
$ /
barr
el)
Source: FO Licht, EIA, Deloitte Analysis
0
15
30
45
60
75
90
105
120
135
1,600
Jan-92Jan-88 Jan-96 Jan-00
1,400
1,800
Jan-12Jan-08Jan-04 Jan-16
2,000
800
400
600
200
0
1,000
1,200
Development of white sugar and crude oil prices (monthly averages, $ / barrel, $ / ton)
Su
gar p
rice ($
/ ton
)
London #5 ($ / ton, right axis)
Brent Crude ($ / barrel, left axis)
2016-09-08 Fermentation Study Summary - Hannover

© 2015 Deloitte The Netherlands
As a result, in the past fifteen years the sugar price decreased relative tocrude oil, creating an opportunity for sugar in the biobased economy
17
Rati
o L
on
do
n #
5 /
Bre
nt
cru
de (
US
D/G
J /
US
D/G
J)
Source: FO Licht, EIA, Deloitte Analysis
0
3
6
9
12
15
Jan-00 Jan-04Jan-96 Jan-16Jan-08Jan-92 Jan-12Jan-88
Ratio London #5 (USD/GJ) / Brent Crude (USD/GJ)• Stable oil prices• Volatile, harvest dependent sugar prices
• Sharply increasing oil prices• Moderately increasing sugar prices
Development of price ratio of white sugar over crude oil (monthly averages, USD/GJ / USD/GJ )
Recent drop in oil prices
2016-09-08 Fermentation Study Summary - Hannover
?
© 2015 Deloitte The Netherlands
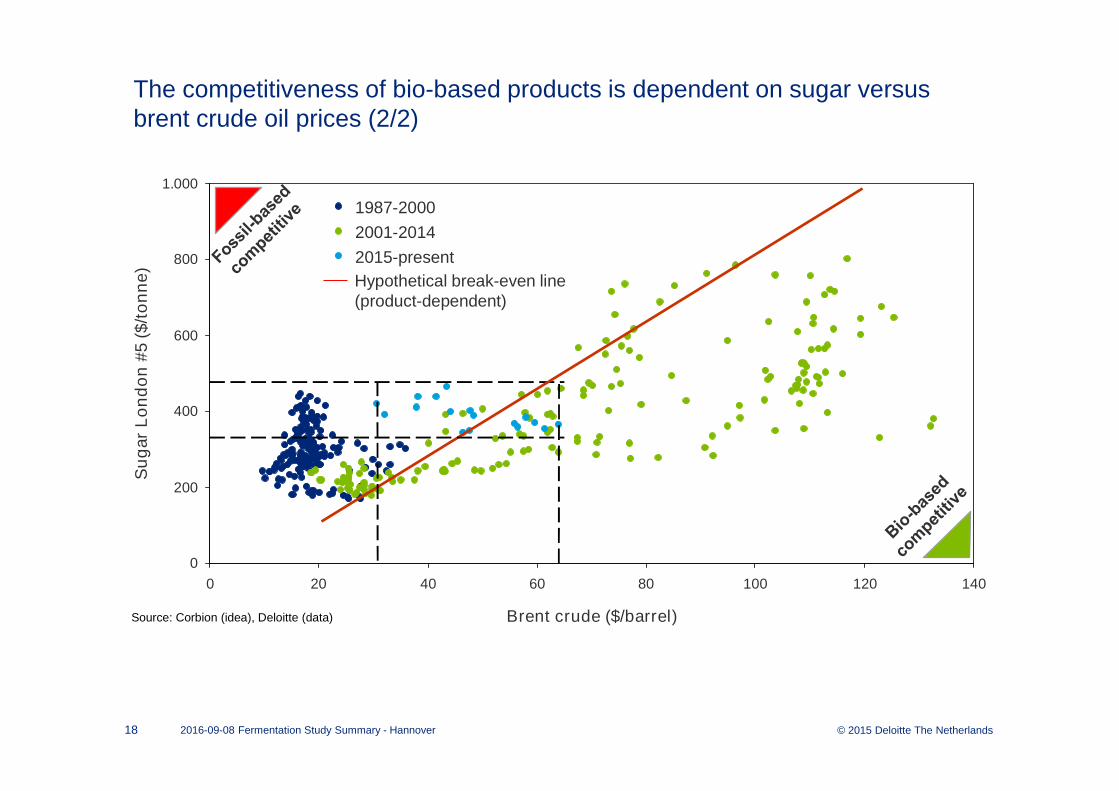
The competitiveness of bio-based products is dependent on sugar versus brent crude oil prices (2/2)
2016-09-08 Fermentation Study Summary - Hannover18
0
200
400
600
800
1.000
0 20 40 60 80 100 120 140
Su
gar
Lo
nd
on
#5 (
$/t
on
ne
)
Brent crude ($/barrel)
1987-2000
2001-2014
2015-present
Hypothetical break-even line (product-dependent)
Source: Corbion (idea), Deloitte (data)
© 2015 Deloitte The Netherlands
In a nutshell… a positive picture for NW-EU
1. NW-EU and sugar beets have surprisingly strong competitive position
2. Due to de-regulation additional volumes will come on the market in 2017
3. The current market for biobased chemicals is still relatively small, but expected to grow with 6.5% CAGR until 2020
4. Biobased chemicals are an attractive market with high economic value-add ($12 billion / annum) in 2013
5. Each product needs it own business case
6. Land use for functional molecules will remain insignificant
7. Sugar has become cheaper compared to oil … until 20142016-09-08 Fermentation Study Summary - Hannover19

© 2015 Deloitte The Netherlands
Deloitte refers to one or more of Deloitte Touche Tohmatsu Limited, a UK private company limited by guarantee, and its network of member firms, each of which is a legally separate and independent entity. Please see www.deloitte.com/about for a detailed description of the legal structure of Deloitte Touche Tohmatsu Limited and its member firms.
Deloitte provides audit, tax, consulting, and financial advisory services to public and private clients spanning multiple industries. With a globally connected network of member firms in more than 150 countries and territories, Deloitte brings world-class capabilities and high-quality service to clients, delivering the insights they need to address their most complex business challenges. Deloitte’s more than 200,000 professionals are committed to becoming the standard of excellence.
This communication contains general information only, and none of Deloitte Touche Tohmatsu Limited, its member firms, or their related entities (collectively, the “Deloitte network”) is, by means of this communication, rendering professional advice or services. No entity in the Deloitte network shall be responsible for any loss whatsoever sustained by any person who relies on this communication.
.
20 2016-09-08 Fermentation Study Summary - Hannover