Embed Size (px)
Citation preview
Opportunities for solar energy and energy storage
in a post-subsidy, Renewables 2.0 world
Solar Energy Workshop, Kuwait
December 2018

Agenda
2
• Introduction to Apricum
• The rise of Renewables 2.0
• An increasing role for energy storage
• Opportunities for solar and energy storage in Renewables 2.0
Appendix A
• Energy storage technologies

3
Apricum’s exclusive sector focus: solar & wind, water,
waste, energy storage, green mobility and digital energy.
Solar & wind
• PV / CSP
• Onshore / Offshore wind
• Solar & wind materials
Our expertise spans the entire value chains in these industries. We have a comprehensive overview of
the market dynamics, drivers and economics, an intimate understanding of financing practices as well
as a deep engineering-level understanding of the technical issues at play.
Increasingly, projects will combine elements of the below sectors – Apricum’s strength is in projects that
provide integrated solutions.
Energy storage
• Batteries
• Power-to-gas/X
• Storage materials
Water
• Desalination
• Water infrastructure
• Hydro power
Green mobility
• E-mobility
• Alternative fuels
• Charging infrastructure
Digital energy
• Energy management systems
• Integrated building energy systems
• Virtual power plants
Waste
• Waste water treatment
• Waste to energy
• Municipal solid waste management

Apricum Project advisory practice.
4
Apricum’s advisory services across the capital structure of projects and platform vehicles
Client situation Apricum services
Platform vehicle
raising capital at
HoldCo level or
for projects
P3
HoldCo/
Platform
P2P1
Government/
Procuring agency
• M&A
• Capital raising (equity + mezz capital)
• Joint venture/partner search
• Corporate financing
• Project M&A
• Capital raising (equity + mezz capital)
• Bid advisory
• Project finance
• Refinancing
• Policy, institutional framework
• Project development facility
• Procurement
• Tender management
Developers
bidding/raising
capital for
projects
P3 P3
Government
agencies
procuring
projects

Agenda
5
• Introduction to Apricum
• The rise of Renewables 2.0
• An increasing role for energy storage
• Opportunities for solar and energy storage in Renewables 2.0
Appendix A
• Energy storage technologies

There has been a significant increase in renewables
installed capacity globally
V
6
386
952
1.835
-
200
400
600
800
1.000
1.200
1.400
1.600
1.800
2.000
2012 2013 2014 2015 2016 2017 2018 2019 2020 2021 2022
Source: Apricum solar and wind market models, Q2/2018
Capital
allocations
Competition
WACCs
RE prices
( FITs, auctions,
≈ grid parity)
Price of
equipment
RE capacity
(absolute &
relative)
Virtuous cycle of renewables investment
has driven down delivered cost of energy
Global installed wind and solar capacity (GW)

Renewables increasingly cost competitive
7
The LCOE of renewable energy in comparison to conventional energy technologies in
selected countries (USD/MWh)
0
50
100
150
200
250
GCC AUS DE IDN ZA
US
D/M
Wh
Oil GT Coal CCGT Onshore wind Utility-scale PV CSP
GCC= Gulf Cooperation Council countries; AUS = Australia; DE = Germany; IDN = Indonesia; ZA = South Africa; GT= Gas turbine; CCGT = combined
cycle gas turbine; PV = photovoltaic; CSP = concentrated solar power
Source: BNEF (2017), IRENA (2016, 2018), Fraunhofer Institut (2018), IEA (2016), Businesswire (2017), DEWA (2018), SCIELO (2016),

Share of renewables capacity, penetration of renewables
rising
8
Share of renewable energy in total power sector generation investment, global installed
capacity and annual installed capacity (%)
Source: Global Status Reports (2013, 2014, 2015, 2016, 2017, 2018), International Energy Agency (2017, 2018)
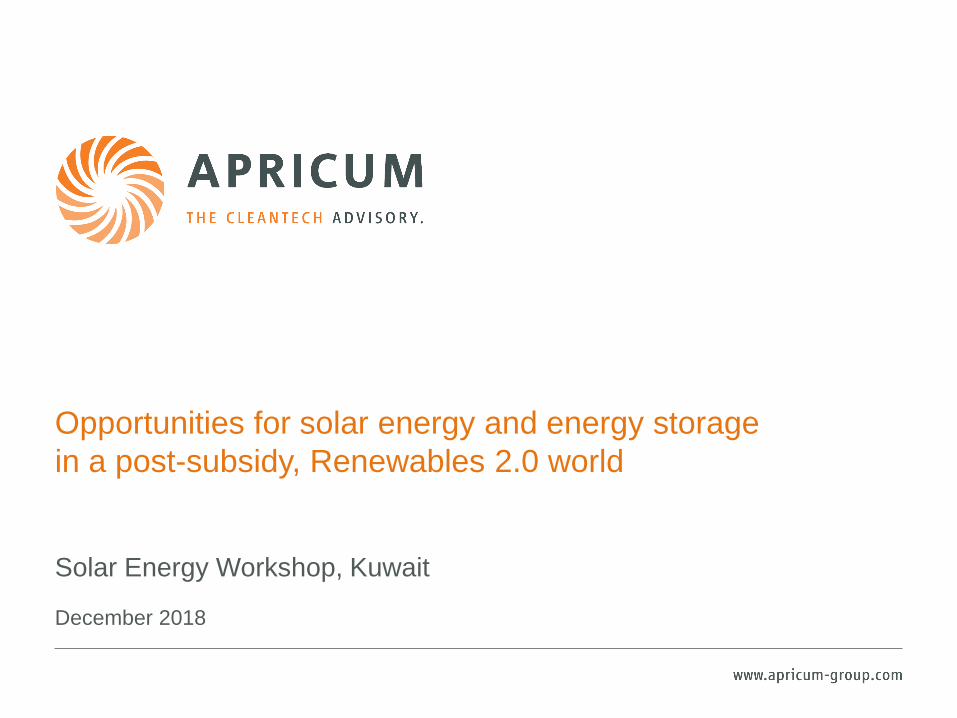
Renewables 1.0 vs Renewables 2.0
Renewables 1.0
• Single buyer of generation
• Typically through state-sponsored
off-take agreements
• Revenue certainty (price and volume)
• Initially through FIT and other
subsidy / promotional schemes
• More recently a shift to competitive
auctions
• Stable return to capital
Renewables 2.0
• Move away from state-sponsored
procurement – focus on market and
private sector mechanisms
• Potentially multiple (stacked) revenue
streams
• Less certainty of revenue, including
possible merchant risk exposure
• Greater revenue and technical
complexity
• Greater variability in cash flow, returns
9
ProjectState
BuyerProject
Corp
Buyer
Corp
Buyer
PPA or
RE regulation
Corp
PPA
Market
pricing Market

Agenda
10
• Introduction to Apricum
• The rise of Renewables 2.0
• An increasing role for energy storage
• Opportunities for solar and energy storage in Renewables 2.0
Appendix A
• Energy storage technologies

Dramatic demand growth expected for energy storage.
11
Market stationary battery storage systems [GWh]1
20222015
48.8
36.5
0.7
20202016 2017 2018 2019 2021
6.8
2023 2024
15.4
2025
1.23.2
9.411.4
19.8
27.1
“The global energy storage
market will double six times
between 2016 and 2030”
(Nov, 2017)
“The global supply of
batteries for electric cars and
energy storage is expected
to more than double by
2020” (Jan, 2018)
Estimated investment2
of ~USD 1.7B
Estimated
investment2 of
~USD 0.7B
Estimated investment2
of ~USD 4.8BCAGR ’15–’25
46%
Source: Apricum stationary battery market forecast Q1/2018 in cooperation with Cairn ERA; 1) Excluding uninterruptable power supply; 2) AC
installed system

Supply Demand Demand Supply
Central (in front of the meter) Distributed (behind the meter)
12
Renewable energy
(RE) park
Fossil
power plant
End customers
(industry, commercial,
residential, public)
Self
generationSupply shifting (RE time shift)
Supply shaping (RE firming/ramp control,
RE smoothing, fossil generation firming1)
Ancillary services (freq./volt. control, black start1)
Capacity reserve
Supply shaping
(Grid congestion
relief)
Ancillary services
(frequency/
voltage control)
Capacity reserve
Demand shaping
(T&D deferral/
avoidance)
Quality/reliability
- IFTM (microgrid
islanding)
Demand shifting (ToU optimi-
zation, demand response)
Demand shaping (demand
charge reduction)
Quality/reliability – BTM
(backup, UPS)
Ancillary services
(frequency/voltage control)
Capacity reserve
Supply shifting (RE self-
consumption optimization)
Supply shaping (fossil
generation firming)
Ancillary services
(frequency/voltage control,
spinning res., black start)
Capacity reserve
Demand expected to address a range of energy storage
use cases, applied across all facets of the energy system.
Overview of energy storage use cases, across centralized and distributed generation
Diesel
genset
1) Use cases co-located with fossil generation

Demand alone is not enough – energy storage needs to be
competitive and relies on suitable frameworks.
13
Drivers of energy storage market
2. Framework in place to…
• …allow for bankable
energy storage projects
• …remove barriers for
storage to participate in
markets
1. Demand for…
• …increased flexibility in
the power system
• …replacements/
expansion of grid and
generation infrastructure
• …optimization of
(combined) sources of
power supply
• …adequate quality and
reliability of power
supply
3. Competitiveness on…
• …CAPEX
• …lifetime costs
• …durability
Source: Apricum analysis
a
b
c
d
1
3
2
Market for
energy storage

Agenda
14
• Introduction to Apricum
• The rise of Renewables 2.0
• An increasing role for energy storage
• Opportunities for solar and energy storage in Renewables 2.0
Appendix A
• Energy storage technologies
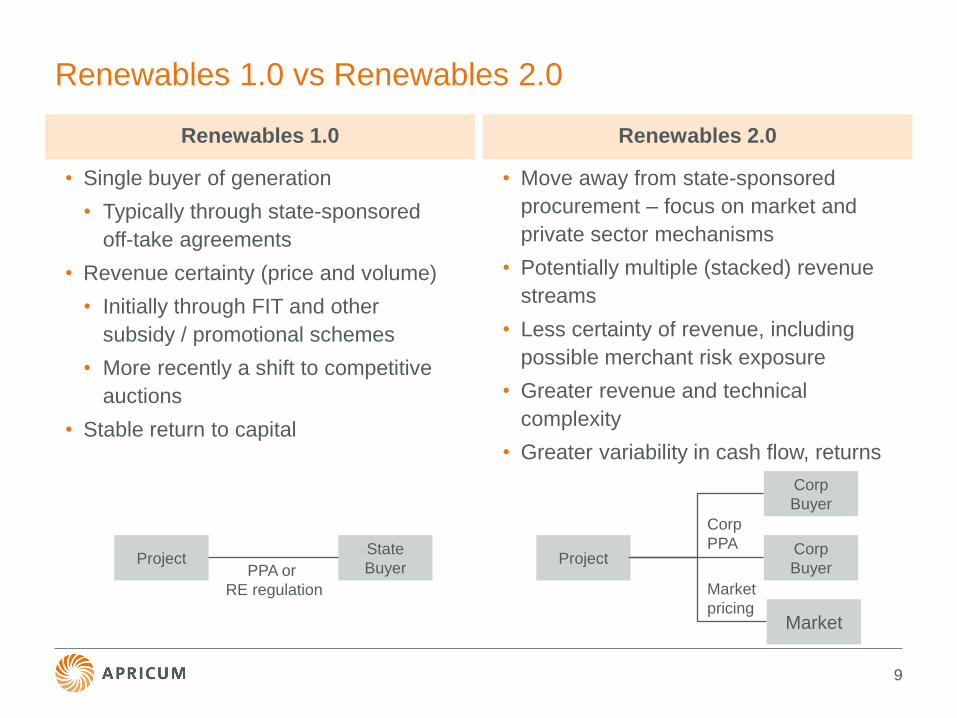
Opportunities in the post-subsidy, Renewables 2.0 world
• Expanding interest in Corporate PPAs as companies contract directly for renewable
energy supply
• Driven by sustainability commitments and desire to manage long-term energy supply
costs
• Focus to date on developed regions (US, Europe), but increasing interest in other regions
• Growing importance of distributed generation
• Especially in light of rising cost (and, in some cases, lack) of T&D infrastructure
• Hybrid projects are also gaining traction
• Coupling renewables (wind and solar) with energy storage
• RE + ES also in conjunction with conventional energy
• Regulatory frameworks and financing solutions will need to evolve and adapt to the
changing Renewables 2.0 world
15
The increasing competitiveness of renewables and energy storage opens new
opportunities in the post subsidy, Renewables 2.0 world

Agenda
16
• Introduction to Apricum
• The rise of Renewables 2.0
• An increasing role for energy storage
• Opportunities for solar and energy storage in Renewables 2.0
Appendix A
• Energy storage technologies

(Electro)-chemical
Power-to-X
Lithium-
based
Redox-
Flow
Sodium
batteries1
Latent
heat
Lead-acid
(PbA)
Thermo-
chemical
Various energy storage technologies exist – but which is the
right one for the targeted use case?
17
Overview energy storage technologies
Sensible
heat
Others2
Double layer
capacitors
Supercon-
ducting coils
Pumped
hydro
Pressured
air
Flywheel
Mechani-
cal springs
Energy storage technologies
Batteries
Mechanical
Source: Apricum analysis; 1) Includes NaS, NaNiCl and Sodium-ion batteries; 2) E.g., Zinc-Air, liquid metal batteries, NiMH, NiCd; 3) Lithium
Cobalt Oxide; 4) Lithium Nickel Manganese Cobalt Oxide; 5) Lithium Nickel Cobalt Aluminum Oxide; 6) Lithium Iron Phosphate; 7) Lithium
Manganese Oxide; 8) Lithium Titanate; 9) Including Li-metal, Li-S and Li-air batteries
Thermal
NCA5 LFP6 LMO7 LTO8
Other
Lithium-
based9
LCO3 NMC4
98% of battery storage market (2018)

Contact:
Duncan Ritchie,
Partner
Apricum GmbH
Spittelmarkt 12 | 10117 Berlin | Germany
T. +49.30.308 77 62 - 0 | F. +49.30.308 77 62 - 25
www.apricum-group.com